Embed Size (px)
Citation preview
r r
INDEPENDENT RESEARCH UPDATE Temenos Group
4th February 2013 The end to the winter in sight IT Software & Services Fair Value CHF24 vs. CHF16 (price CHF18.10) BUY vs. SELL
Bloomberg TEMN SW Reuters TEMN.SW 12-month High / Low (CHF) 19.9 / 10.3 Market capitalisation (CHFm) 1,303 Enterprise Value (BG estimates CHFm) 1,373 Avg. 6m daily volume ('000 shares) 369.8 Free Float 98.7% 3y EPS CAGR 35.9% Gearing (12/11) 28% Dividend yield (12/12e) NM
We have upgraded our recommendation to Buy vs. Sell and increased our DCF-based Fair Value to CHF24 (vs. CHF16). In our view, a stabilised market and efforts for better sales execution should enable Temenos to grow in 2013. With breakeven point now under control, the Core Banking software vendor boasts significant leverage to operating margins. We therefore expect the share to restore its growth stock status after two disappointing years.
Improvement in execution ability underway. Although this has not been reflected in changes to medium-term targets, the new CEO appointed in July 2012 provided an opportunity for Temenos to adjust its organisation in order to improve sales execution. We believe that this factor combined with more advantageous comparison with the year-earlier period and a stabilised backdrop should pave the way for renewed sales growth as of Q4 2012 and in 2013.
2013 breakeven point offering high leverage to margins. In our view the breakeven point defined for 2013 (USD360m) offers significant leverage to Temenos' EBIT margin. If the signs of recovery noted in September 2012 materialise in the Core Banking solutions market, Temenos ought to be able to widen the operating margin by 4 points in 2013 and target the 30% mark over the medium term if the recovery takes shape.
A player still likely to participate in acquisitions. A turnaround could restore the share's appeal as a play on leadership positioning in the Core Banking segment, either as predator or prey, benefiting from excellent cash generation.
Attractively valued, even in a reasonable scenario. The share is trading on 2013 and 2014 EV/EBIT of 12.4x and 9.8x, or 12-14% below the main software publishers and above all, 50% below its peak levels of end-2010.
YE December 12/11 12/12e 12/13e 12/14e Revenue (US$m) 473.47 447.67 468.27 506.79 EBITA US$m) 99.6 94.6 116.7 138.4 Op.Margin (%) 21.0 21.1 24.9 27.3 Diluted EPS (US$) 0.56 0.82 1.15 1.40 EV/Sales 3.3x 3.4x 3.1x 2.7x EV/EBITDA 12.0x 11.9x 9.6x 7.6x EV/EBITA 15.5x 16.1x 12.4x 9.8x P/E 35.8x 24.4x 17.4x 14.3x ROCE 19.1 18.6 22.5 26.8
4/2/13
F M A M J J A S O N D J 50
60
70
80
90
100
110
120
TEMENOS GROUP STOXX EUROPE 600 E - PRICE INDEX
Source: Thomson Reuters Datastream
Analyst: Gregory Ramirez 33(0) 1 56 68 75 91 [email protected]
Temenos Group
2
Income Statement (USDm) 2009 2010 2011 2012e 2013e 2014e 2015e Revenues 370 448 473 448 468 507 563 Change (%) -9.0% 21.0% 5.7% -5.4% 4.6% 8.2% 11.1% lfl change (%) -12.0% 7.0% -5.0% -2.0% 3.3% 8.2% 11.1% Adjusted EBITDA 131 156 129 128 152 178 207 Depreciation & amortisation (22.0) (25.0) (29.1) (33.0) (35.0) (39.5) (42.0) Adjusted EBIT 108 131 99.6 94.6 117 138 165 EBIT 80.2 73.7 (2.0) 51.8 87.3 112 138 Change (%) 25.5% -8.2% -103% -% 68.6% 28.2% 23.5% Financial results (11.4) (11.9) (14.0) (12.5) (8.0) (6.2) (4.5) Pre-Tax profits 68.8 61.8 (16.1) 39.3 79.3 106 134 Exceptionals 0.0 0.0 0.0 0.0 0.0 0.0 0.0 Tax (0.31) (0.40) (12.2) (8.6) (14.3) (19.0) (24.1) Profits from associates 0.0 0.0 0.0 0.0 0.0 0.0 0.0 Minority interests (0.09) (0.23) (0.06) 0.20 0.40 0.40 0.40 Net profit 68.6 61.6 (28.3) 30.4 64.6 86.3 109 Restated net profit 94.3 109 44.4 65.1 91.7 111 134 Change (%) 9.8% 15.8% -59.3% 46.6% 40.8% 21.6% 20.6% Cash Flow Statement (USDm) Operating cash flows 127 118 51.7 95.3 124 148 174 Change in working capital (14.1) 4.7 47.1 4.2 (0.15) (0.29) (0.44) Capex, net (24.5) (28.2) (48.4) (50.5) (47.5) (45.5) (43.5) Financial investments, net (1.8) 4.4 0.23 (8.9) 0.0 0.0 0.0 Acquisitions, net (84.7) (78.2) (1.1) (19.3) 0.0 0.0 0.0 Dividends 0.0 0.0 0.0 0.0 0.0 0.0 0.0 Other 73.5 10.7 59.0 0.40 (5.7) (6.9) (6.8) Net debt 131 22.3 98.8 77.4 6.6 (89.1) (212) Free Cash flow 88.4 94.8 50.5 49.1 76.5 103 130 Balance Sheet (US$m) Tangible fixed assets 15.5 14.8 13.2 15.1 13.6 11.2 8.3 Intangibles assets & goodwill 288 407 404 417 416 409 398 Investments 0.0 0.0 0.0 0.05 0.05 0.05 0.05 Deferred tax assets 34.5 38.4 33.8 28.8 28.8 28.8 28.8 Current assets 323 364 349 350 363 389 428 Cash & equivalents 143 160 155 176 247 343 466 Total assets 804 984 955 987 1,069 1,181 1,329 Shareholders' equity 301 493 348 379 444 531 640 Provisions 2.2 2.7 3.8 3.5 6.5 6.5 6.5 Deferred tax liabilities 15.7 13.3 8.4 5.4 5.4 5.4 5.4 L & ST Debt 274 183 254 254 254 254 254 Current liabilities 211 293 341 346 359 385 423 Total Liabilities 804 984 955 987 1,068 1,181 1,329 Capital employed 432 515 447 456 450 441 428 Financial Ratios Operating margin 29.29 29.22 21.03 21.14 24.93 27.30 29.24 Tax rate 0.44 0.65 -76.08 22.00 18.00 18.00 18.00 Net margin 18.53 13.76 -5.97 6.80 13.80 17.03 19.41 ROE (after tax) 22.80 12.51 -8.11 8.03 14.56 16.27 17.07 ROCE (after tax) 25.04 25.33 19.09 18.56 22.51 26.83 32.69 Gearing 43.51 4.54 28.38 20.43 1.49 -16.79 -33.16 Pay out ratio 0.0 0.0 NM 0.0 0.0 0.0 0.0 Number of shares, diluted 76.06 87.00 79.36 79.38 79.38 79.38 79.38 Data per Share (USD) EPS 1.15 0.86 (0.39) 0.42 0.90 1.20 1.52 Restated EPS 1.24 1.25 0.56 0.82 1.15 1.40 1.69 % change 10.5% 1.2% -55.4% 46.5% 40.8% 21.6% 20.6% EPS bef. GDW 1.24 1.25 0.56 0.82 1.15 1.40 1.69 BVPS 3.96 5.66 4.39 4.77 5.59 6.68 8.07 Operating cash flows 1.67 1.36 0.65 1.20 1.56 1.87 2.19 FCF 1.16 1.09 0.64 0.62 0.96 1.29 1.64 Net dividend 0.0 0.0 0.0 0.0 0.0 0.0 0.0
Source: Company Data; Bryan, Garnier & Co ests.
Company description Founded in 1993, and listed on SIX Swiss Exchange since June 2001, Temenos Group is one of the largest global vendors of banking software platforms. Its Temenos T24 platform (est. 85% licence sales) addresses retail, universal, private, wholesale, retail and Islamic banks. Its functional coverage is centred on Core Banking (withdrawals, deposits, settlements, credits...), distribution channels (branch, call centre, mobile, web), customer relationship management, general support, payments, reporting, and risk & compliance management. In 2011 the group generated 42% of its licence revenues in Europe, 20% in Middle East & Africa, 30% in Asia-Pacific, and 8% in America. Around two-thirds of Temenos’ business is done in emerging countries.
Temenos Group
3
Table of contents
1. Fair value: CHF24 vs. CHF16 ..................................................................................................................... 4 1.1. Analysis of share performance ........................................................................................................... 4 1.2. DCF model ............................................................................................................................................ 6 1.3. Peer comparison ................................................................................................................................... 7
2. The worst is behind us .................................................................................................................................. 8 2.1. Bank ROEs lastingly under pressure ................................................................................................ 8 2.2. Signs of a recovery in demand for Temenos ................................................................................... 9
2.2.1. Fewer clouds on the horizon for unblocking projects ......................................................... 9 2.2.2. Selective recovery depending on Core Banking segment .................................................. 10
3. Improvement in execution ability ............................................................................................................. 12 3.1. Lessons learnt from the Guy Dubois era ....................................................................................... 12 3.2. Back to a decentralised organisation ............................................................................................... 14 3.3. Progress made in product architecture ........................................................................................... 15 3.4. Rebalancing of sales ........................................................................................................................... 17 3.5. Making more with IT services companies ..................................................................................... 18
4. Ready to restore margins ............................................................................................................................ 20 4.1. Sales turnaround just underway ....................................................................................................... 20 4.2. Significant leverage to margins ......................................................................................................... 22
4.2.1. Reducing breakeven point ....................................................................................................... 22 4.2.2. Restoring margins ..................................................................................................................... 24
5. Financial statement ...................................................................................................................................... 27 5.1. Profit & loss account ......................................................................................................................... 27 5.2. Balance sheet ....................................................................................................................................... 28 5.3. Cash flow statement ........................................................................................................................... 29
Price Chart and Rating History .......................................................................................................................... 30
Bryan Garnier stock rating system ..................................................................................................................... 31
Temenos Group
4
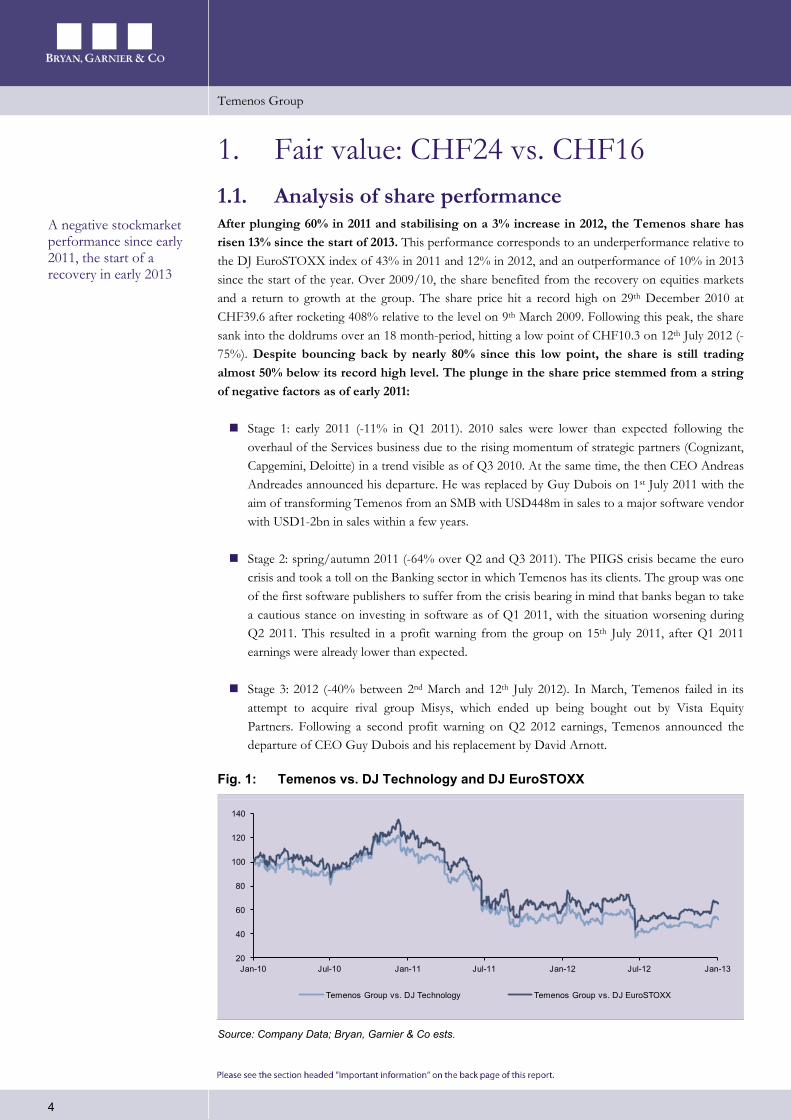
1. Fair value: CHF24 vs. CHF16 1.1. Analysis of share performance After plunging 60% in 2011 and stabilising on a 3% increase in 2012, the Temenos share has risen 13% since the start of 2013. This performance corresponds to an underperformance relative to the DJ EuroSTOXX index of 43% in 2011 and 12% in 2012, and an outperformance of 10% in 2013 since the start of the year. Over 2009/10, the share benefited from the recovery on equities markets and a return to growth at the group. The share price hit a record high on 29th December 2010 at CHF39.6 after rocketing 408% relative to the level on 9th March 2009. Following this peak, the share sank into the doldrums over an 18 month-period, hitting a low point of CHF10.3 on 12th July 2012 (-75%). Despite bouncing back by nearly 80% since this low point, the share is still trading almost 50% below its record high level. The plunge in the share price stemmed from a string of negative factors as of early 2011:
Stage 1: early 2011 (-11% in Q1 2011). 2010 sales were lower than expected following the overhaul of the Services business due to the rising momentum of strategic partners (Cognizant, Capgemini, Deloitte) in a trend visible as of Q3 2010. At the same time, the then CEO Andreas Andreades announced his departure. He was replaced by Guy Dubois on 1st July 2011 with the aim of transforming Temenos from an SMB with USD448m in sales to a major software vendor with USD1-2bn in sales within a few years.
Stage 2: spring/autumn 2011 (-64% over Q2 and Q3 2011). The PIIGS crisis became the euro crisis and took a toll on the Banking sector in which Temenos has its clients. The group was one of the first software publishers to suffer from the crisis bearing in mind that banks began to take a cautious stance on investing in software as of Q1 2011, with the situation worsening during Q2 2011. This resulted in a profit warning from the group on 15th July 2011, after Q1 2011 earnings were already lower than expected.
Stage 3: 2012 (-40% between 2nd March and 12th July 2012). In March, Temenos failed in its attempt to acquire rival group Misys, which ended up being bought out by Vista Equity Partners. Following a second profit warning on Q2 2012 earnings, Temenos announced the departure of CEO Guy Dubois and his replacement by David Arnott.
Fig. 1: Temenos vs. DJ Technology and DJ EuroSTOXX
Source: Company Data; Bryan, Garnier & Co ests.
20
40
60
80
100
120
140
Jan-10 Jul-10 Jan-11 Jul-11 Jan-12 Jul-12 Jan-13
Temenos Group vs. DJ Technology Temenos Group vs. DJ EuroSTOXX
A negative stockmarket performance since early 2011, the start of a recovery in early 2013
Temenos Group
5
We believe that the dismal performance by Temenos caused investors to ask a number of fundamental questions:
Was Guy Dubois' strategy the right one? On paper, yes, in the context prevailing in early 2011. Indeed, the idea was to transform Temenos and adapt the group to a change in size that was to take place in the years to follow. Major software vendors have very structured organisations and processes (sales R&D, services, support etc.), inherent in their size, in order to ensure strict control over their activity. However, this type of organisation rapidly appeared to be too heavy for Temenos and resulted in a loss of sales efficiency. Indeed, a light and flexible organisation was at the root of Temenos' success until 2010. New CEO David Arnott is therefore focusing on restoring the flexible organisation in place before Guy Dubois' arrival while maintaining the greater strictness nevertheless implemented by Mr Dubois.
When will banks start reinvesting in Core Banking solutions? Whereas the situation seemed to have stabilised for banks during the eurozone crisis, they are still drastically cutting back on IT spending. This is still particularly true in Europe where a lot of Core Banking projects have been frozen in major institutions, thereby prompting a plunge in both the amount of new business and the size of this business.
Is Temenos a weakened player? The 2011 ranking of Core Banking solution vendors established by International Banking Systems (IBS Sales League) placed Oracle as the No. 1 in the market in terms of the amount of new business signed during the year, whereas Temenos was the leader from 2007 to 2010. On paper, Oracle, Infosys and TCS suffered less from the crisis than Temenos, which had a less advantageous geographical mix, generating 47% of licence sales in Europe in 2010 (43% in 2011). However, this exposure has fallen considerably and only stood at 27% of nine-month sales in 2012. In addition, rival groups generate a significant share of Services sales, whereas the Temenos model is focused on licence sales, thereby making it more sensitive to a downturn in demand.
Should Temenos remain independent? The attempted merger with Misys highlighted the fact that teaming up with a large-sized rival was possible under the framework of the market consolidation. The Core Banking solutions market remains fairly modest in size (around USD2bn) relative to other major software markets, although the majority of major players are highly profitable with EBIT margins of more than 20% and excellent cash generation levels. In addition, Temenos rapidly won market share (around 17% at present vs. 8% in 2004) but has yet to widen the gap with rivals. In general, market share of around 25% is thought to be necessary to ensure a fairly uncontested leadership position. Consequently, we believe Temenos remains a credible target, even if the range of potential buyers looks fairly limited (private equity funds, Fidelity National Information Systems?).
The group's dismal performance prompted investors to question Temenos' strategy and its aim to remain independent
Temenos Group
6
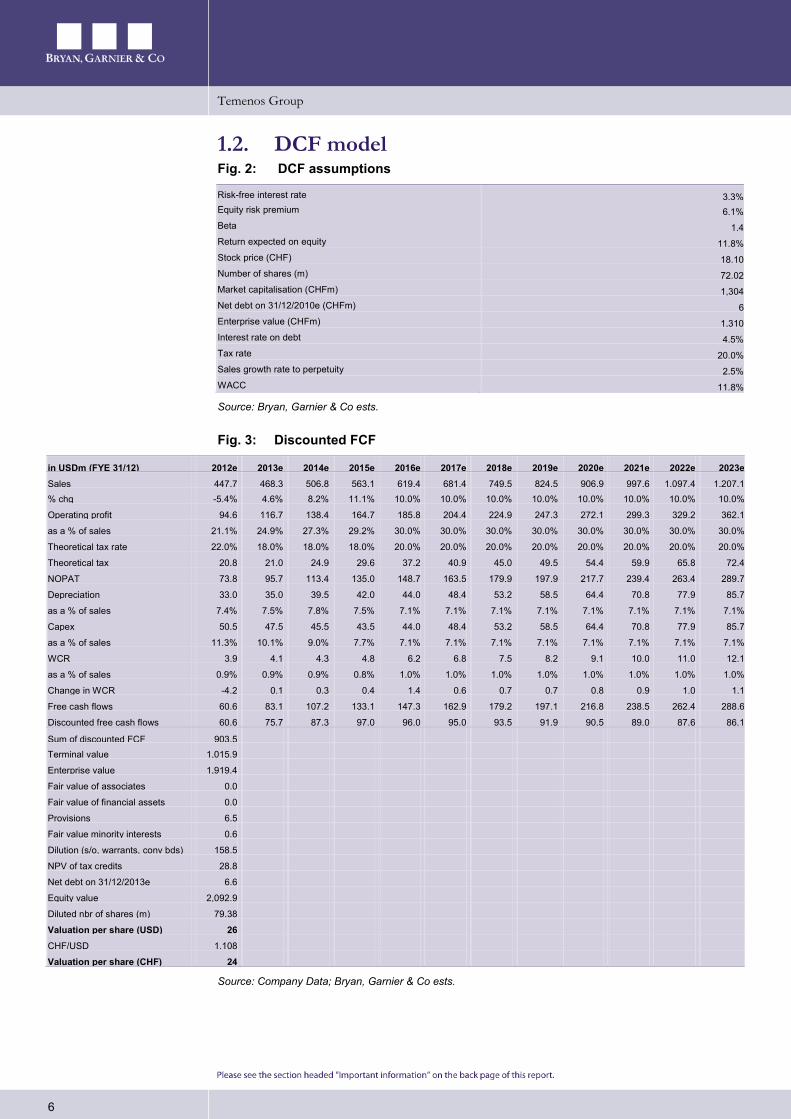
1.2. DCF model Fig. 2: DCF assumptions
Risk-free interest rate 3.3% Equity risk premium 6.1% Beta 1.4 Return expected on equity 11.8% Stock price (CHF) 18.10 Number of shares (m) 72.02 Market capitalisation (CHFm) 1,304 Net debt on 31/12/2010e (CHFm) 6 Enterprise value (CHFm) 1,310 Interest rate on debt 4.5% Tax rate 20.0% Sales growth rate to perpetuity 2.5% WACC 11.8%
Source: Bryan, Garnier & Co ests.
Fig. 3: Discounted FCF
in USDm (FYE 31/12) 2012e 2013e 2014e 2015e 2016e 2017e 2018e 2019e 2020e 2021e 2022e 2023e Sales 447.7 468.3 506.8 563.1 619.4 681.4 749.5 824.5 906.9 997.6 1,097.4 1,207.1 % chg -5.4% 4.6% 8.2% 11.1% 10.0% 10.0% 10.0% 10.0% 10.0% 10.0% 10.0% 10.0%
Operating profit 94.6 116.7 138.4 164.7 185.8 204.4 224.9 247.3 272.1 299.3 329.2 362.1
as a % of sales 21.1% 24.9% 27.3% 29.2% 30.0% 30.0% 30.0% 30.0% 30.0% 30.0% 30.0% 30.0%
Theoretical tax rate 22.0% 18.0% 18.0% 18.0% 20.0% 20.0% 20.0% 20.0% 20.0% 20.0% 20.0% 20.0%
Theoretical tax 20.8 21.0 24.9 29.6 37.2 40.9 45.0 49.5 54.4 59.9 65.8 72.4
NOPAT 73.8 95.7 113.4 135.0 148.7 163.5 179.9 197.9 217.7 239.4 263.4 289.7
Depreciation 33.0 35.0 39.5 42.0 44.0 48.4 53.2 58.5 64.4 70.8 77.9 85.7
as a % of sales 7.4% 7.5% 7.8% 7.5% 7.1% 7.1% 7.1% 7.1% 7.1% 7.1% 7.1% 7.1%
Capex 50.5 47.5 45.5 43.5 44.0 48.4 53.2 58.5 64.4 70.8 77.9 85.7
as a % of sales 11.3% 10.1% 9.0% 7.7% 7.1% 7.1% 7.1% 7.1% 7.1% 7.1% 7.1% 7.1%
WCR 3.9 4.1 4.3 4.8 6.2 6.8 7.5 8.2 9.1 10.0 11.0 12.1
as a % of sales 0.9% 0.9% 0.9% 0.8% 1.0% 1.0% 1.0% 1.0% 1.0% 1.0% 1.0% 1.0%
Change in WCR -4.2 0.1 0.3 0.4 1.4 0.6 0.7 0.7 0.8 0.9 1.0 1.1
Free cash flows 60.6 83.1 107.2 133.1 147.3 162.9 179.2 197.1 216.8 238.5 262.4 288.6
Discounted free cash flows 60.6 75.7 87.3 97.0 96.0 95.0 93.5 91.9 90.5 89.0 87.6 86.1
Sum of discounted FCF 903.5 Terminal value 1,015.9
Enterprise value 1,919.4
Fair value of associates 0.0
Fair value of financial assets 0.0
Provisions 6.5
Fair value minority interests 0.6
Dilution (s/o, warrants, conv bds) 158.5
NPV of tax credits 28.8
Net debt on 31/12/2013e 6.6
Equity value 2,092.9
Diluted nbr of shares (m) 79.38
Valuation per share (USD) 26
CHF/USD 1.108
Valuation per share (CHF) 24
Source: Company Data; Bryan, Garnier & Co ests.
Temenos Group
7
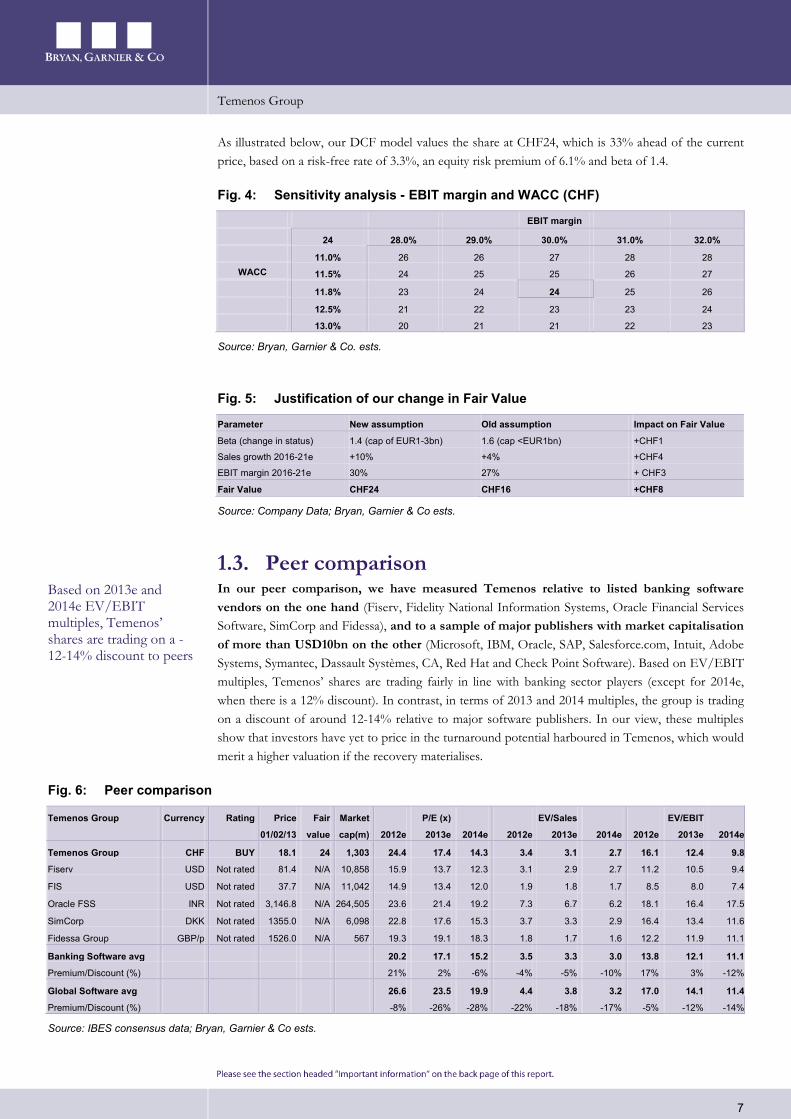
As illustrated below, our DCF model values the share at CHF24, which is 33% ahead of the current price, based on a risk-free rate of 3.3%, an equity risk premium of 6.1% and beta of 1.4.
Fig. 4: Sensitivity analysis - EBIT margin and WACC (CHF)
EBIT margin
24 28.0% 29.0% 30.0% 31.0% 32.0% 11.0% 26 26 27 28 28
WACC 11.5% 24 25 25 26 27
11.8% 23 24 24 25 26 12.5% 21 22 23 23 24 13.0% 20 21 21 22 23
Source: Bryan, Garnier & Co. ests.
Fig. 5: Justification of our change in Fair Value
Parameter New assumption Old assumption Impact on Fair Value
Beta (change in status) 1.4 (cap of EUR1-3bn) 1.6 (cap <EUR1bn) +CHF1
Sales growth 2016-21e +10% +4% +CHF4
EBIT margin 2016-21e 30% 27% + CHF3
Fair Value CHF24 CHF16 +CHF8
Source: Company Data; Bryan, Garnier & Co ests.
1.3. Peer comparison In our peer comparison, we have measured Temenos relative to listed banking software vendors on the one hand (Fiserv, Fidelity National Information Systems, Oracle Financial Services Software, SimCorp and Fidessa), and to a sample of major publishers with market capitalisation of more than USD10bn on the other (Microsoft, IBM, Oracle, SAP, Salesforce.com, Intuit, Adobe Systems, Symantec, Dassault Systèmes, CA, Red Hat and Check Point Software). Based on EV/EBIT multiples, Temenos’ shares are trading fairly in line with banking sector players (except for 2014e, when there is a 12% discount). In contrast, in terms of 2013 and 2014 multiples, the group is trading on a discount of around 12-14% relative to major software publishers. In our view, these multiples show that investors have yet to price in the turnaround potential harboured in Temenos, which would merit a higher valuation if the recovery materialises.
Fig. 6: Peer comparison
Temenos Group Currency Rating Price Fair
Market
P/E (x) EV/Sales
EV/EBIT
01/02/13 value cap(m) 2012e 2013e 2014e 2012e 2013e 2014e 2012e 2013e 2014e
Temenos Group CHF BUY 18.1 24 1,303 24.4 17.4 14.3 3.4 3.1 2.7 16.1 12.4 9.8
Fiserv USD Not rated 81.4 N/A 10,858 15.9 13.7 12.3 3.1 2.9 2.7 11.2 10.5 9.4
FIS USD Not rated 37.7 N/A 11,042 14.9 13.4 12.0 1.9 1.8 1.7 8.5 8.0 7.4
Oracle FSS INR Not rated 3,146.8 N/A 264,505 23.6 21.4 19.2 7.3 6.7 6.2 18.1 16.4 17.5
SimCorp DKK Not rated 1355.0 N/A 6,098 22.8 17.6 15.3 3.7 3.3 2.9 16.4 13.4 11.6
Fidessa Group GBP/p Not rated 1526.0 N/A 567 19.3 19.1 18.3 1.8 1.7 1.6 12.2 11.9 11.1
Banking Software avg 20.2 17.1 15.2 3.5 3.3 3.0 13.8 12.1 11.1
Premium/Discount (%) 21% 2% -6% -4% -5% -10% 17% 3% -12%
Global Software avg 26.6 23.5 19.9 4.4 3.8 3.2 17.0 14.1 11.4
Premium/Discount (%) -8% -26% -28% -22% -18% -17% -5% -12% -14%
Source: IBES consensus data; Bryan, Garnier & Co ests.
Based on 2013e and 2014e EV/EBIT multiples, Temenos’ shares are trading on a -12-14% discount to peers
Temenos Group
8
2. The worst is behind us 2.1. Bank ROEs lastingly under pressure The Core Banking solutions market, in which Temenos is mainly positioned, has suffered from the decline in bank ROEs since the subprime crisis in 2007-08. After a slight recovery in 2010, the crisis amplified in Europe as of Q2 2011 due to the euro zone crisis, which reduced leeway for banks to invest in their business, including in modernising IT systems. The situation seems all the worse in that it stems from a set of economic and structural factors: 1). the decline in asset profitability levels, 2). higher refinancing costs, 3). still-high operating costs, 4). the investments necessary to face major regulatory deadlines (Basel III, Volcker Rule, Vickers reports…), 5). an increasingly disputed competitive backdrop with the arrival of new players (online or mobile banking, mass retail players, Islamic financing, micro-finance) with increasingly demanding and volatile clients.
The Boston Consulting Group’s Risk Reports showed that ROE at banks on a global level fell from an average of 16% over 1980-2007 to 4-5% in 2008-09, before picking up again to 10% in 2010. In 2011 it stood at 7%, with a clear discrimination in geographical terms between countries with high ROE (Indonesia 26%, China 22%, Brazil 20%, Canada 15%, Australia 15%) and those with low ROE (Italy -7%, UK 4%, France 4%, Germany 6%, US 8%), thereby providing a clear idea of regions harbouring growth potential for a player such as Temenos at present.
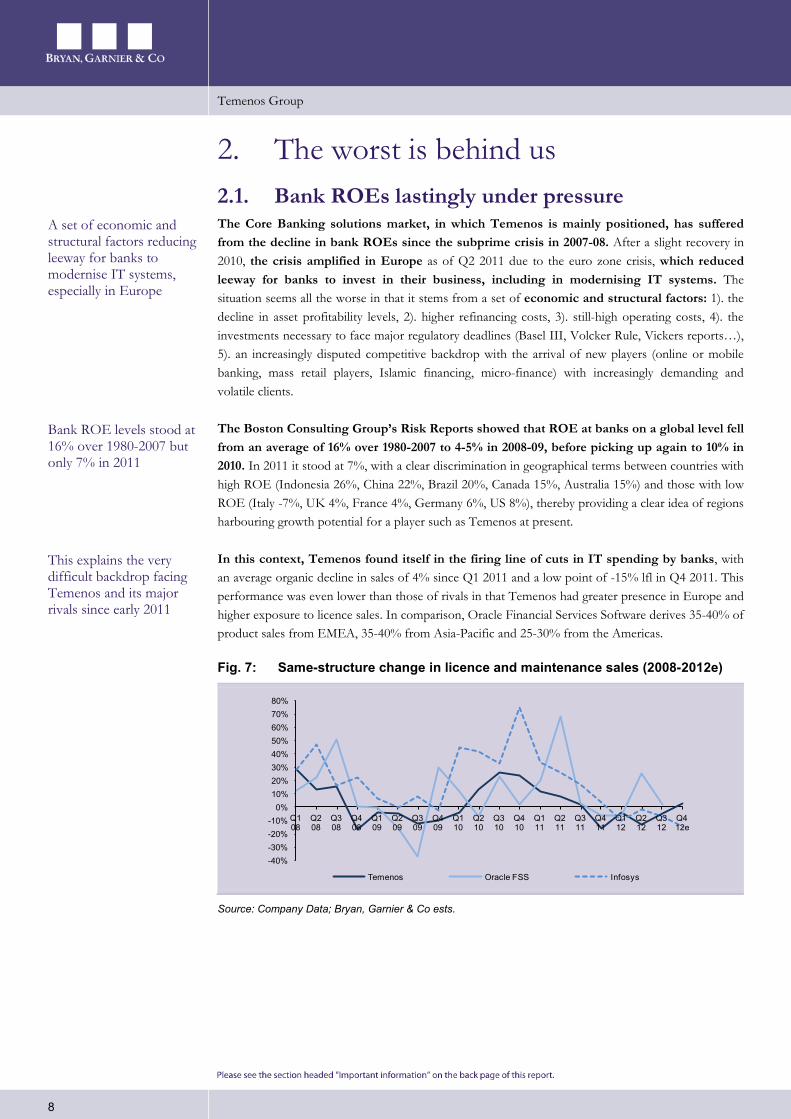
In this context, Temenos found itself in the firing line of cuts in IT spending by banks, with an average organic decline in sales of 4% since Q1 2011 and a low point of -15% lfl in Q4 2011. This performance was even lower than those of rivals in that Temenos had greater presence in Europe and higher exposure to licence sales. In comparison, Oracle Financial Services Software derives 35-40% of product sales from EMEA, 35-40% from Asia-Pacific and 25-30% from the Americas.
Fig. 7: Same-structure change in licence and maintenance sales (2008-2012e)
Source: Company Data; Bryan, Garnier & Co ests.
-40%-30%-20%-10%
0%10%20%30%40%50%60%70%80%
Q1 08
Q2 08
Q3 08
Q4 08
Q1 09
Q2 09
Q3 09
Q4 09
Q1 10
Q2 10
Q3 10
Q4 10
Q1 11
Q2 11
Q3 11
Q4 11
Q1 12
Q2 12
Q3 12
Q4 12e
Temenos Oracle FSS Infosys
A set of economic and structural factors reducing leeway for banks to modernise IT systems, especially in Europe
Bank ROE levels stood at 16% over 1980-2007 but only 7% in 2011
This explains the very difficult backdrop facing Temenos and its major rivals since early 2011
Temenos Group
9
2.2. Signs of a recovery in demand for Temenos
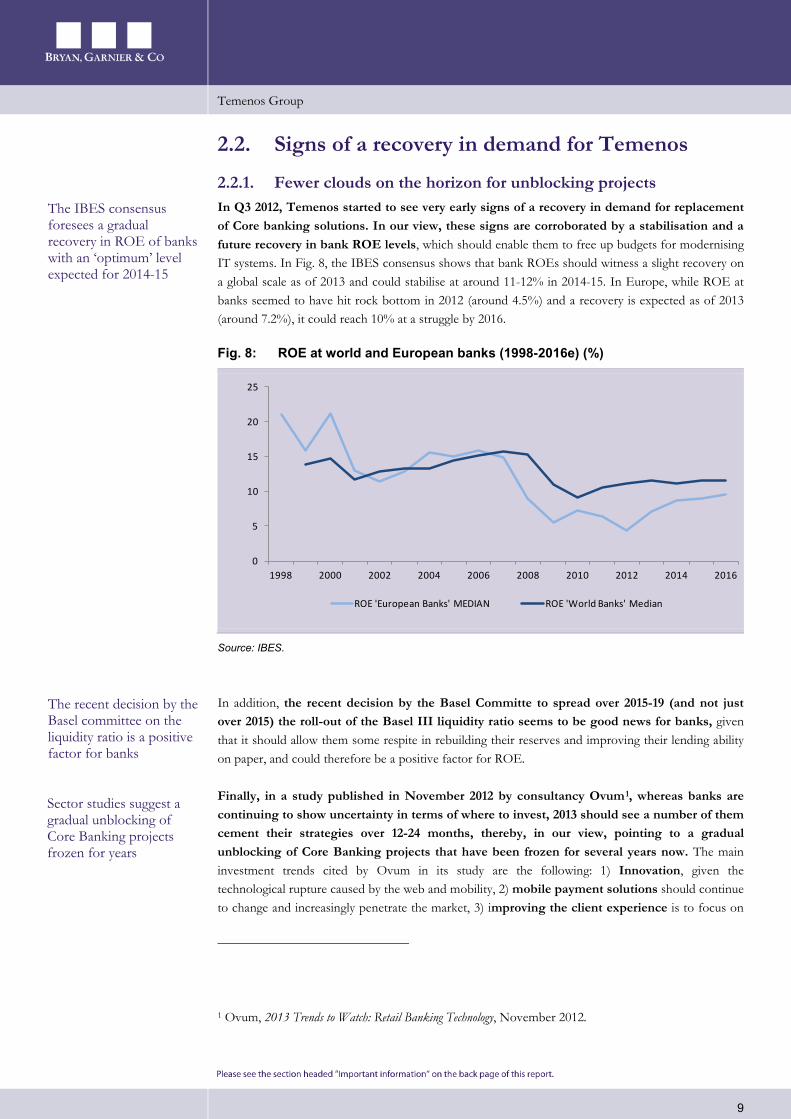
2.2.1. Fewer clouds on the horizon for unblocking projects In Q3 2012, Temenos started to see very early signs of a recovery in demand for replacement of Core banking solutions. In our view, these signs are corroborated by a stabilisation and a future recovery in bank ROE levels, which should enable them to free up budgets for modernising IT systems. In Fig. 8, the IBES consensus shows that bank ROEs should witness a slight recovery on a global scale as of 2013 and could stabilise at around 11-12% in 2014-15. In Europe, while ROE at banks seemed to have hit rock bottom in 2012 (around 4.5%) and a recovery is expected as of 2013 (around 7.2%), it could reach 10% at a struggle by 2016.
Fig. 8: ROE at world and European banks (1998-2016e) (%)
Source: IBES.
In addition, the recent decision by the Basel Committe to spread over 2015-19 (and not just over 2015) the roll-out of the Basel III liquidity ratio seems to be good news for banks, given that it should allow them some respite in rebuilding their reserves and improving their lending ability on paper, and could therefore be a positive factor for ROE.
Finally, in a study published in November 2012 by consultancy Ovum1
1 Ovum, 2013 Trends to Watch: Retail Banking Technology, November 2012.
, whereas banks are continuing to show uncertainty in terms of where to invest, 2013 should see a number of them cement their strategies over 12-24 months, thereby, in our view, pointing to a gradual unblocking of Core Banking projects that have been frozen for several years now. The main investment trends cited by Ovum in its study are the following: 1) Innovation, given the technological rupture caused by the web and mobility, 2) mobile payment solutions should continue to change and increasingly penetrate the market, 3) improving the client experience is to focus on
0
5
10
15
20
25
1998 2000 2002 2004 2006 2008 2010 2012 2014 2016
ROE 'European Banks' MEDIAN ROE 'World Banks' Median
The IBES consensus foresees a gradual recovery in ROE of banks with an ‘optimum’ level expected for 2014-15
The recent decision by the Basel committee on the liquidity ratio is a positive factor for banks
Sector studies suggest a gradual unblocking of Core Banking projects frozen for years
Temenos Group
10
multi-channel solutions, which are set to require increased usage of analytical tools to better respond to customer requirements, 4) analytical tools should improve decision-making processes as the big data trend continues to make progress, 5) the unlocking of synergies within the banks should enable the construction or extension of online banking services and the resolving of real-time strategies based on Core Banking platforms if these have not been replaced.
In this context, Temenos estimates that for its business, the recovery in Core Banking is primarily set to occur in solutions based on software components in a strategy of gradual renovation, for example in payments. Indeed, the group is continuing to enjoy rising demand for solutions providing a rapid return on investment (e.g. Business Intelligence with existing clients) and wealth management (where banks are deciding to replace a number of obsolete frontal tools). However, IT budgets at banks are admittedly set to remain governed by significant restrictions, given the need to ensure maintenance on existing solutions (offer nearing obsolescence) and to continue to comply with the large number of regulations in place.
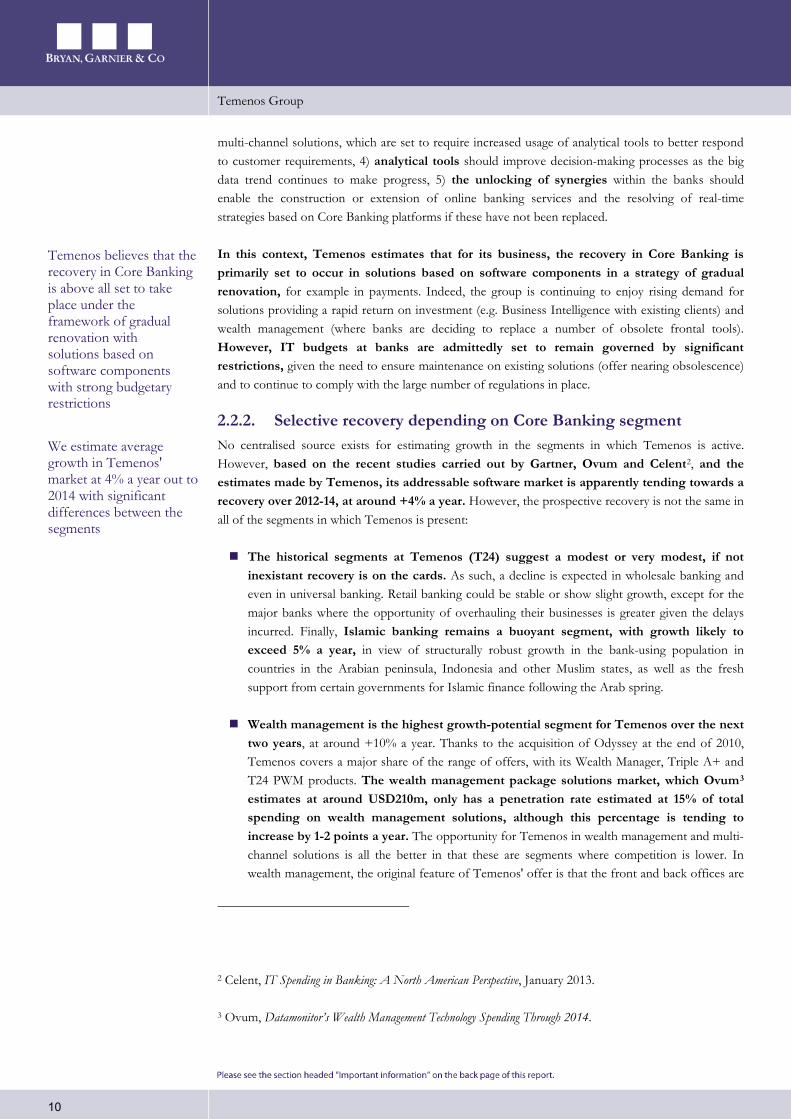
2.2.2. Selective recovery depending on Core Banking segment No centralised source exists for estimating growth in the segments in which Temenos is active. However, based on the recent studies carried out by Gartner, Ovum and Celent2
The historical segments at Temenos (T24) suggest a modest or very modest, if not inexistant recovery is on the cards. As such, a decline is expected in wholesale banking and even in universal banking. Retail banking could be stable or show slight growth, except for the major banks where the opportunity of overhauling their businesses is greater given the delays incurred. Finally, Islamic banking remains a buoyant segment, with growth likely to exceed 5% a year, in view of structurally robust growth in the bank-using population in countries in the Arabian peninsula, Indonesia and other Muslim states, as well as the fresh support from certain governments for Islamic finance following the Arab spring.
, and the estimates made by Temenos, its addressable software market is apparently tending towards a recovery over 2012-14, at around +4% a year. However, the prospective recovery is not the same in all of the segments in which Temenos is present:
Wealth management is the highest growth-potential segment for Temenos over the next two years, at around +10% a year. Thanks to the acquisition of Odyssey at the end of 2010, Temenos covers a major share of the range of offers, with its Wealth Manager, Triple A+ and T24 PWM products. The wealth management package solutions market, which Ovum3
2 Celent, IT Spending in Banking: A North American Perspective, January 2013.
estimates at around USD210m, only has a penetration rate estimated at 15% of total spending on wealth management solutions, although this percentage is tending to increase by 1-2 points a year. The opportunity for Temenos in wealth management and multi-channel solutions is all the better in that these are segments where competition is lower. In wealth management, the original feature of Temenos' offer is that the front and back offices are
3 Ovum, Datamonitor’s Wealth Management Technology Spending Through 2014.
Temenos believes that the recovery in Core Banking is above all set to take place under the framework of gradual renovation with solutions based on software components with strong budgetary restrictions
We estimate average growth in Temenos' market at 4% a year out to 2014 with significant differences between the segments
Temenos Group
11
independent of each other such that the client can roll them out separately. In addition, more than 10 sales of Odyssey software have been made to existing clients at Temenos since the acquisition.
In terms of other segments, multi-channel solutions should also see growth of around 10%. Three other offers should generate growth of around 5%: 1) Business Intelligence, inherited from two acquisitions: 2) payment management, which Temenos adresses via a solution inherited from the acquisition of Viveo at the end of 2009, and since 2012 via a partnership with Dutch bank ABN AMRO, 3) anti-laundering solutions inherited from Viveo. Finally, risk management is unlikely to generate growth, especially due to the end to major regulatory deadlines. In Business Intelligence, the Temenos offering is facing stiff competition (SAP, Oracle, IBM…), but has the advantage of being exclusively dedicated to banks (since it is not a generalist tool) and natively integrated into the Core Banking software, as well as boasting a rapid return on investment and an aggressive price since the software is directly integrated into Microsoft's office applications. For this reason, it is a good entry point at new clients for selling other products.
Fig. 9: Temenos market prospects in banking software
Source: Company Data; Gartner; Ovum.
Competitiveintensity
Market/segment software growth CAGR 2012-14e
CorpT24 Tier-1 & tier-2
RetailT24
RiskSTEP
UniversalT24 Retail
T24
AMLAML
BIInsight
PaymentsABN
AMRO
IslamicT24
Lending
ChannelsConnect
PWMT24, WM, TAP
4% 10%
Temenos Group
12
3. Improvement in execution ability 3.1. Lessons learnt from the Guy Dubois era We believe that the short time Guy Dubois spent as CEO (July 2011 - July 2012), was rich in lessons concerning Temenos' strengths and weaknesses and how to correct them. Guy Dubois arrived to take over from Andreas Andreades who had managed the group since 2003, in order to raise the status of Temenos from that of a small/mid-sized company to that of major global software player, with the aim of targeting USD1-2bn in sales. His management experience in software and telecoms at medium and large-sized companies (Sybase, Vantive, PeopleSoft, Cramer Systems, Amdocs, Mach Group) should have been a major asset in order to achieve this objective. Furthermore, he was able to capitalise on Temenos' achievements in terms of sales flexibility, software architecture, acquisitions and strategic parnterships with IT services companies. Finally, he rolled out new tools and an improved methodology for sales representatives in order to better qualify business.
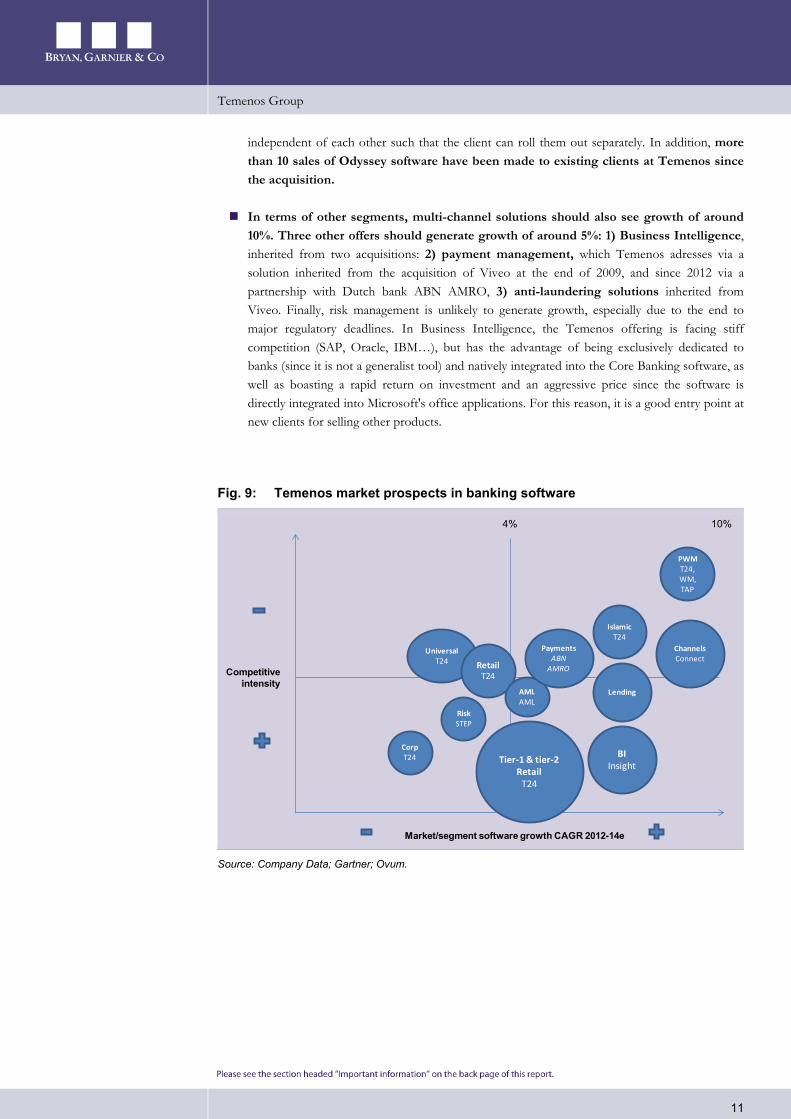
The medium-term financial targets set by Guy Dubois were the following: 1) to restore average annual growth in licence sales of 10-15%, 2) to restore gross margin of more than 10% in services, 3) to maintain services activities at around 25% of sales, 4) to increase EBIT margin by 1-1.5 points a year, 5) to maintain an EBITDA to cash conversion rate of 100%. These targets were accompanied by the following medium-term strategic priorities:
Fig. 10: Temenos medium-term strategic targets
Strategic priorities Targets Key indicator
Product leadership To become a leader in target segments: retail banking, wealth management...
To exploit the potential in product architecture
Top 2
N°1
Sales To increase the share of licence sales to the installed base
To focus on Asia-Pacific and America in licence sales
To focus on major banks in licence sales
From 46% to >55%
From 38% to >40%
From 24% to >25%
Services To restore profitability in Services
To make Services a fully-fledged business
To continue to focus on customer satisfaction
Double-digit margin
25% of sales
Partnerships To increase the number of certified external consultants
To increase licence sales implying partners
>3,000
15-20%
Mergers-acquisitions To keep delivering significant ROI
To undertake earnings enhancing operations
>13%
Within 12 months
Source: Company Data.
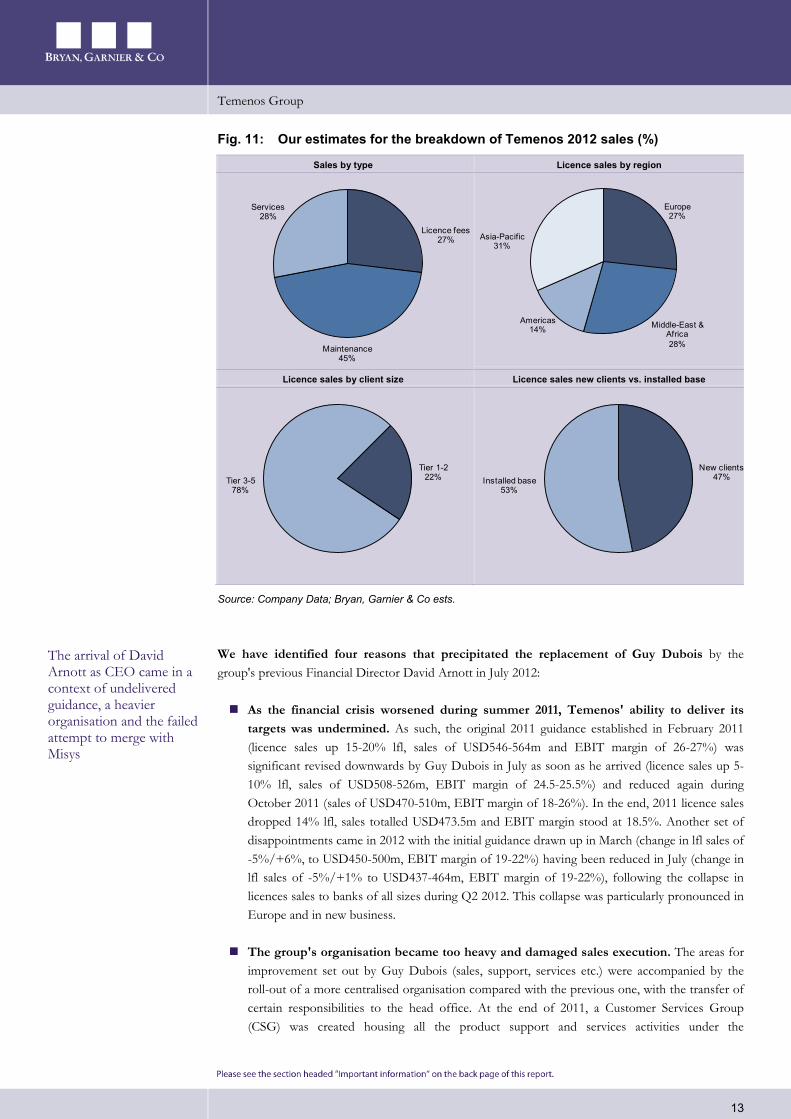
We believe that at least two of these targets were reached in 2012: 1) the share of the installed base in licence sales (est. 53% vs. target for more than 55%), 2) the rising momentum of Asia-Pacific and the US (est. 45% of licence sales vs. target for more than 40%). In contrast, we believe the share of licence sales generated by the major banks is still lacking (around 22% vs. 24% in 2011 and a target for more than 25%) and the road is still long before partnerships generate 15-20% of licence sales, while the Services business is still clearly loss-making and the group's global leadership position is contested by Oracle.
Former CEO Guy Dubois was expected to raise Temenos to the status of a major global software player
Among the medium-term financial targets was annual growth in licence sales of 10-15%
We estimate Temenos has delivered two of the targets set by Guy Dubois: the geographical rebalancing of sales and refocusing on the installed base
Temenos Group
13
Fig. 11: Our estimates for the breakdown of Temenos 2012 sales (%)
Sales by type Licence sales by region
Licence sales by client size Licence sales new clients vs. installed base
Source: Company Data; Bryan, Garnier & Co ests.
We have identified four reasons that precipitated the replacement of Guy Dubois by the group's previous Financial Director David Arnott in July 2012:
As the financial crisis worsened during summer 2011, Temenos' ability to deliver its targets was undermined. As such, the original 2011 guidance established in February 2011 (licence sales up 15-20% lfl, sales of USD546-564m and EBIT margin of 26-27%) was significant revised downwards by Guy Dubois in July as soon as he arrived (licence sales up 5-10% lfl, sales of USD508-526m, EBIT margin of 24.5-25.5%) and reduced again during October 2011 (sales of USD470-510m, EBIT margin of 18-26%). In the end, 2011 licence sales dropped 14% lfl, sales totalled USD473.5m and EBIT margin stood at 18.5%. Another set of disappointments came in 2012 with the initial guidance drawn up in March (change in lfl sales of -5%/+6%, to USD450-500m, EBIT margin of 19-22%) having been reduced in July (change in lfl sales of -5%/+1% to USD437-464m, EBIT margin of 19-22%), following the collapse in licences sales to banks of all sizes during Q2 2012. This collapse was particularly pronounced in Europe and in new business.
The group's organisation became too heavy and damaged sales execution. The areas for improvement set out by Guy Dubois (sales, support, services etc.) were accompanied by the roll-out of a more centralised organisation compared with the previous one, with the transfer of certain responsibilities to the head office. At the end of 2011, a Customer Services Group (CSG) was created housing all the product support and services activities under the
Licence fees27%
Maintenance45%
Services28%
Europe27%
Middle-East & Africa28%
Americas14%
Asia-Pacific31%
Tier 1-222%Tier 3-5
78%
New clients47%Installed base
53%
The arrival of David Arnott as CEO came in a context of undelivered guidance, a heavier organisation and the failed attempt to merge with Misys
Temenos Group
14
management of the former head of SAP's Field Services (Bernd-Michael Rumpf). The main criticism of this type of organisation, which was probably well suited to SAP and Oracle, but too heavy for Temenos, was the slowdown in sales cycles and a loss of sales flexibility due to the lack of local presence between the sales and services teams and their customers.
The failed share swap bid in March 2012 for UK rival Misys, which was finally bought by Vista Equity Partners for GBP1.6bn in cash. The operation (4.1 Misys shares for one Temenos share) would have valued the new group at more than GBP2bn and enabled Temenos to increase its leadership in Core Banking solutions and extend its Treasury and Capital Markets offering. However, at the time, we contended that the deal had little chance of creating value given the banking crisis and the overlapping Core Banking platforms (Temenos T24 vs. Misys BankFusion), with the likelihood of hefty restructuring in order to unlock the savings and operating synergies hoped for and low potential revenue synergies with the Misys' Treasury and Capital Markets division.
The late booking (in our view) of a USD27bn provision in Q2 2011 for services contracts signed over the previous five years and not completed, clearly caused a problem in terms of the aggressiveness of revenue recognition at Temenos during a period in which the group was witnessing extremely fast organic growth (+28% on average over 2005-08). However, we understand that the nomination at the end of 2011 of Dassault Systèmes’ CFO Thibault de Tersant at the head of the Audit Committee, improved the group's vigilance in this respect, in spite of the efforts made previously.
3.2. Back to a decentralised organisation When he took up his functions, David Arnott announced that no major changes would be made to Temenos' strategy. For the moment, the financial and strategic targets defined by Guy Dubois remain intact and we expect no changes to them (or very marginal ones) at the investor day scheduled for 27 February in London. The only correction lies in the better cooperation between the sales and services teams, with a simplification in processes in order for customers to have just one representative at Temenos. This implies that sales representatives are fully on the front-line with clients and are not hampered by hefty administrative procedures. In terms of the organisational structure, this means more decentralisation:
In the organisation in place before the end of 2011, global functions were ensured by the Chief Financial Officer (at the time David Arnott), the Chief Technical Officier (André Loustau) and the Chief Operating Officer (Mark Cullinane), beneath which were the regions (EMEA, APAC, and America). Each region looked after sales, marketing services and support as well as product localisation, on a local basis.
Under Guy Dubois, apart from the CFO and the CTO, the central functions also included the COO (who was also the Head of Global Field Operations) and the Customer Services Group (CSG). Under the leadership of Bernd-Michael Rumpf, the CSG managed consulting, software integration, specific developments support and user training on a global basis. The regions nevertheless maintained their prerogatives, with the exception of those handled by the CSG.
With the new organisation, the central functions include the CFO and the CTO as well as the Head of Product (position occupied by Mark Winterburn since Q1 2011, arrived from Misys in 2010), the Head of Corporate Development (Mark Cullinane, now handling acquisitions and
David Arnott's promotion has not caused major changes in Temenos' strategy, except for the return to a decentralised organisation for sales and services
Temenos Group
15
strategic partnerships as well) and the Head of Services (position occupied by Mike Davis since Q3 2011). Above all, the end to the CSG restores direct management of the consulting, integration, specific developments, support and training teams to the three regions.
In terms of the regions, directors were maintained in Europe (Jean-Michel Hilsenkopf) and Middle East & Africa (Bernard Delahaye, since September 2011). Russell Taylor arrived from SAP in October 2012 to head up North America, having already spent time at Temenos between 2001 and 2010. Meanwhile, Asia-Pacific has had a new regional director since January 2013. The Latin America & Caribbean region has a new regional director as well (Enrique Ramos O’Reilly), having arrived in January 2013. The region primarily concerns Mexico but is a fully-fledged zone for Temenos.
This new organisation should enable sale representatives at Temenos to rapidly respond to RFPs (requests for proposals) and elaborate sales proposals, as well as better qualify deals in the pipeline and above all, obtain the final signature for deals quicker. The organisation has lightened internal processes and aims to reduce decision-making levels (management layers). Indeed, the presence of several layers of management clearly handicapped Temenos' ability to sign deals. The central services organisation now plays more of a support role for the regional services teams, in terms of methodology and building expert services, for example, rather than an operating role.
David Arnott is encouraging regional managers to work together with regional services managers on a regional support function in order to resolve the difficulties encountered and to share the same profit and loss account. From now on, within the regions a closer collaboration exists between the services and sales teams who need to have understood all the client issues which are critical for signing a deal, including project delivery aspects (how long will it take, are the specifications set?). The aim is therefore to better collaborate on the process to close a deal. In this way, the local services teams have more incentive to sign licence sales. Sales representatives are therefore now directly implied in the services business on a local level. The new management team considered it counter-productive for the services and sales teams to intervene separately at clients.
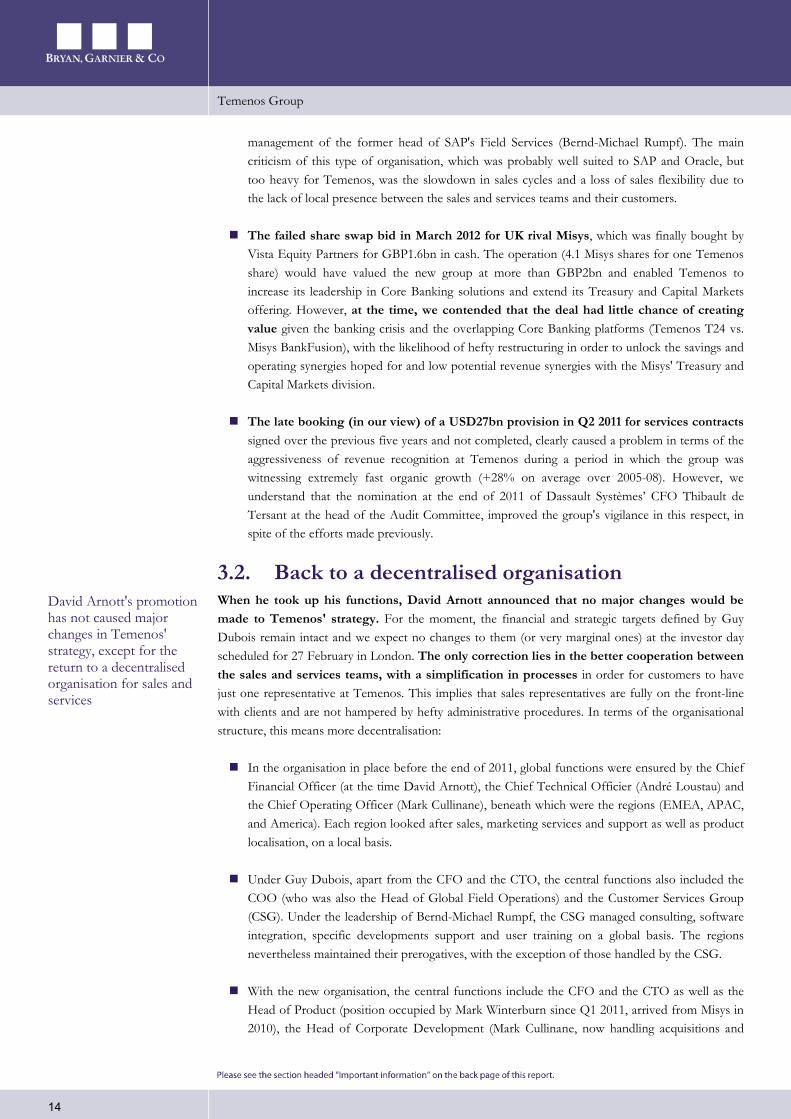
3.3. Progress made in product architecture In the past, the modular architecture of Temenos' T24 platform was above all suited to medium-sized banks under the framework of a radical overhaul of the Core Banking system. Admittedly, the development of a library of standard models (model bank) was a key factor in penetrating this type of client since the time needed to integrate the software was reduced to 6-12 months rather than 12-18 months with a classic approach, thanks to a huge effort to simplify procedures. This modular approach has proved to be less well suited to the needs of major banks since these players have a hefty legacy of tailor-made applications 20 to 30 years old, which explains the very high cost of a full replacement worth several tens of millions of dollars. As such, these banks prefer to gradually renovate their Core Banking solutions, firstly with front-office functions, and then precise back-office functions. For this reason, we estimate that only around 20 retail banks out of the 200 largest world banks have tried to replace their Core Banking system with an integrated suite. In May 2011, Temenos estimated this number at 14, based on data provided by IBS, Celent and The Banker. Since then, two projects have been abandonned (AIB with Oracle, Union Bank with Infosys) for technical or budgetary reasons.
A few changes in terms of regional directors
Temenos now capable of responding more efficiently to invitations to tender and accelerating the time needed to sign deals
At the regional level, directors now work in closer collaboration with the regional services teams in order to ensure a better monitoring of projects on a local level
In the past, the architecture of the Temenos T24 platform proved ill-suited to the needs of major banks who did not want an integrated suite
Temenos Group
16
Fig. 12: Major banks having adopted an integrated Core Banking solution
Bank Country Core Banking solution chosen
Nationwide UK SAP (SAP Core Banking)
AIB Ireland Oracle (Flexcube - project abandoned)
Deutsche Bank (Postbank) Germany SAP (SAP Core Banking)
ICICI Bank India Infosys (Finacle)
Bank of China China TCS (BaNCS)
Industrial Bank of Korea Korea Temenos (TCB)
Commonwealth Bank of Australia Australia SAP (SAP Core Banking)
ANZ Bank New Zealand FIS (Systematics)
National Australia Bank Australia Oracle (Oracle Banking Platform)
Bank of Montreal Canada FIS
Scotiabank Canada FIS (Profile)
Union Bank of California US Infosys (Finacle - projet abandoned)
BBVA Compass US Accenture (Alnova)
Banco Popular y de Desarrollo Comunal Costa Rica Temenos (T24)
Source: Company Data; IBS; Celent; The Banker; Bryan, Garnier & Co ests.
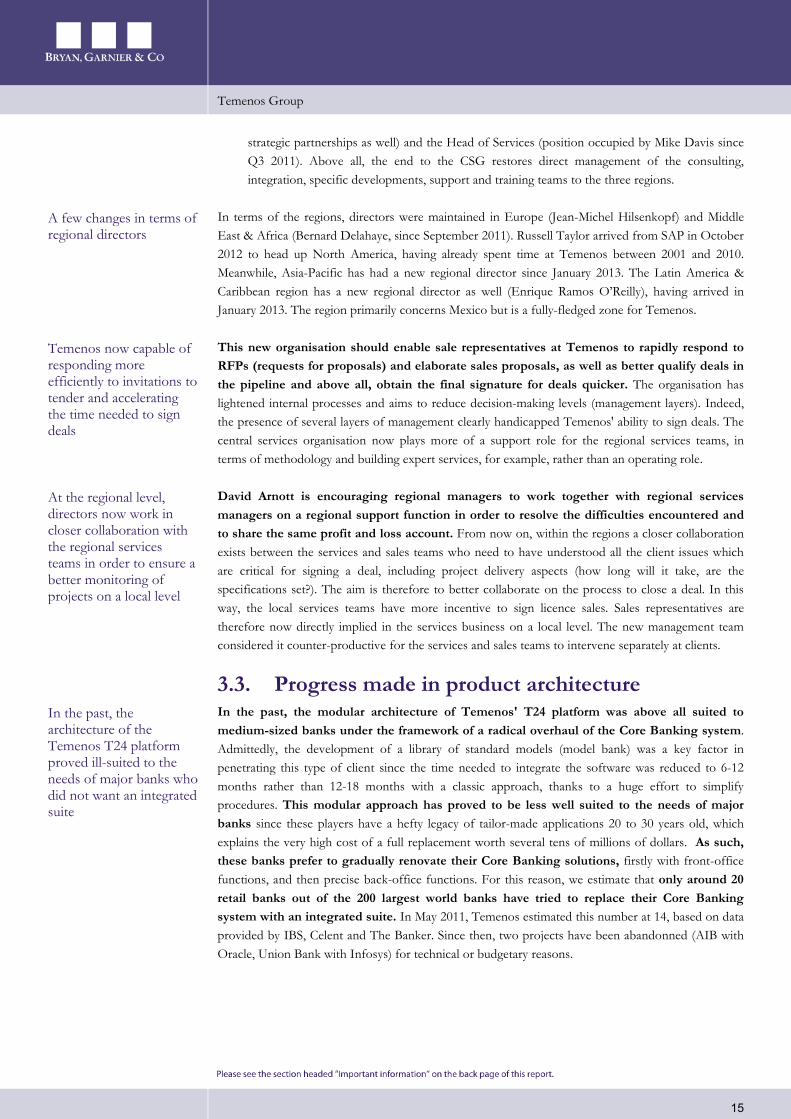
As a response to this situation, over the past four years, Temenos has redesigned the T24 architecture into reusable software components, under SOA (Service-Oriented Architecture), in order to enable clients to choose only the functionalities that they need and to integrate them into their existing applications via the majority of middleware software on the market. The first complete version of T24 in component form came out in 2011 and primarily targeted retail banking activities. In May 2012, Temenos unveiled a fully flexible architecture enabling major banks to replace their ageing applications step by step.
Fig. 13: Temenos T24 software component architecture
Source: Company Data.
This architecture was designed in a way that can rapidly integrate products stemming from future acquisitions by Temenos without having to significantly change the T24 platform. Finally, from now on, the T24 can handle all the major IT infrastructure platforms (data bases, programming tools, applications servers, BPM) including IBM, Microsoft and Oracle as well as PaaS (Platform as a Service) Azure by Microsoft for customers in micro-finance.
In response, in 2012, T24 has been made available in component form
Temenos Group
17
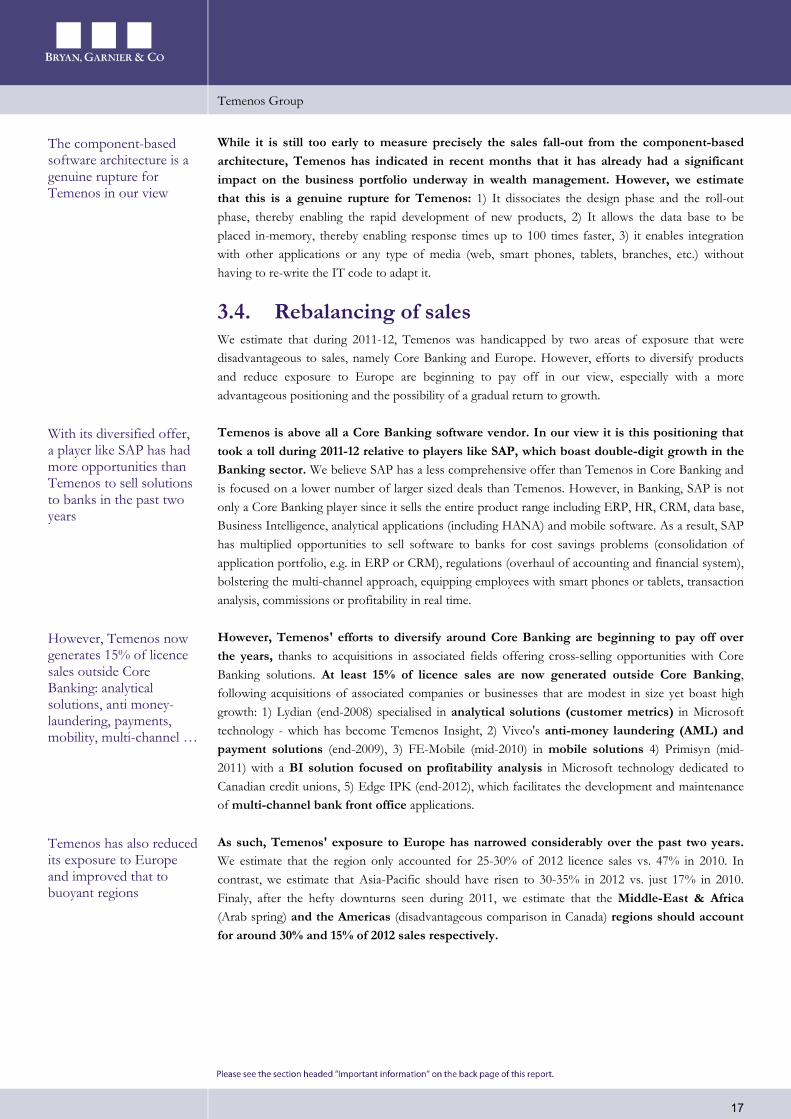
While it is still too early to measure precisely the sales fall-out from the component-based architecture, Temenos has indicated in recent months that it has already had a significant impact on the business portfolio underway in wealth management. However, we estimate that this is a genuine rupture for Temenos: 1) It dissociates the design phase and the roll-out phase, thereby enabling the rapid development of new products, 2) It allows the data base to be placed in-memory, thereby enabling response times up to 100 times faster, 3) it enables integration with other applications or any type of media (web, smart phones, tablets, branches, etc.) without having to re-write the IT code to adapt it.
3.4. Rebalancing of sales We estimate that during 2011-12, Temenos was handicapped by two areas of exposure that were disadvantageous to sales, namely Core Banking and Europe. However, efforts to diversify products and reduce exposure to Europe are beginning to pay off in our view, especially with a more advantageous positioning and the possibility of a gradual return to growth.
Temenos is above all a Core Banking software vendor. In our view it is this positioning that took a toll during 2011-12 relative to players like SAP, which boast double-digit growth in the Banking sector. We believe SAP has a less comprehensive offer than Temenos in Core Banking and is focused on a lower number of larger sized deals than Temenos. However, in Banking, SAP is not only a Core Banking player since it sells the entire product range including ERP, HR, CRM, data base, Business Intelligence, analytical applications (including HANA) and mobile software. As a result, SAP has multiplied opportunities to sell software to banks for cost savings problems (consolidation of application portfolio, e.g. in ERP or CRM), regulations (overhaul of accounting and financial system), bolstering the multi-channel approach, equipping employees with smart phones or tablets, transaction analysis, commissions or profitability in real time.
However, Temenos' efforts to diversify around Core Banking are beginning to pay off over the years, thanks to acquisitions in associated fields offering cross-selling opportunities with Core Banking solutions. At least 15% of licence sales are now generated outside Core Banking, following acquisitions of associated companies or businesses that are modest in size yet boast high growth: 1) Lydian (end-2008) specialised in analytical solutions (customer metrics) in Microsoft technology - which has become Temenos Insight, 2) Viveo's anti-money laundering (AML) and payment solutions (end-2009), 3) FE-Mobile (mid-2010) in mobile solutions 4) Primisyn (mid-2011) with a BI solution focused on profitability analysis in Microsoft technology dedicated to Canadian credit unions, 5) Edge IPK (end-2012), which facilitates the development and maintenance of multi-channel bank front office applications.
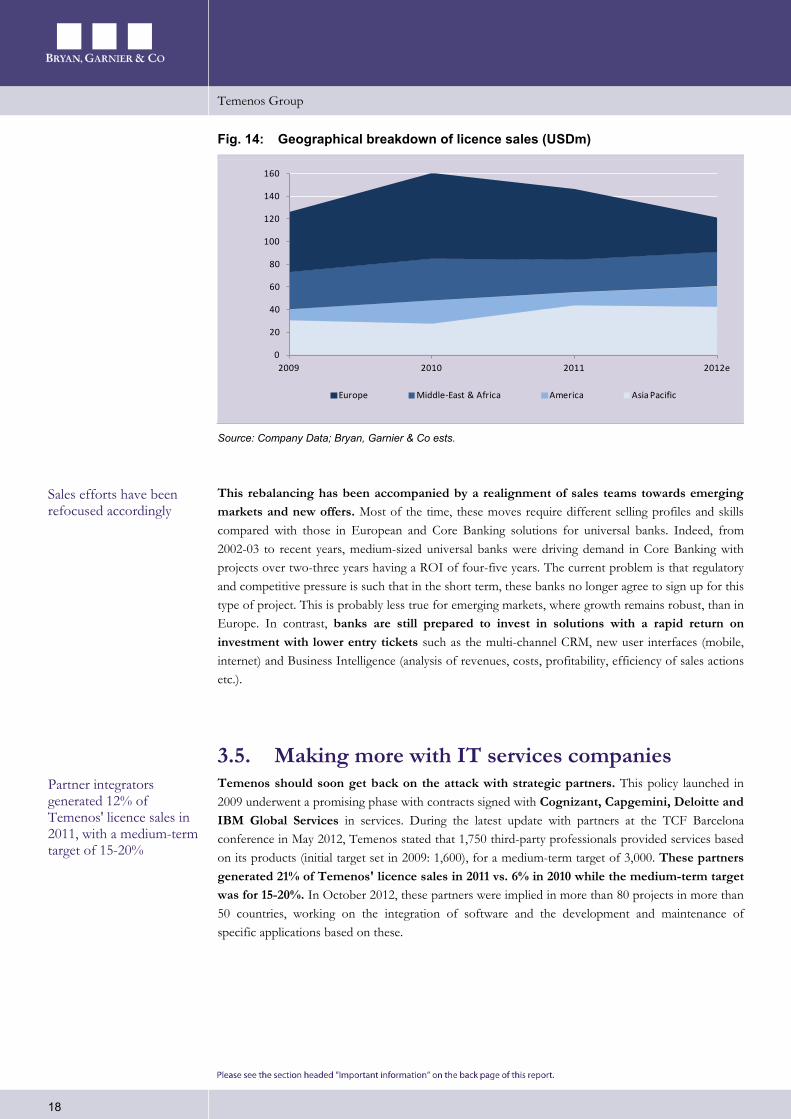
As such, Temenos' exposure to Europe has narrowed considerably over the past two years. We estimate that the region only accounted for 25-30% of 2012 licence sales vs. 47% in 2010. In contrast, we estimate that Asia-Pacific should have risen to 30-35% in 2012 vs. just 17% in 2010. Finaly, after the hefty downturns seen during 2011, we estimate that the Middle-East & Africa (Arab spring) and the Americas (disadvantageous comparison in Canada) regions should account for around 30% and 15% of 2012 sales respectively.
The component-based software architecture is a genuine rupture for Temenos in our view
With its diversified offer, a player like SAP has had more opportunities than Temenos to sell solutions to banks in the past two years
However, Temenos now generates 15% of licence sales outside Core Banking: analytical solutions, anti money-laundering, payments, mobility, multi-channel …
Temenos has also reduced its exposure to Europe and improved that to buoyant regions
Temenos Group
18
Fig. 14: Geographical breakdown of licence sales (USDm)
Source: Company Data; Bryan, Garnier & Co ests.
This rebalancing has been accompanied by a realignment of sales teams towards emerging markets and new offers. Most of the time, these moves require different selling profiles and skills compared with those in European and Core Banking solutions for universal banks. Indeed, from 2002-03 to recent years, medium-sized universal banks were driving demand in Core Banking with projects over two-three years having a ROI of four-five years. The current problem is that regulatory and competitive pressure is such that in the short term, these banks no longer agree to sign up for this type of project. This is probably less true for emerging markets, where growth remains robust, than in Europe. In contrast, banks are still prepared to invest in solutions with a rapid return on investment with lower entry tickets such as the multi-channel CRM, new user interfaces (mobile, internet) and Business Intelligence (analysis of revenues, costs, profitability, efficiency of sales actions etc.).
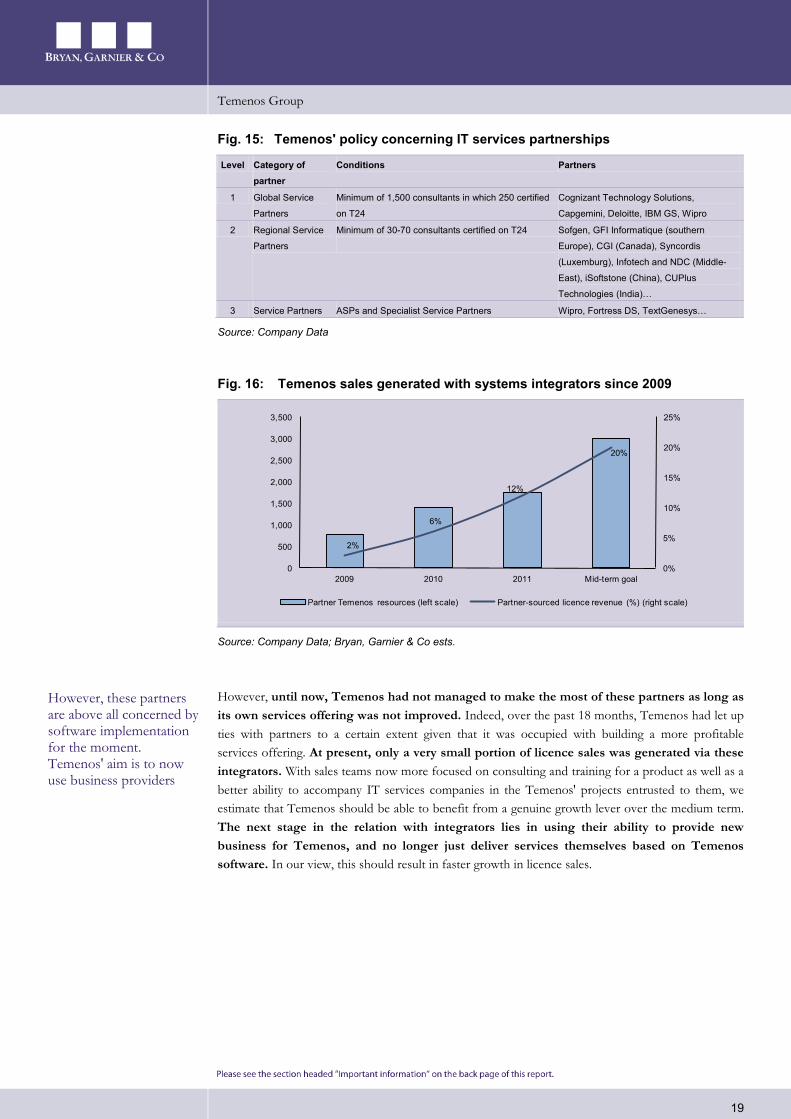
3.5. Making more with IT services companies Temenos should soon get back on the attack with strategic partners. This policy launched in 2009 underwent a promising phase with contracts signed with Cognizant, Capgemini, Deloitte and IBM Global Services in services. During the latest update with partners at the TCF Barcelona conference in May 2012, Temenos stated that 1,750 third-party professionals provided services based on its products (initial target set in 2009: 1,600), for a medium-term target of 3,000. These partners generated 21% of Temenos' licence sales in 2011 vs. 6% in 2010 while the medium-term target was for 15-20%. In October 2012, these partners were implied in more than 80 projects in more than 50 countries, working on the integration of software and the development and maintenance of specific applications based on these.
0
20
40
60
80
100
120
140
160
2009 2010 2011 2012e
Europe Middle-East & Africa America Asia Pacific
Sales efforts have been refocused accordingly
Partner integrators generated 12% of Temenos' licence sales in 2011, with a medium-term target of 15-20%
Temenos Group
19
Fig. 15: Temenos' policy concerning IT services partnerships
Level Category of partner
Conditions Partners
1 Global Service
Partners
Minimum of 1,500 consultants in which 250 certified
on T24
Cognizant Technology Solutions,
Capgemini, Deloitte, IBM GS, Wipro
2 Regional Service
Partners
Minimum of 30-70 consultants certified on T24
Sofgen, GFI Informatique (southern
Europe), CGI (Canada), Syncordis
(Luxemburg), Infotech and NDC (Middle-
East), iSoftstone (China), CUPlus
Technologies (India)…
3 Service Partners ASPs and Specialist Service Partners Wipro, Fortress DS, TextGenesys…
Source: Company Data
Fig. 16: Temenos sales generated with systems integrators since 2009
Source: Company Data; Bryan, Garnier & Co ests.
However, until now, Temenos had not managed to make the most of these partners as long as its own services offering was not improved. Indeed, over the past 18 months, Temenos had let up ties with partners to a certain extent given that it was occupied with building a more profitable services offering. At present, only a very small portion of licence sales was generated via these integrators. With sales teams now more focused on consulting and training for a product as well as a better ability to accompany IT services companies in the Temenos' projects entrusted to them, we estimate that Temenos should be able to benefit from a genuine growth lever over the medium term. The next stage in the relation with integrators lies in using their ability to provide new business for Temenos, and no longer just deliver services themselves based on Temenos software. In our view, this should result in faster growth in licence sales.
2%
6%
12%
20%
0%
5%
10%
15%
20%
25%
0
500
1,000
1,500
2,000
2,500
3,000
3,500
2009 2010 2011 Mid-term goal
Partner Temenos resources (left scale) Partner-sourced licence revenue (%) (right scale)
However, these partners are above all concerned by software implementation for the moment. Temenos' aim is to now use business providers
Temenos Group
20
4. Ready to restore margins Note that for 2012, Temenos is forecasting like-for-like sales growth of -5/+1% (or USD438-466m based on a USD/EUR exchange rate of 0.78 and a USD/GBP rate of 0.62), an operating margin before exceptional items and goodwill amortisation (USD83-103m) of 19-22% and a EBITDA to cash conversion rate of 100%. This does not include the acquisition of Edge IPK in October, which is set to be significant for sales. We expect sales to stand in the middle of this range (USD448m, or -2% lfl) and operating margin to come in just below the range in view of embedded operating costs at Edge IPK (around USD3m) and the seasonal nature of variable costs.
For 2013, no forecasts have been provided yet, but should be announced at the 2012 earnings publicaton on 26th February. However, Temenos has already fixed its breakeven point at USD360m (including USD10m from Edge IPK), which should be enabled by the restructuring work undertaken in H2 2012. As such, the group should benefit from significant leverage to the operating margin if growth in licence sales is restored. With the prospect of stabilisation, followed by an improvement in the Banking backdrop, we estimate that Temenos has the means to restore growth in licence sales to at least 5% in 2013 and 10-15% as of 2014 in order to target EBIT margin of close to 30% over the medium term.
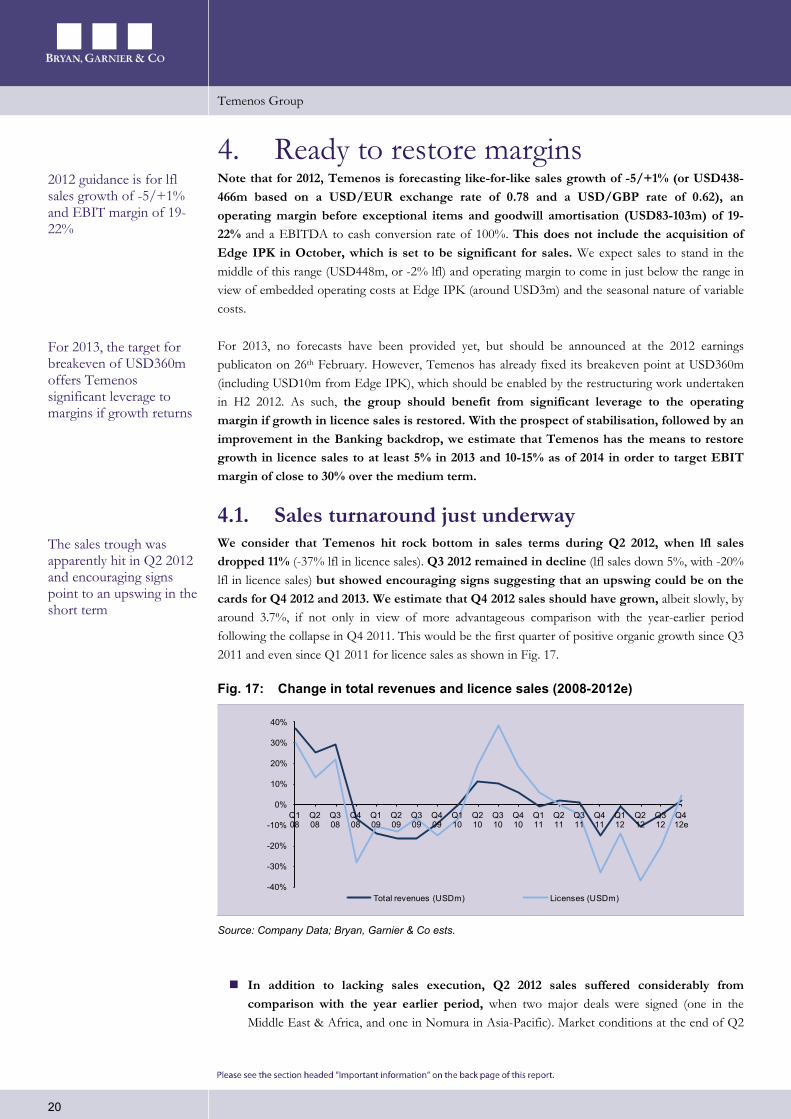
4.1. Sales turnaround just underway We consider that Temenos hit rock bottom in sales terms during Q2 2012, when lfl sales dropped 11% (-37% lfl in licence sales). Q3 2012 remained in decline (lfl sales down 5%, with -20% lfl in licence sales) but showed encouraging signs suggesting that an upswing could be on the cards for Q4 2012 and 2013. We estimate that Q4 2012 sales should have grown, albeit slowly, by around 3.7%, if not only in view of more advantageous comparison with the year-earlier period following the collapse in Q4 2011. This would be the first quarter of positive organic growth since Q3 2011 and even since Q1 2011 for licence sales as shown in Fig. 17.
Fig. 17: Change in total revenues and licence sales (2008-2012e)
Source: Company Data; Bryan, Garnier & Co ests.
In addition to lacking sales execution, Q2 2012 sales suffered considerably from comparison with the year earlier period, when two major deals were signed (one in the Middle East & Africa, and one in Nomura in Asia-Pacific). Market conditions at the end of Q2
-40%
-30%
-20%
-10%
0%
10%
20%
30%
40%
Q1 08
Q2 08
Q3 08
Q4 08
Q1 09
Q2 09
Q3 09
Q4 09
Q1 10
Q2 10
Q3 10
Q4 10
Q1 11
Q2 11
Q3 11
Q4 11
Q1 12
Q2 12
Q3 12
Q4 12e
Total revenues (USDm) Licenses (USDm)
2012 guidance is for lfl sales growth of -5/+1% and EBIT margin of 19-22%
For 2013, the target for breakeven of USD360m offers Temenos significant leverage to margins if growth returns
The sales trough was apparently hit in Q2 2012 and encouraging signs point to an upswing in the short term
Temenos Group
21
2012 were even more difficult than in Q1 and a number of deals that should have been signed in Q2 were only signed in early Q3 due to lacking execution quality, with some USD7-8m shifted to Q3 in our view. Licence sales to new clients continued to plummet (-54% on our estimates vs. -31% in Q1), whereas those to existing clients continued to improve, rising a slight 5% vs. 3% in Q1, primarily for additional modules or seats for small or sized deals in general.
The Q3 2012 performance was in line with management's estimates: all internal targets in terms of win rates and pricing against competition were delivered. Temenos reviewed its way of managing contracts and the quality of the business portfolio improved, providing a positive impact on sales execution. However, the company estimates there was still a number of contracts that could have been signed at the end of Q3 2012, but were only signed in early Q4. Temenos hopes to improve this by the end of 2012 or early 2013 as the increase in the sales staff's productivity gradually increases and the sales organisation rounds out its managerial skills, especially in signing up new business. The sales pipeline also increasingly includes multi-channel sales (mobile, internet) since traditional banks are generally becoming aware of their lag in this field.
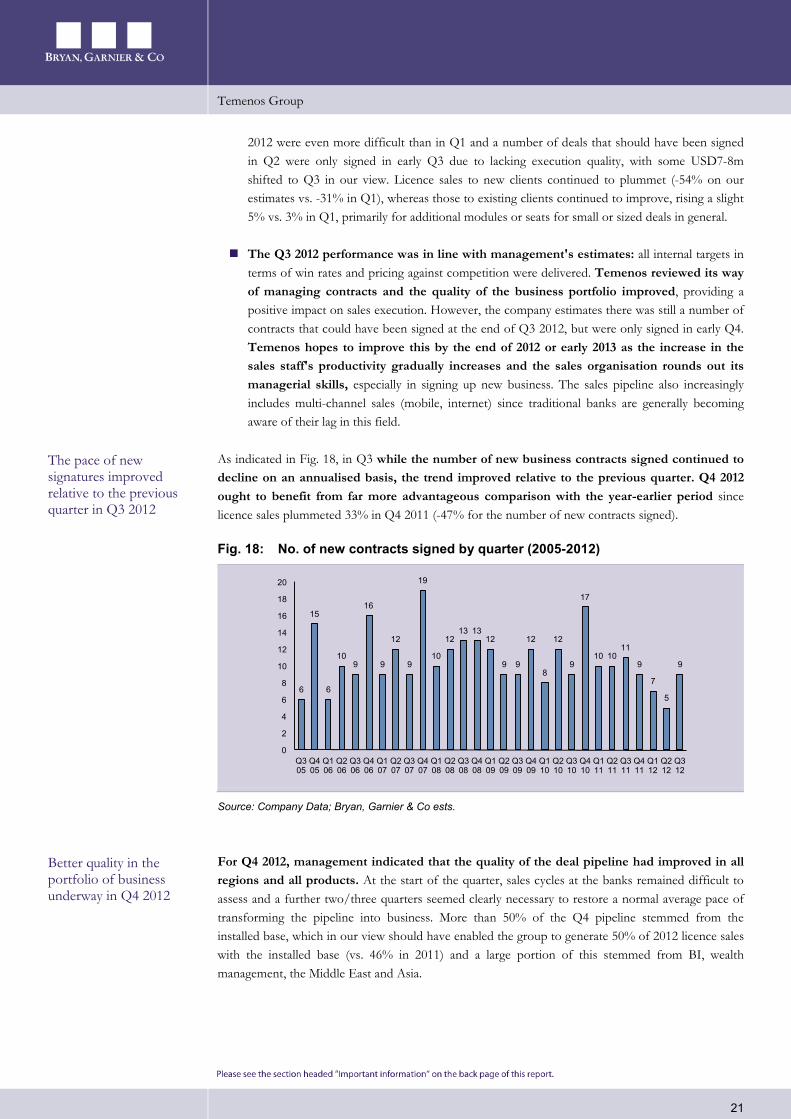
As indicated in Fig. 18, in Q3 while the number of new business contracts signed continued to decline on an annualised basis, the trend improved relative to the previous quarter. Q4 2012 ought to benefit from far more advantageous comparison with the year-earlier period since licence sales plummeted 33% in Q4 2011 (-47% for the number of new contracts signed).
Fig. 18: No. of new contracts signed by quarter (2005-2012)
Source: Company Data; Bryan, Garnier & Co ests.
For Q4 2012, management indicated that the quality of the deal pipeline had improved in all regions and all products. At the start of the quarter, sales cycles at the banks remained difficult to assess and a further two/three quarters seemed clearly necessary to restore a normal average pace of transforming the pipeline into business. More than 50% of the Q4 pipeline stemmed from the installed base, which in our view should have enabled the group to generate 50% of 2012 licence sales with the installed base (vs. 46% in 2011) and a large portion of this stemmed from BI, wealth management, the Middle East and Asia.
6
15
6
109
16
9
12
9
19
10
1213 13
12
9 9
12
8
12
9
17
10 1011
9
7
5
9
0
2
4
6
8
10
12
14
16
18
20
Q3 05
Q4 05
Q1 06
Q2 06
Q3 06
Q4 06
Q1 07
Q2 07
Q3 07
Q4 07
Q1 08
Q2 08
Q3 08
Q4 08
Q1 09
Q2 09
Q3 09
Q4 09
Q1 10
Q2 10
Q3 10
Q4 10
Q1 11
Q2 11
Q3 11
Q4 11
Q1 12
Q2 12
Q3 12
The pace of new signatures improved relative to the previous quarter in Q3 2012
Better quality in the portfolio of business underway in Q4 2012
Temenos Group
22
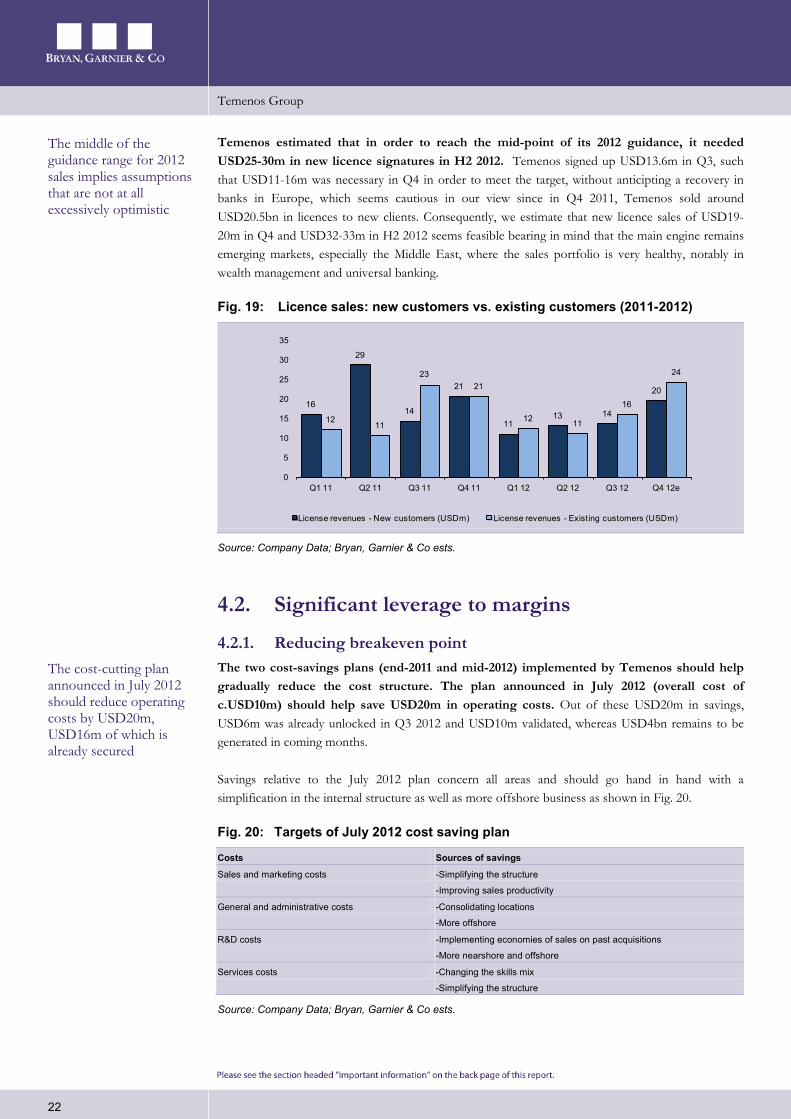
Temenos estimated that in order to reach the mid-point of its 2012 guidance, it needed USD25-30m in new licence signatures in H2 2012. Temenos signed up USD13.6m in Q3, such that USD11-16m was necessary in Q4 in order to meet the target, without anticipting a recovery in banks in Europe, which seems cautious in our view since in Q4 2011, Temenos sold around USD20.5bn in licences to new clients. Consequently, we estimate that new licence sales of USD19-20m in Q4 and USD32-33m in H2 2012 seems feasible bearing in mind that the main engine remains emerging markets, especially the Middle East, where the sales portfolio is very healthy, notably in wealth management and universal banking.
Fig. 19: Licence sales: new customers vs. existing customers (2011-2012)
Source: Company Data; Bryan, Garnier & Co ests.
4.2. Significant leverage to margins
4.2.1. Reducing breakeven point The two cost-savings plans (end-2011 and mid-2012) implemented by Temenos should help gradually reduce the cost structure. The plan announced in July 2012 (overall cost of c.USD10m) should help save USD20m in operating costs. Out of these USD20m in savings, USD6m was already unlocked in Q3 2012 and USD10m validated, whereas USD4bn remains to be generated in coming months.
Savings relative to the July 2012 plan concern all areas and should go hand in hand with a simplification in the internal structure as well as more offshore business as shown in Fig. 20.
Fig. 20: Targets of July 2012 cost saving plan
Costs Sources of savings
Sales and marketing costs -Simplifying the structure
-Improving sales productivity
General and administrative costs -Consolidating locations
-More offshore
R&D costs -Implementing economies of sales on past acquisitions
-More nearshore and offshore
Services costs -Changing the skills mix
-Simplifying the structure
Source: Company Data; Bryan, Garnier & Co ests.
16
29
14
21
1113 14
20
1211
2321
12 11
16
24
0
5
10
15
20
25
30
35
Q1 11 Q2 11 Q3 11 Q4 11 Q1 12 Q2 12 Q3 12 Q4 12e
License revenues - New customers (USDm) License revenues - Existing customers (USDm)
The middle of the guidance range for 2012 sales implies assumptions that are not at all excessively optimistic
The cost-cutting plan announced in July 2012 should reduce operating costs by USD20m, USD16m of which is already secured
Temenos Group
23
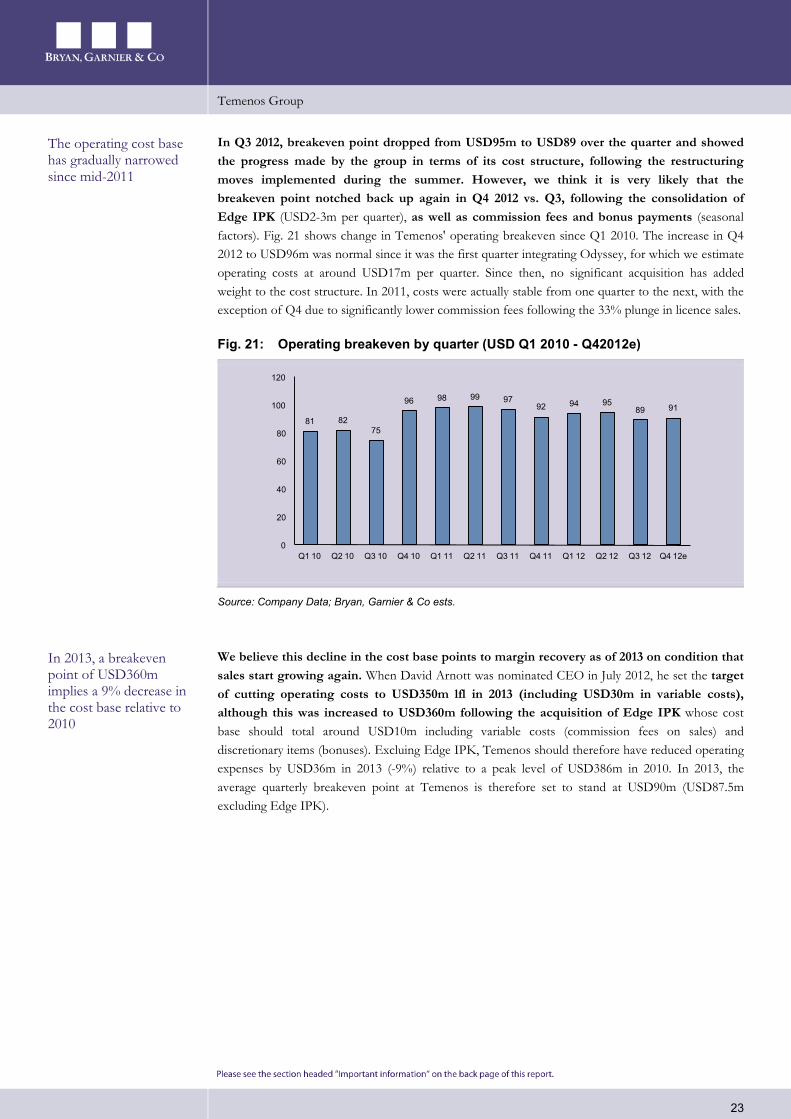
In Q3 2012, breakeven point dropped from USD95m to USD89 over the quarter and showed the progress made by the group in terms of its cost structure, following the restructuring moves implemented during the summer. However, we think it is very likely that the breakeven point notched back up again in Q4 2012 vs. Q3, following the consolidation of Edge IPK (USD2-3m per quarter), as well as commission fees and bonus payments (seasonal factors). Fig. 21 shows change in Temenos' operating breakeven since Q1 2010. The increase in Q4 2012 to USD96m was normal since it was the first quarter integrating Odyssey, for which we estimate operating costs at around USD17m per quarter. Since then, no significant acquisition has added weight to the cost structure. In 2011, costs were actually stable from one quarter to the next, with the exception of Q4 due to significantly lower commission fees following the 33% plunge in licence sales.
Fig. 21: Operating breakeven by quarter (USD Q1 2010 - Q42012e)
Source: Company Data; Bryan, Garnier & Co ests.
We believe this decline in the cost base points to margin recovery as of 2013 on condition that sales start growing again. When David Arnott was nominated CEO in July 2012, he set the target of cutting operating costs to USD350m lfl in 2013 (including USD30m in variable costs), although this was increased to USD360m following the acquisition of Edge IPK whose cost base should total around USD10m including variable costs (commission fees on sales) and discretionary items (bonuses). Excluing Edge IPK, Temenos should therefore have reduced operating expenses by USD36m in 2013 (-9%) relative to a peak level of USD386m in 2010. In 2013, the average quarterly breakeven point at Temenos is therefore set to stand at USD90m (USD87.5m excluding Edge IPK).
81 8275
96 98 99 9792 94 95
89 91
0
20
40
60
80
100
120
Q1 10 Q2 10 Q3 10 Q4 10 Q1 11 Q2 11 Q3 11 Q4 11 Q1 12 Q2 12 Q3 12 Q4 12e
The operating cost base has gradually narrowed since mid-2011
In 2013, a breakeven point of USD360m implies a 9% decrease in the cost base relative to 2010
Temenos Group
24
Fig. 22: How to reach breakeven point of USD360m in 2013?
Source: Company Data.
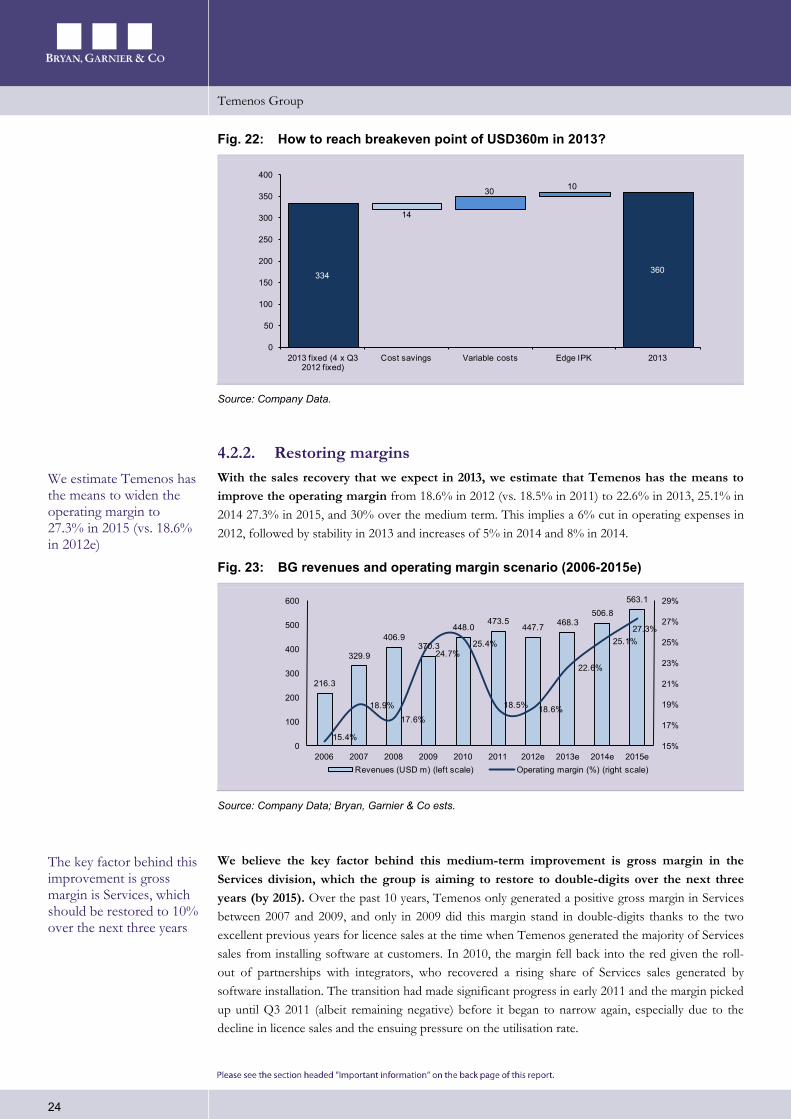
4.2.2. Restoring margins With the sales recovery that we expect in 2013, we estimate that Temenos has the means to improve the operating margin from 18.6% in 2012 (vs. 18.5% in 2011) to 22.6% in 2013, 25.1% in 2014 27.3% in 2015, and 30% over the medium term. This implies a 6% cut in operating expenses in 2012, followed by stability in 2013 and increases of 5% in 2014 and 8% in 2014.
Fig. 23: BG revenues and operating margin scenario (2006-2015e)
Source: Company Data; Bryan, Garnier & Co ests.
We believe the key factor behind this medium-term improvement is gross margin in the Services division, which the group is aiming to restore to double-digits over the next three years (by 2015). Over the past 10 years, Temenos only generated a positive gross margin in Services between 2007 and 2009, and only in 2009 did this margin stand in double-digits thanks to the two excellent previous years for licence sales at the time when Temenos generated the majority of Services sales from installing software at customers. In 2010, the margin fell back into the red given the roll-out of partnerships with integrators, who recovered a rising share of Services sales generated by software installation. The transition had made significant progress in early 2011 and the margin picked up until Q3 2011 (albeit remaining negative) before it began to narrow again, especially due to the decline in licence sales and the ensuing pressure on the utilisation rate.
334 360
14
30 10
0
50
100
150
200
250
300
350
400
2013 fixed (4 x Q3 2012 fixed)
Cost savings Variable costs Edge IPK 2013
216.3
329.9
406.9370.3
448.0473.5
447.7 468.3506.8
563.1
15.4%
18.9%
17.6%
24.7%25.4%
18.5% 18.6%
22.6%
25.1%27.3%
15%
17%
19%
21%
23%
25%
27%
29%
0
100
200
300
400
500
600
2006 2007 2008 2009 2010 2011 2012e 2013e 2014e 2015eRevenues (USD m) (left scale) Operating margin (%) (right scale)
We estimate Temenos has the means to widen the operating margin to 27.3% in 2015 (vs. 18.6% in 2012e)
The key factor behind this improvement is gross margin is Services, which should be restored to 10% over the next three years
Temenos Group
25
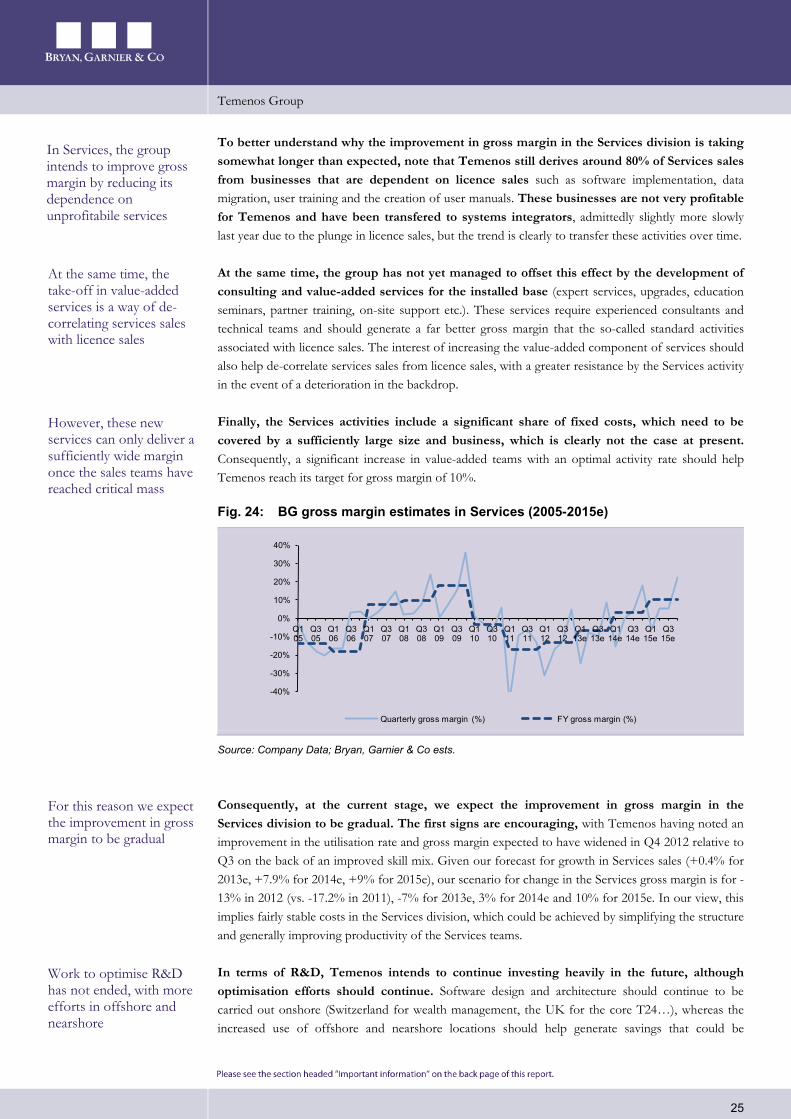
To better understand why the improvement in gross margin in the Services division is taking somewhat longer than expected, note that Temenos still derives around 80% of Services sales from businesses that are dependent on licence sales such as software implementation, data migration, user training and the creation of user manuals. These businesses are not very profitable for Temenos and have been transfered to systems integrators, admittedly slightly more slowly last year due to the plunge in licence sales, but the trend is clearly to transfer these activities over time.
At the same time, the group has not yet managed to offset this effect by the development of consulting and value-added services for the installed base (expert services, upgrades, education seminars, partner training, on-site support etc.). These services require experienced consultants and technical teams and should generate a far better gross margin that the so-called standard activities associated with licence sales. The interest of increasing the value-added component of services should also help de-correlate services sales from licence sales, with a greater resistance by the Services activity in the event of a deterioration in the backdrop.
Finally, the Services activities include a significant share of fixed costs, which need to be covered by a sufficiently large size and business, which is clearly not the case at present. Consequently, a significant increase in value-added teams with an optimal activity rate should help Temenos reach its target for gross margin of 10%.
Fig. 24: BG gross margin estimates in Services (2005-2015e)
Source: Company Data; Bryan, Garnier & Co ests.
Consequently, at the current stage, we expect the improvement in gross margin in the Services division to be gradual. The first signs are encouraging, with Temenos having noted an improvement in the utilisation rate and gross margin expected to have widened in Q4 2012 relative to Q3 on the back of an improved skill mix. Given our forecast for growth in Services sales (+0.4% for 2013e, +7.9% for 2014e, +9% for 2015e), our scenario for change in the Services gross margin is for -13% in 2012 (vs. -17.2% in 2011), -7% for 2013e, 3% for 2014e and 10% for 2015e. In our view, this implies fairly stable costs in the Services division, which could be achieved by simplifying the structure and generally improving productivity of the Services teams.
In terms of R&D, Temenos intends to continue investing heavily in the future, although optimisation efforts should continue. Software design and architecture should continue to be carried out onshore (Switzerland for wealth management, the UK for the core T24…), whereas the increased use of offshore and nearshore locations should help generate savings that could be
-40%
-30%
-20%
-10%
0%
10%
20%
30%
40%
Q1 05
Q3 05
Q1 06
Q3 06
Q1 07
Q3 07
Q1 08
Q3 08
Q1 09
Q3 09
Q1 10
Q3 10
Q1 11
Q3 11
Q1 12
Q3 12
Q1 13e
Q3 13e
Q1 14e
Q3 14e
Q1 15e
Q3 15e
Quarterly gross margin (%) FY gross margin (%)
In Services, the group intends to improve gross margin by reducing its dependence on unprofitabile services
At the same time, the take-off in value-added services is a way of de-correlating services sales with licence sales
However, these new services can only deliver a sufficiently wide margin once the sales teams have reached critical mass
For this reason we expect the improvement in gross margin to be gradual
Work to optimise R&D has not ended, with more efforts in offshore and nearshore
Temenos Group
26
ploughed back into creating product road maps for Business Intelligence, wealth management, multi-channel and T24. As such, efforts to optimise R&D should also involve redefining countries on which Temenos is to focus over the medium term in terms of product functionalities given that the country harbours attractive prospects. A perfect example mentioned by management is Canada, where Temenos is regularly successful with credit unions.
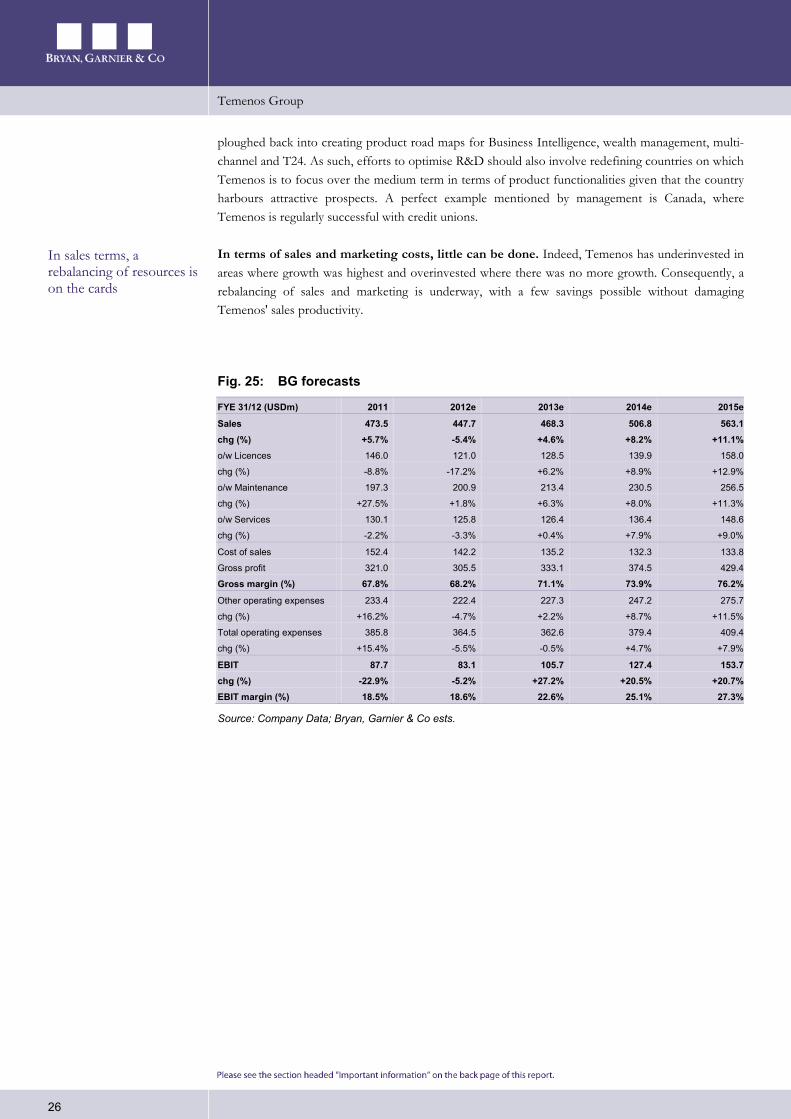
In terms of sales and marketing costs, little can be done. Indeed, Temenos has underinvested in areas where growth was highest and overinvested where there was no more growth. Consequently, a rebalancing of sales and marketing is underway, with a few savings possible without damaging Temenos' sales productivity.
Fig. 25: BG forecasts
FYE 31/12 (USDm) 2011 2012e 2013e 2014e 2015e
Sales 473.5 447.7 468.3 506.8 563.1 chg (%) +5.7% -5.4% +4.6% +8.2% +11.1% o/w Licences 146.0 121.0 128.5 139.9 158.0
chg (%) -8.8% -17.2% +6.2% +8.9% +12.9%
o/w Maintenance 197.3 200.9 213.4 230.5 256.5
chg (%) +27.5% +1.8% +6.3% +8.0% +11.3%
o/w Services 130.1 125.8 126.4 136.4 148.6
chg (%) -2.2% -3.3% +0.4% +7.9% +9.0%
Cost of sales 152.4 142.2 135.2 132.3 133.8
Gross profit 321.0 305.5 333.1 374.5 429.4
Gross margin (%) 67.8% 68.2% 71.1% 73.9% 76.2%
Other operating expenses 233.4 222.4 227.3 247.2 275.7
chg (%) +16.2% -4.7% +2.2% +8.7% +11.5%
Total operating expenses 385.8 364.5 362.6 379.4 409.4
chg (%) +15.4% -5.5% -0.5% +4.7% +7.9%
EBIT 87.7 83.1 105.7 127.4 153.7 chg (%) -22.9% -5.2% +27.2% +20.5% +20.7% EBIT margin (%) 18.5% 18.6% 22.6% 25.1% 27.3%
Source: Company Data; Bryan, Garnier & Co ests.
In sales terms, a rebalancing of resources is on the cards
Temenos Group
27
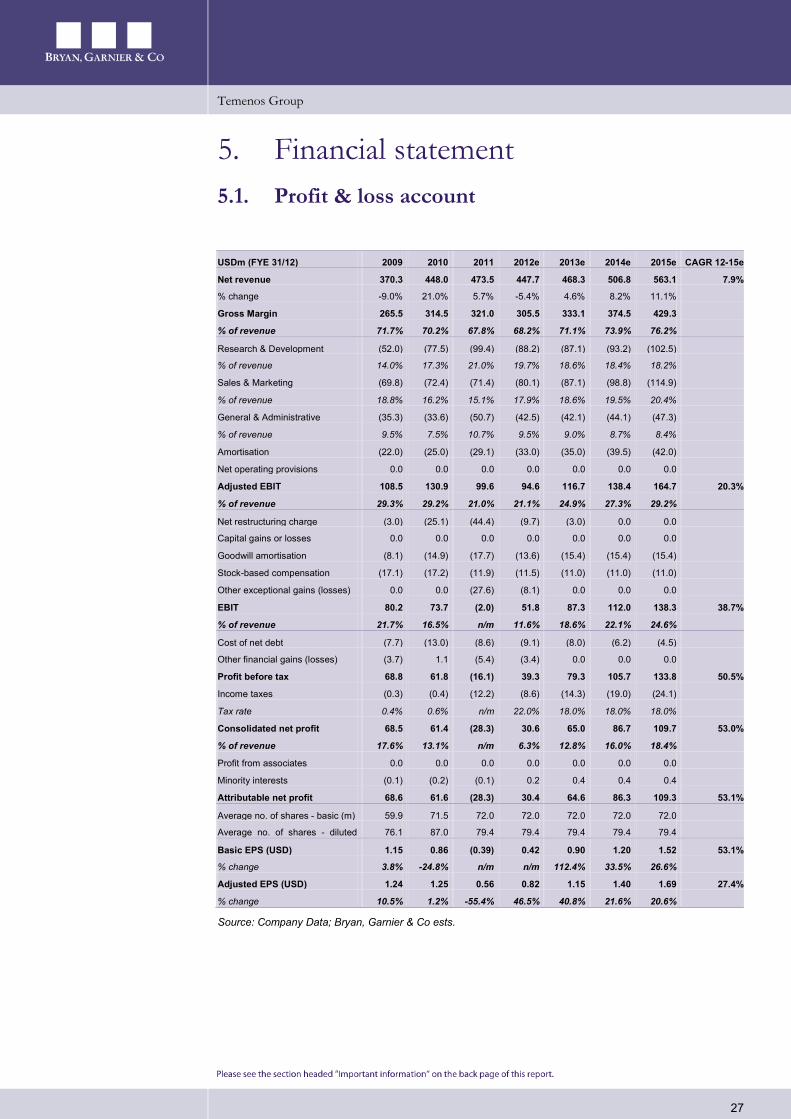
5. Financial statement 5.1. Profit & loss account
USDm (FYE 31/12) 2009 2010 2011 2012e 2013e 2014e 2015e CAGR 12-15e
Net revenue 370.3 448.0 473.5 447.7 468.3 506.8 563.1 7.9%
% change -9.0% 21.0% 5.7% -5.4% 4.6% 8.2% 11.1%
Gross Margin 265.5 314.5 321.0 305.5 333.1 374.5 429.3
% of revenue 71.7% 70.2% 67.8% 68.2% 71.1% 73.9% 76.2%
Research & Development (52.0) (77.5) (99.4) (88.2) (87.1) (93.2) (102.5)
% of revenue 14.0% 17.3% 21.0% 19.7% 18.6% 18.4% 18.2%
Sales & Marketing (69.8) (72.4) (71.4) (80.1) (87.1) (98.8) (114.9)
% of revenue 18.8% 16.2% 15.1% 17.9% 18.6% 19.5% 20.4%
General & Administrative (35.3) (33.6) (50.7) (42.5) (42.1) (44.1) (47.3)
% of revenue 9.5% 7.5% 10.7% 9.5% 9.0% 8.7% 8.4%
Amortisation (22.0) (25.0) (29.1) (33.0) (35.0) (39.5) (42.0)
Net operating provisions 0.0 0.0 0.0 0.0 0.0 0.0 0.0
Adjusted EBIT 108.5 130.9 99.6 94.6 116.7 138.4 164.7 20.3%
% of revenue 29.3% 29.2% 21.0% 21.1% 24.9% 27.3% 29.2%
Net restructuring charge (3.0) (25.1) (44.4) (9.7) (3.0) 0.0 0.0
Capital gains or losses 0.0 0.0 0.0 0.0 0.0 0.0 0.0
Goodwill amortisation (8.1) (14.9) (17.7) (13.6) (15.4) (15.4) (15.4)
Stock-based compensation (17.1) (17.2) (11.9) (11.5) (11.0) (11.0) (11.0)
Other exceptional gains (losses) 0.0 0.0 (27.6) (8.1) 0.0 0.0 0.0
EBIT 80.2 73.7 (2.0) 51.8 87.3 112.0 138.3 38.7%
% of revenue 21.7% 16.5% n/m 11.6% 18.6% 22.1% 24.6%
Cost of net debt (7.7) (13.0) (8.6) (9.1) (8.0) (6.2) (4.5)
Other financial gains (losses) (3.7) 1.1 (5.4) (3.4) 0.0 0.0 0.0
Profit before tax 68.8 61.8 (16.1) 39.3 79.3 105.7 133.8 50.5%
Income taxes (0.3) (0.4) (12.2) (8.6) (14.3) (19.0) (24.1)
Tax rate 0.4% 0.6% n/m 22.0% 18.0% 18.0% 18.0%
Consolidated net profit 68.5 61.4 (28.3) 30.6 65.0 86.7 109.7 53.0%
% of revenue 17.6% 13.1% n/m 6.3% 12.8% 16.0% 18.4%
Profit from associates 0.0 0.0 0.0 0.0 0.0 0.0 0.0
Minority interests (0.1) (0.2) (0.1) 0.2 0.4 0.4 0.4
Attributable net profit 68.6 61.6 (28.3) 30.4 64.6 86.3 109.3 53.1%
Average no. of shares - basic (m) 59.9 71.5 72.0 72.0 72.0 72.0 72.0
Average no. of shares - diluted
76.1 87.0 79.4 79.4 79.4 79.4 79.4
Basic EPS (USD) 1.15 0.86 (0.39) 0.42 0.90 1.20 1.52 53.1%
% change 3.8% -24.8% n/m n/m 112.4% 33.5% 26.6%
Adjusted EPS (USD) 1.24 1.25 0.56 0.82 1.15 1.40 1.69 27.4%
% change 10.5% 1.2% -55.4% 46.5% 40.8% 21.6% 20.6%
Source: Company Data; Bryan, Garnier & Co ests.
Temenos Group
28
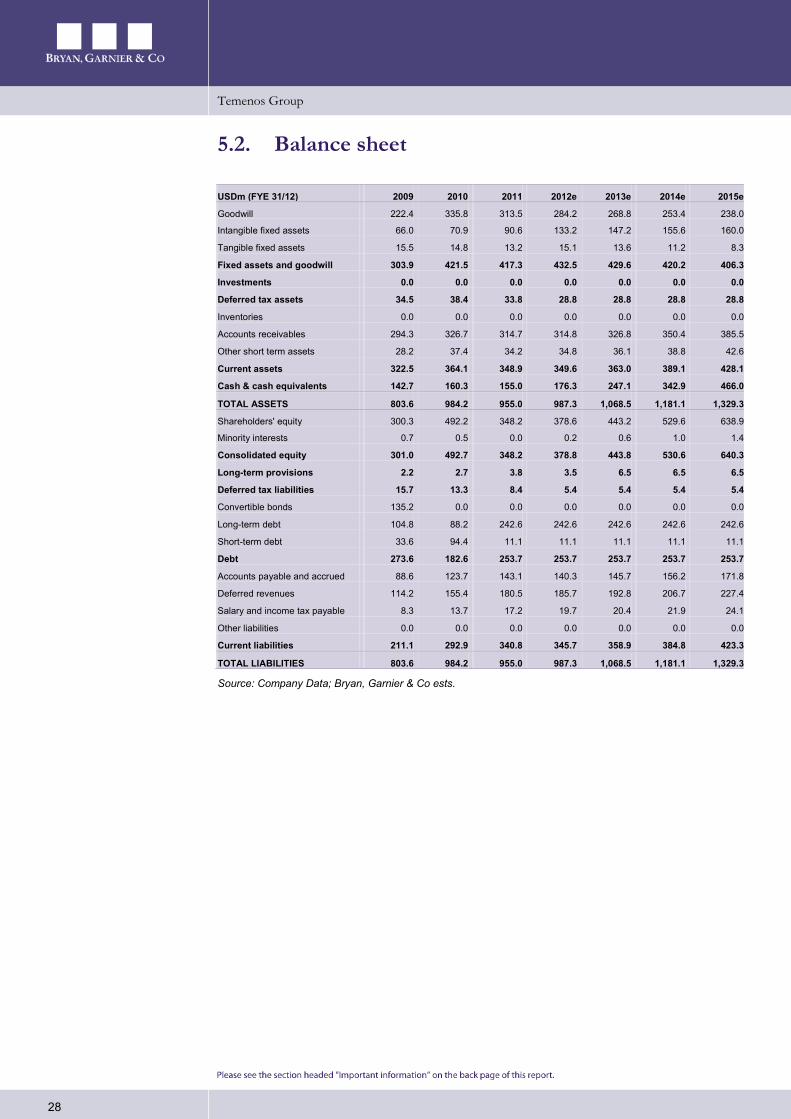
5.2. Balance sheet
USDm (FYE 31/12) 2009 2010 2011 2012e 2013e 2014e 2015e
Goodwill 222.4 335.8 313.5 284.2 268.8 253.4 238.0
Intangible fixed assets 66.0 70.9 90.6 133.2 147.2 155.6 160.0
Tangible fixed assets 15.5 14.8 13.2 15.1 13.6 11.2 8.3
Fixed assets and goodwill 303.9 421.5 417.3 432.5 429.6 420.2 406.3
Investments 0.0 0.0 0.0 0.0 0.0 0.0 0.0
Deferred tax assets 34.5 38.4 33.8 28.8 28.8 28.8 28.8
Inventories 0.0 0.0 0.0 0.0 0.0 0.0 0.0
Accounts receivables 294.3 326.7 314.7 314.8 326.8 350.4 385.5
Other short term assets 28.2 37.4 34.2 34.8 36.1 38.8 42.6
Current assets 322.5 364.1 348.9 349.6 363.0 389.1 428.1
Cash & cash equivalents 142.7 160.3 155.0 176.3 247.1 342.9 466.0
TOTAL ASSETS 803.6 984.2 955.0 987.3 1,068.5 1,181.1 1,329.3
Shareholders' equity 300.3 492.2 348.2 378.6 443.2 529.6 638.9
Minority interests 0.7 0.5 0.0 0.2 0.6 1.0 1.4
Consolidated equity 301.0 492.7 348.2 378.8 443.8 530.6 640.3
Long-term provisions 2.2 2.7 3.8 3.5 6.5 6.5 6.5
Deferred tax liabilities 15.7 13.3 8.4 5.4 5.4 5.4 5.4
Convertible bonds 135.2 0.0 0.0 0.0 0.0 0.0 0.0
Long-term debt 104.8 88.2 242.6 242.6 242.6 242.6 242.6
Short-term debt 33.6 94.4 11.1 11.1 11.1 11.1 11.1
Debt 273.6 182.6 253.7 253.7 253.7 253.7 253.7
Accounts payable and accrued 88.6 123.7 143.1 140.3 145.7 156.2 171.8
Deferred revenues 114.2 155.4 180.5 185.7 192.8 206.7 227.4
Salary and income tax payable 8.3 13.7 17.2 19.7 20.4 21.9 24.1
Other liabilities 0.0 0.0 0.0 0.0 0.0 0.0 0.0
Current liabilities 211.1 292.9 340.8 345.7 358.9 384.8 423.3
TOTAL LIABILITIES 803.6 984.2 955.0 987.3 1,068.5 1,181.1 1,329.3
Source: Company Data; Bryan, Garnier & Co ests.
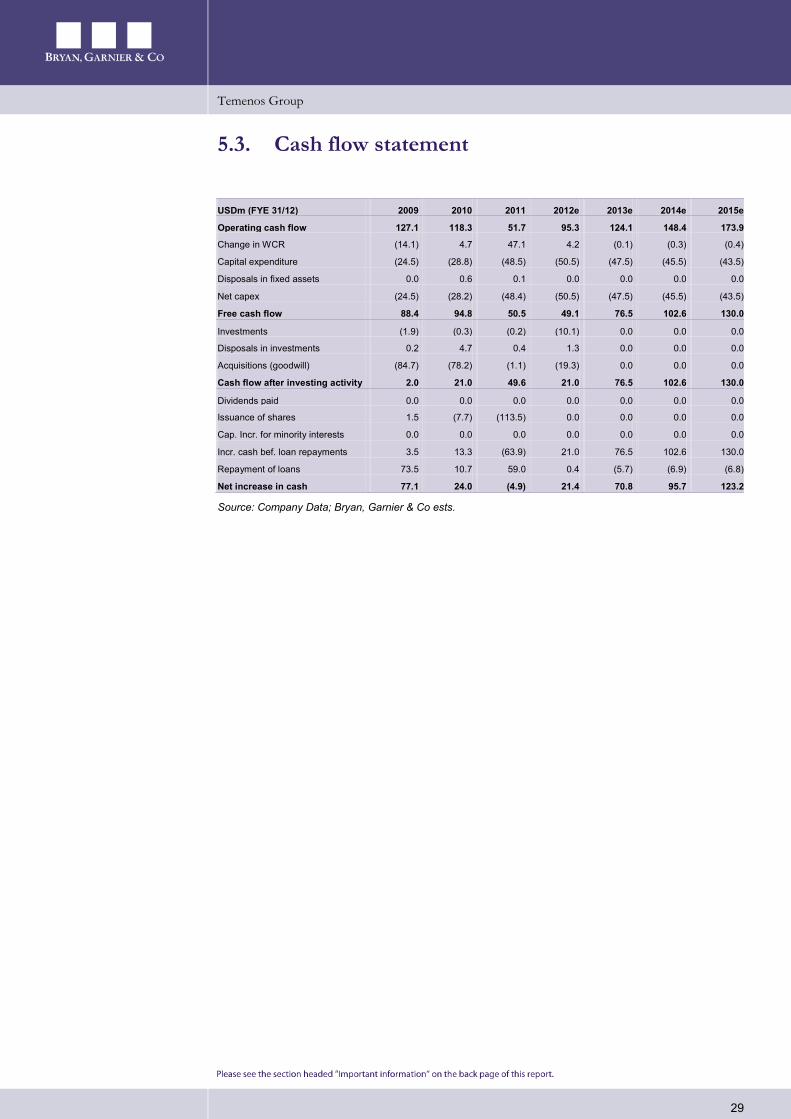
Temenos Group
29
5.3. Cash flow statement
USDm (FYE 31/12) 2009 2010 2011 2012e 2013e 2014e 2015e
Operating cash flow 127.1 118.3 51.7 95.3 124.1 148.4 173.9
Change in WCR (14.1) 4.7 47.1 4.2 (0.1) (0.3) (0.4)
Capital expenditure (24.5) (28.8) (48.5) (50.5) (47.5) (45.5) (43.5)
Disposals in fixed assets 0.0 0.6 0.1 0.0 0.0 0.0 0.0
Net capex (24.5) (28.2) (48.4) (50.5) (47.5) (45.5) (43.5)
Free cash flow 88.4 94.8 50.5 49.1 76.5 102.6 130.0
Investments (1.9) (0.3) (0.2) (10.1) 0.0 0.0 0.0
Disposals in investments 0.2 4.7 0.4 1.3 0.0 0.0 0.0
Acquisitions (goodwill) (84.7) (78.2) (1.1) (19.3) 0.0 0.0 0.0
Cash flow after investing activity 2.0 21.0 49.6 21.0 76.5 102.6 130.0
Dividends paid 0.0 0.0 0.0 0.0 0.0 0.0 0.0
Issuance of shares 1.5 (7.7) (113.5) 0.0 0.0 0.0 0.0
Cap. Incr. for minority interests 0.0 0.0 0.0 0.0 0.0 0.0 0.0
Incr. cash bef. loan repayments 3.5 13.3 (63.9) 21.0 76.5 102.6 130.0
Repayment of loans 73.5 10.7 59.0 0.4 (5.7) (6.9) (6.8)
Net increase in cash 77.1 24.0 (4.9) 21.4 70.8 95.7 123.2
Source: Company Data; Bryan, Garnier & Co ests.
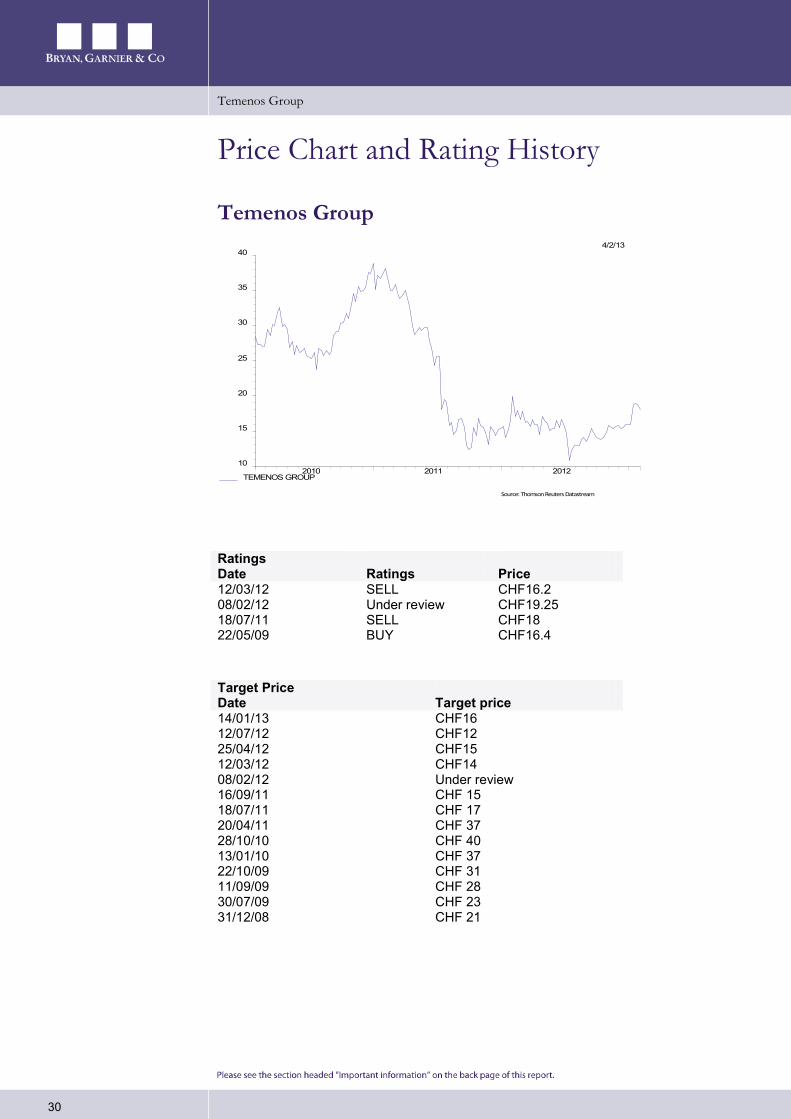
Temenos Group
30
Price Chart and Rating History
Temenos Group
Ratings Date Ratings Price 12/03/12 SELL CHF16.2 08/02/12 Under review CHF19.25 18/07/11 SELL CHF18 22/05/09 BUY CHF16.4
Target Price Date Target price 14/01/13 CHF16 12/07/12 CHF12 25/04/12 CHF15 12/03/12 CHF14 08/02/12 Under review 16/09/11 CHF 15 18/07/11 CHF 17 20/04/11 CHF 37 28/10/10 CHF 40 13/01/10 CHF 37 22/10/09 CHF 31 11/09/09 CHF 28 30/07/09 CHF 23 31/12/08 CHF 21
4/2/13
2010 2011 201210
15
20
25
30
35
40
TEMENOS GROUP
Source: Thomson Reuters Datastream
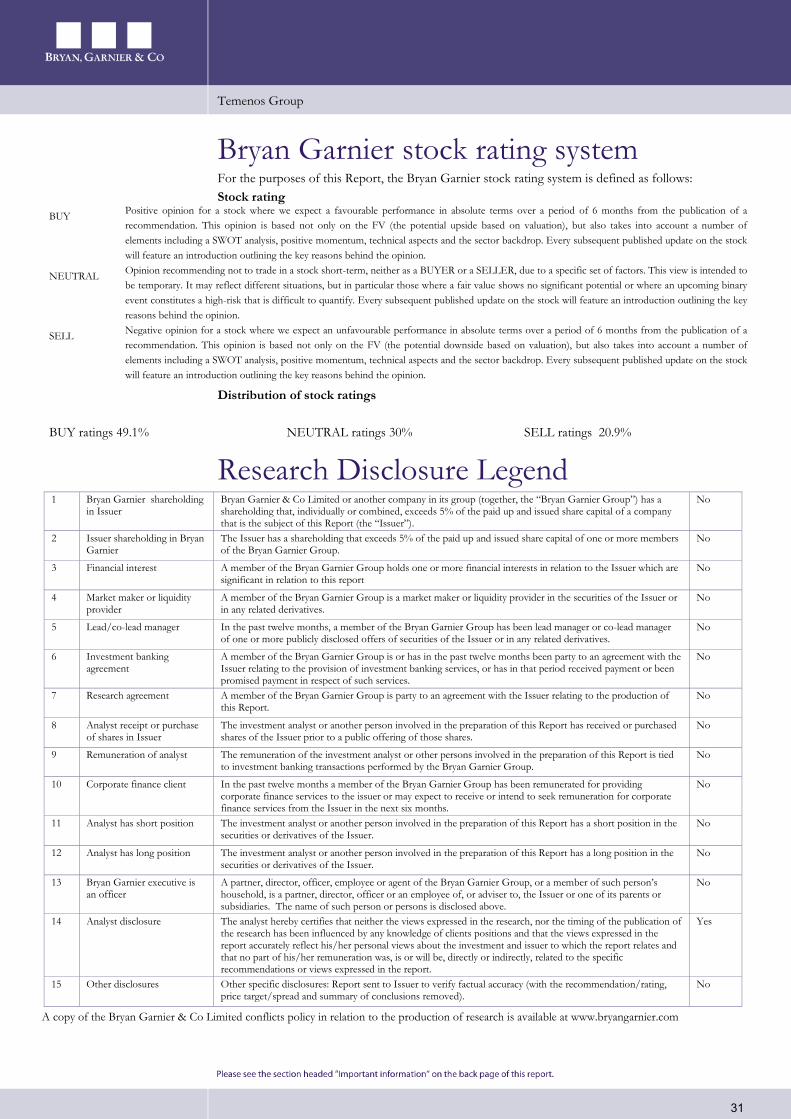
Temenos Group
31
Bryan Garnier stock rating system For the purposes of this Report, the Bryan Garnier stock rating system is defined as follows: Stock rating
BUY Positive opinion for a stock where we expect a favourable performance in absolute terms over a period of 6 months from the publication of a recommendation. This opinion is based not only on the FV (the potential upside based on valuation), but also takes into account a number of elements including a SWOT analysis, positive momentum, technical aspects and the sector backdrop. Every subsequent published update on the stock will feature an introduction outlining the key reasons behind the opinion.
NEUTRAL Opinion recommending not to trade in a stock short-term, neither as a BUYER or a SELLER, due to a specific set of factors. This view is intended to be temporary. It may reflect different situations, but in particular those where a fair value shows no significant potential or where an upcoming binary event constitutes a high-risk that is difficult to quantify. Every subsequent published update on the stock will feature an introduction outlining the key reasons behind the opinion.
SELL Negative opinion for a stock where we expect an unfavourable performance in absolute terms over a period of 6 months from the publication of a recommendation. This opinion is based not only on the FV (the potential downside based on valuation), but also takes into account a number of elements including a SWOT analysis, positive momentum, technical aspects and the sector backdrop. Every subsequent published update on the stock will feature an introduction outlining the key reasons behind the opinion.
Distribution of stock ratings
BUY ratings 49.1% NEUTRAL ratings 30% SELL ratings 20.9%
Research Disclosure Legend
1 Bryan Garnier shareholding in Issuer
Bryan Garnier & Co Limited or another company in its group (together, the “Bryan Garnier Group”) has a shareholding that, individually or combined, exceeds 5% of the paid up and issued share capital of a company that is the subject of this Report (the “Issuer”).
No
2 Issuer shareholding in Bryan Garnier
The Issuer has a shareholding that exceeds 5% of the paid up and issued share capital of one or more members of the Bryan Garnier Group.
No
3 Financial interest A member of the Bryan Garnier Group holds one or more financial interests in relation to the Issuer which are significant in relation to this report
No
4 Market maker or liquidity provider
A member of the Bryan Garnier Group is a market maker or liquidity provider in the securities of the Issuer or in any related derivatives.
No
5 Lead/co-lead manager In the past twelve months, a member of the Bryan Garnier Group has been lead manager or co-lead manager of one or more publicly disclosed offers of securities of the Issuer or in any related derivatives.
No
6 Investment banking agreement
A member of the Bryan Garnier Group is or has in the past twelve months been party to an agreement with the Issuer relating to the provision of investment banking services, or has in that period received payment or been promised payment in respect of such services.
No
7 Research agreement A member of the Bryan Garnier Group is party to an agreement with the Issuer relating to the production of this Report.
No
8 Analyst receipt or purchase of shares in Issuer
The investment analyst or another person involved in the preparation of this Report has received or purchased shares of the Issuer prior to a public offering of those shares.
No
9 Remuneration of analyst The remuneration of the investment analyst or other persons involved in the preparation of this Report is tied to investment banking transactions performed by the Bryan Garnier Group.
No
10 Corporate finance client In the past twelve months a member of the Bryan Garnier Group has been remunerated for providing corporate finance services to the issuer or may expect to receive or intend to seek remuneration for corporate finance services from the Issuer in the next six months.
No
11 Analyst has short position The investment analyst or another person involved in the preparation of this Report has a short position in the securities or derivatives of the Issuer.
No
12 Analyst has long position The investment analyst or another person involved in the preparation of this Report has a long position in the securities or derivatives of the Issuer.
No
13 Bryan Garnier executive is an officer
A partner, director, officer, employee or agent of the Bryan Garnier Group, or a member of such person’s household, is a partner, director, officer or an employee of, or adviser to, the Issuer or one of its parents or subsidiaries. The name of such person or persons is disclosed above.
No
14 Analyst disclosure The analyst hereby certifies that neither the views expressed in the research, nor the timing of the publication of the research has been influenced by any knowledge of clients positions and that the views expressed in the report accurately reflect his/her personal views about the investment and issuer to which the report relates and that no part of his/her remuneration was, is or will be, directly or indirectly, related to the specific recommendations or views expressed in the report.
Yes
15 Other disclosures Other specific disclosures: Report sent to Issuer to verify factual accuracy (with the recommendation/rating, price target/spread and summary of conclusions removed).
No
A copy of the Bryan Garnier & Co Limited conflicts policy in relation to the production of research is available at www.bryangarnier.com
London Dowgate Hill House 14-16 Dow Gate Hill London EC4R 2SU Tel: +44 (0) 207 332 2500 Fax: +44 (0) 207 332 2559 Authorised and regulated by the Financial Services Authority (FSA)
Paris 26 Avenue des Champs Elysées 75008 Paris Tel: +33 (0) 1 56 68 75 00 Fax: +33 (0) 1 56 68 75 01 Regulated by the Financial Services Authority (FSA) and l’Autorité des Marchés Financiers (AMF)
New York 750 Lexington Avenue New York, NY 10022 Tel: +1 (0) 212 337 7000 Fax: +1 (0) 212 337 7002 FINRA and SIPC member
Geneva rue de Grenus 7 CP 2113 Genève 1, CH 1211 Tel +4122 731 3263 Fax+4122731 3243 Regulated by the Swiss Federal Banking Commission
New Delhi The Imperial Hotel Janpath New Delhi 110 001 Tel +91 11 4132 6062 +91 98 1111 5119 Fax +91 11 2621 9062
Important information This independent investment research report (the “Report”) was prepared by Bryan Garnier & Co Limited and is being distributed only to clients of Bryan Garnier & Co Limited (the “Firm”). Bryan Garnier & Co Limited is authorised and regulated by the Financial Services Authority (the “FSA”) and is a member of the London Stock Exchange. This Report is provided for information purposes only and does not constitute an offer, or a solicitation of an offer, to buy or sell relevant securities, including securities mentioned in this Report and options, warrants or rights to or interests in any such securities. This Report is for general circulation to clients of the Firm and as such is not, and should not be construed as, investment advice or a personal recommendation. No account is taken of the investment objectives, financial situation or particular needs of any person. The information and opinions contained in this Report have been compiled from and are based upon generally available information which the Firm believes to be reliable but the accuracy of which cannot be guaranteed. All components and estimates given are statements of the Firm, or an associated company’s, opinion only and no express representation or warranty is given or should be implied from such statements. All opinions expressed in this Report are subject to change without notice. To the fullest extent permitted by law neither the Firm nor any associated company accept any liability whatsoever for any direct or consequential loss arising from the use of this Report. Information may be available to the Firm and/or associated companies which are not reflected in this Report. The Firm or an associated company may have a consulting relationship with a company which is the subject of this Report. This Report may not be reproduced, distributed or published by you for any purpose except with the Firms’ prior written permission. The Firm reserves all rights in relation to this Report. Past performance information contained in this Report is not an indication of future performance. The information in this report has not been audited or verified by an independent party and should not be seen as an indication of returns which might be received by investors. Similarly, where projections, forecasts, targeted or illustrative returns or related statements or expressions of opinion are given (“Forward Looking Information”) they should not be regarded as a guarantee, prediction or definitive statement of fact or probability. Actual events and circumstances are difficult or impossible to predict and will differ from assumptions. A number of factors, in addition to the risk factors stated in this Report, could cause actual results to differ materially from those in any Forward Looking Information.
Disclosures specific to clients in the United Kingdom This Report has not been approved by Bryan Garnier & Co Limited for the purposes of section 21 of the Financial Services and Markets Act 2000 because it is being distributed in the United Kingdom only to persons who have been classified by Bryan Garnier & Co Limited as professional clients or eligible counterparties. Any recipient who is not such a person should return the Report to Bryan Garnier & Co Limited immediately and should not rely on it for any purposes whatsoever.
Notice to US investors This research report (the “Report”) was prepared by Bryan Garnier & Co. Ltd. for information purposes only. The Report is intended for distribution in the United States to “Major US Institutional Investors” as defined in SEC Rule 15a-6 and may not be furnished to any other person in the United States. Each Major US Institutional Investor which receives a copy of this Report by its acceptance hereof represents and agrees that it shall not distribute or provide this Report to any other person. Any US person that desires to effect transactions in any security discussed in this Report should call or write to our US affiliated broker, Bryan Garnier Securities, LLC. 750 Lexington Avenue, New York NY 10022. Telephone: 1-212-337-7000. This Report is based on information obtained from sources that Bryan Garnier & Co. Ltd. believes to be reliable and, to the best of its knowledge, contains no misleading, untrue or false statements but which it has not independently verified. Neither Bryan Garnier & Co. Ltd. and/or Bryan Garnier Securities LLC make no guarantee, representation or warranty as to its accuracy or completeness. Expressions of opinion herein are subject to change without notice. This Report is not an offer to buy or sell any security. Bryan Garnier Securities, LLC and/or its affiliate, Bryan Garnier & Co. Ltd. may own more than 1% of the securities of the company(ies) which is (are) the subject matter of this Report, may act as a market maker in the securities of the company(ies) discussed herein, may manage or co-manage a public offering of securities for the subject company(ies), may sell such securities to or buy them from customers on a principal basis and may also perform or seek to perform investment banking services for the company(ies).
Bryan Garnier Securities, LLC and/or Bryan Garnier & Co. Ltd. are unaware of any actual, material conflict of interest of the research analyst who prepared this Report and are also not aware that the research analyst knew or had reason to know of any actual, material conflict of interest at the time this Report is distributed or made available.