Embed Size (px)
Citation preview
P.J. KuikmanK.W. van der HoekA. SmitK. Zwart
Alterra-rapport 1217, ISSN 1566-7197
Update of emission factors for nitrousoxide from agricultural soils on the basisof measurements in the Netherlands
Rapport 1217.qxp 2-2-2007 12:22 Pagina 1

1
Update of emission factors for nitrous oxide from agricultural soils on the basis of measurements in the Netherlands

Alterra-rapport 1217 2
In opdracht van SenterNovem in Utrecht onder nummer 0377-05-02-02-001 en bestelnummer 4700009579 met de titel “Update van emissiefactoren voor lachgas uit landbouwbodems op basis van Nederlandse meetseries”

3
Update of emission factors for nitrous oxide from agricultural soils on the basis of measurements in the Netherlands P.J. Kuikman1 K.W. van der Hoek2 A. Smit1 K. Zwart1 1 Alterra 2 RIVM
Alterra-rapport 1217 Alterra, Wageningen, 2006
Alterra-rapport 1217 4
REFERAAT P.J. Kuikman, K.W. van der Hoek, A. Smit & K. Zwart, 2006. Update of emission factors for nitrous oxide from agricultural soils on the basis of measurements in the Netherlands. Alterra report 1217. 40 pp.; 4 fig.; 13 tab.; 59 refs. Emissions of nitrous oxide (N2O) in the Netherlands are reported to the UNFCCC on the basis of a country specific methodology. In this study we have identified and analysed the values for emission factors in measurement from in the Netherlands in the period 1993 – 2003. The overall averaged emission factor extracted from over 86 series of one year measurements on nitrous oxide emission from agricultural fields in the Netherlands is 1.1% and a weighed average for soil types is 1.01%. The average for mineral soils is 0.88%. The calculated emission factors are lower than the value suggested by the IPCC for EF1 for fertilizer and animal manure of 1.25%. We recommend to use a value of 1.0% for EF1 and to use corrections of EF1 in reporting the use of fertilizers without nitrate (0.5%), for subsurface application of manure (1.5%) and for fertilizer, manure and urine on organic soils (2.0%). Key words: country specific, emission, emission factor, Netherlands, nitrous oxide ISSN 1566-7197 This report is available in digital format at www.alterra.wur.nl. A printed version of the report, like all other Alterra publications, is available from Cereales Publishers in Wageningen (tel: +31 (0) 317 466666 ). For information about, conditions, prices and the quickest way of ordering see www.boomblad.nl/rapportenservice
© 2006 Alterra P.O. Box 47; 6700 AA Wageningen; the Nederlands
Tel.: (0317) 474700; fax: (0317) 419000; e-mail: [email protected] Niets uit deze uitgave mag worden verveelvoudigd en/of openbaar gemaakt door middel van druk, fotokopie, microfilm of op welke andere wijze ook zonder voorafgaande schriftelijke toestemming van Alterra. Alterra aanvaardt geen aansprakelijkheid voor eventuele schade voortvloeiend uit het gebruik van de resultaten van dit onderzoek of de toepassing van de adviezen. [Alterra-rapport 1217/december/2006]

Contents
Summary 7
1 Introduction 9
2 Objectives, approach and methodology 13 2.1 Objectives 13 2.2 Approach 13 2.3 Methodology 14
3 Database for emission factors for nitrous oxide in the Netherlands 17
4 Emissions of nitrous oxide in literature 19 4.1 International information 19 4.2 Direct N2O emissions 19
4.2.1 N2O emissions from synthetic fertilizers 19 4.2.2 N2O emissions from animal manures 20 4.2.3 N2O emissions with incorporation of animal manure into soil 21 4.2.4 N2O emission from animal excreta during grazing 24
4.3 Conclusions 24 4.3.1 Synthetic fertilizer 25 4.3.2 Application of animal manure 25
5 Emissions of nitrous oxide from measurement in the Netherlands 27
6 Conclusions 31 6.1 Emissions from fertilizer use 31 6.2 Soil type 32 6.3 Low ammonia emitting manure application 32 6.4 Emissions from grassland versus arable land 32
7 Recommendations 33
References 35
Appendices 1 N2O emissions and values for emission factors from measurements in the
Netherlands over the period 1993 – 2003 with average values, number of observations (n), median and minimum and maximum for emission factors for synthetic fertilizer with and without nitrate and animal manure, cropland or grassland and clay, sand or peat soil 39


Alterra-rapport 1217 7
Summary
Emissions of nitrous oxide in the Netherlands are reported on the basis of a country specific methodology. In this study we have identified and analysed the values for emission factors in measurement from in the Netherlands in the period 1993 – 2003. The overall averaged emission factor extracted from over 86 series of one year measurements on nitrous oxide emission from agricultural fields in the Netherlands is 1.1% and a weighed average for soil types is 1.01%. The average for mineral soils is 0.88%. The range of emissions is from -0.57 to 6.80 % and the median in our series of measurements is 0.60%. The calculated emission factors are lower than the value suggested by the IPCC for EF1 for fertilizer and animal manure of 1.25%. We recommend the following for the emission factor for application of fertilizer and manure (EF1) on the basis of this deskstudy: 1. To continue to use a value of 1.0% for the EF1 for emission of nitrous oxide
from fertilizers that contain nitrate based on the average emission from synthetic fertilizer application in the Netherlands of 0.77 – 0.88%.
2. To scale this value for EF1 of 1% for specific conditions of additions of nitrogen to agricultural land by multiplying this value by 0.5 or multiplying this value by 1.5 or 2 for the following conditions and practices: • To correct EF1 for emission of nitrous oxide from non – nitrate containing
mineral fertilizers of 0.5% for all soil types including organic soils. • To correct EF1 for emission of nitrous oxide from the application of animal
manure using the range of technologies of incorporation practiced in the Netherlands as required by law by 1.5.
• To correct the emission factor EF1 for emission of nitrous oxide from the application of synthetic fertilizer and manure and of urine from grazing on organic soils with a factor of 2.
3. To not discriminate between soil types clay and sand or between emissions from grassland and arable land in the Netherlands despite differences in emissions in our analyses; evidence for such differentiation is not sufficient and inconclusive.

Alterra-rapport 1217 9
1 Introduction
Nitrous oxide (N2O) is a greenhouse gas which is 170 times more effective than CO2 and which is also involved in the destruction of stratospheric ozone. Nitrous oxide is responsible for ca. 6% of the total increase of the greenhouse effect over the past 100 years. Anthropogenic activity is for 64% responsible for the annual N2O increase of 0.2% in the trophosphere; 90% of which is contributed by agriculture. In order to provide an estimate of current rates and to assess change in emission rates, the United Nations Framework Convention on Climate Change (UNFCC) demands a national emission inventory of all anthropogenic sources of greenhouse gasses, using comparable methods. For that purpose protocols have been developed by the International Panel on Climate Change (IPCC, 1997) to provide a methodology for calculating emissions using defined emission factors. Agricultural emissions are assumed to be derived from three principal sources: • Direct emissions from soil nitrogen (N); e.g. applied fertilizers and manure, N
from animal deposition, mineralization of crop residues, biological N fixation and cultivation of soils of high organic content.
• Emissions from animal waste systems • Indirect emissions from N lost from agricultural systems, e.g. through leaching,
runoff or atmospheric deposition. Based on a number of activities (N sources) which can be derived from national and international (FAO) databases and using emission factors (EF) for each of these activities, the national contribution to the global N2O emission can relatively easily be calculated. Major inputs for the direct and indirect emissions are the total national N application and animal numbers, respectively. Advantages of such an approach are simplicity and transparency, global coverage and its use of readily available information. Major disadvantages are the large uncertainties regarding the EF and the impossibility to distinguish various regions or specific measurements to reduce the national emission. The major activities, their default EF and the EF used in the Netherlands are given in Table 1. The Netherlands uses to some extent country specific values for emission factors that are based on Kroeze (1994). The current Dutch reporting system uses information that was provided by Kroeze. Her report concludes that N2O emissions due to the use of manure as fertilizer are, in general, within the samen range as these due to the use of synthetic fertilizers referring to Bouwman (1994) and that emission from application of manure and fertilizers on organic soils are higher than from application on mineral soils. She assumed that injection of animal manure gives rise to higher N2O emissions than surface application on both mineral and organic soils. The methodology has been described by Spakman et al. (2003) and was used until 2004. Van der Hoek et al. (2006) has evaluated and will make suggestion to refine

Alterra-rapport 1217 10
this Spakman methodology for use as of 2005 to prepare the NIR. This new approach is comprehensive and specifies emission factors for distinguished synthetic fertilizers with low emissions of nitrous oxide, specific and mandatory incorporation of animal manure and cultivation of histosols. The values attributed to these emission factors however are largely based on experimental data that were available in international literature in the early nineties. Between 1994 and today many projects have yielded new and additional data on emissions of nitrous oxide both in the Netherlands as in neighboring countries. In the Netherlands these projects included the work by Velthof (1997) and a series of so – called ROB projects (Kuikman et al., 2002, 2004; Velthof et al. 2002, Dolfing et al., 2002; 2004; see for an overview of report www.robklimaat.nl at SenterNovem in Utrecht). Table 1. Emission factors (%) for agricultural soil and other agricultural sources
N source EF (IPCC default)
Range EF Netherlands1
1. Direct soil emissions Mineral soils
Organic soils
Synthetic fertilizers2 % of N input 1.25 0.2-2.25 12 1-22
Animal manure applications3
% of N-input 1.25 0.2-2.25 1-23 2
Enhanced biological N fixation
% of N input 1.25 0.2-2.25 1
Crop residues % of N input 1.25 0.2-2.25 1 Cultivated histosols4 Kg N ha-1 year-1 8 (or 5) 2-15 4.74
2. Indirect emissions Waste from housed animals % of N excreted 0.1 0-0.2 AWMS Anaerobic lagoons % of N excreted 0.1 0-0.2 Liquid systems % of N excreted 0.1 0-0.1 Daily spread % of N excreted 0 No range Other systems % of N excreted 0.5 No range Solid storage & dry lot % of N excreted 2.0 0.5-3.0 Excreta deposited during grazing5
% of N excreted 2.0 0.5-3.0 1-25 1-25
3. Indirect emissions Atmospheric deposition % of N emitted 1.0 0.2-2.0 Nitrate leaching & run off % of N emitted 2.5 0.2-12.0
1 see also report on reporting system by van der Hoek et al., 2006 (in preparation) 2 values for EF1 in the Netherlands are 0.5% for non – nitrate containing synthetic fertilizer and 1.0% for other
synthetic fertilizers and value for EF1 of nitrate containing synthetic fertilizer on organic soils are 2% 3 values for EF1 in the Netherlands for manure application are 2% for the mandatory incorporation of animal
manure with varying application techniques and 1% for surface application on mineral soils only if applicable 4 this value for this emission factor (EF5) holds for the current area of organic soils and at the current rate of
oxidation of peat; any change in area, location or in oxidation rate (as result of soil water management) will change this emission.
5 values for EF2 for N in animal excreta during grazing in the Netherlands are 1% for faeces and 2% for urine on all soils
Alterra-rapport 1217 11
These so – called ROB (Reduction Programme on non – CO2 greenhouse gases, see www.robklimaat.nl) measurements were set up with the objective to identify and underpin the effect of mitigation options for nitrous oxide. All of these series as most other series of measurements carried out in the Netherlands always had treatments where the current management (Common Agricultural Practice) was carried out to compare with mitigation options. Most of these measurements have been reported and have resulted in a value for an emission factor. However, this information has not been used until now in the determination of the values for emission factors. Other countries in Europe are currently adapting their national inventory methodology and use country specific information as well (reference to ISPRA meeting; see Nature 434 news). Also, IPCC is reviewing and rewriting its 1996 Revised Guidelines where a methodology with emission factors is outlined to be used in the preparation of national inventories (IPCC, 2006). This document with the 2006 Revised Guidelines is not available yet. However, any information will be based on international literature available to date. The most recent review is by Bouwman et al. (2002) with aggregated information from 846 N2O emission measurements in agricultural fields. These authors and concluded that the global mean fertilizer induced emission for N2O amount to 0.9% of the N applied. This is considerably lower that the current IPCC default value for the emission factor for direct emissions of N2O from animal manure and synthetic fertilizer.

Alterra-rapport 1217 13
2 Objectives, approach and methodology
2.1 Objectives
This desk study has:
• disclosed documented and published knowledge and data from the ROB Agro research projects (www.robklimaat.nl) and other relevant measurements in the Netherlands
• determined so called country specific emission factors and values for these emission factors for the Netherlands on the basis of the identified measurements and data
• suggested where appropriate adaptations of the current set of emissions factors and their assigned values for nitrous oxide (see table 1)
• reduced uncertainties that are associated with the current emissions factors and the assigned values.
2.2 Approach
Within this desk study we have searched for relevant datasets on measurements on nitrous oxide from agricultural fields and manure and fertilizer addition in the Netherlands. We further searched for relevant data in neighboring countries such as Germany, Denmark, Sweden, England and Belgium that may represent agricultural practice in the Netherlands from 1990 until today. Such representative activities include:
o Application of fertilizer and separation of nitrate containing fertilizers versus fertilizers without nitrate
o Animal manure and different practices to apply the manure without restrictions (spreading) or with restrictions following from the need to reduce the ammonia volatilization (incorporation techniques) and the urine and manure during grazing
This study has used documented and reported series of measurements in either scientific reviewed literature or in reports of projects (sees www.robklimaat.nl at SenterNovem). All the data presented in this report can be found in public sources. The data we have used match the following criteria: • Measurements lasted for a whole year at least • Measurements were from field trials

Alterra-rapport 1217 14
• Field trials included management that would fit regular agricultural advice on fertilization, included common agricultural practices and follow legislation
• Data included a value for emissions in a so – called no – treatment plot as to identify the real farmer induced emission of nitrous oxide by subtracting this background emission from the treatment emission.
Fertilizer → with nitrate → grassland → Arable land → without nitrate → grassland → Arable land → Other Animal manure → spreading (breedwerpig) → grassland → → arableland → spring → → autumn → incorporation/injection → grassland → arableland → spring → autumn Grazing →grassland → urine → faeces
1 The effect of renovation of grassland by ploughing on emissions of nitrous oxide was not considered in the analysis in this study. Figure 1 Selection of activities and sources that lead to an direct emission of nitrous oxide from agricultural soil for which we need a value for an emission factor (EF1 conform IPCC)1. 2.3 Methodology
Our methodology included the following steps:
Step 1 – For reference we have used the values attributed to emission factors as given in table 1 (see Spakman et al., 2003; Kroeze, 1994)
Step 2 – We have defined more specific emission factors for fertilizer and manure on land use (i.e. grassland and arable land), soil type or management (i.e. manure application) (see figure 1)
Step 3 – We coupled more specific emission factors to measurement series from research project in the Netherlands
Step 4 – From the measurements series in our dataset we have extracted values for specific emission factors and identified whether necessary activity data would be available from statistics or otherwise.
Step 5 – We assessed values for emission factors that would fit a country specific Dutch approach with the following options:

Alterra-rapport 1217 15
• Use IPCC default Tier 1 (considered not relevant here)
• Continue to use a NL specific methodology and improve the underpinning of that method and selected values for emission factors
• Use country specific values for emission factors on the basis of available data through simply averaging the available data
• Use country specific values for emission factors which are based on standard emission factors with simple correction factors such as multiplying by 2 for activities with documented higher emissions or reducing by 0.5 for activities with documented lower emissions.
• Use country specific values for emission factors on the basis of weighed averages such that relative importance of activities are reflected and adequately represent conditions in agriculture in the Netherlands
It is clear that the level of complexity will be higher as we go from straightforward averaging available data to using weighed averages.


Alterra-rapport 1217 17
3 Database for emission factors for nitrous oxide in the Netherlands
In this section we present the considerations for establishing a database with emissions from field trials. In this database we have allocated specific measurements to specific agricultural activities. The database with references to specific sources and publications is available at Alterra. National emissions of N2O are usually calculated on the basis of IPCC emission factors for specific sources of N2O and with the option of country-specific modifications. We identified four common features of Dutch agriculture that could lead to significant differences from IPCC default N2O emission factors: 1. Establishment of managed pastures on peat soils where moisture and available
carbon may raise denitrification activity. 2. A range of techniques of subsurface application of animal manure in the soil in
order to avoid NH3 volatilization, possibly leading to higher denitrification activity.
3. The general use of nitrate-containing fertilizer (calcium ammonium nitrate) on both pastures and arable land, leading to a more readily available mineral N pool for denitrification.
Several measurement series could not be directly used in our analyses such as those series where both animal manure and synthetic fertilizer was applied within one growing year. This is a common agricultural practice on grassland in the Netherlands. From these measurements one cannot separate the emissions due to the application of synthetic fertilizer from the emissions due to application of animal manure. Common in the Netherlands also is to manage pastures such that fertilization is applied and combined with grazing that is not continuous in the growing season. We have selected measurements where grazing was excluded to analyse the emissions from application of fertilizer and manure. Series where measurements did not cover at least one year were excluded from the analysis. A total of 85 studies was compiled. All studies consist of a comparison of managed fields to control (no N applied) fields. Field measurements were always performed during at least one year. All series consist of measurement that used closed chambers and the use of a photo acoustic gas monitor. We express emission factors as percentage of nitrogen applied in a given year that is emitted as N2O during that year. Results were compared to (i) IPCC default values, and (ii) an international review of published N2O emission factors (Bouwman et al., 2002).


Alterra-rapport 1217 19
4 Emissions of nitrous oxide in literature
4.1 International information
Recently, Kroeze et al. (1999) have estimated global N2O emissions for the period 1500-1994, using the IPCC methodology and a simple atmospheric model. They found good agreement between calculated and observed trend, despite the great uncertainties in emission factors. Therefore, it is somewhat surprising that many countries with Sweden as an exception (Staaf, 2004) claim that their emissions as calculated using IPCC default values are probably too high (Boeckx & van Cleemput, 2001; Freibauer, 2003) and several authors refer to uncertainties in the default emission factors (e.g. Brown et al 2001). However, if we consider the wide range of sources and consider that several (natural) sources may be substantial (i.e. cultivation of organic soils with 8 kg N – 16 kg N as N2O in temperate and tropical conditions; industrial sources) it may well be possible that EF for some conditions are too high and others too low. Reliable emission factors are critical for an adequate calculation of the national N2O emission (Brown et al, 2001, De Klein et al, 2001, Freibauer, 2003. Brown et al (2001) found that the overall uncertainty of the UK N2O emission was 64%, of which two of the three EF’s from the direct soil emission had the largest component (EF1 and EF3). Then what is a reliable emission factor? An emission factor is reliable if it applies for actual management and is a good predictor for actual emissions. Due to high variation over time (impact of weather and interactions of weather and management) an emission factor could be reliable if such a factor applies for average years (say 5 year periods of continued management)1. For that reason emission factors have been investigated in a large number of international studies and reviewed recently by de Klein et al. (2001). Their results are presented below. 4.2 Direct N2O emissions
4.2.1 N2O emissions from synthetic fertilizers
De Klein et al (2001) concluded that the EF for synthetic fertilizers were very well within the default IPCC range, although some higher emissions, up to 12% were reported for a few short term studies using nitrate based fertilizers. N2O emissions
1 The uncertainty in nitrous oxide emissions comes from the wide range of emissions found in a series of
experiments across the globe and gives the uncertainty in any year for a specific addition of fertilizer (activity). These experiments and monitoring projects cover different growing seasons, crops, management and above all different weather years. So, the uncertainty is not just uncertainty in terms of spatial variability (soil type, longitude, crop etc) but also temporal variability. The latter leads to uncertainty in emissions for consecutive years despite similar management, crop and soil. Different years with identical series of activities may result in different emission patterns and overall annual emission Keith Smith suggests that 5 - 10 years are needed to cover all variability due to weather effects (Dobbie and Smith, 2000). In that sense the uncertainty may drop very much as long as we consider longer time frames than single years.

Alterra-rapport 1217 20
from urea were sometimes substantially lower than from nitrate based fertilizers, but also far higher emissions from urea have been reported. The EF for calcium ammonium nitrate, the predominant artificial fertilizer in the Netherlands, is three times higher than the default IPCC value. Dobbie and Smith (2002) have compared the effect of different forms of N fertilizer on N2O emission in Scotland. They concluded that ammonium nitrate gave higher emissions than urea under rather wet and cool conditions (e.g. spring). Under rather dry conditions (e.g. summer applications) there was no difference. In contrast, Yamulki et al (1998) did not find any relation of N2O emission and environmental factors as rainfall or soil mineral N. They suggested that specific physical and biochemical processes in the excreta that they used, might override the environmental factors. The EF they found for dung and (artificial) urine ranged from 0.004-0.53% and from 0.02-1% respectively. Vermoesen et al. (1996) found an EF for urine in Belgium ranging from 0.1-2.4 while Poggeman et al. (1995) and Flessa (1996) have reported values of 0.4 and 0.47%, respectively, under German conditions. Table 2. Emission factors (emission per unit nitrogen applied corrected for emission without application of nitrogen) for synthetic fertilizers to agricultural land (After de Klein et al, 1999)
Fertilizer type and form Emission factor (% of N applied (range)
n Average Median SD
Ammonium chloride 0.06 1.0 3 0.6 0.6 0.5 Ammonium nitrate 0.08 5.0 10 1.1 0.6 1.2 Ammonium sulphate 0.2 2.8 9 0.9 0.8 0.8 Calcium ammonium nitrate < 0.1 8.3 7 3.0 2.3 2.8 Calcium nitrate <0.1 12.0 8 4.5 3.2 5.0 Urea <0.1 1.9 13 0.6 0.5 0.6
The N2O emissions in relation to the fertilizer application for a number of European countries were compared by Staaf (2004). For Denmark, Germany and the Netherlands the N2O emission amounted to 0.84%, 0.82% and 0.88%, respectively of the N applied. For the UK, he found no relationship at all. An Australian study (Dalal et al 2003), showed that 1.6% of the nitrogen fertilizer use was emitted. Kamman et al (1998) have studied the effect of different managements on grasslands in Germany. They also found a positive relation between N application rates and N2O emission and a positive effect of high water table depths. The EF of 0.9% which they found at the highest application rate was comparable to the value that Velthof et al (1996) reported for the Netherlands. 4.2.2 N2O emissions from animal manures
A summary of the results of De Klein et al (2001) is given in Table 3. The highest emissions from animal wastes were measured in arable soil, especially when applied in combination with fertilizer N, but most of the reported emission factors for applied manure or manure-fertilizer combinations were within the IPCC default range. Mogge et al (1999) found higher emission rates on arable land than on (relative

Alterra-rapport 1217 21
dry) grassland in Northern Germany. Furthermore, they compared an arable rotation field fertilized with mainly FYM and a field under continuously maize, fertilized with cattle slurry. Losses from the FYM field were twice as high as those from slurry, which reflected a higher microbial biomass content and the higher pH at the FYM fields. Table 3 Emission factors (emission per unit nitrogen applied corrected for emission without application of nitrogen) for nitrogen applied with animal wastes to agricultural land (After de Klein et al, 1999)
Emission factor (% of N applied
Range n Average Median SD Pasture All studies 0.01 4.7 22 0.6 0.2 1.0 Waste only studies 0.01 1.9 18 1.03 0.1 0.5 Arable All studies 0.2 6.7 20 1.6 0.9 1.6 Waste only studies 0.2 2.7 9 0.8 0.8 0.8
4.2.3 N2O emissions with incorporation of animal manure into soil
In the Netherlands as of 1995 application of animal manure is required to be incorporated into the soil rather than surface spread. This application technique is developed to minimize ammonia volatilization and required by legislation. Here we report on a literature search on the N2O emissions from application of animal manure. As few reports exist, we present two experiments on laboratory scale and other experiments from field trials in UK, Germany, Sweden and Canada. Laboratory experiments In an experiment on laboratory scale Sommer et al. (1996) used pig manure in three treatments (surface applied, mixed with the soil, and injection) and two soil water contents (table 4). Sommer et al. (1996) concluded that the differences among treatments were insufficient to support any hypothesis on effects of a specific application technique on N2O emissions. Table 4 Effect of application technique on emission of nitrous oxide following addition of pig manure in an incubation study (Sommer et al., 1996)
Soil water content Treatment 0-7 hour 0-16 days 240 g/kg Surface 40 264 Mixed 45 226 Injected 54 368 100 g/kg Surface 12 103 Mixed 15 92 Injected 5 108
Dendooven et al (1998) used also pig manure in an experiment on laboratory scale. They compared surface application and injection (table 5). He concluded that injection of pig slurry into a dry soil was an acceptable alternative to its application to the soil surface as it reduced the volatilization of NH3 by 90%, while denitrification

Alterra-rapport 1217 22
and production of N2O and CO2 were not significantly affected. Flessa and Beese (1999) also reported on higher emissions upon incorporation of animal manure than upon surface application in laboratory experiments. Table 5 Effect of application technique on emission of nitrous oxide following addition of pig manure in an incubation study (Sommer et al., 1996)
Addition1
Method Yes/no
C2H2 CO2 prod
Kg C/ha/dayN2O prod gN/ha/day
NH3 emission gN/ha/day
35 ml H2O Surface applied No 1,16 24 8 Surface applied + 10% 1,57 87 6 35 ml pig manure
Surface applied No 5,65 28 425
Surface applied + 10% 6,21 172 347 35 ml pig manure
Injected No 5,66 28 61
Injected + 10% 6,16 177 20 1 In all situations 300 mg NO3-N was added. Measurements lasted 15 days Field experiments Data on N2O emissions from field trials are available from UK, Sweden and Germany. Chadwick (1997) reported on field scale experiments on grassland in the UK. They used two treatments: surface application and injection (table 6). The following table summarizes the results. Chadwick (1997) notes that N2O emissions are not a single value, but they are dependent on the weather conditions and the water content of the soil. The absolute level of N2O emissions is rather low. In a recent presentation Chadwick et al. (2005) gives N2O emissions from surface applied and injected manure. The latter treatment has N2O emissions twice as high as the surface applied manure. Chadwick (personal communication with K.W. van der Hoek, august 2005) emphasizes that injection primarily enhances N2O emissions when the weather is rainy and the soil is wet. Table 6 Effect of surface application (S) and injection (I) of manure on emission of nitrous oxide and NH3 (Chadwick, 1997)
March 72 days June 89 days November 117 days 25 S 25 I 25 S 25 I 50 S 25 S 25 I Total N applied Kg N/ha 72 76 44 44 124 62 62 Total TAN applied Kg N/ha 44 47 32 32 56 28 28 NH3 loss % of TAN 59 34 94 19 N2O loss % of total
N 0,04 0,10 0,11 0,02 0,21 0,11 0,08
N2O loss % of TAN 0,07 0,17 0,15 0,03 0,47 0,24 0,19 25 S = 25 m3/ha, surface broadcast 25 I = 25 m3/ha, injected 50 S = 50m3/ha, surface broadcast Field scale experiments with cattle manure in Germany were published by Clemens et al. (1997). They used two types of cattle manure: original and separated (table 7). Replica 1 + 2 were measured during 320 hours whereas measurements for replica 3 + 4 lasted for 480 hours (table 7). Clemens et al. (1997) conclude that neither

Alterra-rapport 1217 23
different application techniques nor the separation of manure seems to have an effect on absolute N2O emissions. Table 7 Effect of surface application (banded versus injected) and two kinds of cattle manure on N2O emission (Clemens et al., 1997)
Replica 1 Replica 2 Replica 3 Replica 4 Zero plot -2,5 3,2 6,4 9,6 Mineral fertilizer
6,4 8,9 19,1 36,9
Broadcasted Original 30,6 38,2 54,1 Separated 12,7 18,5 28,0 52,2 Banded Original 13,4 26,7 42,0 48,4 Separated 18,5 24,8 32,5 33,1 Injected Original 8,3 8,9 17,8 42,6 Separated 9,6 30,6 38,8 49,6
1 N2O emission is expressed as mg N2O-N per m2 during the first 320 hours Field scale experiments with pig manure in Sweden were published by Weslien et al. (1998). They compared during 1992-1994 the N2O emissions from 4 different application methods: trenching, shallow injection, band spreading + harrowing, and band spreading. They concluded that incorporation did not show statistically significant larger nitrous oxide emissions. Another experiment with pig slurry on field scale in Sweden was reported by Ferm et al. (1999). During the measurements the weather was dry and warm in Sandby, whereas in Skivarp rainfall occurred just after the manure applications (table 8). Table 8 Effect of application mnthod (broadcasting versus band spreading) and with or without irrigation of cattle manure on N2O emission (Ferm et al., 1999)
Farm location Technique Kg NH3-N/ha Kg N2O-N/ha1
Sandby Broadcasting 37 0,04 Idem with irrigation 0,03 Band spreading 28 0,22 Idem with irrigation 0,16 Skivarp Broadcasting 19 0,49 Idem with harrowing 2 0,91 Band spreading 0,8 0,82 Idem with harrowing 0,3 0,67 Control 0,33
1 N2O emission is cumulative over a 16 days period after manure application 2 During the NH3 measurements weather was dry in Sandby and precipitation was 31 mm in Skivarp A third experiment in Sweden is mentioned in the Annual Report 2004 of the Swedish Institute of Agricultural and Environmental Engineering (Rodhe and Pell, 2005). Measurements were made after the spreading of slurry on leys using band spreading or shallow injection into closed slots. Nitrous oxide emissions were greatest using injection into closed slots, corresponding to nitrogen losses of 0.75 kg per hectare, compared with 0.20 kg for band spreading. The latter is more comparable to the Dutch ‘sleepvoet’ application.
Alterra-rapport 1217 24
Field scale experiments on the N2O emissions of broadcasted and injected manure are carried out in the western part of Canada2 but results not available. 4.2.4 N2O emission from animal excreta during grazing
Internationally, reported emission factors range between 0.1 and 4% of the N returned in pastures and for laboratory studies even as high as 7-14%. The highest values were found in intensively managed dairy pastures in the UK and the Netherlands. The EF for sheep or beef cattle is generally lower than for dairy cows. Although the data for New Zealand were within the average range, the EF used for New Zealand was reduced from 2% (IPCC default) to 1%, based on a study where the measured EF was only 0.2%. In a literature review on emissions from cattle urine van Groenigen et al. (in press, 2005) conclude that the default emission factor for urine at 2% is too high and on the basis of 31 studies calculates 1.3% instead. After he further limited the data used to field trials only and to real urine in stead of artificial urine he derives a value of 0.9%. 4.3 Conclusions
The current IPCC methodology to calculate national N2O emission rates is simple, transparent and uses readily available input sources. The possibility to simulate the long term atmospheric N2O concentration reasonably well with a simple model indicates that on a global scale the current IPCC methodology is adequate to predict changes in the N2O concentration in the atmosphere. Bouwman et al. (2002) aggregated information from 846 N2O emission measure-ments in agricultural fields and concluded that the global mean fertilizer induced emission for N2O amount to 0.9% of the N applied. This aggregated estimate is considerably lower (22%) than the default value proposed by IPCC of 1.25% of all N applied (IPCC, 1997). This information stimulates a rather widespread feeling that the IPCC default emission factors are too high for a number of countries (Staaf, 2004). Yet, hard evidence from the international literature to support this feeling is lacking. There is, however, a wide range in the reported emission factors, even within a single country. For that reason it is evident that a rather wide range in national N2O emissions can be found, both from studies based on the IPCC methodology and computer simulations studies. However, to study the effect in regions within countries and from specific decisions and practices in day to day agricultural (farm) management and to address effects of specific activities (including measurements on N2O) to reduce the national N2O emission, the current methodology is too simple. For that purpose, specific regional
2 details are requested from R. Farrell, Department of Soil Science, University of Saskatchewan (not received)
Alterra-rapport 1217 25
emission factors and/or emission factors related to specific production conditions are required. 4.3.1 Synthetic fertilizer
The emission factor for the commonly used synthetic fertilizer ammonium nitrate in agriculture in the Netherlands is according tot New Zealand research too low and more likely twice up to four times as high as the default IPCC EF1. However, our data from measurements in the Netherlands do not support this observation (table 12) Ammonium sulphate without nitrate indeed has a much lower emission factor than ammonium nitrate (2 – 4 times less). This supports a lower EF1, AS than EF1, AN for the Netherlands. 4.3.2 Application of animal manure
In the international literature we have not found strong indications that specific methodologies to reduce ammonia losses through volatilization following manure application gives higher N2O emissions. The only reports on this are from (Norway), from Sweden and from IGER (UK) in a presentation by Chadwick; the latter shows an on average 1.5 to 2 times higher emission following application. However, these emissions have been determined in short time periods directly following application of manure only and do not cover a whole year of measurements. The following is concluded from our findings in international literature and personal communications with relevant researchers in Sweden and England: • Theoretically, it can be argued that conditions during manure incorporation are
favorable for enhanced N2O emissions and especially when soils are wet and when the manure is incorporated deep into closed pockets in the soil
• Experiments on laboratory and field scale show equal or higher N2O emissions following manure incorporation compared to surface spreading application usually in a short time period following application
• Not all publications with similar N2O emissions report the relevant weather and soil conditions such as moisture and rainfall and this makes it difficult to draw straightforward conclusions
• There is information on both equal sized and enhanced N2O emissions following manure incorporation; the conclusion is that enhanced N2O emissions are promoted by wet weather and wet soils and when manure is placed deeper in closed pockets in the soil and in the absence of such conditions emissions may not differ from those following surface application.

Alterra-rapport 1217 27
5 Emissions of nitrous oxide from measurement in the Netherlands
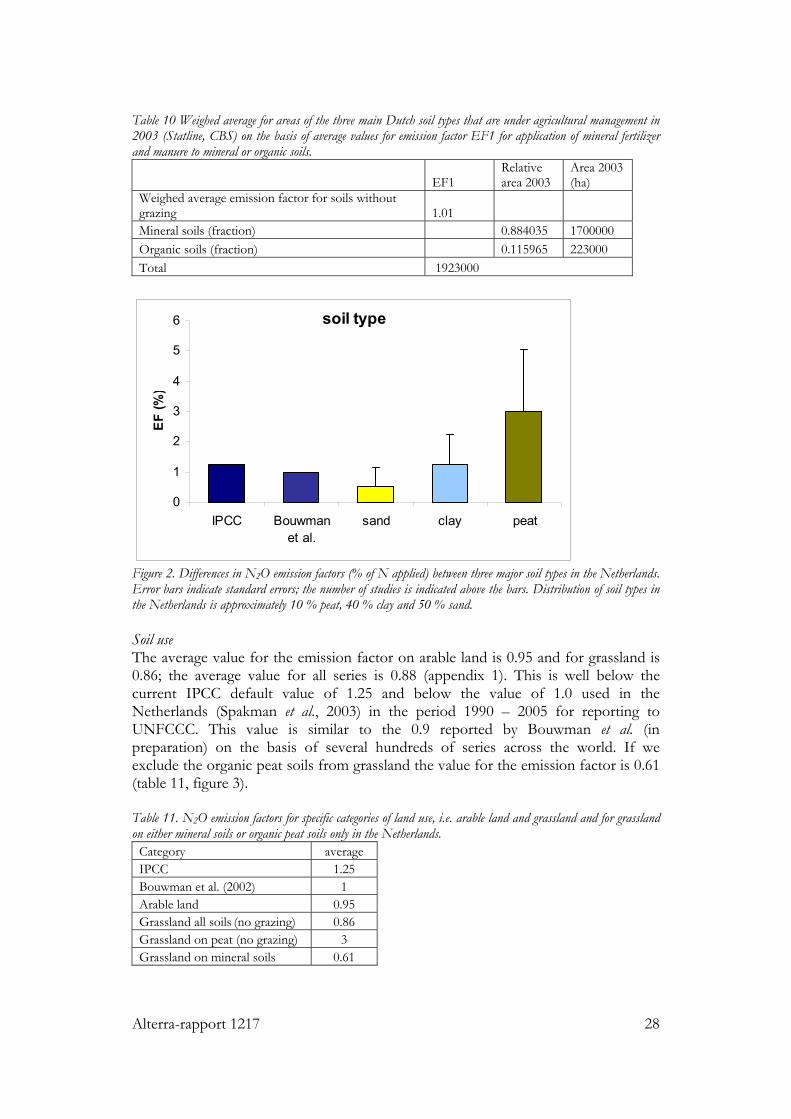
In this chapter, we report on an assessment of the documented and published data on measurements of nitrous oxide emission from agricultural soils in the Netherlands over the period 1993 – 2004. We followed the approach as outlined in chapter 2. We identified and analyzed 86 datasets which met our criteria (1 year of measurements at least, field trial, ‘no fertilization’ treatment as control, management to follow Common Agricultural Practice). These trials included additions of synthetic fertilizer, animal manure and combinations of both. The latter have been included in the analyses as these do reflect Common Agricultural Practice in the Netherlands. However, these series of combined application of synthetic fertilizer and animal manure do not allow extracting a straightforward emission factor to fit the IPCC concept of emission factors for specific sources and activities. Emission factors have been allocated to specific activities by a selection of relevant data and excluding others (table 9). Emission of nitrous oxide expressed as emission factor ranges from -0.57 – 6.80%3. The average value for the emission factor on the basis of all data sets is 1.1%. (see appendix 1). If we exclude series with grazing from the analysis (i.e. urine application or actual grazing in dairy farming), the emission factor for series without grazing and only fertilizer or manure application drops to 0.9% (see appendix 1). Soil type The average value for the emission factor for fertilizer and manure on sand was 0.53 and on clay 1.24. Emission factors for animal manure and fertilization of peat soils were on average 3 times higher than IPCC default values and emission factors for other soil types in the Netherlands (table 9, figure 2). This was to a large part attributable to application of manure and fertilizer in managed grasslands on peat (figure 3). The average weighed emission factor taking into account the differences in area for three major soil types is 1.01 (table 10). Table 9. N2O emission factors for major soil types in the Netherlands without grazing. Distribution of soil types in the Netherlands is approximately 10 % peat, 40 % clay and 50 % sand.
Category average IPCC 1.25 Bouwman et al. (2002) 1 Sand 0.53 Clay 1.24 Peat 3
3 This negative values indicates net consumption of N2O rather then a net production (and emission) of N2O in this series.
Alterra-rapport 1217 28
Table 10 Weighed average for areas of the three main Dutch soil types that are under agricultural management in 2003 (Statline, CBS) on the basis of average values for emission factor EF1 for application of mineral fertilizer and manure to mineral or organic soils.
EF1 Relative area 2003
Area 2003 (ha)
Weighed average emission factor for soils without grazing 1.01 Mineral soils (fraction) 0.884035 1700000 Organic soils (fraction) 0.115965 223000 Total 1923000
soil type
0
1
2
3
4
5
6
IPCC Bouwmanet al.
sand clay peat
EF (%
)
Figure 2. Differences in N2O emission factors (% of N applied) between three major soil types in the Netherlands. Error bars indicate standard errors; the number of studies is indicated above the bars. Distribution of soil types in the Netherlands is approximately 10 % peat, 40 % clay and 50 % sand. Soil use The average value for the emission factor on arable land is 0.95 and for grassland is 0.86; the average value for all series is 0.88 (appendix 1). This is well below the current IPCC default value of 1.25 and below the value of 1.0 used in the Netherlands (Spakman et al., 2003) in the period 1990 – 2005 for reporting to UNFCCC. This value is similar to the 0.9 reported by Bouwman et al. (in preparation) on the basis of several hundreds of series across the world. If we exclude the organic peat soils from grassland the value for the emission factor is 0.61 (table 11, figure 3). Table 11. N2O emission factors for specific categories of land use, i.e. arable land and grassland and for grassland on either mineral soils or organic peat soils only in the Netherlands.
Category average IPCC 1.25 Bouwman et al. (2002) 1 Arable land 0.95 Grassland all soils (no grazing) 0.86 Grassland on peat (no grazing) 3 Grassland on mineral soils 0.61

Alterra-rapport 1217 29
Grassland versus arable land The application of manure on grassland gives a lower emission factor (0.52) than application of manure on arable land (0.99) whereas the reversed holds for application of mineral fertilizer with 0.77 on grassland and 0.88 on arable land. All values from measurements in the Netherlands less than 1 and lower than current default IPCC values and most less than the values reported by Bouwman et al. (2002).
Figure 3. Differences in N2O emissions (% of N applied) from mineral soils due to types of fertilizer and manure injected into the soil. Error bars indicate standard errors. Fertilizer application A substantial lower value for the emission from synthetic fertilizer without nitrate of 0.43 is calculated (table 12, figure 4). Such a difference is also reported by Stehfest and Bouwman (2006). Using nitrate-containing fertilizer doubled the emission factor from 0.43% to 0.84% for synthetic fertilizer without nitrate. Yet, this is still less than the IPCC default value of 1.25% (figure 4, table 12). Table 12. N2O emission factors for fertilizers (with or without nitrate) and manure application; manure application is in all cases subsurface application.
Category average IPCC 1.25 Bouwman et al (2002) 1 Manure arable land 0.99 Manure grass land 0.52 Fertilizer grass with nitrate 0.77 Fertilizer grass without nitrate (ammonium fertilizer) 0.43 Fertilizer arable nitrate 0.88 Combination of manure and fertilizer on grass within one year 0.68
Land use (grazing excluded)
0 0.5
1 1.5
2 2.5
3 3.5
4 4.5
IPCC Boumans et al
arableland
grasslandall soils*
grassland peat
(nograzing)
grassmineral
soils
EF (%)

Alterra-rapport 1217 30
Manure application Subsurface application of animal manure in the Netherlands is required by law. These subsurface applications on mineral soils led to emission factors equal to and mostly lower than IPCC default emissions and were not different from the values for synthetic fertilizer application (figure 4, table 11). On arable land, the application of animal manure (without addition of synthetic fertilizer) has a higher emission factor of 0.91% than has the application of synthetic fertilizer (0.77) (table 12). In the data we have there are no measurements for traditional surface spreading of animal manure. Therefore we cannot discriminate between surface spreading and sub surface application of animal manure.
management
0
0.5
1
1.5
2
2.5
IPC
C
Bou
man
set
al
man
ure
arab
le la
ndm
anur
egr
ass
land
ferti
lizer
gras
sfe
rtiliz
ergr
ass
ferti
lizer
arab
le
man
ure
and
ferti
lizer
EF (%
)
Figure 4. Differences in N2O emissions factors (% of N applied) due to land use, and an area-weighted composite emission factor. Error bars denote standard errors; the number of studies is indicated above the bars. Common agricultural practices Agriculture in the Netherlands often uses a combination of synthetic fertilizer and animal manure applied in sequence and combination is any year on grassland. The values for emission factors in these conditions are similar as those for application of synthetic fertilizer or manure only and less than 1% (table 13). Table 13 Emission of common agricultural practices for synthetic fertilizer, animal manure or combinations as is common agricultural practice in the Netherlands for mineral soils only
Mineral soils Emission factor (EF)
Average n Median Minimum Maximum
Synthetic fertilizer (with nitrate) 0.77 27 0.50 0.02 3.85 Animal manure only (without autumn application) 0.80 14 0.74 -0.57 2.16 Animal manure (autumn application) 1.40 3 0.50 0.10 3.60 Animal manure in combination with synthetic fertilizer 0.68 21 0.50 0.13 3.15 Common Ag Practice ‘mineral soils’ 0.77 63 0.51 -0.57 3.85 Common Ag Practice ‘incorporation animal manure’ 0.78 38 0.56 -0.57 3.60 Common Ag Practice ‘animal manure only arable land’ 0.91 17 0.73 -0.57 3.6

Alterra-rapport 1217 31
6 Conclusions
Emissions of nitrous oxide on the basis of measurements in the Netherlands are within the range of values identified by IPCC 1996 Good Practice Guidance and agree with internationally accepted and reported values. The calculated emission factors are well within the range of the IPCC default emission factors EF1 for fertilizer and animal manure. We have selected field trials on the basis of the following criteria:
o measurement campaigns have continued for one full year at least o measurements were carried out in field trials preferably under common
agricultural practice management according to Dutch fertilizer advice o data on N input and yield were available o data were reported in scientific literature or in reports available through web
sites of individual research organisations or at www.robklimaat.nl of SenterNovem
o data on emission of nitrous oxide were corrected for emission from non – fertilized soils
The overall averaged emission factor extracted from over 86 series of one year measurements on nitrous oxide emission from agricultural fields in the Netherlands is 1.1% and a weighed average recognizing different soil types of 1.01%. The average for mineral soils is 0.88%. The range of emissions is from -0.57 to 6.80 % (table 8) and the median in our series of measurements is 0.60%. The high values in our data are generally the result of application of manure in autumn and wet conditions in spring. Autumn after September 15th application of animal manure is not allowed on sandy soils and less likely or frequent to occur on clayey soils due to new legislation. 6.1 Emissions from fertilizer use
Ammonium nitrate is a commonly used mineral fertilizer in the Netherlands. Nitrate is a component that may give rise to high emissions of nitrous oxide. A documented measure to mitigate emissions of nitrous oxide is the use of fertilizers without nitrate i.e. sulphuric acid ammonium in stead of nitrate containing fertilizers such as CAN (Calcium Ammonium Nitrate). Especially in wet conditions usually found in spring fertilizers without nitrate may induce less nitrous oxide than fertilizers that contain nitrate. Data on the annual use of these non – nitrate containing mineral fertilizers are available in fertilizer statistics reports on the basis of enquiries among farmers. Our analysis shows that fertilizers without nitrate yield lower emissions of nitrous oxide. In xx series of measurements where both nitrate containing fertilizer and fertilizer without nitrate were applied the calculated emission factor for non nitrate containing fertilizers was around 50% lower than for the commonly used fertilizer CAN.

Alterra-rapport 1217 32
6.2 Soil type
Our analysis shows that emissions of nitrous oxide are lowest in sandy soils, higher in clay soils and highest in soils containing high fractions of organic matter (peat soils). The emission factors varied from 0.57% to 1.38% and 3.68%, respectively. We consider it not feasible to attribute such soil type specific emission factors to specific agricultural activities our analyses does not reveal whether the available data are equally reflecting all relevant soil types and probably do not represent Dutch soils well enough without further analysis. 6.3 Low ammonia emitting manure application
Following requirement by law (since 1995) it is now common practice in the Netherlands to use manure application techniques that limit ammonia volatilization during and following application. Many have indicated that this technology where manure is injected or mechanically incorporated into the soil may indeed lower volatilization of ammonia but induce higher denitrification rates including higher nitrous oxide emissions (reference). The Netherlands for this reason has used an emission factor for nitrous oxide from animal manure application that is twice that of application of fertilizer (2% versus 1%). We have found rather little evidence for this assumed relationship. However, the few studies that exist indeed point to higher emissions and if not, emissions for either surface application of manure or injection of manure do not differ. But more important, the emission of animal manure in the Netherlands from measurements in the period 1995 – 2004 does not show distinct higher emissions than emissions from synthetic fertilizer. As such we conclude that there is no substantial evidence to support a twice higher emission factor for the by Dutch legislation required methods of application of animal manure. 6.4 Emissions from grassland versus arable land
We have found differences between emissions from grassland and arable land. We have found indications that the hypothesis from Velthof et al. (2003) that preferred application of synthetic fertilizer to arable land and animal manure to grassland would result in less emissions. Manure on arable land gave higher values than synthetic fertilizer for the emission factor. We have not completed our analysis on this issue because several measurements on autumn application of manure were included. This practice may not be continued in the near future.

Alterra-rapport 1217 33
7 Recommendations
We recommend the following for the emission factor for application of fertilizer and manure (EF1) on the basis of this desk study: 4. To use a value of 1.0% for the EF1 for emission of nitrous oxide from fertilizers
that contain nitrate; this is based on the average emission from synthetic fertilizer application in the Netherlands of 0.77 – 0.88% (this study), a value on the basis on analysis of global measurements of 0.9% (Bouwman, 2002) and the weighed average for all applications in the Netherlands of 1.01% (this study).
5. To use scale this value for EF1 of 1% for specific conditions of additions of nitrogen to agricultural land by multiplying this value by 0.5 or multiplying this value by 1.5 or 2 for the following conditions and practices: • To correct the EF1 for emission of nitrous oxide from non – nitrate
containing mineral fertilizers by 0.5; this sets the value EF1 at 0.5% for all soil types including organic soils. For such a correction for this type of synthetic fertilizers without nitrate, ample qualitative evidence is available both in measurements and in the international literature emissions.
• To correct the EF1 for emission of nitrous oxide from the application of animal manure using the range of technologies of incorporation practiced in the Netherlands as required by law by 1.5. We suggest that a higher emission is likely from assessing the available international literature. No data are available from measurements in the Netherlands on the effect of incorporation of animal manure versus surface spreading of manure on grassland or arable land. This gives the following three options: a) continue to use a value of 2% for incorporation of animal manure as is
used sofar in the Dutch methodology for reasons of consistency though scientific evidence for such a higher value of this emission factor is not available.
b) to not discriminate between the use of animal manure or synthetic fertilizer in general with a value of 1% for EF1; this is consistent with the data from the Netherlands in which application of animal manure through incorporation does not give higher emissions than does synthetic fertilizer.
c) use a correction of 1.5 to acknowledge the international literature and reflect higher emission of nitrous oxide from incorporation of animal manure versus surface spreading and use a value of 1.5% rather than 1.0% despite that quantification of such higher emissions is not well documented and an assessment whether the available data are relevant to Dutch agricultural practices is not available and not achievable within the framework of this specific study. We recommend option c. which sets the value for the EF1 at 1.5%.
• To correct the emission factor EF1 for emission of nitrous oxide from the application of synthetic fertilizer and manure and of urine from grazing on organic soils with a factor of 2. This is based on the observation that emissions from synthetic fertilizer and animal manure and urine added to

Alterra-rapport 1217 34
organic soils are clearly higher even after deduction of the high background emissions. High background due to oxidation and decomposition of peat have been accounted for is a country specific methodology for the emission of nitrous oxide from cultivation of organic soils.
6. To not discriminate between soil types clay and sand in the Netherlands despite differences in emissions in our analyses. We have not been able to determine whether these soil types have been properly represented in the dataset we have at hand.
7. We do not recommend differentiating the value of EF1 used for grassland and arable land and for synthetic fertilizer or animal manure at either grassland or arable land at this moment as evidence for such differentiation is not sufficient and inconclusive.
Alterra-rapport 1217 35
References
Allen, A.G., Jarvis, S.C. & Headon, D.M., 1996. Nitrous oxide emissions from soils due to inputs of nitrogen exreta return by livestock on grazed grassland in the U.K. Soil Biology and Biochemistry 28: 597-607 Ambus P., Christensen S. 1995. Spatial and seasonal nitrous-oxide and methane fluxes in Danish forest-ecosystems, grassland-ecosystems and agroecosystems. J. Environ. Qual. 24:993–1001 Boeckx, P. & Van Cleemput, O.,. 2001. Estimates of N2O and CH4 fluxes from agricultural lands in various regions in Europe. Nutrient Cycling and Agroecosystems 60, 35 – 47 Bouwman, A.F., L.J.M. Boumans & N.H. Batjes (2002) Modelling global annual N2O and NO emissions from fertilized fields. Global Biogeochemical Cycles 16: 1080 - 1088 Brown, L., Armstrong Brown, S., Jarvis, S.C., Syed, B., Goulding, K.W.T., Phillips, V.R, Sneath, R.W. & Pain, B.F., 2001. An inventory of nitrous oxide emissions from agriculture in the UK using the IPCC methodology: emission estimate, uncertainty and sensitivity analysis. Atmosheric Environment 31, 1439 – 1449 Chadwick, D.R., 1997. Nitrous oxide and ammonia emissions from grassland following applications of slurry: potential abatement practices. In: SC Jarvis, BF Pain (eds) Gaseous nitrogen emissions from grasslands. CAB International, Wallingford, UK. Pp 257-264 Chadwick D.R. et al., 2005. Cited by SC Jarvis in a presentation at DEFRA on xx.xx.2005. Personnel communication Christensen, S. 1983. Nitrous oxide emission from a soil under permanent grass: Seasonal and diurnal fluctuations as influenced by manuring and fertilization. Soil Biol. Biochem. 15:531–536 Clemens, J., R. Vandré, M. Kaupenjohann and H Goldbach. 1997. Ammonia and nitrous oxide emissions after landspreading of slurry as influenced by application technique and dry matter-reduction. II. Short term nitrous oxide emissions. Z. Pflanzenernähr. Bodenk. 160, 491-496. Clayton, H., McTaggart, I.P., Parker, J., Swan, L., Smith, K.A., 1997. Nitrous oxide emissions from fertilised grassland: a 2-year study of the effects of N fertiliser form and environmental conditions. Biology and Fertility of Soils, 25, 252 – 260. Dalal, R.C., Wang, W., Robertson, G.P. & Parton, W.J., 2003. Nitrous oxide emissions from Australian agricultural lands and mitigation options. Soil Science Society of America Journal 56, 95-102 Dobbie, K.E. & Smith, K.A, 2003. Impact of different forms of N fertilizer on N2O emissions from intensive grassland. Nutrient cycling in Agroecosystems 67, 37-46.
Alterra-rapport 1217 36
Dobbie, K.E., McTaggart, I.P., Smith, K.A., 1999. Nitrous oxide emissions from intensive agricultural systems: variations between crops and seasons, key driving variables, and mean emission factors. Journal of Geophysical Research, 104, 26891 – 26899. Dendooven, L., E. Bonhomme, R. Merckx and K. Vlassak, 1998. Injection of pig slurry and its effects on dynamics of nitrogen and carbon in a loamy soil under laboratory conditions. Biol Fertil Soils 27, 5-8 Duyzer,J.H. 1996. Measurements of the atmospheric emission of N2O from biogenic sources in general and by grassland ecosystems in particular. Dutch Nat. Res. Prog. on Glob. Air Poll. and Climate Change 410-100-054 Farrell, R. (2005) personal communication Ferm, M., A Kasimir-Klemedtsson, P Weslien and L Klemedtsson. 1999. Emission of NH3 and N2O after spreading of pig slurry by broadcasting or band spreading. Soil Use and Management 15, 27-33. Flessa H. Dörsch P. Beese F. König H. & Bouwman A.F.,1996. Influence of cattle wastes on nitrous oxide and methane fluxes in pasture land. Journal of Environmental Quality 25, 1366–1370 Flessa and Beese (1999) Journal Environmental Quality 29: 262 - 268 Freibauer, A., 2003. Regionalized inventory of biogenic greenhouse gas emissions from European agriculture. European Journal of Agronomy 19, 135-160 Gregorich, E.g., P. Rochette, A.J. VandenBygaart & D.A. Angers (2005) Greenhouse gas contributions of agricultural soils and potential mitigation practices in Eastern Canada. Soil Tillage Research 83: 53 – 72 Heinemeyer O., Kücke M., Kohrs K., Schnug E., Munch J.C., Kaiser E.-A., 1996. Nitrous oxide release from cultivated soils: Influence of different grass/clover ratios in fodder production. Transaction of the 9th Nitrogen Workshop, Braunschweig, 495-497. Helgason, B.L., H.H. Janzen, M.H. Chantigny, C. Drury, B.H. Ellert, E.G. Gregorich, R.L. Lemke, E. Pattey, P. Rochette & C. Wagner – Riddle (2005) Toward improved coefficients for predicting direct N2O emission from soil in Canadian agroecosystems. Nutrient Cycling Agroecosystems 72 (in press) IPCC (1997) IPCC Revised 1996 Guidelines IPCC (2003) Good Practice Guidance Jørgensen, R.N., Jørgensen, B.J., Nielsen, N.E., Maag, M. & Lind, A.M., 1997. N2O emission from energy crop fields of Miscanthus "Giganteus" and winter rye. Atmos. Environ. 31, 2899-2904.

Alterra-rapport 1217 37
JTI. 2004. Annual Report 2004. Uppsala, Sweden. Kaiser E.-A. Kohrs K., Kücke M., Schnug E., Munch J.C., Heinemeyer O., 1998. Nitrous oxide release from arable soil: importance of perennial forage crops. Biol Fertil Soils 28: 36-43. Kaiser, E.-A. & R. Ruser, 2000. Nitrous oxide emissions from arable soils in Germany – An evaluation of six long-term field experiments. J Plant Nutr Soil Sci 163: 249 – 260 Kamman, C., Gründhage, L., Müller, C., H Jacobi, S & Jäger, H.-J. . (1998) Seasonal variabilty and mitigation options for N2O emissions from differently managed grasslands. Environmental pollution 102, 179-186 Kroeze, C. (1994) Nitrous oxide (N2O). Emission inventory and options for control in the Netherlands. RIVM, Bilthoven, the Netherlands. Report no. 773001 004 Kroeze, C., Dumont, E. & Seitzinger, S.P. (unknown) New estimates of global emissions of N2O from rivers, estuaries and continental shelves (unknown) Mogge B., Kaiser E.-A., Munch J.-C. 1999. Nitrous oxide emissions and denitrification N-losses from agricultural soils in the Bornhöved Lake region: influence of organic fertilizers and land-use. Soil Biol. Biochem. 31: 1245-1252. Poggeman, S., Weisbach, F. & Künzel, U. (1995) N2O -Freisetzung von Excrementflecken auf dem Weideland. VDLUFA Schriftenreihe 40, 901-904 Poggemann S., Weißbach F., Küntzel U., 1997: N2O-Emissionen auf Schafweiden unterschiedlicher Bewirtschaftungsintensität. Tagungsband: Arbeitsgemeinschaft Grünland und Futterbau in der Gesellschaft f. Pflanzenbauwissenschaften,41, 28-30.august, Aulendorf Rochette, P., D.A. Angers, G. Bélanger, M.H. Chantigny, D. Prévost & G. Lévesque (2004) Emissions of N2O from Alfalfa and Soybean crops in Eastern Canada. Soil Science Society of America Journal 68: 493 – 506 Rochette, P., E. van Bochove, D. Prévost, D.A. Angers, D. Côté & N. Bertrand (2004) Soil carbon and nitrogen dynamics following application of pig slurry for the 19th consecutive year: II. Nitrous oxide fluxes and mineral nitrogen. Soil Sci Soc Am J. 64: 1396 – 1403 Rodhe, L. & M. Pell (2005) Closed – slot injection of slurry into ley. JTI rapport 337. 29 pp. Schmädeke et al. 1997. N2O emissions from an oilseed rape crop rotation as affected by N fertilization. Proceedings of the 7th International Workshop on Nitrous Oxide Emissions, 429-431 Sommer, S.G., R.R. Sherlock and R.Z. Khan. 1996. Nitrous oxide and methane emissions from pig slurry amended soils. Soil Biol. Biochem. 28, 1541-1544

Alterra-rapport 1217 38
Spakman, J., M.M.J. van Loon, R.J.K. van Auweraert, D.J. Gielen, J.G.J. Olivier and E.A. Zonneveld (2003) Method for calculation of greenhouse gas emissions. VROM–HIMH, The Hague, Report Series Emission Registration 37b. www.greenhousegases.nl Staaf, H. (2004) Methodology for calculating N2O emissions from agricultural soils in Sweden, remarks on national emission factors. Presentation Expert meeting on improving the quality of greenhouse gas emissions for category 4D, 21-22 October 2004, Ispra, Italy Stehfest, E. and L. Bouwman (2006) N2O and NO emission from agricultural fields and soils under natural vegetation: summarizing available measurement data and modeling of global annual emissions. Nutrient Cycling in Agriculture 74: 207 - 228 Van der Hoek, K.W., M.W. van Schijndel, P.J. Kuikman, 2006. Direct and indirect nitrous oxide emissions from agricultural soils, 1990 - 2003. Background document on the calculation method for the Dutch National Inventory Report. RIVM report 680125003, MNP report 500080003. Bilthoven Velthof, G.L., Jarvis S.C., Stein A., Allen A.G. & Oenema O. 1996. Spatial variability of nitrous oxide fluxes in mown and grazed grasslands on a poorly drained clay soil. Soil Biology and Biochemistry 28, 1215–1225. Velthof, G.L., Brader, A.B & Oenema, O (1996) Seasonal variations in nitrous oxide lossses from managed grasslands in the Netherlands. Plant and Soil 181, 263-274 Vermoesen A Cleemput O van & Hofman G 1997. Contribution of urine patches to the emission of nitrous oxide. In: SC Jarvis & BF Pain (eds.)Gaseous nitrogen emissions from grassland., CAB International Wallingford pp 189–194. Vermoesen A., C. J. Degroot, L. Nollet, P. Boeckx and O. Vancleemput, 1996. Effect of ammonium and nitrate application on the NO and N2O emission out of different soils. Plant & Soil 1, 181. 153-162 Weslien, P., L Klemedtsson, L Svensson, A Kasimir-Klemedtsson, and A Gustafsson. 1998. Nitrogen losses following application of pig slurry to arable land. Soil Use and Management 14, 200-208. Wulf, S., M. Maeting and J. Clemens. 2002. Application technique and slurry co – fermentation effects on ammonia, nitrous oxide, and methane emissions after spreading: II. Greenhouse gas emissions. J. Environmental Quality 31: 1705 - 1801 Yamulki, S., Jarvis, S, & Owen, P.,1998. Nitrous oxide emissions from excreta applied in a simulated grazing pattern. Soil Biology Biochemistry 30, 491-500

Alterra-rapport 1217 39
Appendix 1 N2O emissions and values for emission factors from measurements in the Netherlands over the period 1993 – 2003 with average values, number of observations (n), median and minimum and maximum for emission factors for synthetic fertilizer with and without nitrate and animal manure, cropland or grassland and clay, sand or peat soil
Emission factor EF
Conditions and factors average n median min max
Average measurements in all data series 1.10 86 0.62 -0.57 6.80 Average without grazing 0.87 75 0.56 -0.57 4.50 Average mineral soils 0.83 78 0.57 -0.57 3.85 Overall average mineral soils (no grazing) 0.75 71 0.51 -0.57 3.85 Average for grazing (urine application or actual grazing management on mineral soils) 1.70 7 1.70 0.80 7.00 Organic soils (without grazing) 3.00 4 2.90 1.70 4.50 Organic soils with grazing included 4.35 4 4.35 1.90 6.80
Soil type Sand including grazing 0.63 54 0.40 0.02 3.60 Clay including grazing 1.30 23 1.40 0.10 6.80 Peat including grazing 3.68 8 2.90 1.70 6.80 Sand (all fertilizer without grazing) 0.53 45 0.38 0.02 3.60 Clay (all fertilizer without grazing) 1.24 21 1.01 -0.57 3.85 Peat (all fertilizer without grazing) 3.00 4 2.90 1.70 4.50 Land use Grassland (excluding grazing en synthetic fertilizer without nitrate) 0.86 37 0.51 0.13 4.50 Grassland (excluding grazing only) 0.61 34 0.51 0.12 2.50
Arable land 0.95 30 0.71 -0.57 3.85
Fertilizer and manure
Synthetic fertilizer only 0.77 25 0.50 0.02 3.85 Animal manure only 0.91 15 0.75 -0.57 3.60 Synthetic fertilizer without nitrate 0.43 6 0.34 0.17 1.00 Synthetic fertilizer with nitrate 0.77 31 0.45 0.02 3.85

Alterra-rapport 1217 40