Embed Size (px)
Citation preview

Presented by
Ira Schwartz, Assistant Commissioner
Office of Accountability
New York State Education Department
1
March 4, 2011

Anticipating the “School Improvement Tsunami”
Setting New Graduation Rate Goal and Targets
Moving From Institutional to Individual Accountability
College and Career Readiness: Implications for Accountability
2

Changes Made During the 2009-10 School Year Have Created an “AYP Earthquake”
Elimination of Statistical Adjustment for Students with Disabilities (“The 34-Point Rule”)
Time Adjustment of Grades 3-8 ELA and Math Test Administration
New Process for Equating Tests Between Years
New High School Graduation Rate Goals and Targets
3

New Standards Based on College and Career Readiness
Aligning Regents Scores with College Readiness Aligning Grade 8 ELA and Math Proficiency Levels
with Regents College Readiness Scores Linking Grades 3-7 ELA and Math Proficiency Levels
with Grade ELA and Math Preparing for the “Wave” by Changing the Grades
3-8 ELA and Math Annual Measurable Objectives
4
5
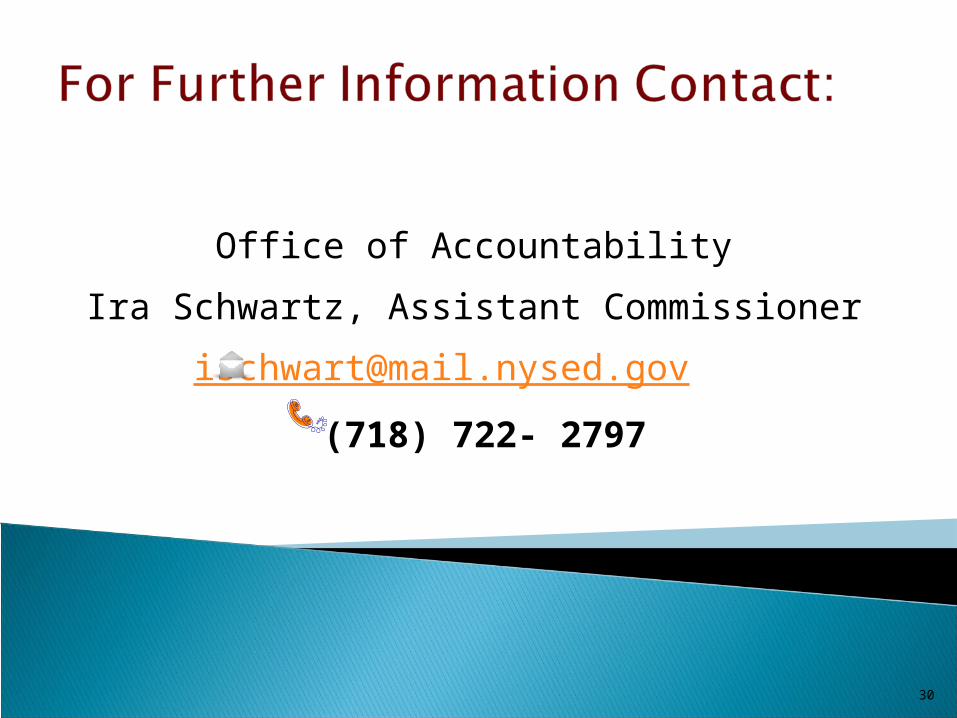
Schools Identified for Improvement, Corrective Action or Restructuring in
2010-11IMPROVEMENT STATUS NYC
Rest of State Total
Improvement (year 1) - Basic 17 28 45
Improvement (year 1) - Focused 5 10 17
Improvement (year 1) - Comprehensive 52 19 71
Improvement (year 2) - Basic 12 6 18
Improvement (year 2) - Focused 4 10 14
Improvement (year 2) - Comprehensive 20 13 33
Corrective Action (year 1) - Focused 10 16 26
Corrective Action (year 1) - Comprehensive 24 12 36
Corrective Action (year 2) - Focused 7 13 20
Corrective Action (year 2) - Comprehensive 11 7 18
Restructuring (year 1) - Focused 5 6 11
Restructuring (year 1) - Comprehensive 13 9 22
Restructuring (year 2) - Focused 6 5 11
Restructuring (year 2) - Comprehensive 11 13 24
Restructuring (Advanced) - Focused 21 8 29
Restructuring (Advanced) - Comprehensive 103 40 143
TOTAL 321 215 536
6
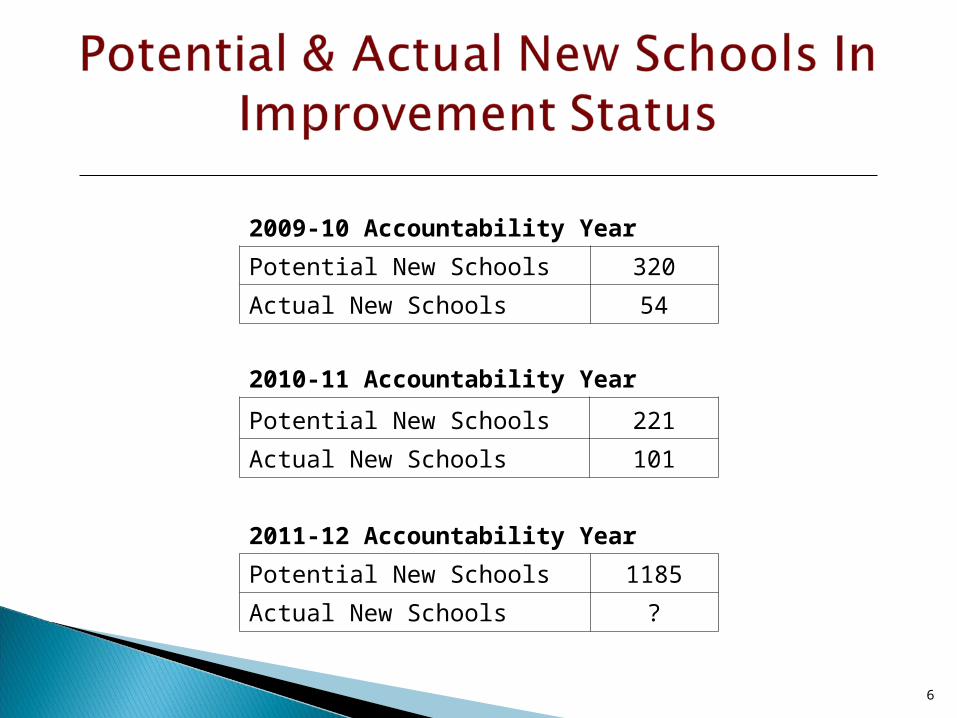
2009-10 Accountability Year
Potential New Schools 320
Actual New Schools 54
2010-11 Accountability Year
Potential New Schools 221
Actual New Schools 101
2011-12 Accountability Year
Potential New Schools 1185
Actual New Schools ?

In August 2010, the Board of Regents decided to raise New York’s ELA and mathematics achievement standards for Grades 3-8. Proficiency now means that a student is on track to meet high school exit examination requirements and pass first year college courses in ELA and math, without the need for remediation.
In 2009-10, there were 536 schools identified. As a result of the new cut scores, there are potentially 1,185 schools at risk of identification for 2011-12.
SED has received approval from the USDE to revise the accountability workbook to reset the Annual Measurable Objective (AMO) for Grades 3-8 ELA and mathematics to reflect the new, higher Grades 3-8 ELA and math achievement standards and change the trajectory established for the percentage of students expected to be proficient each year between now and 2013-14 for purposes of making AYP determinations.
The amendment allows New York to reset the AMO from a Performance Index of 167 to 122 for Grades 3-8 ELA and from 151 to 137 for Grades 3-8 mathematics for 2010-11, with annual equal increments up to 200 by 2013-14.
7

AMOs 2010-11 through 2013-14with Amendment
Year 2010-11 2011-12 2012-13 2013-14
Grades 3-8 ELA 122 148 174 200
Grades 3-8 Mathematics 137 158 179 200
AMOs 2010-11 through 2013-14CURRENT
Year 2010-11 2011-12 2012-13 2013-14
Grades 3-8 ELA 167 178 189 200
Grades 3-8 Mathematics 151 167 183 200
8

9
2008-09
3-8 ELA 3-8 Math HS ELA HS Math 3-8 Sci Grad Rate
Made AYP 93% 99% 81% 84% 99% 94%
Failed AYP 7% 1% 19% 16% 1% 6%
Total 100% 100% 100% 100% 100% 100%
2009-10
3-8 ELA 3-8 Math HS ELA HS Math 3-8 Sci Grad Rate
Made AYP 64% 95% 74% 78% 99% 73%
Failed AYP 36% 5% 26% 22% 1% 27%
Total 100% 100% 100% 100% 100% 100%
PROJECTED for 2010-11
3-8 ELA 3-8 Math HS ELA HS Math 3-8 Sci Grad Rate
Made AYP 55% 63% TBD TBD TBD TBD
Failed AYP 45% 37% TBD TBD TBD TBD
Total 100% 100% TBD TBD TBD TBD
10
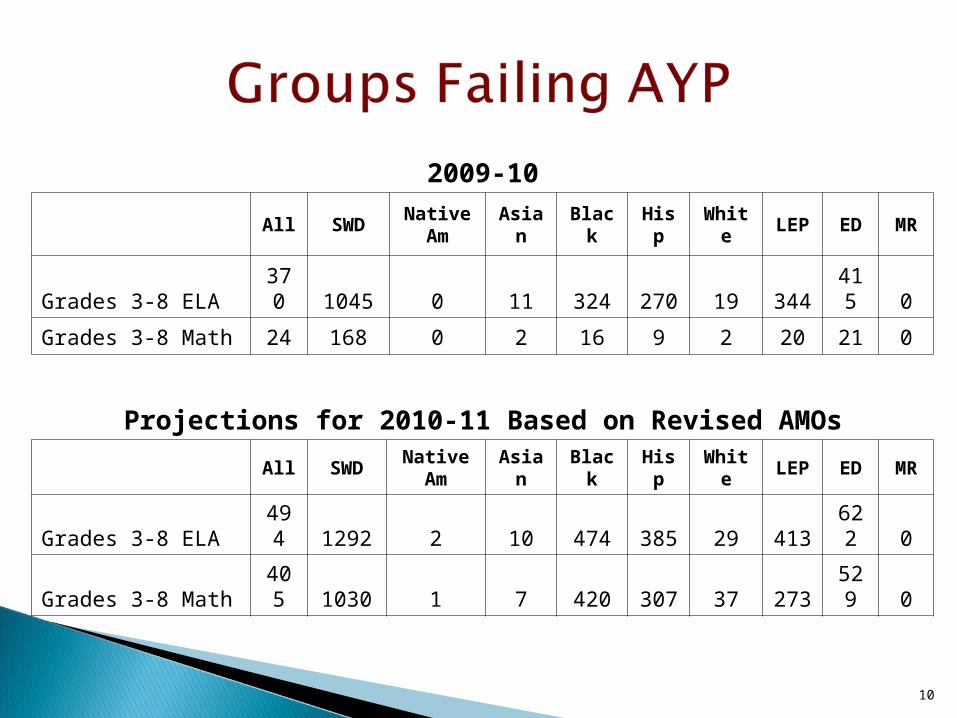
2009-10
All SWDNative
AmAsian Black Hisp White LEP ED MR
Grades 3-8 ELA 370 1045 0 11 324 270 19 344 415 0
Grades 3-8 Math 24 168 0 2 16 9 2 20 21 0
Projections for 2010-11 Based on Revised AMOs
All SWDNative
AmAsian Black Hisp White LEP ED MR
Grades 3-8 ELA 494 1292 2 10 474 385 29 413 622 0
Grades 3-8 Math 405 1030 1 7 420 307 37 273 529 0
For the 2011-12 prospective best case/ worst case accountability status of schools, please visit:
http://www.p12.nysed.gov/accountability/APA/Memos/2011-12ProspectiveStatus.xls
NYSED has also posted a Phase and Category worksheet that helps schools project various AYP scenarios and see their resulting 2011-12 accountability status. The worksheet can be accessed at:
http://www.p12.nysed.gov/accountability/APA/Differentiated_Accountability/CategoryWorksheet2011-12.xls
11
12
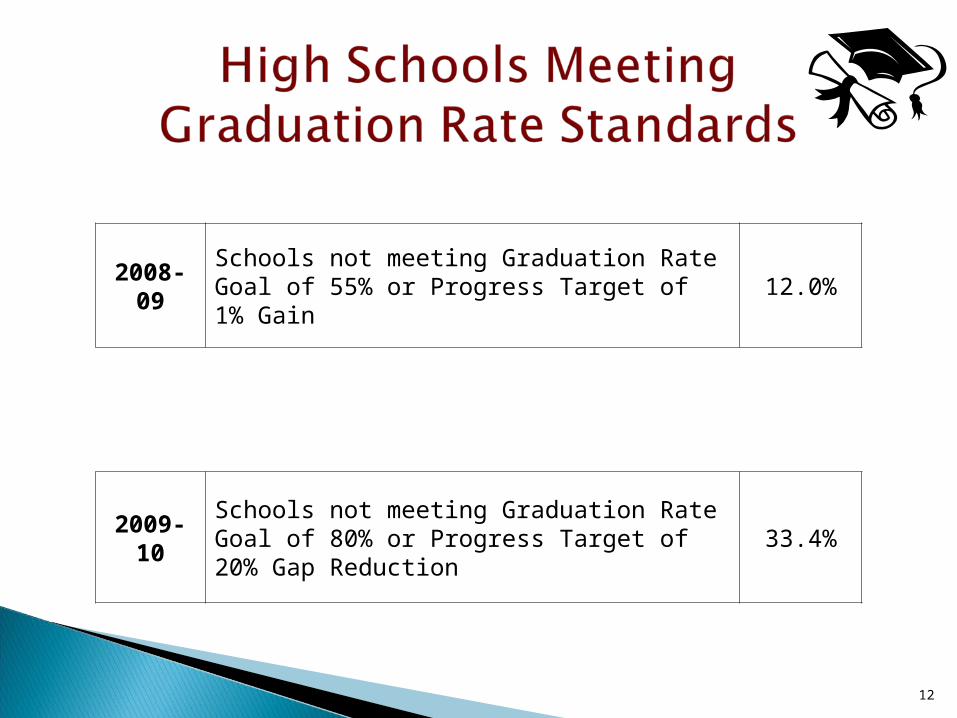
2008-09Schools not meeting Graduation Rate Goal of 55% or Progress Target of 1% Gain
12.0%
2009-10Schools not meeting Graduation Rate Goal of 80% or Progress Target of 20% Gap Reduction
33.4%
Accountability for high school graduation rate will be based on the performance of all student groups and the performance of both the 4-Year and 5-Year Graduation Rate Cohorts.
The one-day enrollment rule instead of the 5-month rule will be implemented.
Un-graded students with disabilities will enter the cohort upon entry into high school.
Changes in the rules regarding the transfer of incarcerated youth will be implemented.
13

Beginning in the 2011-12 school year, upon the approval of the NYS Board of Regents, schools and districts will make AYP with an accountability group, if the group meets or exceeds:
4-Year Graduation Rate Goal; or4-Year Graduation Rate Progress Target; or5-Year Graduation Rate Goal; or5-Year Graduation Rate Progress Target.
14

Each year two different cohorts are measured. For example, in 2011-12, we will measure the 2007 four year graduation rate cohort and the 2006 five year graduation rate cohort.
15
The Board of Regents Must Determine the High School Graduation Rate Goal and Progress Targets to be Used.
◦ For example: Higher Goal with More Modest Progress Targets OR Lower Goal with More Ambitious Progress Targets
16

The New Annual Professional Performance Review
17
18
New performance evaluation system for teachers and principals 20% - State student growth data or comparable measure of
student growth (increased to 25% upon implementation of a value-added growth model)
20% - Locally selected measures of student achievement that are determined to be rigorous and comparable across classrooms in accordance with regulations of Commissioner (decreased to 15% upon implementation of value-added model)
60% - Multiple measures of teacher/principal effectiveness based on standards prescribed in the Regulations of the Commissioner
Four rating categories: highly effective; effective; developing; ineffective
Results in a single composite score of teacher or principal effectiveness
19
Appropriate Training for All Evaluators
Teacher/Principal Improvement Plans (Developing/Ineffective)
Utilize Evaluation Results as a Factor in Career Ladder Decisions and Other Recognition
Locally-Developed Appeal Process
Expedited 3020a Process (Single Hearing Officer/After Two Consecutive Ineffective Ratings)
20
“twenty percent of the evaluation shall be based upon student growth data on state assessments as prescribed by the Commissioner or a comparable measure of student growth if such growth data is not available.”
Center for Assessment under contract to explore whether student growth percentiles could be a basis for a revised institutional accountability model.
Have completed student growth percentiles (SGPs) calculations for all students with 2009-10 test results and at least 1 year prior history. (also 08-09, 07-08)◦ Quality checks and statistical analysis still in process so all results preliminary
Initial student level results show model works generally as expected:◦ no correlation at student level between prior student achievement and student
growth percentile. ◦ Model more predictive the more years of student data (ie old students) but
quite predictive even at 4th.◦ More variation in SGP in math, than ELA
School level results show other expected trends:◦ Wide range of performance across state and within districts◦ Wide range of median SGP by prior achievement
21

At school level, median SGP shows some correlation with other student demographics which may need to be considered in assigning evaluation scores◦ Poverty◦ Students with disability◦ Possibly others
Also exploring ways to correct for false negatives◦ Identify statistical outliers where small changes in test scores of
generally high achieving students could lead to poor results on growth percentile comparisons
◦ How to identify and use statistical confidence intervals
22

23
●Add additional state-wide assessments with focus on core academic subjects with largest number of teachers.►Planned:
ELA 9 – 11 (2011-12)*
►Possibilities, subject to funding availability/ approval: Science 6 – 7 Social Studies 6 – 8 PARCC ELA 3 – 11 (2014-15) PARCC Math 3 – 11 (2014-15)
*Dec 2009 Regents item: Discussed and approved prior to inclusion in the Department's strategic plans and RFP
24
● Use existing assessments in other content areas to create a baseline for Grades 4 and 8 science tests and Regents examinations.
● Use commercially available assessment(s) to create a baseline for State assessments, such as Grade 3 ELA and math tests.
● Use a commercially available assessment(s) to create a baseline and measure growth.

25
●Collaborate with state-wide professional organizations or multi-state coalition to identify or develop performance assessments in subjects such as the arts, physical education and CTE.
●Empower local level resources to create and carry out a solution that meets state-wide requirements.

26
● Use a Group Metric► A group metric is a measure of a school’s (or grade’s) overall growth as
opposed to an individual teacher's impact - on student learning.
► Tennessee is considering using school-wide achievement growth in non-tested subjects; in DC, school-wide value-added measures account for 5% of a non-tested subject teacher’s rating.
► Orange County, FL: non-tested subject teachers can link themselves to teachers of tested subjects who have set student achievement goals.
► TAP: A performance compensation program used in some high needs districts from The System for Teacher and Student Advancement, recommends that for teachers in non-tested grades and subjects, 50% of performance bonuses are based on school-wide achievement gains.
→ SC TAP: 30% based on school-wide performance. Teachers in non-tested subjects are given the option to choose to align themselves with math or reading gains based on which subject they have best opportunity to reinforce.
27
The Regents College and Career Readiness Working Group has begun discussions about the effectiveness of New York’s high school graduation policies.
Policy Directions for Consideration:◦ Increase graduation requirements◦ More flexibility in the ways students can meet
requirements◦ Offer alternative or supplemental credentials◦ Rethink the “safety net” for students with disabilities

28
Four Years of Math Four Years of Science “College and Career Ready” Credit
◦ a career and technical education (CTE) course (linked to credential)◦ a college course◦ an advanced course (i.e., AP or IB)
A Second Regents Exam in Mathematics Increase the Required Passing Scores on the
English and Math Regents Exams to a Level that is Associated with College Readiness (75 in ELA; 80 in math)
Extend the School Day/School Year
* While the local diploma is being phased out for general education students, it remains available to students with disabilities through the “Safety Net” provisions of State regulations. The Safety Net could be extended to apply to the new requirements.
29
Student choice in one or more of their five required Regents exams
Successful completion of a CTE technical assessment (as part of an approved CTE program) to substitute for one of the five required Regents exams
Increase the maximum number of academic credits that students can earn through integrated CTE programs and specialized CTE courses
Flexibility in the courses that students may take in middle school Allow students to earn additional credits through demonstration of
competency rather than seat time. Current regulations allow for:
6.5 credits via credit by examination 3 credits via independent study 1 credit for visual arts Credit via make-up credit regulations


![NOTE PROCEDURES - Self-Directed IRA...PURCHASE NOTES WITH YOUR IRA! ... Roth IRA [ ] SEP IRA [ ] SIMPLE IRA [ ] Individual 401(k) [ ] HSA [ ] ESA Note: All investment paperwork must](https://img.pdfslide.net/doc/110x75/5f22e13b32debe6653035cf6/note-procedures-self-directed-ira-purchase-notes-with-your-ira-roth-ira.jpg)