Embed Size (px)
Citation preview

1
Benign Breast Disease and
Breast Cancer Risk
Jean F. Simpson, M.D.
Vanderbilt University
Nashville, Tennessee
December 1, 2011
Nashville
Nashville
Lebanon

2
Cedars of Lebanon State Park
The American University of Beirut
Vanderbilt University
Dr. Fouad Boulos Dr. Doha Itani Dr. Sharazad Saab
Pre-malignant Breast Disease
• 1950-1980-confusing
“ The female breast is a precancerous organ”
………..Fred Steward, AFIP fascicle
• 1980-1990 – risk defining
• 2000’s –refining
– Impact of breast imaging
– Mimics
– Molecular aspects

3
Risk Factors for Breast Cancer in
Women with Proliferative Breast
Disease
Dupont and Page, NEJM 1985
10,542 benign breast biopsies
1950-1968
85% follow up at 20 years
Nashville Breast Cohort Studies
• Specific histologically-defined terms
linked to levels of later malignancy risk
• Regionality of risk, i.e. local vs. diffuse
Stratification of Breast Cancer Risk
• No proliferative disease = NO RISK
• Proliferative disease, no atypia =
SLIGHT RISK
• Atypical hyperplasia = MODERATE
RISK

4
Distribution of Breast Lesions Nashville series (1950-1968)
No PD
PDWA
AHNo PD
PDWA
Distribution of Mammographically
Detected Lesions
No PD
PDWA
AH
Ca
No PD
PDWA
AH
Ca
Rubin et al, Cancer 1988
Stratification of Breast Cancer Risk
• No proliferative disease = NO RISK
• Proliferative disease, no atypia =
SLIGHT RISK
• Atypical hyperplasia = MODERATE
RISK

5
Relative Risk
• Used to compare groups (not individuals),
one group has characteristic, control group
does not
• Slight increase risk = amount detectable in
population
• Statistically significant, but not significant
for patients
Moderate Alcohol Consumption
During Adult Life, Drinking
Patterns, and Breast Cancer Risk
• Nurse’s Health Study
• Prospective observational study
• 105,986 women, entered 1980-2008
Chen et al, JAMA Nov 2, 2011
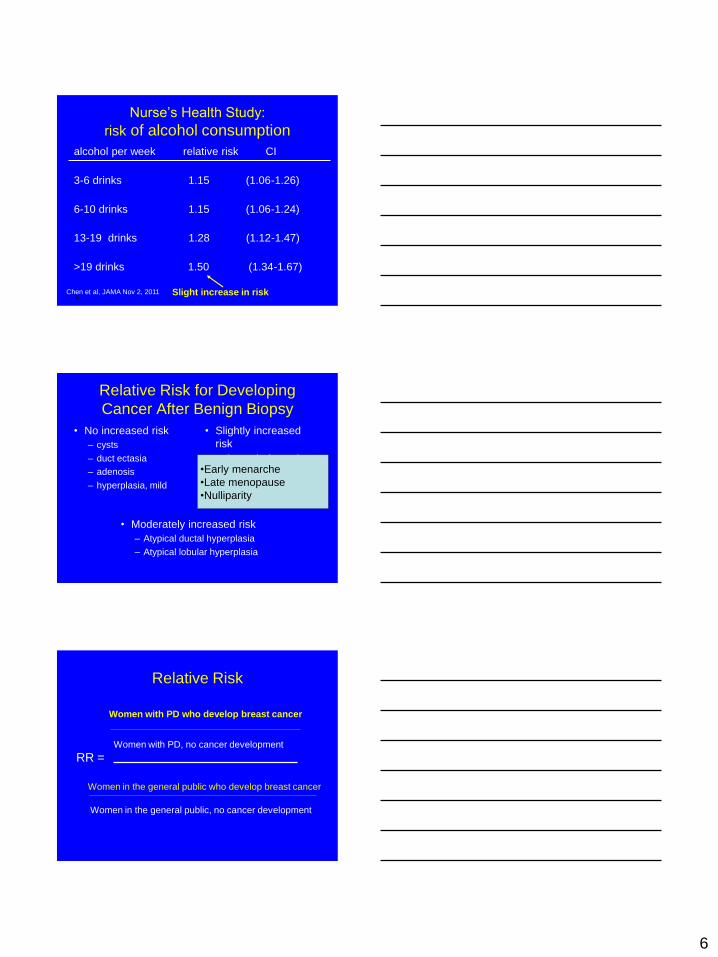
Nurse’s Health Study:
risk of alcohol consumption
alcohol per week relative risk CI
3-6 drinks 1.15 (1.06-1.26)
6-10 drinks 1.15 (1.06-1.24)
13-19 drinks 1.28 (1.12-1.47)
>19 drinks 1.50 (1.34-1.67)
c Chen et al, JAMA Nov 2, 2011
6
Nurse’s Health Study:
risk of alcohol consumption
alcohol per week relative risk CI
3-6 drinks 1.15 (1.06-1.26)
6-10 drinks 1.15 (1.06-1.24)
13-19 drinks 1.28 (1.12-1.47)
>19 drinks 1.50 (1.34-1.67)
c Chen et al, JAMA Nov 2, 2011
Slight increase in risk
Relative Risk for Developing
Cancer After Benign Biopsy
• No increased risk
– cysts
– duct ectasia
– adenosis
– hyperplasia, mild
• Slightly increased
risk
– hyperplasia, moderate
or florid, no atypia
– sclerosing adenosis
– solitary papilloma
• Moderately increased risk
– Atypical ductal hyperplasia
– Atypical lobular hyperplasia
•Early menarche
•Late menopause
•Nulliparity
Relative Risk
Women with PD, no cancer development
Women in the general public who develop breast cancer
Women with PD who develop breast cancer
Women in the general public, no cancer development
RR =

7
Relative Risk
Women with PD, no cancer development
Women in the general public who develop breast cancer
Women with PD who develop breast cancer
Women in the general public, no cancer development
RR =
Relative Risk
Women with PD, no cancer development
Women in the general public who develop breast cancer
Women with PD who develop breast cancer
Women in the general public, no cancer development
RR =
Relative Risk
Women with PD, no cancer development
Women in the general public who develop breast cancer
Women with PD who develop breast cancer
Women in the general public, no cancer development
RR =
8
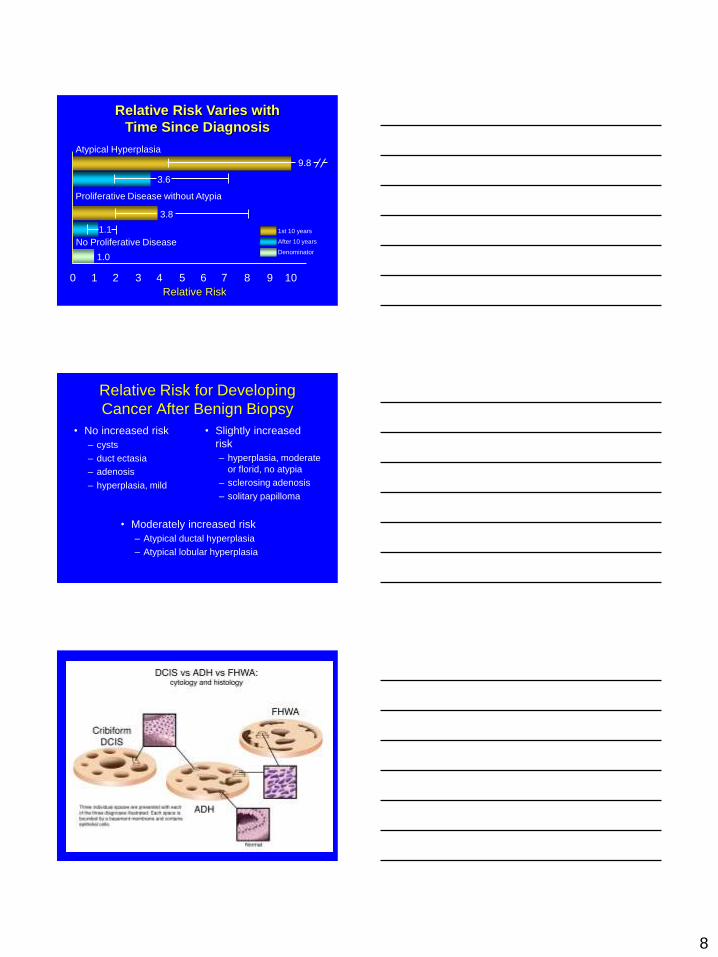
Relative Risk Varies with
Time Since Diagnosis
Relative Risk
0 1 2 3 4 5 6 7 8 9 10
1st 10 years
After 10 years
Denominator
No Proliferative Disease
1.0
1.1
3.8
9.8
3.6
Proliferative Disease without Atypia
Atypical Hyperplasia
Relative Risk for Developing
Cancer After Benign Biopsy
• No increased risk
– cysts
– duct ectasia
– adenosis
– hyperplasia, mild
• Slightly increased
risk
– hyperplasia, moderate
or florid, no atypia
– sclerosing adenosis
– solitary papilloma
• Moderately increased risk
– Atypical ductal hyperplasia
– Atypical lobular hyperplasia

9

10
Relative Risk for Developing
Cancer After Benign Biopsy
• No increased risk
– cysts
– duct ectasia
– adenosis
– hyperplasia, mild
• Slightly increased
risk
– hyperplasia, moderate
or florid, no atypia
– sclerosing adenosis
– solitary papilloma
• Moderately increased risk
– Atypical ductal hyperplasia
– Atypical lobular hyperplasia

11
Minimum Criteria for DCIS
• Uniform population of cells, maintaining
rounded, geometric configurations
• Even cell placement, without swirling or
streaming
• Fully populating two adjacent spaces
(3 mm)

12
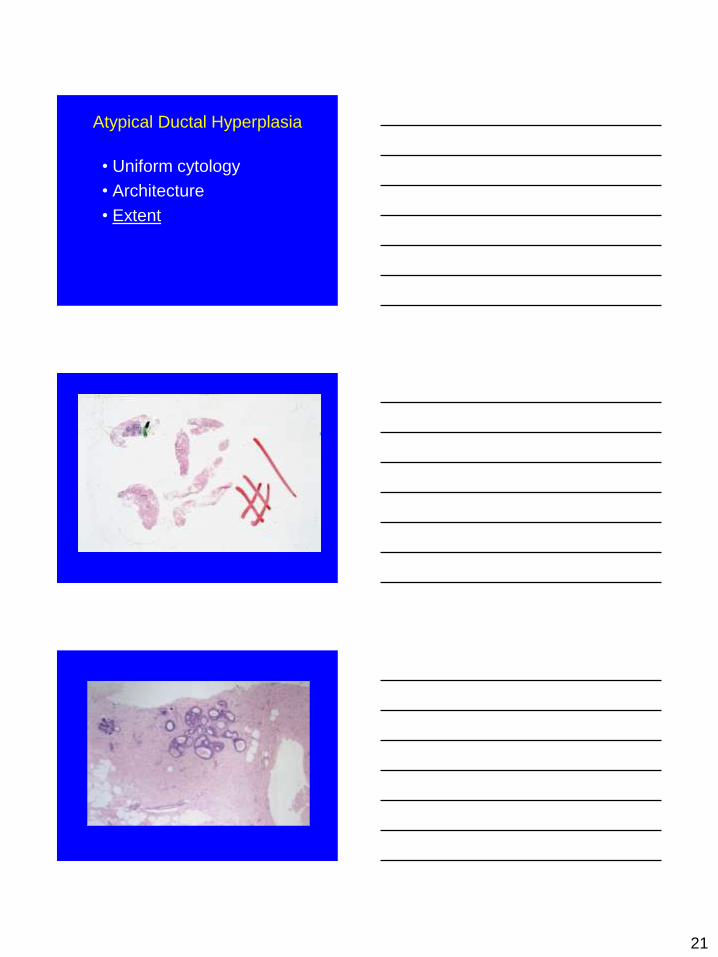
Atypical Ductal Hyperplasia
• Uniform cytology
• Architecture
–cribriform, micropapillary, solid
• Extent

13

14
Nashville Breast Cohort Study
Design
• Define histologic categories that could be
reproducibly recognized
• Perform patient follow up
• Assign risk based on cancer development
Relative Risk for Developing
Cancer After Benign Biopsy
• No increased risk
– cysts
– duct ectasia
– adenosis
– hyperplasia, mild
• Slightly increased
risk
– hyperplasia, moderate
or florid, no atypia
– sclerosing adenosis
– solitary papilloma
• Moderately increased risk
– Atypical ductal hyperplasia
– Atypical lobular hyperplasia

15
Confirmatory Studies
Pathologic
finding
Nashville
Cohort
(1985)
Nurse’s
Health
Study
(1992)
Breast
Cancer
Detection
Project
(1993)
Mayo Clinic
(2005)
Proliferative
disease
without atypia
1.5-2X 1.6X 1.3X 1.9X
Atypical
hyperplasia
4-5X 3.7X 4.3X 4.24X
Proliferative Mimics
16

17

18

19
Confounders
• Mammography
• Minimally invasive biopsy
procedures
• Hyperplasia in unusual
settings

20
Underdiagnosis of ADH
• Core needle biopsy 41%
• Mammotome 15%
• Core needle biopsy (14 g) 44%
• Mammotome (14 g) 39%
• Mammotome (11g) 19%
Jacobs et al, Am J Surg Pathol, 2002
Factors Influencing
Underdiagnosis of ADH
• Device used
• Extent of removal of mammographic
lesion
• Microcalcifications vs mass
Jacobs et al, AM J Surg Pathol, 2002
When to excise after core biopsy?
• Diagnostic difficulty
• Sampling issues
21
Atypical Ductal Hyperplasia
• Uniform cytology
• Architecture
• Extent

22

23
Extent of ADH on Core Biopsy
(n=47)
Findings in Excised Specimen
benign ADH DCIS
# ADH foci
<2 14 7 0
3 0 4 3
>4 0 2 12
Ely et al, Am J Surg Pathol, 2001
Extent of ADH on Core Biopsy
(n=42)
Findings in Excised Specimen
benign ADH DCIS
# ADH foci
1 14 7 0
2 2 5 0
3 3 1 1
>4 5 2 2
Sneige et al, Am J Clin Pathol, 2003
ADH vs low grade DCIS
“At least atypical ductal hyperplasia,
excision necessary to evaluate extent
of the lesion”

24
ADH vs DCIS
• Differential diagnosis is LOW GRADE
DCIS
• Extent of involvement is key
• Be conservative on core biopsy
Biomarkers of ADH?
• ADH is typically negative for HMW keratins (CK 5/6) and diffusely positive for ER
• Usual hyperplasia shows variable expression of HMW keratins and ER
• Expression of these markers is similar in ADH and low-grade DCIS
• None is sufficiently validated for routine clinical use
Molecular analysis of ADH • LOH & CGH show common patterns of genetic
alteration in ADH, low grade DCIS, and invasive carcinoma
• Frequent sites of LOH in ADH and invasive carcinoma: chromosomes 16q, 17p, and 11q13
• studies of ADH are from cases of established cancer, both invasive and in situ
• Few studies of ADH as the most advanced lesion
• No studies have established significance of these changes through large, clinically validated patient cohorts.

25