Embed Size (px)
Citation preview
8/6/2019 Updated Estimates 6292011
http://slidepdf.com/reader/full/updated-estimates-6292011 1/15
Updated Estimates of theFiscal Commission Proposal
June 29, 2011
www.crfb.orgwww.momentoftruthproject.org
8/6/2019 Updated Estimates 6292011
http://slidepdf.com/reader/full/updated-estimates-6292011 2/15
8/6/2019 Updated Estimates 6292011
http://slidepdf.com/reader/full/updated-estimates-6292011 3/15
n the months since the nal report of the NationalCommission on Fiscal Responsibility and Reform(Fiscal Commission), “The Moment of Truth,” theCongressional Budget Of ce has updated its budget
projections in light of several legislative changes, aswell as a downward revision to the economic outlook.In addition, a number of the policies recommended
by the Fiscal Commission have been re-estimatedto have different de cit impacts, and the ten-year
budget window now extends through 2021 insteadof 2020.
Under updated estimates that re ect these changes,
the Fiscal Commission would reduce the de cit by$3.8 trillion excluding Social Security and $4.05trillion including it. The savings are somewhatlower than they were in the original report primarily
because a signi cant amount of the discretionarysavings in the Commission plan are now assumedin the baseline in large part as a result of cuts that
have been enacted. Approximately $650 billion of the discretionary savings in the Commission reportare now “baked” into the baseline assumptions. Inaddition, the projected debt and de cit levels aresomewhat higher under updated estimates because of the tax cut extensions and a deterioration in underlying
budget projections since last year. Nonetheless, theCommission plan still puts the debt on a downwardtrajectory after 2014.
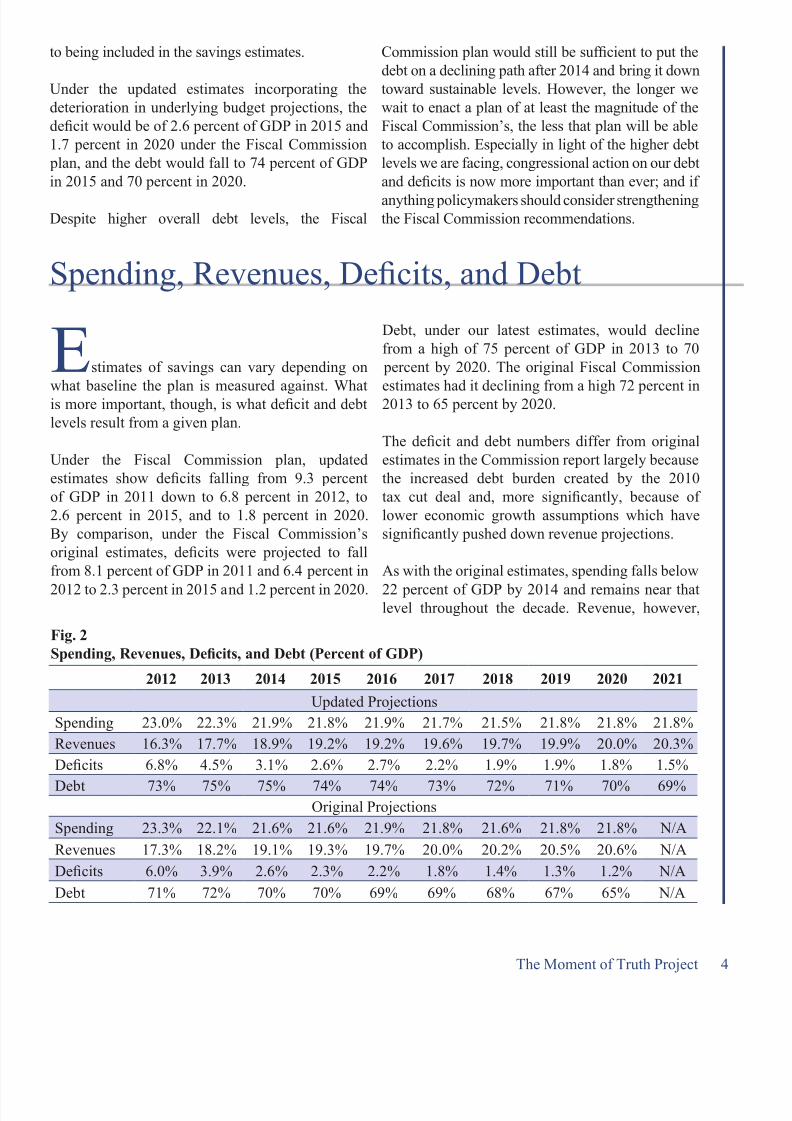
Since the estimated savings claimed by a budget plan can vary depending on which baseline the planis measured against, it is important to look at theactual de cit and debt levels when comparing a planto the Fiscal Commission proposal. Under the Fiscal
Commission’s recommendations, debt would beginto decline after 2014 from a high of 75 percent of GDP to below 70 percent by the end of the decade.That is the standard against which any scal planshould be measured; and if anything policymakersshould consider strengthening the Fiscal Commissionrecommendations.
Executive Summary
2
I
Updated Estimates of theFiscal Commission Proposal
The Moment of Truth Project
8/6/2019 Updated Estimates 6292011
http://slidepdf.com/reader/full/updated-estimates-6292011 4/15
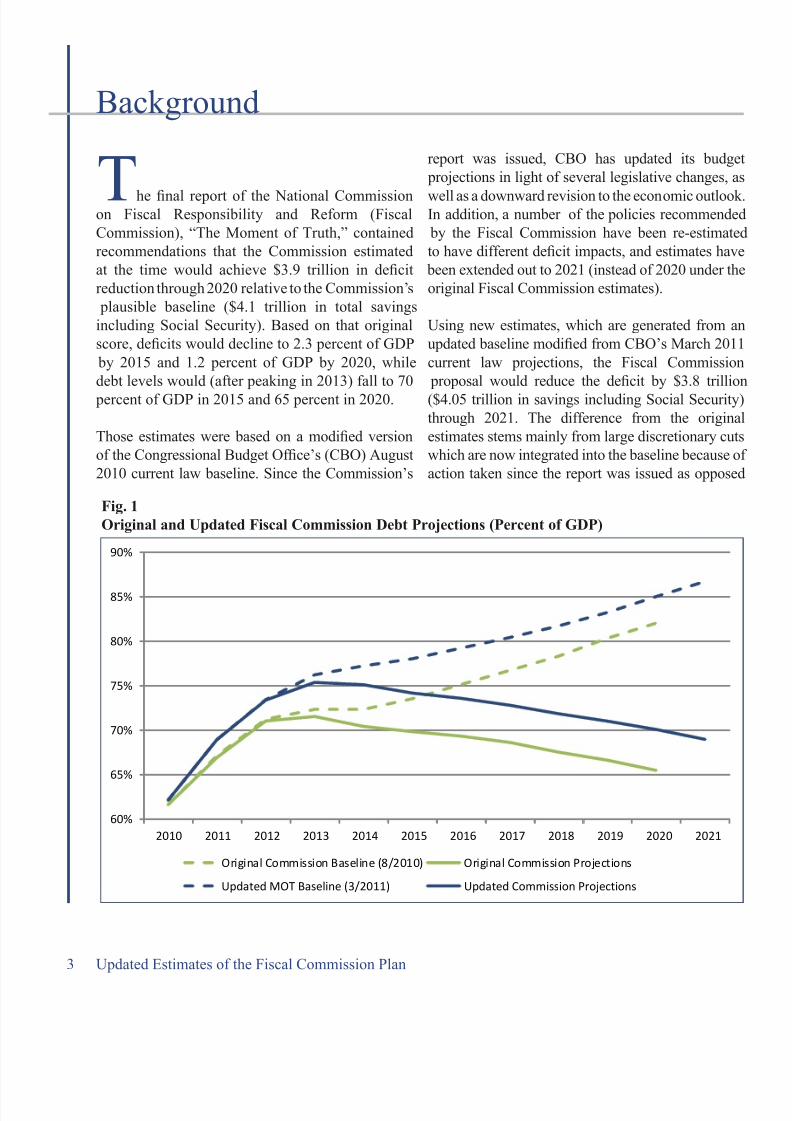
he nal report of the National Commissionon Fiscal Responsibility and Reform (FiscalCommission), “The Moment of Truth,” containedrecommendations that the Commission estimatedat the time would achieve $3.9 trillion in de citreduction through 2020 relative to the Commission’s
plausible baseline ($4.1 trillion in total savingsincluding Social Security). Based on that originalscore, de cits would decline to 2.3 percent of GDP
by 2015 and 1.2 percent of GDP by 2020, whiledebt levels would (after peaking in 2013) fall to 70
percent of GDP in 2015 and 65 percent in 2020.
Those estimates were based on a modi ed versionof the Congressional Budget Of ce’s (CBO) August2010 current law baseline. Since the Commission’s
report was issued, CBO has updated its budget projections in light of several legislative changes, as
well as a downward revision to the economic outlook.In addition, a number of the policies recommended
by the Fiscal Commission have been re-estimatedto have different de cit impacts, and estimates have
been extended out to 2021 (instead of 2020 under theoriginal Fiscal Commission estimates).
Using new estimates, which are generated from anupdated baseline modi ed from CBO’s March 2011current law projections, the Fiscal Commission
proposal would reduce the de cit by $3.8 trillion($4.05 trillion in savings including Social Security)through 2021. The difference from the originalestimates stems mainly from large discretionary cutswhich are now integrated into the baseline because of action taken since the report was issued as opposed
3
Background
T
Updated Estimates of the Fiscal Commission Plan
Fig. 1Original and Updated Fiscal Commission Debt Projections (Percent of GDP)
60%
65%
70%
75%
80%
85%
90%
2010 2011 2012 2013 2014 2015 2016 2017 2018 2019 2020 2021
Original Commission Baseline (8/2010) Original Commission Projections
Updated MOT Baseline (3/2011) Updated Commission Projections
8/6/2019 Updated Estimates 6292011
http://slidepdf.com/reader/full/updated-estimates-6292011 5/15
8/6/2019 Updated Estimates 6292011
http://slidepdf.com/reader/full/updated-estimates-6292011 6/15
rises gradually to only 20 percent of GDP by 2020,compared to 20.6 percent in the original projections.As with the de cit projections, this is primarily afunction of the downward revision in projections of economic growth.
Note that the estimates in this analysis are basedon CBO’s macroeconomic assumptions, and do not
account for any additional economic growth whichis likely to occur as a result of the gradual debtreduction and tax rate reduction associated withthe Fiscal Commission plan. Additional growthcould result in higher revenues, lower de cits, anda further decline in the debt-to-GDP ratio – what areknown as “dynamic” effects.
5
TDifferences in the Baselines
he Fiscal Commission’s recommendedspending, revenue, de cit, and debt pathswere based off of the economic and technical
assumptions in the baseline released by CBO inAugust of 2010. The Commission constructeda plausible baseline using those economic andtechnical assumptions along with the following
policy assumptions:
1) Continuation of the 2001/2003 tax cuts protected under statutory PAYGO (thoseapplied to income below $200,000 for individuals and $250,000 for families);
2) Indexing of the parameters of the most recent
Alternative Minimum Tax patch;3) Continuation of the Estate Tax at 2009 levels;4) Replacement of the Medicare Sustainable
Growth Rate (SGR) with a permanent freezeto physician payments;
5) Discretionary spending at the levels in thePresident’s FY 2011 budget request; and
6) Spending in Iraq and Afghanistan consistentwith the CBO option to gradually reduce thenumber of troops to 60,000 by 2015.
Under that original baseline, debt was projectedto grow from 67 percent of GDP in 2011 to 74
percent in 2015 and 82 percent in 2020. Under theupdated estimates, however, debt will rise to 78
percent of GDP in 2015 and 85 percent in 2020.
Broadly speaking, changes between the FiscalCommission’s original baseline and the updated
baseline used in this analysis result from one of two types of factors – those related to changesin the current law baseline and those related to
changes in the adjustments. Under current law,over the 2011 to 2020 period, de cits are now projected to be $1.2 trillion worse than those projected in August of 2010, both because of lower revenue from worsened economic performanceand the scal impact of the tax cut and stimulusdeal enacted in December of 2010 (offset in part
by lower discretionary spending).
Pushing in the other direction are changes tothe adjustments made to CBO’s current law
projections. Most signi cantly, the adjusted baseline used in this analysis does not use thediscretionary spending levels from the PresidentFY 2011 budget as the Fiscal Commission did inits plausible baseline. This is both because that
budget is now well out of date and because recentdiscretionary spending cuts have made it clear that some of the Commission’s proposed spendingcuts are already underway and should therefore
be “baked” into the baseline. This primarilyaffects the amount of savings attributed to theCommission proposal. In addition, our updated
baseline now assumes the number of troops in Iraqand Afghanistan will decline to 45,000 rather than60,000 by 2015 – which is more consistent withcurrent policies.
Updated Estimates of the Fiscal Commission Proposal
8/6/2019 Updated Estimates 6292011
http://slidepdf.com/reader/full/updated-estimates-6292011 7/15
The Moment of Truth Project
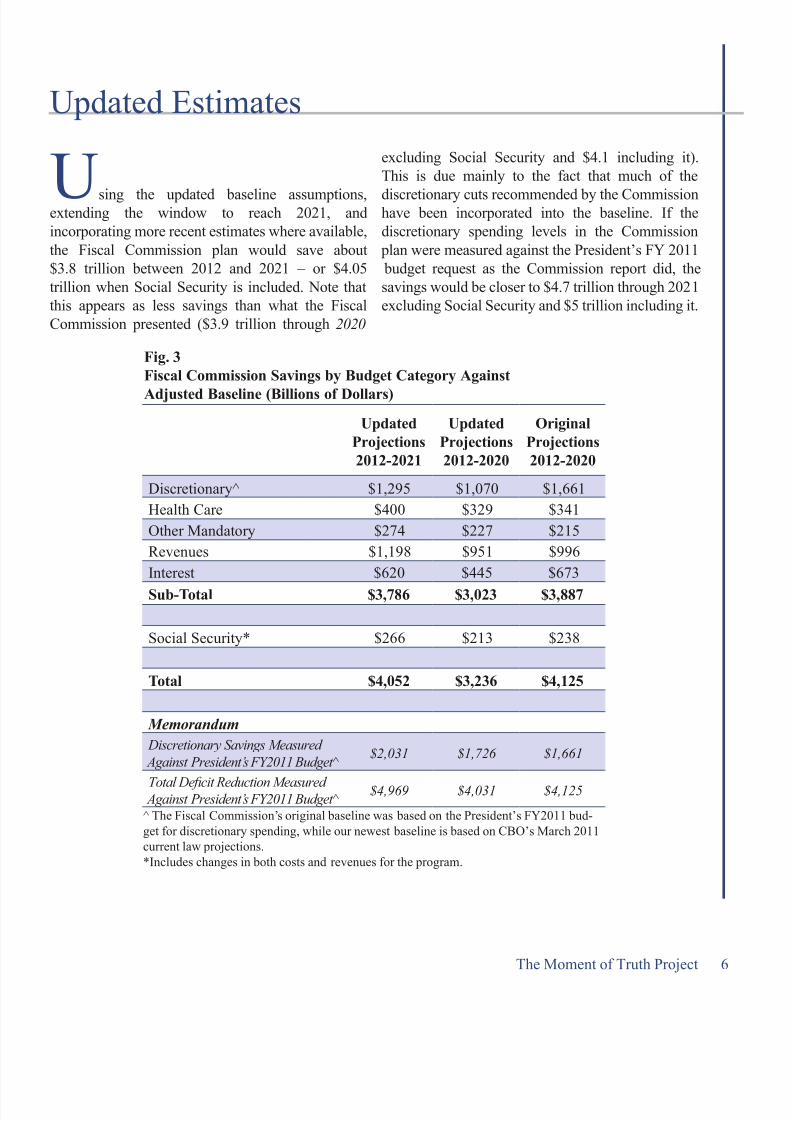
sing the updated baseline assumptions,extending the window to reach 2021, andincorporating more recent estimates where available,the Fiscal Commission plan would save about$3.8 trillion between 2012 and 2021 – or $4.05trillion when Social Security is included. Note thatthis appears as less savings than what the FiscalCommission presented ($3.9 trillion through 2020
excluding Social Security and $4.1 including it).This is due mainly to the fact that much of the
discretionary cuts recommended by the Commissionhave been incorporated into the baseline. If thediscretionary spending levels in the Commission
plan were measured against the President’s FY 2011 budget request as the Commission report did, thesavings would be closer to $4.7 trillion through 2021excluding Social Security and $5 trillion including it.
6
UpdatedProjections2012-2021
UpdatedProjections2012-2020
OriginalProjections2012-2020
Discretionary^ $1,295 $1,070 $1,661Health Care $400 $329 $341Other Mandatory $274 $227 $215Revenues $1,198 $951 $996Interest $620 $445 $673Sub-Total $3,786 $3,023 $3,887
Social Security* $266 $213 $238
Total $4,052 $3,236 $4,125
Memorandum
Discretionary Savings Measured Against President’s FY2011 Budget ̂
$2,031 $1,726 $1,661
Total De cit Reduction Measured Against President’s FY2011 Budget ̂ $4,969 $4,031 $4,125
^ The Fiscal Commission’s original baseline was based on the President’s FY2011 bud-get for discretionary spending, while our newest baseline is based on CBO’s March 2011current law projections.*Includes changes in both costs and revenues for the program.
Fig. 3Fiscal Commission Savings by Budget Category Against
Adjusted Baseline (Billions of Dollars)
Updated Estimates
U
8/6/2019 Updated Estimates 6292011
http://slidepdf.com/reader/full/updated-estimates-6292011 8/15
On discretionary spending, the Fiscal Commissionrecommended statutory caps to freeze security andnon-security appropriations at 2011 levels in 2012,
bring them back to real 2008 levels in 2013, andthen allow them to grow at roughly half the rate of
in ation thereafter.Measured against the March CBO baseline for discretionary spending, the discretionary spendinglimits in the Commission plan would result in non-war savings of $886 billion in security programsand $409 billion in non-security programs (thoughthis allocation could differ after 2015 when“ rewalls” disappear). These savings are far lower than the $1.7 trillion in total (2012-2020) savingsoriginally estimated by the Fiscal Commission.
However, it is important to make the distinctionthat this is a reduction in savings due to much of the recommended spending cuts are now already
part of the baseline; the top-line spending levelsrecommended by the Commission are no higher.
Indeed, the spending which would result from theFiscal Commission recommendations is actuallylower than originally projected. The Commission
proposed that the limits for FY 2012 re ect afreeze of discretionary spending at FY 2011 levels.Since Congress had not enacted the nal FY 2011appropriations bills when the Commission reportwas written, however, it assumed a twelve monthcontinuing resolution (i.e. a freeze at FY 2010levels) as a placeholder. In reality, though, non-security budget authority ended up being reduced
by about $30 billion below the placeholder assumed by the Commission. As a result, total discretionary budget authority under the Commission planwould be $30 billion lower in 2012 than in the
Fiscal Commission plan, with correspondinglylower outlays in 2012 and subsequent years.
The reason our updated discretionary savings arelower is entirely the result of the baseline being used.The Fiscal Commission calculated discretionarysavings by comparing the discretionary spending
limits in the proposal to the President’s FY 2011request. This was probably the most realisticre ection of current policy at the time, particularlyfor defense spending, where the President’s budgetrequest is based on a carefully constructed Future
Years Defense Program.Discretionary savings relative to the President’sFY 2011 Budget were higher than savings relativeto CBO’s August baseline, at the time, mainly
because the President’s budget proposed increasingsecurity in real terms – by about one percent abovein ation per year. Non-security spending, on theother hand, was quite similar under the President’s
budget as was projected in CBO’s August 2010current law baseline.
In light of the fact that the President’s FY 2011 budget is now 16 months old, and has beenreplaced twice – by the President’s FY 2012Budget and by further revisions in the form of a“Budget Framework” – this analysis measuresthe Commission’s discretionary savings againstCBO’s March current law baseline. Essentially,many of the spending cuts the Commissionrecommended have since been put in motion andare thus now a part of the baseline. Were we tocontinue to measure discretionary savings fromthe Presidents FY 2011 budget, they would beapproximately $650 billion higher through 2021.Although the CBO baseline assumes that thelower spending levels continue in future years, itis important to understand that actual discretionaryspending will be based on future appropriationsdecisions, and there is no guarantee they willcome in at the levels projected under current law.By establishing statutory limits on discretionary
spending in law, however, the Fiscal Commission proposal would effectively lock in those savingsassumed in the CBO baseline while requiringeven further savings. Given that, it would still bereasonable to measure the discretionary savings inany number of ways, including measuring themrelative to the President’s FY 2011 request.
7
Discretionary Savings
Updated Estimates of the Fiscal Commission Proposal
8/6/2019 Updated Estimates 6292011
http://slidepdf.com/reader/full/updated-estimates-6292011 9/15
The Moment of Truth Project 8
UpdatedProjections
2012-2021
UpdatedProjections
2012-2020
OriginalProjections
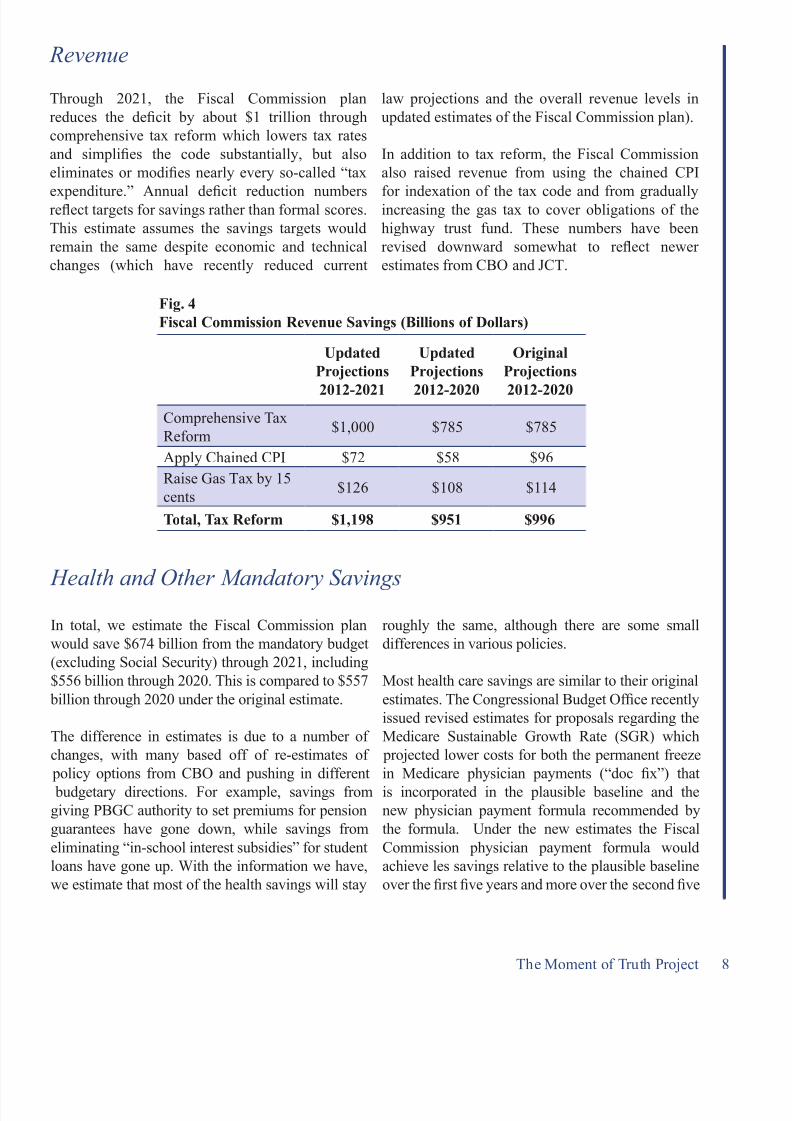
2012-2020Comprehensive TaxReform $1,000 $785 $785
Apply Chained CPI $72 $58 $96Raise Gas Tax by 15cents $126 $108 $114
Total, Tax Reform $1,198 $951 $996
Fig. 4Fiscal Commission Revenue Savings (Billions of Dollars)
Revenue
Health and Other Mandatory Savings
Through 2021, the Fiscal Commission planreduces the de cit by about $1 trillion throughcomprehensive tax reform which lowers tax ratesand simpli es the code substantially, but alsoeliminates or modi es nearly every so-called “tax
expenditure.” Annual de cit reduction numbersre ect targets for savings rather than formal scores.This estimate assumes the savings targets wouldremain the same despite economic and technicalchanges (which have recently reduced current
law projections and the overall revenue levels inupdated estimates of the Fiscal Commission plan).
In addition to tax reform, the Fiscal Commissionalso raised revenue from using the chained CPI
for indexation of the tax code and from graduallyincreasing the gas tax to cover obligations of thehighway trust fund. These numbers have beenrevised downward somewhat to re ect newer estimates from CBO and JCT.
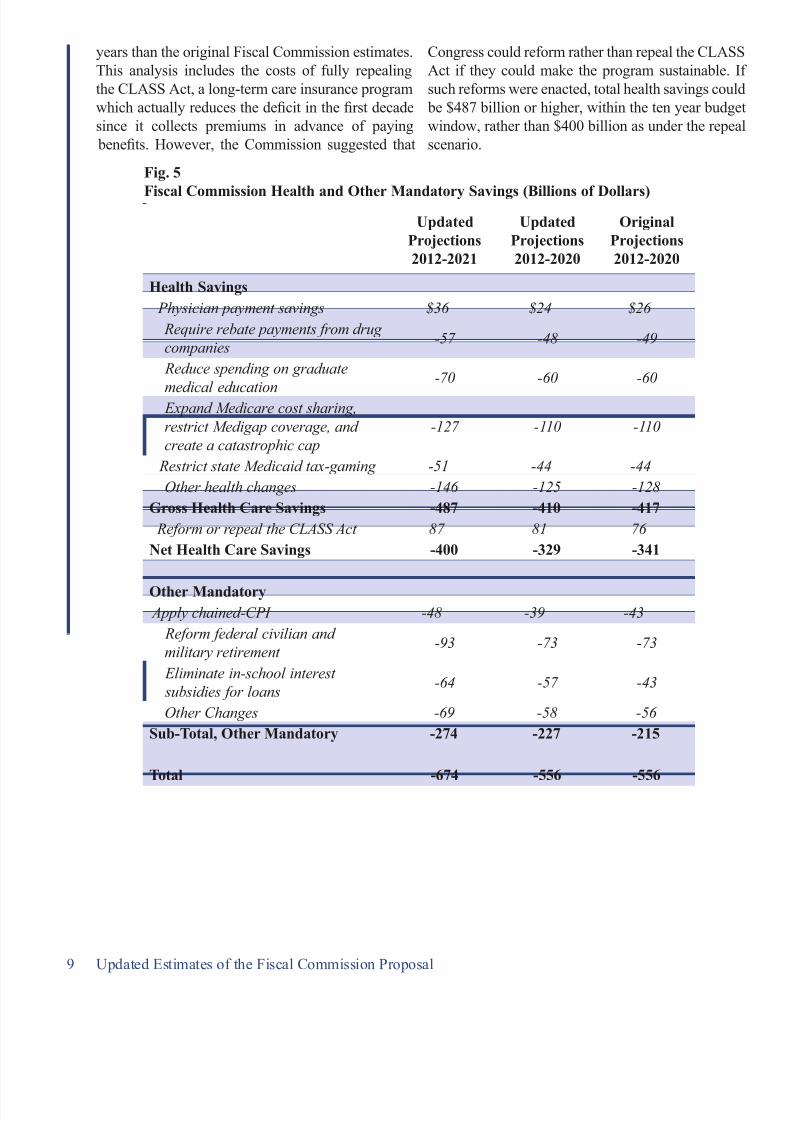
In total, we estimate the Fiscal Commission planwould save $674 billion from the mandatory budget(excluding Social Security) through 2021, including$556 billion through 2020. This is compared to $557
billion through 2020 under the original estimate.
The difference in estimates is due to a number of changes, with many based off of re-estimates of
policy options from CBO and pushing in different budgetary directions. For example, savings fromgiving PBGC authority to set premiums for pensionguarantees have gone down, while savings fromeliminating “in-school interest subsidies” for studentloans have gone up. With the information we have,we estimate that most of the health savings will stay
roughly the same, although there are some smalldifferences in various policies.
Most health care savings are similar to their originalestimates. The Congressional Budget Of ce recentlyissued revised estimates for proposals regarding theMedicare Sustainable Growth Rate (SGR) which
projected lower costs for both the permanent freezein Medicare physician payments (“doc x”) thatis incorporated in the plausible baseline and thenew physician payment formula recommended bythe formula. Under the new estimates the FiscalCommission physician payment formula wouldachieve les savings relative to the plausible baselineover the rst ve years and more over the second ve
8/6/2019 Updated Estimates 6292011
http://slidepdf.com/reader/full/updated-estimates-6292011 10/15
9 Updated Estimates of the Fiscal Commission Proposal
UpdatedProjections2012-2021
UpdatedProjections2012-2020
OriginalProjections2012-2020
Health Savings Physician payment savings $36 $24 $26 Require rebate payments from drug companies
-57 -48 -49
Reduce spending on graduate
medical education-70 -60 -60
Expand Medicare cost sharing,restrict Medigap coverage, and create a catastrophic cap
-127 -110 -110
Restrict state Medicaid tax-gaming -51 -44 -44Other health changes -146 -125 -128
Gross Health Care Savings -487 -410 -417 Reform or repeal the CLASS Act 87 81 76
Net Health Care Savings -400 -329 -341
Other Mandatory Apply chained-CPI -48 -39 -43 Reform federal civilian and military retirement
-93 -73 -73
Eliminate in-school interest subsidies for loans
-64 -57 -43
Other Changes -69 -58 -56 Sub-Total, Other Mandatory -274 -227 -215
Total -674 -556 -556
Fig. 5
Fiscal Commission Health and Other Mandatory Savings (Billions of Dollars)
years than the original Fiscal Commission estimates.This analysis includes the costs of fully repealingthe CLASS Act, a long-term care insurance programwhich actually reduces the de cit in the rst decadesince it collects premiums in advance of paying
bene ts. However, the Commission suggested that
Congress could reform rather than repeal the CLASSAct if they could make the program sustainable. If such reforms were enacted, total health savings could
be $487 billion or higher, within the ten year budgetwindow, rather than $400 billion as under the repealscenario.
8/6/2019 Updated Estimates 6292011
http://slidepdf.com/reader/full/updated-estimates-6292011 11/15
10
UpdatedProjections2012-2021
UpdatedProjections2012-2020
OriginalProjections2012-2020
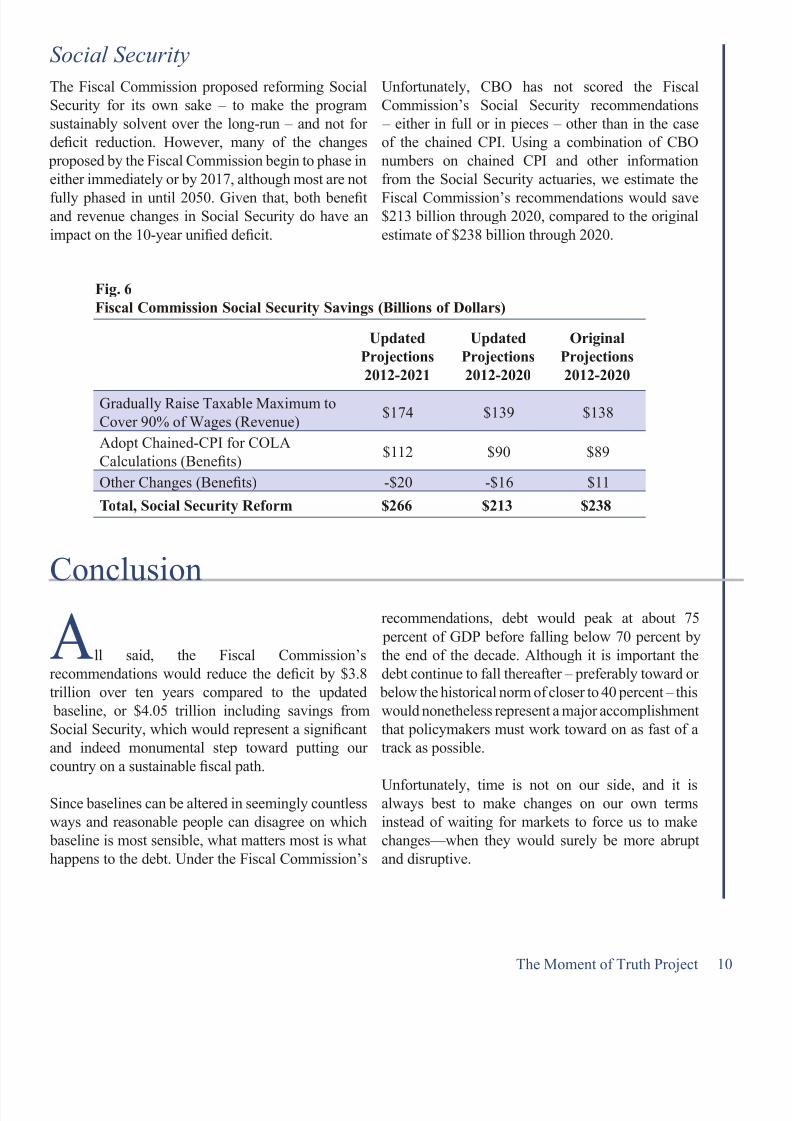
Gradually Raise Taxable Maximum toCover 90% of Wages (Revenue) $174 $139 $138
Adopt Chained-CPI for COLACalculations (Bene ts) $112 $90 $89
Other Changes (Bene ts) -$20 -$16 $11
Total, Social Security Reform $266 $213 $238
Fig. 6Fiscal Commission Social Security Savings (Billions of Dollars)
ll said, the Fiscal Commission’srecommendations would reduce the de cit by $3.8trillion over ten years compared to the updated
baseline, or $4.05 trillion including savings fromSocial Security, which would represent a signi cantand indeed monumental step toward putting our country on a sustainable scal path.
Since baselines can be altered in seemingly countlessways and reasonable people can disagree on which
baseline is most sensible, what matters most is whathappens to the debt. Under the Fiscal Commission’s
recommendations, debt would peak at about 75 percent of GDP before falling below 70 percent bythe end of the decade. Although it is important thedebt continue to fall thereafter – preferably toward or
below the historical norm of closer to 40 percent – thiswould nonetheless represent a major accomplishmentthat policymakers must work toward on as fast of atrack as possible.
Unfortunately, time is not on our side, and it isalways best to make changes on our own termsinstead of waiting for markets to force us to makechanges—when they would surely be more abruptand disruptive.
Conclusion
A
Social Security
The Moment of Truth Project
The Fiscal Commission proposed reforming SocialSecurity for its own sake – to make the programsustainably solvent over the long-run – and not for de cit reduction. However, many of the changes
proposed by the Fiscal Commission begin to phase ineither immediately or by 2017, although most are not
fully phased in until 2050. Given that, both bene tand revenue changes in Social Security do have animpact on the 10-year uni ed de cit.
Unfortunately, CBO has not scored the FiscalCommission’s Social Security recommendations
– either in full or in pieces – other than in the caseof the chained CPI. Using a combination of CBOnumbers on chained CPI and other informationfrom the Social Security actuaries, we estimate the
Fiscal Commission’s recommendations would save$213 billion through 2020, compared to the originalestimate of $238 billion through 2020.
8/6/2019 Updated Estimates 6292011
http://slidepdf.com/reader/full/updated-estimates-6292011 12/15
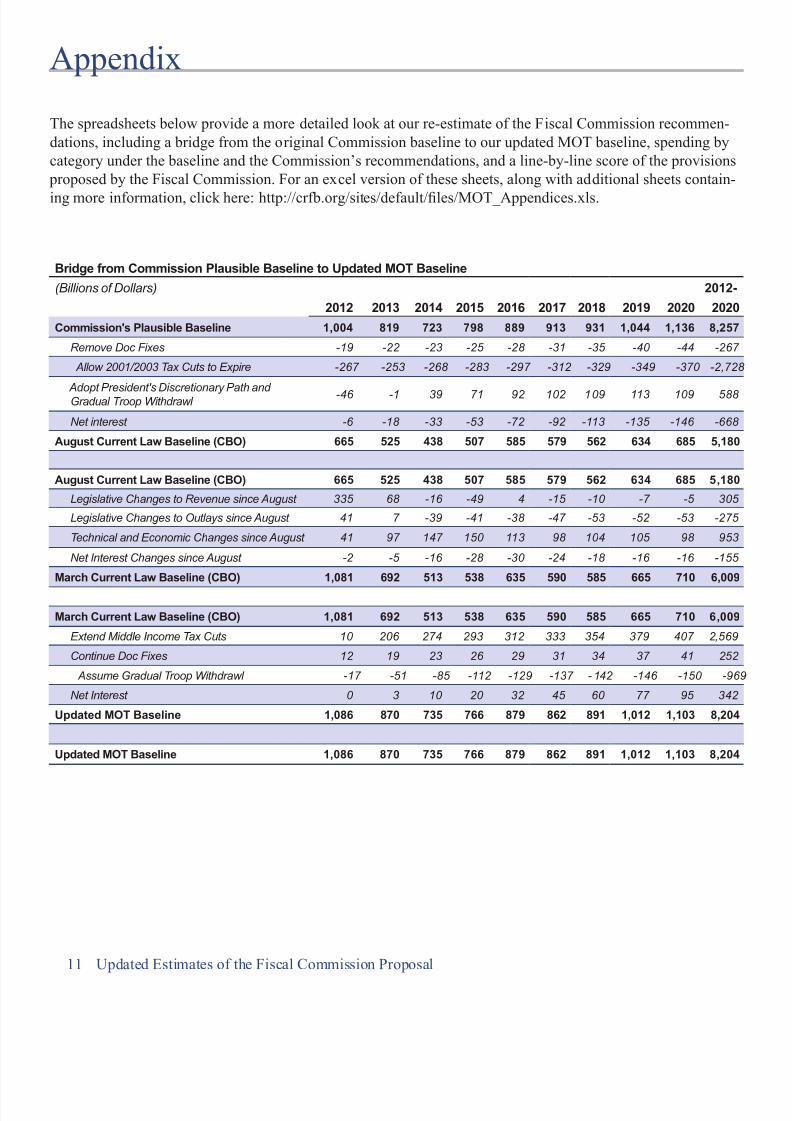
Bridge from Commission Plausible Baseline to Updated MOT Baseline(Billions of Dollars) 2012-
2012 2013 2014 2015 2016 2017 2018 2019 2020 2020Commission's Plausible Baseline 1,004 819 723 798 889 913 931 1,044 1,136 8,257
Remove Doc Fixes -19 -22 -23 -25 -28 -31 -35 -40 -44 -267
Allow 2001/2003 Tax Cuts to Expire -267 -253 -268 -283 -297 -312 -329 -349 -370 -2,728
Adopt President's Discretionary Path and Gradual Troop Withdrawl -46 -1 39 71 92 102 109 113 109 588
Net interest -6 -18 -33 -53 -72 -92 -113 -135 -146 -668
August Current Law Baseline (CBO) 665 525 438 507 585 579 562 634 685 5,180
August Current Law Baseline (CBO) 665 525 438 507 585 579 562 634 685 5,180
Legislative Changes to Revenue since August 335 68 -16 -49 4 -15 -10 -7 -5 305
Legislative Changes to Outlays since August 41 7 -39 -41 -38 -47 -53 -52 -53 -275
Technical and Economic Changes since August 41 97 147 150 113 98 104 105 98 953
Net Interest Changes since August -2 -5 -16 -28 -30 -24 -18 -16 -16 -155
March Current Law Baseline (CBO) 1,081 692 513 538 635 590 585 665 710 6,009
March Current Law Baseline (CBO) 1,081 692 513 538 635 590 585 665 710 6,009
Extend Middle Income Tax Cuts 10 206 274 293 312 333 354 379 407 2,569
Continue Doc Fixes 12 19 23 26 29 31 34 37 41 252
Assume Gradual Troop Withdrawl -17 -51 -85 -112 -129 -137 - 142 -146 -150 -969
Net Interest 0 3 10 20 32 45 60 77 95 342
Updated MOT Baseline 1,086 870 735 766 879 862 891 1,012 1,103 8,204
Updated MOT Baseline 1,086 870 735 766 879 862 891 1,012 1,103 8,204
11 Updated Estimates of the Fiscal Commission Proposal
Appendix
The spreadsheets below provide a more detailed look at our re-estimate of the Fiscal Commission recommen-dations, including a bridge from the original Commission baseline to our updated MOT baseline, spending bycategory under the baseline and the Commission’s recommendations, and a line-by-line score of the provisions
proposed by the Fiscal Commission. For an excel version of these sheets, along with additional sheets contain-
ing more information, click here: http://crfb.org/sites/default/ les/MOT_Appendices.xls.
8/6/2019 Updated Estimates 6292011
http://slidepdf.com/reader/full/updated-estimates-6292011 13/15
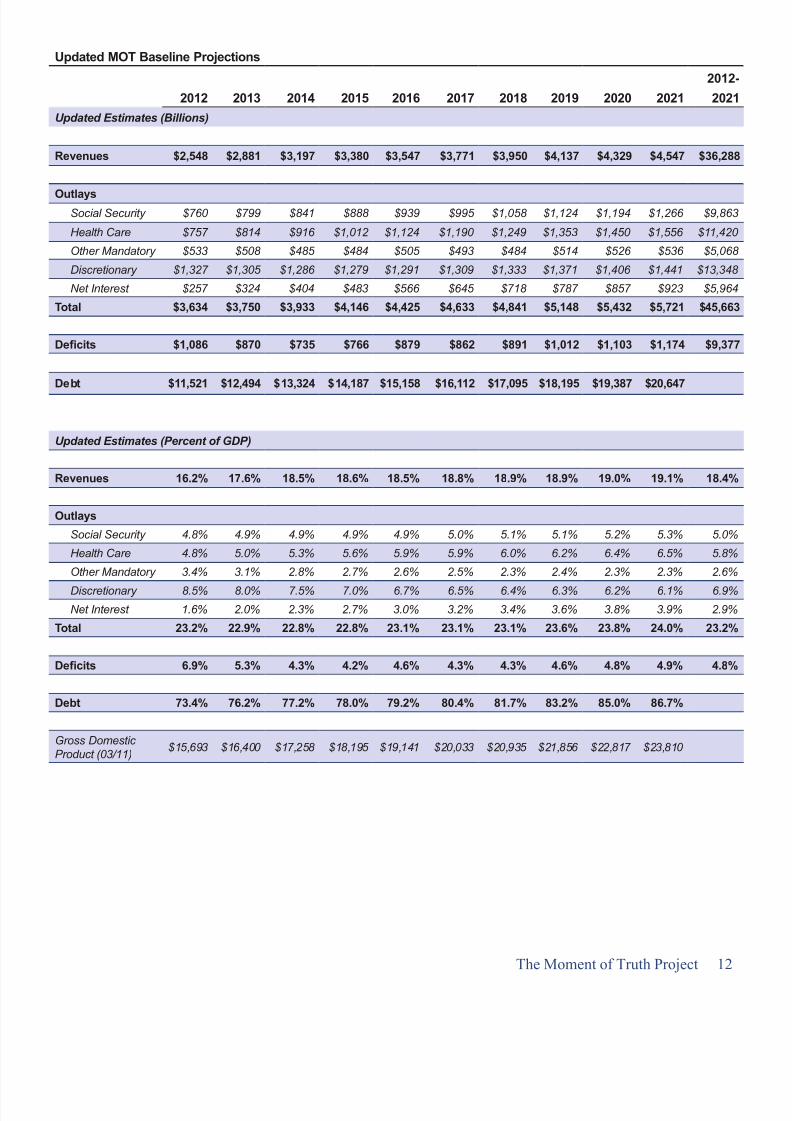
Updated MOT Baseline Projections
2012-2012 2013 2014 2015 2016 2017 2018 2019 2020 2021 2021
Updated Estimates (Billions)
Revenues $2,548 $2,881 $3,197 $3,380 $3,547 $3,771 $3,950 $4,137 $4,329 $4,547 $36,288
OutlaysSocial Security $760 $799 $841 $888 $939 $995 $1,058 $1,124 $1,194 $1,266 $9,863
Health Care $757 $814 $916 $1,012 $1,124 $1,190 $1,249 $1,353 $1,450 $1,556 $11,420
Other Mandatory $533 $508 $485 $484 $505 $493 $484 $514 $526 $536 $5,068
Discretionary $1,327 $1,305 $1,286 $1,279 $1,291 $1,309 $1,333 $1,371 $1,406 $1,441 $13,348
Net Interest $257 $324 $404 $483 $566 $645 $718 $787 $857 $923 $5,964
Total $3,634 $3,750 $3,933 $4,146 $4,425 $4,633 $4,841 $5,148 $5,432 $5,721 $45,663
De cits $1,086 $870 $735 $766 $879 $862 $891 $1,012 $1,103 $1,174 $9,377
Debt $11,521 $12,494 $13,324 $14,187 $15,158 $16,112 $17,095 $18,195 $19,387 $20,647
Updated Estimates (Percent of GDP)
Revenues 16.2% 17.6% 18.5% 18.6% 18.5% 18.8% 18.9% 18.9% 19.0% 19.1% 18.4%
Outlays
Social Security 4.8% 4.9% 4.9% 4.9% 4.9% 5.0% 5.1% 5.1% 5.2% 5.3% 5.0%
Health Care 4.8% 5.0% 5.3% 5.6% 5.9% 5.9% 6.0% 6.2% 6.4% 6.5% 5.8%
Other Mandatory 3.4% 3.1% 2.8% 2.7% 2.6% 2.5% 2.3% 2.4% 2.3% 2.3% 2.6%
Discretionary 8.5% 8.0% 7.5% 7.0% 6.7% 6.5% 6.4% 6.3% 6.2% 6.1% 6.9%Net Interest 1.6% 2.0% 2.3% 2.7% 3.0% 3.2% 3.4% 3.6% 3.8% 3.9% 2.9%
Total 23.2% 22.9% 22.8% 22.8% 23.1% 23.1% 23.1% 23.6% 23.8% 24.0% 23.2%
De cits 6.9% 5.3% 4.3% 4.2% 4.6% 4.3% 4.3% 4.6% 4.8% 4.9% 4.8%
Debt 73.4% 76.2% 77.2% 78.0% 79.2% 80.4% 81.7% 83.2% 85.0% 86.7%
Gross Domestic Product (03/11) $15,693 $16,400 $17,258 $18,195 $19,141 $20,033 $20,935 $21,856 $22,817 $23,810
12The Moment of Truth Project
8/6/2019 Updated Estimates 6292011
http://slidepdf.com/reader/full/updated-estimates-6292011 14/15
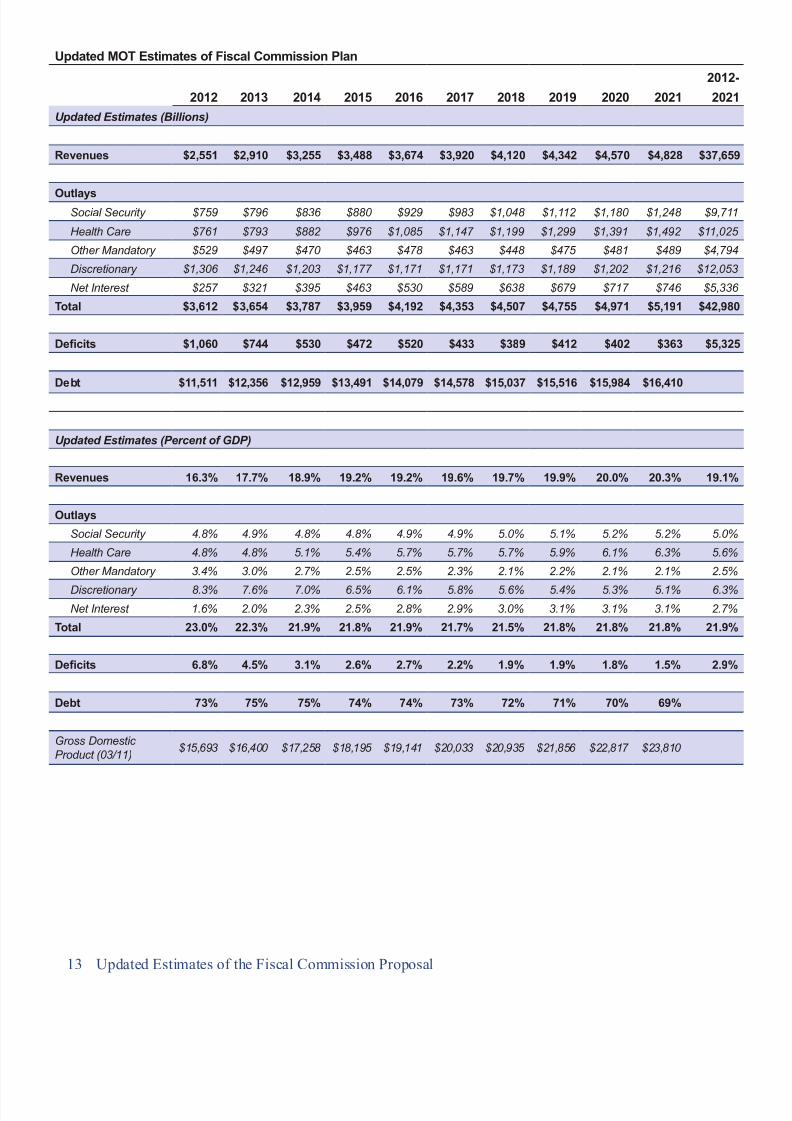
Updated MOT Estimates of Fiscal Commission Plan
2012-2012 2013 2014 2015 2016 2017 2018 2019 2020 2021 2021
Updated Estimates (Billions)
Revenues $2,551 $2,910 $3,255 $3,488 $3,674 $3,920 $4,120 $4,342 $4,570 $4,828 $37,659
OutlaysSocial Security $759 $796 $836 $880 $929 $983 $1,048 $1,112 $1,180 $1,248 $9,711
Health Care $761 $793 $882 $976 $1,085 $1,147 $1,199 $1,299 $1,391 $1,492 $11,025
Other Mandatory $529 $497 $470 $463 $478 $463 $448 $475 $481 $489 $4,794
Discretionary $1,306 $1,246 $1,203 $1,177 $1,171 $1,171 $1,173 $1,189 $1,202 $1,216 $12,053
Net Interest $257 $321 $395 $463 $530 $589 $638 $679 $717 $746 $5,336
Total $3,612 $3,654 $3,787 $3,959 $4,192 $4,353 $4,507 $4,755 $4,971 $5,191 $42,980
De cits $1,060 $744 $530 $472 $520 $433 $389 $412 $402 $363 $5,325
Debt $11,511 $12,356 $12,959 $13,491 $14,079 $14,578 $15,037 $15,516 $15,984 $16,410
Updated Estimates (Percent of GDP)
Revenues 16.3% 17.7% 18.9% 19.2% 19.2% 19.6% 19.7% 19.9% 20.0% 20.3% 19.1%
Outlays
Social Security 4.8% 4.9% 4.8% 4.8% 4.9% 4.9% 5.0% 5.1% 5.2% 5.2% 5.0%
Health Care 4.8% 4.8% 5.1% 5.4% 5.7% 5.7% 5.7% 5.9% 6.1% 6.3% 5.6%
Other Mandatory 3.4% 3.0% 2.7% 2.5% 2.5% 2.3% 2.1% 2.2% 2.1% 2.1% 2.5%
Discretionary 8.3% 7.6% 7.0% 6.5% 6.1% 5.8% 5.6% 5.4% 5.3% 5.1% 6.3%Net Interest 1.6% 2.0% 2.3% 2.5% 2.8% 2.9% 3.0% 3.1% 3.1% 3.1% 2.7%
Total 23.0% 22.3% 21.9% 21.8% 21.9% 21.7% 21.5% 21.8% 21.8% 21.8% 21.9%
De cits 6.8% 4.5% 3.1% 2.6% 2.7% 2.2% 1.9% 1.9% 1.8% 1.5% 2.9%
Debt 73% 75% 75% 74% 74% 73% 72% 71% 70% 69%
Gross Domestic Product (03/11) $15,693 $16,400 $17,258 $18,195 $19,141 $20,033 $20,935 $21,856 $22,817 $23,810
13 Updated Estimates of the Fiscal Commission Proposal
8/6/2019 Updated Estimates 6292011
http://slidepdf.com/reader/full/updated-estimates-6292011 15/15
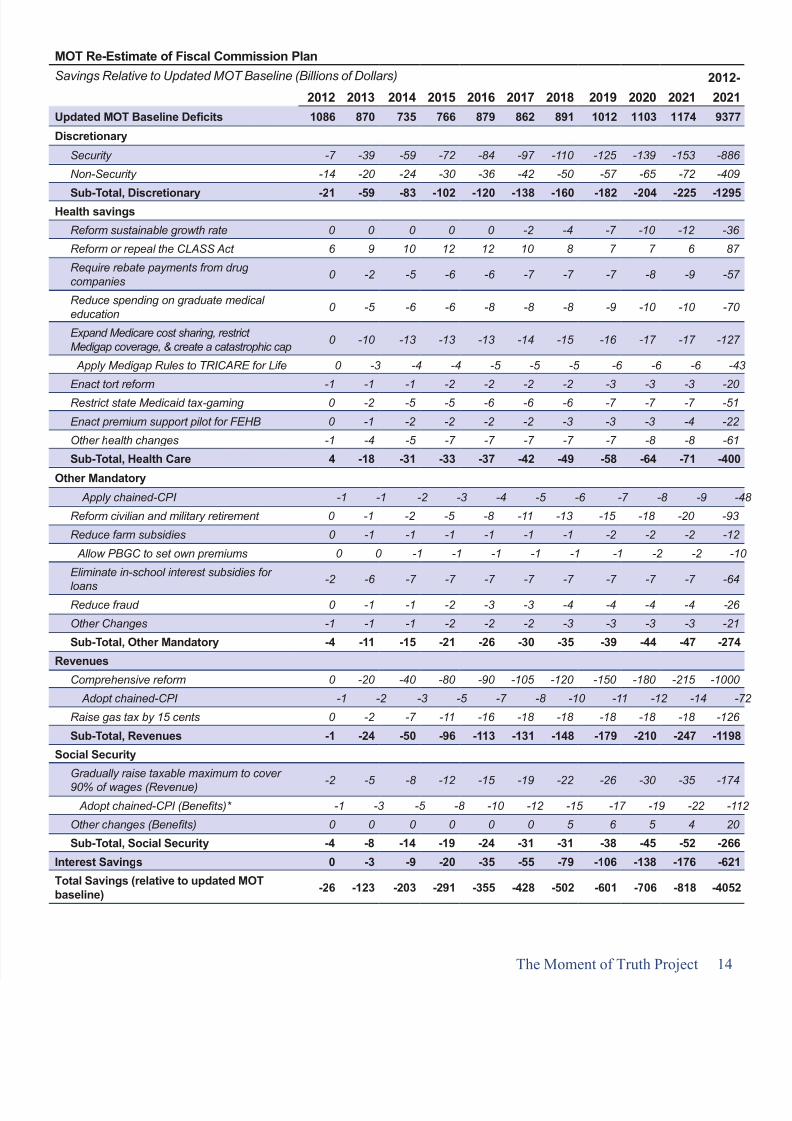
MOT Re-Estimate of Fiscal Commission PlanSavings Relative to Updated MOT Baseline (Billions of Dollars) 2012-
2012 2013 2014 2015 2016 2017 2018 2019 2020 2021 2021Updated MOT Baseline De cits 1086 870 735 766 879 862 891 1012 1103 1174 9377
Discretionary
Security -7 -39 -59 -72 -84 -97 -110 -125 -139 -153 -886
Non-Security -14 -20 -24 -30 -36 -42 -50 -57 -65 -72 -409
Sub-Total, Discretionary -21 -59 -83 -102 -120 -138 -160 -182 -204 -225 -1295Health savings
Reform sustainable growth rate 0 0 0 0 0 -2 -4 -7 -10 -12 -36
Reform or repeal the CLASS Act 6 9 10 12 12 10 8 7 7 6 87
Require rebate payments from drug companies 0 -2 -5 -6 -6 -7 -7 -7 -8 -9 -57
Reduce spending on graduate medical education 0 -5 -6 -6 -8 -8 -8 -9 -10 -10 -70
Expand Medicare cost sharing, restrict Medigap coverage, & create a catastrophic cap 0 -10 -13 -13 -13 -14 -15 -16 -17 -17 -127
Apply Medigap Rules to TRICARE for Life 0 -3 -4 -4 -5 -5 -5 -6 -6 -6 -43
Enact tort reform -1 -1 -1 -2 -2 -2 -2 -3 -3 -3 -20
Restrict state Medicaid tax-gaming 0 -2 -5 -5 -6 -6 -6 -7 -7 -7 -51
Enact premium support pilot for FEHB 0 -1 -2 -2 -2 -2 -3 -3 -3 -4 -22
Other health changes -1 -4 -5 -7 -7 -7 -7 -7 -8 -8 -61
Sub-Total, Health Care 4 -18 -31 -33 -37 -42 -49 -58 -64 -71 -400
Other Mandatory
Apply chained-CPI -1 -1 -2 -3 -4 -5 -6 -7 -8 -9 -48
Reform civilian and military retirement 0 -1 -2 -5 -8 -11 -13 -15 -18 -20 -93
Reduce farm subsidies 0 -1 -1 -1 -1 -1 -1 -2 -2 -2 -12
Allow PBGC to set own premiums 0 0 -1 -1 -1 -1 -1 -1 -2 -2 -10
Eliminate in-school interest subsidies for
loans-2 -6 -7 -7 -7 -7 -7 -7 -7 -7 -64
Reduce fraud 0 -1 -1 -2 -3 -3 -4 -4 -4 -4 -26
Other Changes -1 -1 -1 -2 -2 -2 -3 -3 -3 -3 -21
Sub-Total, Other Mandatory -4 -11 -15 -21 -26 -30 -35 -39 -44 -47 -274
Revenues
Comprehensive reform 0 -20 -40 -80 -90 -105 -120 -150 -180 -215 -1000
Adopt chained-CPI -1 -2 -3 -5 -7 -8 -10 -11 -12 -14 -72
Raise gas tax by 15 cents 0 -2 -7 -11 -16 -18 -18 -18 -18 -18 -126
Sub-Total, Revenues -1 -24 -50 -96 -113 -131 -148 -179 -210 -247 -1198
Social Security
Gradually raise taxable maximum to cover 90% of wages (Revenue) -2 -5 -8 -12 -15 -19 -22 -26 -30 -35 -174
Adopt chained-CPI (Bene ts)* -1 -3 -5 -8 -10 -12 -15 -17 -19 -22 -112
Other changes (Bene ts) 0 0 0 0 0 0 5 6 5 4 20
Sub-Total, Social Security -4 -8 -14 -19 -24 -31 -31 -38 -45 -52 -266
Interest Savings 0 -3 -9 -20 -35 -55 -79 -106 -138 -176 -621
Total Savings (relative to updated MOTbaseline) -26 -123 -203 -291 -355 -428 -502 -601 -706 -818 -4052
14The Moment of Truth Project