Embed Size (px)
Citation preview

1
Jean Laherrere 1 May 2019 Updated US primary energy in quad I have already written a first short paper on “US primary energy in quad” https://aspofrance.files.wordpress.com/2019/03/uspe2019.pdf This paper is more complete. Most of US oil and gas production data are reported in volume, but the heat content of the petroleum products varies in linear relationship with density (from 10°API to 70°API).
The heat content of oil production by country varies from 5100 to 6400 kBtu/b = 26%
y = -0,1581x + 44,314!
30!
35!
40!
45!
10! 15! 20! 25! 30! 35! 40! 45! 50! 55! 60! 65! 70!
heat
con
tent
GJ/
m3!
°API!
Canada oil products energy content vs gravity!
Jean Laherrere March 2015!
aviation gasoline!
asphalt!
heavy fuel oil!
lubricant & greases!
light fuel oil!
kerosene!diesel!
http://www.statcan.gc.ca/pub/57-601-x/2010004/appendix-appendice1-eng.htm!
heavy oil!
medium & light oil!
5000
5100
5200
5300
5400
5500
5600
5700
5800
5900
6000
6100
6200
6300
6400
6500
0 10 20 30 40 50 60 70 80
heat
con
tent
kBT
U/b
cumulative crude +condensate Mb/d
EIA 2014 crude oil +condensate heat content versus production
heat content kBtu/b
Jean Laherrere 2015
Sudan 5084
Cuba 6393
US 5800 constant since 1950!
average 5860 kBtu/bmedian 5880 kBtu/b

2
EIA was unable before 2013 to measure the density of the US crude production. In fact, EIA does not measure but guesses US oil production through a survey (EIA-914) https://www.eia.gov/petroleum/production/faqs.php With the expanded Form EIA-914 survey, EIA collects data from a sample of less than 500 out of 13,000 currently active operators of oil and natural gas wells. These operators account for about 90% of crude oil, lease condensate, and natural gas production in the Lower 48 states and a significant share of the total oil and natural gas production in each of the 15 states and the federal Gulf of Mexico for which data are individually collected.
EIA was reporting from 1950 to 2013 a constant heat content for US crude production (green at 5.8 MBtu/b) when all other products were declining except crude oil import (to compensate). This diminution of the energy of oil production by volume is due to the LTO production. The API input at refineries increases since 2008.

3
It is obvious that reporting US energy by volume is misleading and it is necessary to work on energy data. But it is obvious that US past energy data quality is poor ! EIA recognizes this fact by giving historical data only since 1949. But EIA monthly MER reports are complete and of very good quality, better than IEA or UK or Norway agencies reports. The energy unit of the SI (system international of units, which is the legal rule in every country in the world except the US, Liberia and Myanmar) is the Joule or the toe (tonne oil equivalent 1 toe = 42 GJ) One joule is about the energy to lift an apple by one meter. One man-day muscular energy (35 W for 8 hours) represents about one MJ (24 g of oil), when one horse energy represents 21 men and a 200 HP tractor represents 4300 men. OECD citizens use 0.2 GL per capita per year = 4.7 toe = 180 “energy slaves” (Didier Sornette 2019 & Euan Mearns’ site) French household, which consumes 4 MWh per year, uses in fact 50 virtual minimum salary (SMIC) men paid 1 € per month (Philippe Charlez’s book 2017) US agencies report energy by using the Btu = British thermal unit (illegal in the European Union since 1980, replaced by the Joule) 1 US quad = 1000 US trillion Btu =PBtu = 1 Btu = 1055 J and 1 quad ~ 1.06 EJ (exajoule) ~25 Mtoe SI quadrillion = million power 4 = 10E24 = Y (yotta) IEA definition:
27
28
29
30
31
32
33
3,5
4,0
4,5
5,0
5,5
6,0
6,5
1950 1960 1970 1980 1990 2000 2010 2020
°API
US
crud
e oi
l inp
ut r
efin
erie
s
MBt
u/b
year
US crude oil, petroleum products & NGPL heat content from EIA
crude oil import
crude oil prod & exportproducts import
products exportpetroleum consumption
motor gasoline consumptionNGPL prod
°API input refineries
Jean Laherrere Ap 2019
http://www.eia.gov/totalenergy/data/monthly/pdf/sec13_2.pdf

4
Electricity generation in TWh = 3600 TJ = 3.4 GBtu = 3.4/10E6 quad 1 quad = 293 TWh USDOE EIA MER reports each month the primary energy since 1949 -Primary energy PE consumption is flat since 2005, but production and export up and import are down.
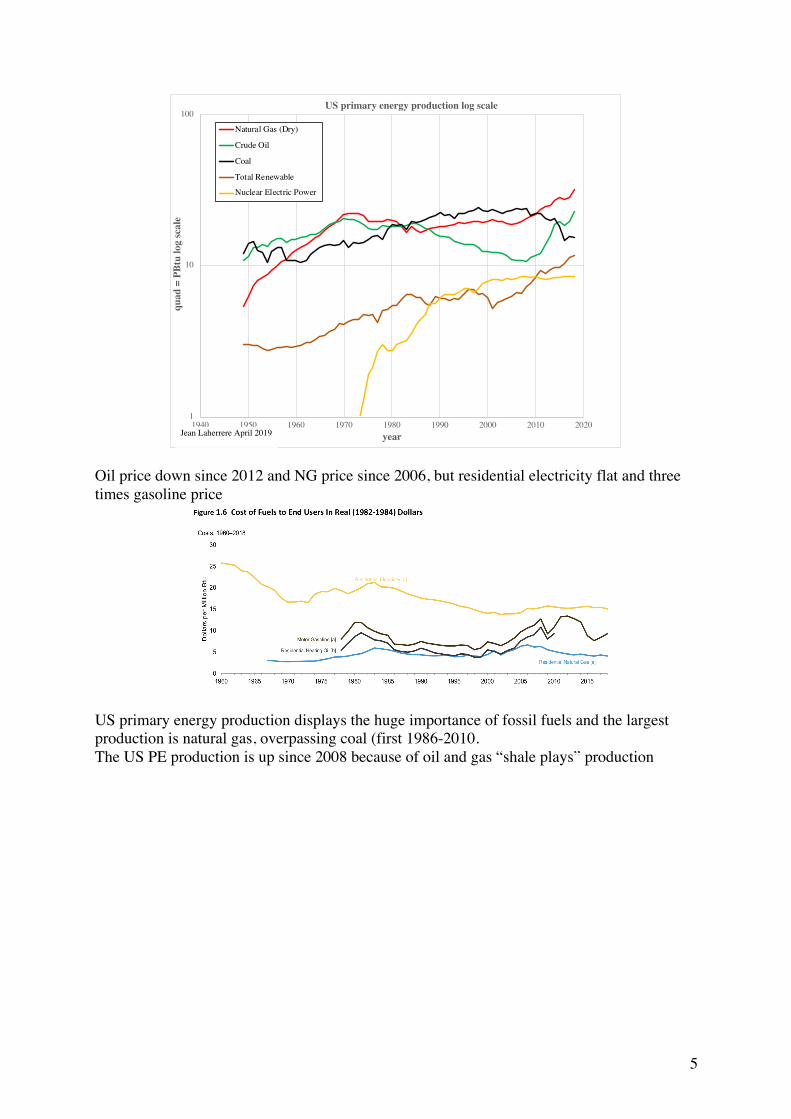
PE production is up, mainly from crude oil and natural gas. Coal production is down since 2008 Since 1990 NG production is higher than oil production
To compare rise, log scale graph is better. Since 2011 rise of gas production is similar to the rise of the renewables. but oil rise is higher
5
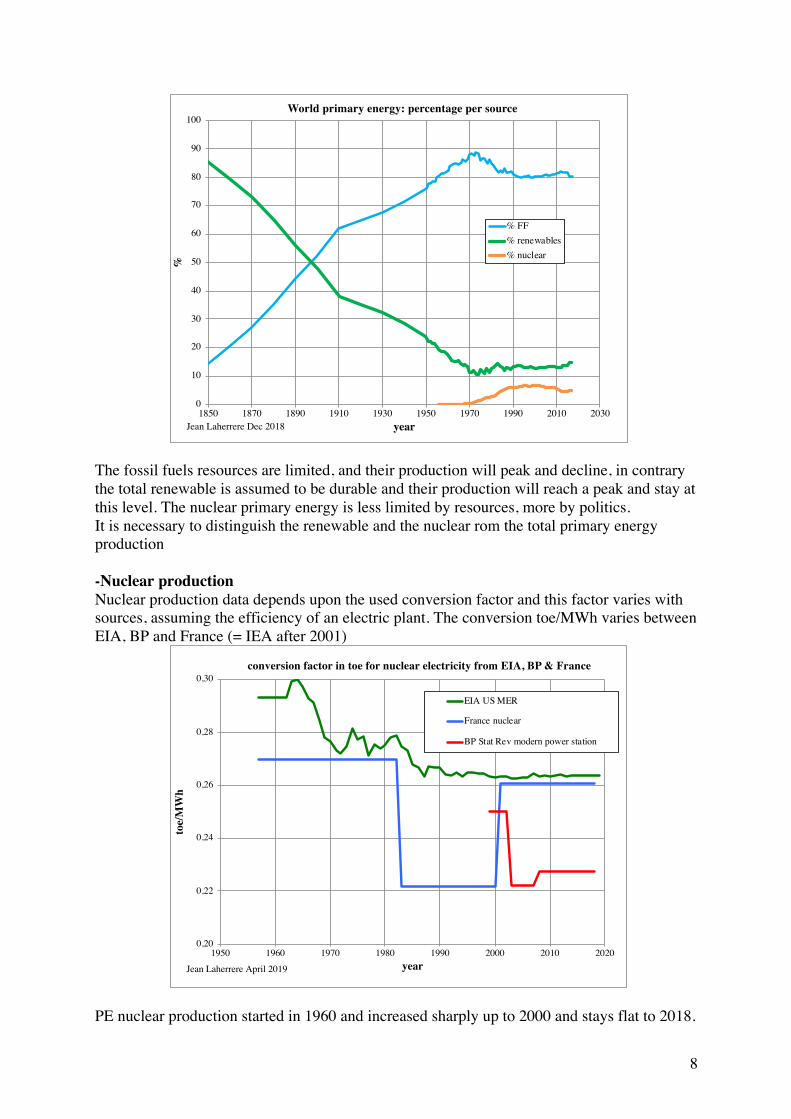
Oil price down since 2012 and NG price since 2006, but residential electricity flat and three times gasoline price
US primary energy production displays the huge importance of fossil fuels and the largest production is natural gas, overpassing coal (first 1986-2010. The US PE production is up since 2008 because of oil and gas “shale plays” production
1
10
100
1940 1950 1960 1970 1980 1990 2000 2010 2020
quad
= P
Btu
log
scal
e
year
US primary energy production log scale
Natural Gas (Dry)
Crude Oil
Coal
Total Renewable
Nuclear Electric Power
Jean Laherrere April 2019

6
US PE consumption is almost flat since 2000 due to the decline of coal consumption compensated by the rise of NG consumption.
Comparison production and consumption displays the importance of “shale plays” since 2008
0
250
500
750
1000
1250
1500
1750
2000
2250
2500
0
10
20
30
40
50
60
70
80
90
100
1940 1950 1960 1970 1980 1990 2000 2010 2020
Mto
e
quad
= P
Btu
year
US primary energy productionPE productionTotal Fossil FuelsNatural Gas (Dry)Crude OilCoalTotal RenewableNuclear Electric PowerNG Plant LiquidsBiomass EnergyHydroelectric PowerWind EnergySolar EnergyGeothermal EnergyPE Mtoe
Jean Laherrere April 2019
0
10
20
30
40
50
60
70
80
90
100
110
1900 1910 1920 1930 1940 1950 1960 1970 1980 1990 2000 2010 2020
quad
= P
Btu
year
US primary energy consumption
PE consfossil fuels consoil consgas conscoaltotal renewablenuclearbiomasshydrogeothermalsolarwind
Jean Laherrere April 2019

7
The plot of PE consumption and production in percentage shows roughly that for the last 20 years fossil fuels represent 80% when nuclear about 10% and renewables are about 10%, as in 1920: not much change! Renewables are far to take over!
It is interesting to compare the US percentage on energy with the world primary energy (in Mtoe) and we see the same pattern with fossil fuels at 80% for the last 20 years, nuclear is less at 5% and renewables is more at 15%. But it is obvious that fossil fuels trend at 80% will stay for a while!
0
10
20
30
40
50
60
70
80
90
100
110
1900 1910 1920 1930 1940 1950 1960 1970 1980 1990 2000 2010 2020
quad
= P
Btu
year
US primary energy consumption & production
PE consPE productionfossil fuels consTotal Fossil Fuels prodoil conscrude oil + NGL prodgas consNatural Gas (Dry) prodtotal renewable constotal renewable prod
Jean Laherrere April 2019
0
10
20
30
40
50
60
70
80
90
100
1900 1920 1940 1960 1980 2000 2020
perc
enta
ge P
E %
year
US primary energy consumption & production in percentage
% fossil fuels cons% fossil fuels prod% renewables cons% renewables prod% nuclear cons% nuclear prod
Jean Laherrere April 2019
8
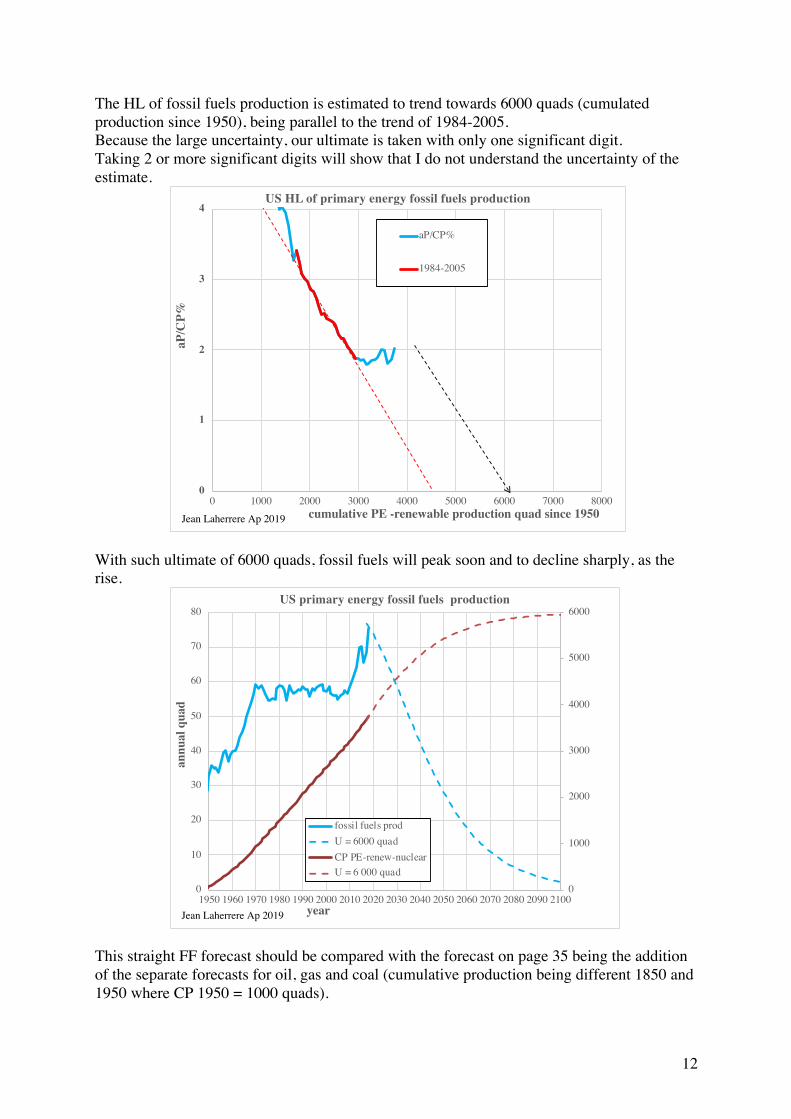
The fossil fuels resources are limited, and their production will peak and decline, in contrary the total renewable is assumed to be durable and their production will reach a peak and stay at this level. The nuclear primary energy is less limited by resources, more by politics. It is necessary to distinguish the renewable and the nuclear rom the total primary energy production -Nuclear production Nuclear production data depends upon the used conversion factor and this factor varies with sources, assuming the efficiency of an electric plant. The conversion toe/MWh varies between EIA, BP and France (= IEA after 2001)
PE nuclear production started in 1960 and increased sharply up to 2000 and stays flat to 2018.
0
10
20
30
40
50
60
70
80
90
100
1850 1870 1890 1910 1930 1950 1970 1990 2010 2030
%
year
World primary energy: percentage per source
% FF% renewables% nuclear
Jean Laherrere Dec 2018
0,20
0,22
0,24
0,26
0,28
0,30
1950 1960 1970 1980 1990 2000 2010 2020
toe/
MW
h
year
conversion factor in toe for nuclear electricity from EIA, BP & France
EIA US MER
France nuclear
BP Stat Rev modern power station
Jean Laherrere April 2019

9
AEO2019 forecasts a sharp decline 2019-204 and flat beyond to 2050. AEO2010 forecasted an increase. We plotted on the same graph the US electricity generation nuclear reported in TWh by IEA/WEO: both data correlate well with the equivalence 1 quad = 100 TWh, when in energy is 1 quad = 293 TWh, but the conversion factor must be applied, depending the assumed efficiency. WEO2011 forecasted an increase, WEO2018 forecasts a decrease but less than AEO2019. Our guest is the nuclear will stay flat (dotted arrow)
-Total renewable Total renewable includes biomass, hydroelectric, wind, solar and geothermal. Renewables production was about 3 quads from 1850 to 1940, 6 quads from 1980 to 2005 and rises to 11.5 quads in 2018. Renewables are assumed to go towards an asymptote and to stay there.
0
100
200
300
400
500
600
700
800
900
1000
0
1
2
3
4
5
6
7
8
9
10
1960 1970 1980 1990 2000 2010 2020 2030 2040 2050
elac
ctri
city
gen
erat
ion
TWh
quad
US primary energy nuclear production
nuclear quad
AEO2010
AEO2019
WEO TWh
WEO2011
WEO2018
Jean Laherrere April 2019
1 quad = 293 TWh

10
The asymptote of production is estimated to be about 118 or20 quads, from the extrapolation of the bumpy annual growth versus annual production. With such asymptote at 18 quads, renewable production is estimated to be about 16 quads in 2050, which is the value forecasted by AEO2019; AEO2010 was more optimistic for renewable in 2035 than AEO2019 by 14%! AEO2019 is less optimistic on renewable than AEO2010, because with the shale plays less renewable is needed, but is it right? The plot of PE annual production growth versus annual production trends (loosely) towards 18 quads. The uncertainty is very high, but an ultimate of 20 quads
-Fossil fuels production
0
2
4
6
8
10
12
14
16
18
20
1800 1820 1840 1860 1880 1900 1920 1940 1960 1980 2000 2020 2040 2060 2080 2100
quad
= P
Btu
year
US primary energy total renewable production
A = 20 quadA = 18 quadAEO2010 renewableAEO2019 renewabletotal renewablebiomasshydrowindsolargeothermal
Jean Laherrere April 2019
-1
0
1
0 2 4 6 8 10 12 14 16 18 20
annu
al r
enew
able
gro
wth
qua
d
annual production quad
US annual growth vs primary energy total renewable production
an growth renew2009-2018
Jean Laherrere April 2019

11
US fossil fuels production in quad displays a large increase of 9 %/a for NGPL since 2009, of 7.5 %/a for crude oil since 2008 and only 4 %/a for natural gas since 2005. Crude oil rise for 1951-1970 was 2.3%/a and the decline for 1985-2006 2.8 %/a, pretty close. The US oil production is a good example of symmetry because the high number of oil producers acting in random. But shale plays have disturbed the trend and it was completely ignored in AEO 2010.
The same display in log scale allows to compare slopes. NGLP production is similar to NG production, except for the shale gas
If renewables and nuclear are assumed to not decline, it is not the case for the other sources of primary energy, being the fossil fuels, which will peak and decline.
0
125
250
375
500
625
750
875
1000
0
5
10
15
20
25
30
35
40
1940 1950 1960 1970 1980 1990 2000 2010 2020
Mto
e
quad
year
US fossil fuels production in quadNG + NGPLrise 5.8 %/arise 4 %/aNatural Gas (Dry)rise 2.3 %/adecline 2,8 %/arise 7.5%/aCrude OilCoalrise 5,5 %/arise 9 %/aNG Plant Liquidscrude oil Mtoe
Jean Laherrere Feb 2019
in 2018 NGPL = 19% of NGNG+NGPL = 39 % PENG+NGPL = 164 % crude oil
1
10
100
1940 1950 1960 1970 1980 1990 2000 2010 2020
quad
log
scal
e
year
US fossil fuels production in quad log scale
NG + NGPL
Natural Gas (Dry)
Crude Oil
Coal
Natural Gas Plant Liquids
Jean Laherrere Feb 2019
in 2018 NGPL = 19% of NGNG+NGPL = 39 % PENG+NGPL = 164 % crude oil
12
The HL of fossil fuels production is estimated to trend towards 6000 quads (cumulated production since 1950), being parallel to the trend of 1984-2005. Because the large uncertainty, our ultimate is taken with only one significant digit. Taking 2 or more significant digits will show that I do not understand the uncertainty of the estimate.
With such ultimate of 6000 quads, fossil fuels will peak soon and to decline sharply, as the rise.
This straight FF forecast should be compared with the forecast on page 35 being the addition of the separate forecasts for oil, gas and coal (cumulative production being different 1850 and 1950 where CP 1950 = 1000 quads).
0
1
2
3
4
0 1000 2000 3000 4000 5000 6000 7000 8000
aP/C
P%
cumulative PE -renewable production quad since 1950
US HL of primary energy fossil fuels production
aP/CP%
1984-2005
Jean Laherrere Ap 2019
0
1000
2000
3000
4000
5000
6000
0
10
20
30
40
50
60
70
80
1950 1960 1970 1980 1990 2000 2010 2020 2030 2040 2050 2060 2070 2080 2090 2100
annu
al q
uad
year
US primary energy fossil fuels production
fossil fuels prodU = 6000 quadCP PE-renew-nuclearU = 6 000 quad
Jean Laherrere Ap 2019

13
-Total primary energy forecast Adding fossil fuels forecast with the forecast for renewable and nuclear, the PE production in 2050 will be 53 quads, when AEO2019 forecasts 115 quads, more than the double! But AEO2010 forecast for 2035 was 24 % lower than AEO2019! In 2030 PE will be back to 2000 level at 70 quads, but beyond it is too severe, needing a lot of energy import and it is likely that nuclear will return or that renewable will improve.
The same data in percentage of the PE displays fossil fuels production percentage around 80 % from 1998 to 2018 for real data and staying at 80% up to 2050 for AEO2019. AEO2010 forecasted a FF percentage in decline. EIA does not forecast any significant energetic transition before 2050
In contrary my forecast expects for FF around 55% in 2050.
0
10
20
30
40
50
60
70
80
90
100
110
120
1800 1820 1840 1860 1880 1900 1920 1940 1960 1980 2000 2020 2040 2060 2080 2100
annu
al P
E p
rodu
ctio
n qu
ad
year
US primary energy production FF, renewable & nuclear
AEO2010AEO2019U PEPE prodU = 6000 quadfossil fuels prodA = 18 quadAEO2010 renewableAEO2019 renewabletotal renewable prodnuclear productionfuture flat
Jean Laherrere April 2019
0
10
20
30
40
50
60
70
80
90
100
1950 1960 1970 1980 1990 2000 2010 2020 2030 2040 2050 2060 2070 2080 2090 2100
%
year
US primary energy production FF, renewable & nuclear in percentage
% FF% FF my guess% FF AEO2019% FF AEO2010% renew% renew my guess% renew AEO2019% renew AEO2010% nuclear% nuclear my guess% nucl AEO2019% nucl AEO2010
Jean Laherrere April 2019

14
EIA/AEO evolution 1979-2019 of the PE forecast shows clearly that EIA forecasting is not good in the past and the present forecast should be about the same!
The US PE energy per capita (in red) has peaked at 310 MBtu in 1970, then declined to 235 MBtu in 2005 and is in 2018 at 290 MBtu = 53 boe (US crude oil barrel = 5,8 MBtu) My forecast for PE production per capita in 2050 will be in at 140 MBtu (which was the value in 1900), against the double for AEO2017. AEO2019 forecasts a peak for PE per capita in 2026 at 318 MBtu, against my forecast of 280 in 2020. But my forecast for 2030 is equal to AEO2010 forecast!
0
10
20
30
40
50
60
70
80
90
100
110
120
1960 1970 1980 1990 2000 2010 2020 2030 2040 2050
PE p
rodu
ctio
n qu
ad
year
US PE production: AEO evolution 1979-2019 AEO1979AEO1982AEO1985AEO1990AEO1993AEO1994AEO1995AEO1996AEO1997AEO1998AEO1999AEO2000AEO2001AEO2002AEO2003AEO2004AEO2005AEO2006AEO2007AEO2008AEO2008AEO2009AEO2010AEO2011AEO2012AEO2013AEO2014AEO2015AEO2017AEO2018AEO2019actualactual-15%actual+15%Jean Laherrere Ap 2019
0
50
100
150
200
250
300
350
0
10
20
30
40
50
60
70
80
90
100
110
120
1800 1820 1840 1860 1880 1900 1920 1940 1960 1980 2000 2020 2040 2060 2080 2100
PE/c
apita
MBt
u
annu
al P
E p
rodu
ctio
n qu
ad
year
US primary energy production & per capita
AEO2010AEO2019U PEPE prodAEO201O/capAEO2019/capU PE/capPE/cap MBtu
Jean Laherrere April 2019
15
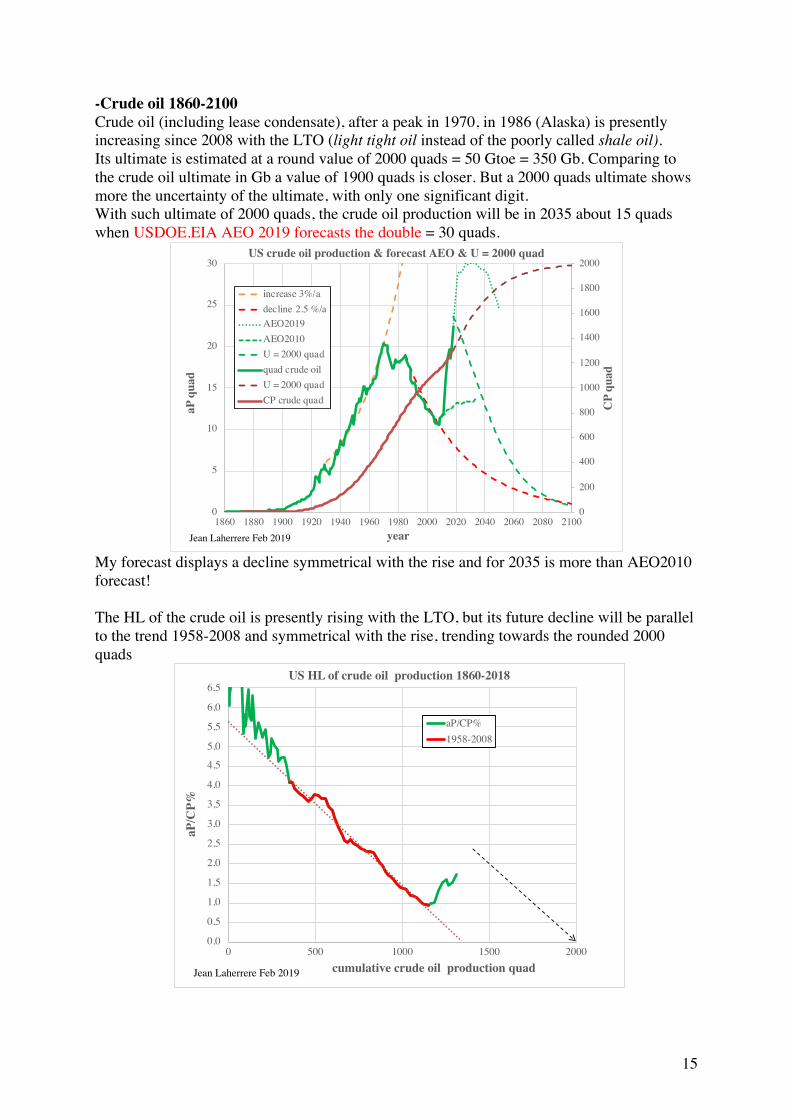
-Crude oil 1860-2100 Crude oil (including lease condensate), after a peak in 1970, in 1986 (Alaska) is presently increasing since 2008 with the LTO (light tight oil instead of the poorly called shale oil). Its ultimate is estimated at a round value of 2000 quads = 50 Gtoe = 350 Gb. Comparing to the crude oil ultimate in Gb a value of 1900 quads is closer. But a 2000 quads ultimate shows more the uncertainty of the ultimate, with only one significant digit. With such ultimate of 2000 quads, the crude oil production will be in 2035 about 15 quads when USDOE.EIA AEO 2019 forecasts the double = 30 quads.
My forecast displays a decline symmetrical with the rise and for 2035 is more than AEO2010 forecast! The HL of the crude oil is presently rising with the LTO, but its future decline will be parallel to the trend 1958-2008 and symmetrical with the rise, trending towards the rounded 2000 quads
0
200
400
600
800
1000
1200
1400
1600
1800
2000
0
5
10
15
20
25
30
1860 1880 1900 1920 1940 1960 1980 2000 2020 2040 2060 2080 2100
CP
quad
aP q
uad
year
US crude oil production & forecast AEO & U = 2000 quad
increase 3%/adecline 2.5 %/aAEO2019AEO2010U = 2000 quadquad crude oilU = 2000 quadCP crude quad
Jean Laherrere Feb 2019
0,0
0,5
1,0
1,5
2,0
2,5
3,0
3,5
4,0
4,5
5,0
5,5
6,0
6,5
0 500 1000 1500 2000
aP/C
P%
cumulative crude oil production quad
US HL of crude oil production 1860-2018
aP/CP%1958-2008
Jean Laherrere Feb 2019

16
US producers have almost stopped making exploration, concentrated on the development of so-called shale plays.
The number of exploratory wells after a peak in 1981 at 17573 wells was only in 2017 at 847, 20 times less! The number of NFW (new field wildcats) dropped from 9151 to 450, again by 20 times. It means that the US are almost explored for oil and gas since 1859! Only few unexplored areas left offshore But the number of oil producing wells displays, after a second peak in 1985 at 646 626 (mainly due to marginal oil wells), a third peak in 2014 at 597 281, dropping in 2017 at 560 996.
US non marginal producing wells have stayed almost flat since 1992, in particular for gas wells: the shale play cannot be seen!
0
2 000
4 000
6 000
8 000
10 000
12 000
14 000
16 000
18 000
1930 1940 1950 1960 1970 1980 1990 2000 2010 2020
annu
al n
umbe
r of
wel
ls
year
US annual number of exploration wells
explodry exploNFWoil explogas explo
Jean Laherrere April 2019
0
100 000
200 000
300 000
400 000
500 000
600 000
700 000
1910 1920 1930 1940 1950 1960 1970 1980 1990 2000 2010 2020
num
ber
of p
rodu
cing
wel
ls
year
US number of producing wellsoilwellsmarginal oilwells DGMNmarginal oilwells <15 b/d IPAAgaswellsmarginal gaswells <90 kcf/d
Jean Laherrere Jan 2016
source EIA, IPAA, DGMN

17
EIA/AEO2011 crude oil forecast retrospective is chaotic: EIA was unable to properly forecast US oil production oil in the past and it is likely that it will be the same for the future!
-NGPL production 1919-2100 The natural gas plant liquids production has increased since 1933 at 8.5 %/a until 1955, then at 5.5 %/a until 1970, then almost flat and from 2008 increasing at 9 %/a with the shale play, but this high rise is too high to stay long and the decline will be steep, as the rise.
0
20 000
40 000
60 000
80 000
100 000
120 000
140 000
160 000
180 000
200 000
1990 2000 2010 2020
annu
al n
umbe
r of
pro
duci
ng w
ells
year
US number of non marginal producing wells
non marg oil
non marg gas
Jean Laherrere Ap 2019
1700
1800
1900
2000
2100
2200
2300
2400
2500
1993 1995 1997 1999 2001 2003 2005 2007 2009 2011
annu
al p
rodu
ctio
n M
b
year
AEO 2011 retrospective of US oil production forecastAEO 1994
AEO 1995
AEO 1996
AEO 1997
AEO 1998
AEO 1999
AEO 2000
AEO 2001
AEO 2002
AEO 2003
AEO 2004
AEO 2005
AEO 2006
AEO 2007
AEO 2008
AEO 2009
AEO 2010
AEO 2011
ActualJean Laherrere Ap 2012

18
NGPL ultimate is estimated at 400 quads, leading to a peak around 2022 and a production in 2050 of 3.1 quads when EIA/AEO2019 forecasts 7.65 quads, more the double!
AEO2010 NGPL forecast was flat, missing completely the shale plays The HL of NGPF production trends towards 400 quads, assuming a parallel decline with the HL decline 1983-2008 and symmetrical to the increase 2009-2018
0,0
0,7
1,3
2,0
2,7
3,3
4,0
4,7
5,3
6,0
0
0,5
1
1,5
2
2,5
3
3,5
4
4,5
1910 1920 1930 1940 1950 1960 1970 1980 1990 2000 2010 2020
quad
Mb/
d
year
US NGPL production in Mb/d & quad
US NGPL Mb/dincrease 8.5 %/aincrease 5.5 %/aincrease 9 %/aNGPL quad
Jean Laherrere Feb 2019
0
50
100
150
200
250
300
350
400
0
1
2
3
4
5
6
7
8
9
1920 1940 1960 1980 2000 2020 2040 2060 2080 2100
CP
quad
aP q
uad
year
US NGPL production & forecast AEO & U = 400 quad
AEO2010AEO2019aP quadU = 400 quadCP quadU = 400 quad
Jean Laherrere Feb 2019

19
-crude oil & NGPL (petroleum) forecast There is very often confusion when dealing with oil production if it is crude or crude +condensate (lease condensate was in the past measured with crude) or crude +NGL. It is why it is important to plot crude +NGPL, in particular to compare with petroleum consumption.
US crude oil +NGPL production is combined with crude import to feed domestic refineries which supply domestic petroleum consumption, but also petroleum exports. US petroleum consumption (brown) peaked in 1978 and 2008 (40 quads) and is presently at 37, forecasted by AEO2019 to stay at this level until 2050; AEO2010 forecasted higher values, my forecast assuming constant consumption per capita grows with population. US petroleum consumption per capita peaked in 1978 at 168 MBtu, in 2018 at 113 MBtu;
0
1
2
3
4
5
6
0 100 200 300 400
aP/C
P%
cumulative NGPL production quad
US HL of NGPL production in quad 1918-2018
aP/CP%1983-2008
Jean Laherrere Feb 2019
0
10
20
30
40
1900 1920 1940 1960 1980 2000 2020 2040 2060 2080 2100
aP q
uad
year
US crude oil + NGPL production in quad & forecasts AEO AEO2019 prodAEO2010 prodU=2400 quadprod crude+NGLAEO2019 prodAEO2010 prodU = 2000 quadcrude oilAEO2019 prodAEO2010 prodU = 400 quadNGPL
Jean Laherrere Ap 2019

20
It stays flat from 1981 to 2007, dropped with the 2008 peak price and it is flat for 2009 to 2018 and I guess that it will stay flat until 2050
US petroleum consumption (brown) is since 1955 much higher than US petroleum production (green). The net import (blue) has peaked in 1979 and 2006. AEO2019 forecasts a negative net import from 2025 to 2043, period where I forecast from 10 to 25 net import.
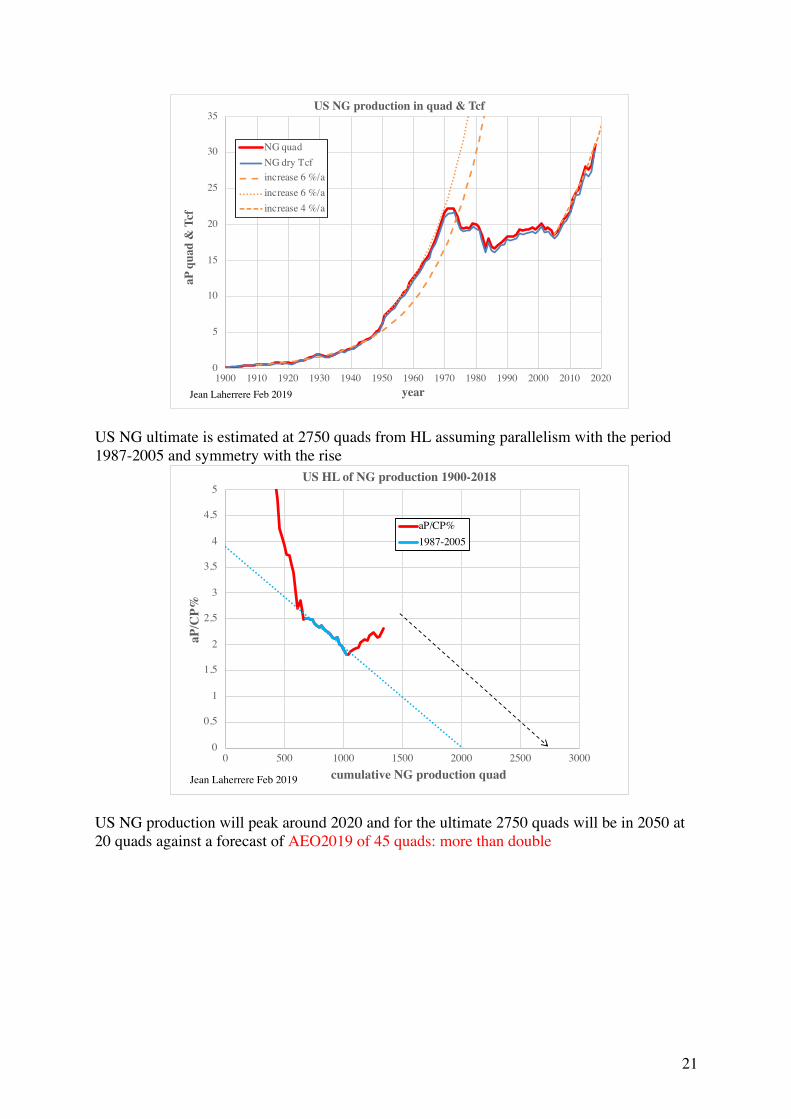
-Natural gas production 1900-2100 US NG annual production in quad is close to the value in Tcf (gas heat content did not change with shale play). Production has increased by 6 %/a since 1910 up to 1970 and again by 4 %/a since 2005: it is similar to NGPL production, been produced in the same time!
0102030405060708090100110120130140150160170
0
5
10
15
20
25
30
35
40
45
1950 1960 1970 1980 1990 2000 2010 2020 2030 2040 2050
cons
per
cap
ita M
Btu
cons
umpt
ion
quad
year
US petroleum consumption & per capita
AEO2019 cons petAEO2010 cons petpetroleum consumptionUN2017 113 MBtu/capAEO2019 cons/capAEO2010 cons/capcons pet/cap MBtucons 113 MBtu/cap
Jean Laherrere March 2019
-5
0
5
10
15
20
25
30
35
40
45
50
1900 1920 1940 1960 1980 2000 2020 2040 2060 2080 2100
quad
year
US crude oil + NGPL production, petroleum consumption & net import
UN2017 113 MBtu/capAEO2019 cons petAEO2010 cons petpetroleum consumptionU=2400 quadAEO2019 prodAEO2010 prodprod crude+NGLAEO2019 cons-prodAEO2010 cons-prodcons-prod = net importcons-prod
Jean Laherrere March 2019
21
US NG ultimate is estimated at 2750 quads from HL assuming parallelism with the period 1987-2005 and symmetry with the rise
US NG production will peak around 2020 and for the ultimate 2750 quads will be in 2050 at 20 quads against a forecast of AEO2019 of 45 quads: more than double
0
5
10
15
20
25
30
35
1900 1910 1920 1930 1940 1950 1960 1970 1980 1990 2000 2010 2020
aP q
uad
& T
cf
year
US NG production in quad & Tcf
NG quadNG dry Tcfincrease 6 %/aincrease 6 %/aincrease 4 %/a
Jean Laherrere Feb 2019
0
0,5
1
1,5
2
2,5
3
3,5
4
4,5
5
0 500 1000 1500 2000 2500 3000
aP/C
P%
cumulative NG production quad
US HL of NG production 1900-2018
aP/CP%1987-2005
Jean Laherrere Feb 2019
22
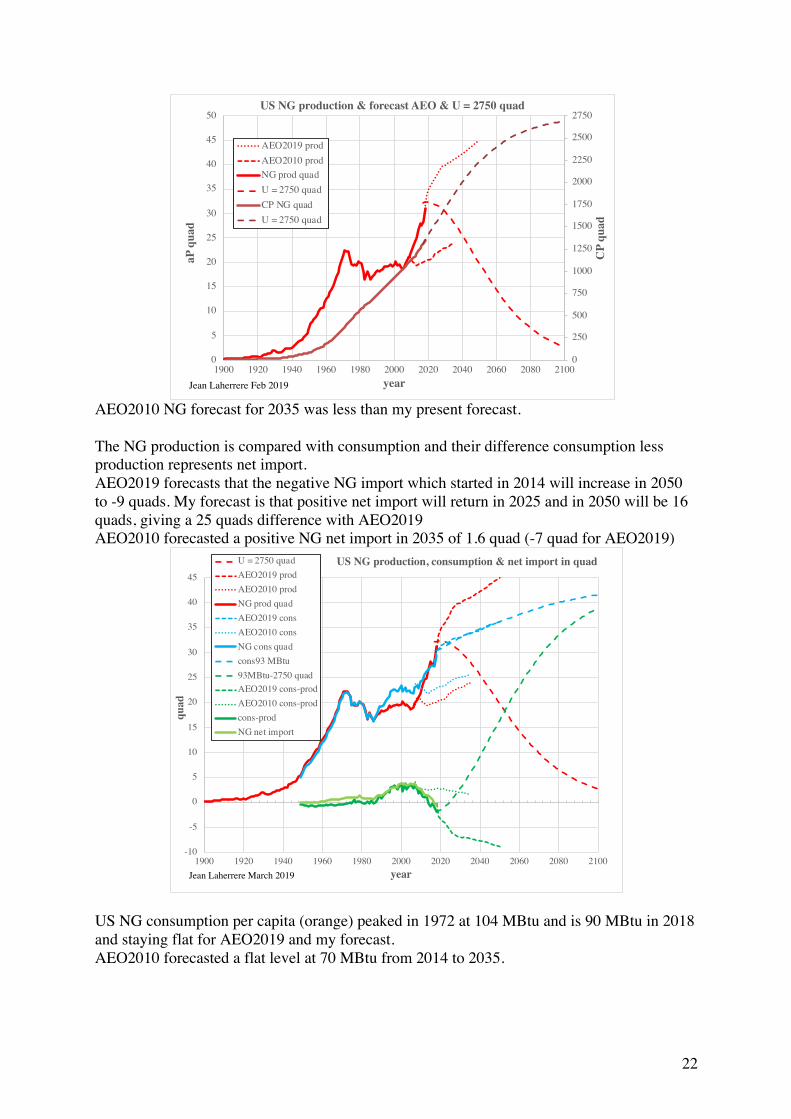
AEO2010 NG forecast for 2035 was less than my present forecast. The NG production is compared with consumption and their difference consumption less production represents net import. AEO2019 forecasts that the negative NG import which started in 2014 will increase in 2050 to -9 quads. My forecast is that positive net import will return in 2025 and in 2050 will be 16 quads, giving a 25 quads difference with AEO2019 AEO2010 forecasted a positive NG net import in 2035 of 1.6 quad (-7 quad for AEO2019)
US NG consumption per capita (orange) peaked in 1972 at 104 MBtu and is 90 MBtu in 2018 and staying flat for AEO2019 and my forecast. AEO2010 forecasted a flat level at 70 MBtu from 2014 to 2035.
0
250
500
750
1000
1250
1500
1750
2000
2250
2500
2750
0
5
10
15
20
25
30
35
40
45
50
1900 1920 1940 1960 1980 2000 2020 2040 2060 2080 2100
CP
quad
aP q
uad
year
US NG production & forecast AEO & U = 2750 quad
AEO2019 prodAEO2010 prodNG prod quadU = 2750 quadCP NG quadU = 2750 quad
Jean Laherrere Feb 2019
-10
-5
0
5
10
15
20
25
30
35
40
45
1900 1920 1940 1960 1980 2000 2020 2040 2060 2080 2100
quad
year
US NG production, consumption & net import in quad U = 2750 quadAEO2019 prodAEO2010 prodNG prod quadAEO2019 consAEO2010 consNG cons quadcons93 MBtu93MBtu-2750 quadAEO2019 cons-prodAEO2010 cons-prodcons-prodNG net import
Jean Laherrere March 2019

23
US petroleum and NG consumption per capita are compared
-NG and NGPL NGPL is produced with NG and have to be compared NG and NGPL production forecasts are plotted on the same graph and it appears that AEO forecasts are flat for NGPL and rising for NG
0
10
20
30
40
50
60
70
80
90
100
110
0
5
10
15
20
25
30
35
40
45
1950 1975 2000 2025 2050
cons
/api
ta M
Btu
quad
year
US NG consumption & per capita
AEO2019 consAEO2010 consincrease 6%/aincrease 1.5%/aNG cons quadAEO2019 cons/capAEO2010 cons/capcons NG/cap
Jean Laherrere April 2019
0,8
1,0
1,2
1,4
1,6
1,8
2,0
2,2
2,4
0
10
20
30
40
50
60
70
80
90
100
110
120
130
140
150
160
170
1950 1960 1970 1980 1990 2000 2010 2020 2030 2040 2050
ratio
pet
role
um/N
G
cons
umpt
ion
per
capi
ta M
Btu
year
US petroleum & NG consumption per capita
AEO2019 cons/capAEO2010 cons/capcons 113 MBtu/capcons pet/cap MBtuAEO2019 cons/capAEO2010 cons/capcons NG/cappetroleum/NGAEO2019
Jean Laherrere April 2019

24
The past NG and NGPL productions correlate well from 1900 to 2008 (comparison 1) with 8 quad NG = 1 quad NGPL. But from 1980 the correlation (comparison 2) differs with 3,6 quad NG = 1 quad NGPL
The shale plays produce more NGPL that the conventional gas plays Adding NG and NGL production shows that the annual growth was 7.5 %/a from 1933 to 1970, flat from 1978 to 2009, 6 %/a from 2010 to likely 2020 and a decline of 3 %/a from 2040
0
5
10
15
20
25
30
35
40
45
50
1900 1920 1940 1960 1980 2000 2020 2040 2060 2080 2100
annu
al p
rodu
tion
quad
year
US NG & NGPL production
AEO2019 prodAEO2010 prodU = 2750 quadNG prod quadAEO2019AEO2010U = 400 quadNGPL prod quad
Jean Laherrere March 2019
0
1
2
3
4
5
6
7
8
9
0
9
18
27
36
45
54
63
72
1900 1920 1940 1960 1980 2000 2020 2040 2060 2080 2100
NG
PLqu
ad
NG
qua
d
year
US NG & NGPL production comparison 1
AEO2019 prodAEO2010 prodU = 2750 quadNG prod quadAEO2019AEO2010U = 400 quadNGPL prod quad
Jean Laherrere April 2019
-3
-1
1
3
5
7
9
11
13
15
17
0
9
18
27
36
45
54
63
72
1900 1920 1940 1960 1980 2000 2020 2040 2060 2080 2100N
GPL
quad
NG
qua
d
year
US NG & NGPL production comparison 2
AEO2019 prodAEO2010 prodU = 2750 quadNG prod quadAEO2019AEO2010U = 400 quadNGPL prod quad
Jean Laherrere April 2019

25
US NG consumption in quad (blue) has increased by 6 %/a from 1950 to 1970, again by 1.5 %/a from 1983 to 2018. In fact, the increase is higher since 2006(after a plateau from 1997 to 2007) because the price of gas is very cheap comparted to oil, because of excess of associate gas and flaring, in particular in North Dakota -crude oil +NGPL +NG Adding the last three forecasts, crude oil + NGPL + NG productions will be in 2050 at 32 quads against 77 quads for AEO2019: more than double. It means that, if I am right; the US energy future is bleak, back to the pre-2005. But since 1985 US NG production is much higher in energy than crude oil production.
-oil and gas prices
0
5
10
15
20
25
30
35
40
45
50
55
1900 1920 1940 1960 1980 2000 2020 2040 2060 2080 2100
annu
al p
rodu
tion
quad
year
US NG + NGPL production
AEO2019 prodAEO2010 prodU=3150 quadNG+NGPL prod7.5%/a increase6%/a increase3%/a decline
Jean Laherrere April 2019
0
10
20
30
40
50
60
70
80
1900 1920 1940 1960 1980 2000 2020 2040 2060 2080 2100
aP q
uad
year
US crude oil + NG + NGPL production in quad & forecasts
AEO2010AEO2019U = 5150 quadallU = 2750 quadNG dryU = 2000 quadcrude oilU = 400 quadNGPL
Jean Laherrere Ap 2019

26
The oil/gas price ratio was around 6 in 1950, 1 in 2003, 6 again in 2011, down to 3 in 2018. It correlates well with the NG flaring, because when there is too much associate produced, it is flared, and NG price goes down. AEO2019 forecasts from 2020 to 2050 an oil/gas ratio of 4, meaning too much gas because LTO, which for me is wrong. AEO2010 forecasted an oil/gas ratio of about 2.5, without LTO but already too high. It is a shame to flare gas and to forecast the natural gas will be 4 times cheaper in 2050 than oil, when they were even in 2005?
EIA graph of cost of fuels to end users shows the same story: NG price is equal to residential heating oil only for the period 1987-2002
The NG prices in different countries compared to the oil price from BP 2018 shows very well that oil price and gas price correlates well except for US and Canada after 2009, which is, the start of the shale plays. In Canada NG price is lower than in <US, as flaring is higher.
0
5
10
15
20
25
30
35
40
0
1
2
3
4
5
6
7
1950 1960 1970 1980 1990 2000 2010 2020 2030 2040 2050
Alta
& N
D fl
arin
g %
oil/g
as p
rice
rat
io &
US,
Tex
as fl
arin
g %
year
US crude oil/natural gas price ratio & gas flaring
oil/gas ratioUS flared/gross %Texas flaring/gross %oil/gas AEO2019oil/gas AEO2010ND flaring %Alberta flaring %
Jean Laherrere April 2019

27
The US fossil fuels price in $/MBtu has changed drastically with time. Prices are irrational and very hard to forecast, except for gas price related to flaring.
US WTI oil price is related to the value of dollar multiplied by -1. The attempts by Saudi Arabia and Russia to reduce crude oil production to please Trump are hardly seen.
0
2
4
6
8
10
12
14
16
18
20
1984 1986 1988 1990 1992 1994 1996 1998 2000 2002 2004 2006 2008 2010 2012 2014 2016 2018 2020
$/M
Btu
year
oil & natural gas price from BP 2018
crude oil CIFGermanyUKNetherlandsUSCanada
Jean Laherrere April 2019
0
2
4
6
8
10
12
14
16
18
20
1950 1960 1970 1980 1990 2000 2010 2020
$/M
Btu
year
US crude oil + NG + NGPL price in $/MBtu
NG Henry Hub $/MBtu
NGPL $/MBtu
WTI $/MBtu
Jean Laherrere Feb 2019

28
Also the US weekly private stocks of crude oil followed the WTI*-1 13 weeks before.
The value of the dollar is the key for WTI oil price and US crude oil stocks. This correlation is hardly mentioned in the medias. The US oil and gas production converted with such prices and using CPI inflation into $2018 and the NG production is worth much less than crude oil, despite being higher in energy. NGPL production values is presently about half NG production value.
-120
-115
-110
-105
-100
-95
-90
-85
-80
-75
0
10
20
30
40
50
60
70
80
90
100
110
120
130
2006 2008 2010 2012 2014 2016 2018 2020
broa
d do
llar
inex
*-1
oil p
rice
$/b
year
US monthly oil price & negative dollar value
WTI spot $/b
negative broad dollar index
Jean Laherrere April 2019
https://www.federalreserve.gov/releases/h10/summary/jrxwtfbc_nm.htm
-115
-105
-95
-85
-75
-65
-55
-45
-35
-25
-15
300
320
340
360
380
400
420
440
460
480
500
520
540
2012 2013 2014 2015 2016 2017 2018 2019 2020
WTI
*-1
13
wee
ks b
efor
e
US
priv
ate
stoc
ks c
rude
oil
Mb
year
US weekly private stocks crude oil & WTI *-1 shifted 13 weeks
Weekly U.S. Ending Stocks excluding SPRof Crude Oil "excluding lease stock"WTI *-1 13 weeks before
WTI $/*-1b
Jean Laherrere April 2019
oil cut Saudi Arabia-Russia
29
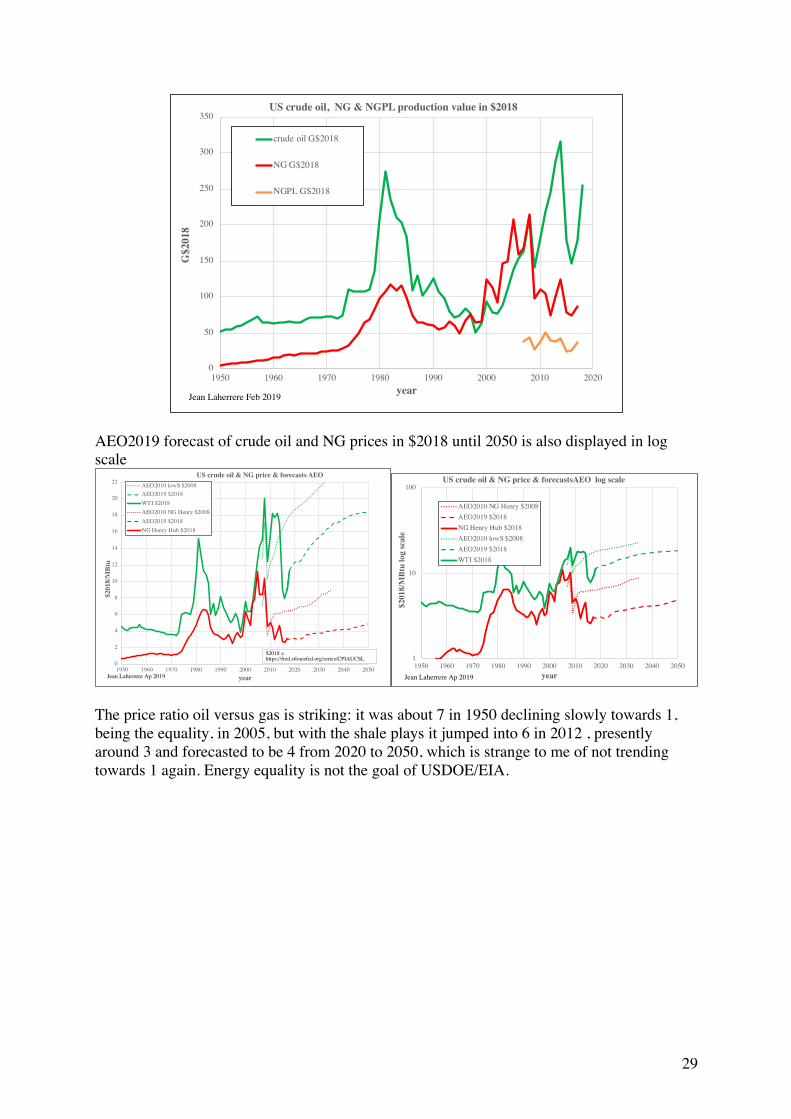
AEO2019 forecast of crude oil and NG prices in $2018 until 2050 is also displayed in log scale
The price ratio oil versus gas is striking: it was about 7 in 1950 declining slowly towards 1, being the equality, in 2005, but with the shale plays it jumped into 6 in 2012 , presently around 3 and forecasted to be 4 from 2020 to 2050, which is strange to me of not trending towards 1 again. Energy equality is not the goal of USDOE/EIA.
0
50
100
150
200
250
300
350
1950 1960 1970 1980 1990 2000 2010 2020
G$2
018
year
US crude oil, NG & NGPL production value in $2018
crude oil G$2018
NG G$2018
NGPL G$2018
Jean Laherrere Feb 2019
0
2
4
6
8
10
12
14
16
18
20
22
1950 1960 1970 1980 1990 2000 2010 2020 2030 2040 2050
$201
8/M
Btu
year
US crude oil & NG price & forecasts AEO AEO2010 lowS $2008AEO2019 $2018WTI $2018AEO2010 NG Henry $2008AEO2019 $2018NG Henry Hub $2018
Jean Laherrere Ap 2019
$2018 = https://fred.stlouisfed.org/series/CPIAUCSL 1
10
100
1950 1960 1970 1980 1990 2000 2010 2020 2030 2040 2050
$201
8/M
Btu
log
scal
e
year
US crude oil & NG price & forecastsAEO log scale
AEO2010 NG Henry $2008AEO2019 $2018NG Henry Hub $2018AEO2010 lowS $2008AEO2019 $2018WTI $2018
Jean Laherrere Ap 2019

30
In fact, gas is wasted and undervalued and flared (or vented) because often associated with oil. The US crude oil/NG price ratio correlates roughly with the US NG flaring (as Texas flaring) and since 2005 with the North Dakota flaring. It seems hard to believe that the oil/NG price ratio will stay high for the next 30 years, as forecasted by AEO2019 about 4, meaning that NG will be continued to be wasted, flared and underestimated Gas flaring is high because the lack of gas pipelines in new shale plays, as North Dakota, where Bakken oil is mainly moved by rail (explosive oil with several rail accidents). The problem is that building a pipeline needs a long term project and is shale gas a long term project? However, lack of pipelines is not obvious when looking at the US pipeline maps
There are more gas pipelines than oil pipelines Natural gas is delivered directly to the consumer at home contrary to oil going to services stations. The interstate pipeline mileage is greater for gas than for oil (OGJ 2006-2015), but steady when increasing for oil. Why is gas pipeline not increasing as oil pipeline?
0
1
2
3
4
5
6
7
8
1940 1950 1960 1970 1980 1990 2000 2010 2020 2030 2040 2050
ratio
pri
ce c
rude
oil
/ NG
year
US crude oil /NG price ratio & forecasts AEO
AEO2010AEO2019oil/NG
Jean Laherrere Ap 2019
31
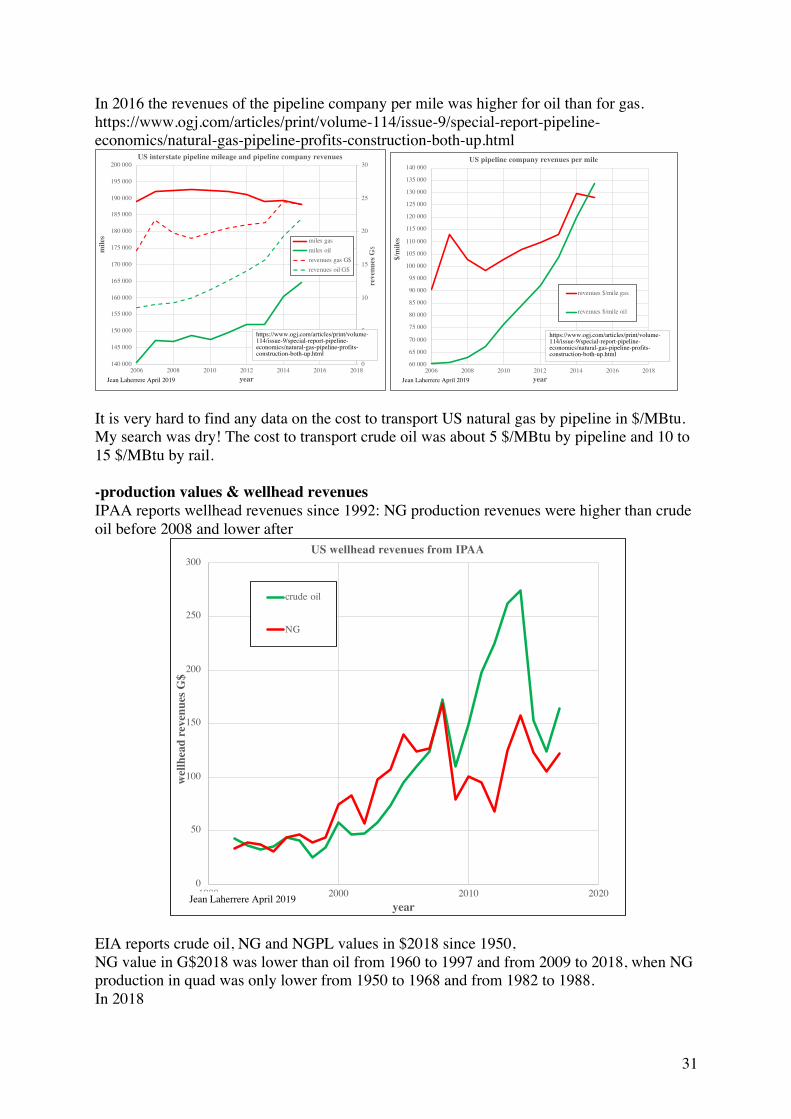
In 2016 the revenues of the pipeline company per mile was higher for oil than for gas. https://www.ogj.com/articles/print/volume-114/issue-9/special-report-pipeline-economics/natural-gas-pipeline-profits-construction-both-up.html
It is very hard to find any data on the cost to transport US natural gas by pipeline in $/MBtu. My search was dry! The cost to transport crude oil was about 5 $/MBtu by pipeline and 10 to 15 $/MBtu by rail. -production values & wellhead revenues IPAA reports wellhead revenues since 1992: NG production revenues were higher than crude oil before 2008 and lower after
EIA reports crude oil, NG and NGPL values in $2018 since 1950, NG value in G$2018 was lower than oil from 1960 to 1997 and from 2009 to 2018, when NG production in quad was only lower from 1950 to 1968 and from 1982 to 1988. In 2018
0
5
10
15
20
25
30
140 000
145 000
150 000
155 000
160 000
165 000
170 000
175 000
180 000
185 000
190 000
195 000
200 000
2006 2008 2010 2012 2014 2016 2018re
venu
es G
$mile
s
year
US interstate pipeline mileage and pipeline company revenues
miles gasmiles oilrevenues gas G$revenues oil G$
Jean Laherrere April 2019
https://www.ogj.com/articles/print/volume-114/issue-9/special-report-pipeline-economics/natural-gas-pipeline-profits-construction-both-up.html
60 000
65 000
70 000
75 000
80 000
85 000
90 000
95 000
100 000
105 000
110 000
115 000
120 000
125 000
130 000
135 000
140 000
2006 2008 2010 2012 2014 2016 2018
$/m
iles
year
US pipeline company revenues per mile
revenues $/mile gas
revenues $/mile oil
Jean Laherrere April 2019
https://www.ogj.com/articles/print/volume-114/issue-9/special-report-pipeline-economics/natural-gas-pipeline-profits-construction-both-up.html
0
50
100
150
200
250
300
1990 2000 2010 2020
wel
lhea
d re
venu
es G
$
year
US wellhead revenues from IPAA
crude oil
NG
Jean Laherrere April 2019

32
The oil/gas ratio for values S2018 and for production in quad differs a lot, except for the period 1998-2005. For 2017 the oil/gas ratio is 2.1 for $2018 and 0.7 for quad
-Net Import 2018 US petroleum import was 21.5 quads (17.2 crude + 4.3 petroleum products) against export of 14.4 quads (4.2 crude + 10.2 quads petroleum products), giving a net import of 10 quads.
0
5
10
15
20
25
30
35
0
50
100
150
200
250
300
350
1950 1960 1970 1980 1990 2000 2010 2020
prod
uctio
n qu
ad
prod
uctio
n va
lue
G$2
018
year
US crude oil, NG & NGPL production value in $2018 & quad production
crude oil G$2018NG G$2018NGPL G$2018crude oil prodNG dry prod
Jean Laherrere April 2019
0
1
2
3
4
5
6
7
8
9
10
11
12
1950 1960 1970 1980 1990 2000 2010 2020
ratio
cru
de o
il / N
G
year
US crude oil /NG ratio for $2018 values and for quad production
values ratio $2018prod ratio quad
Jean Laherrere Ap 2019

33
US NG net import was negative in 2017 and 2018.
AEO2019 forecasts that in 2021 US oil net import will be negative until 2046, with a peak of oil export in 2033 of 5 quads. AEO2010 forecasted a flat oil net import of 21 quads 2007-2035. My guess is that net oil import will resume growing from 2020 with a slope similar to 1982-2008. AEO2019 forecasts a negative NG net import growing up to 2050 at - 8 quads AEO2010 forecasted a flat NG net import around 2 quads until 2035. My guess is that NG net import will return to positive in 2035.
-15
-10
-5
0
5
10
15
20
25
30
35
1950 1960 1970 1980 1990 2000 2010 2020
net i
mpo
rt q
uad
year
US net import of oil & gas
Petroleum net mportpetroleum importpetroleum exportNG net import NGNG importNG exportcrude oil importcrude oil exportpetrol prod importpetrol prod export
Jean Laherrere April 2019

34
In 2050 AEO 2019 consumption - production = net import is forecasted at – 9 quad (meaning that US will export NG) when my forecast for U = 2750 quad and consumption per capita at 93 MBtu is + 16 quad (meaning that US will import NG) the difference is 25 quad: it is huge! EIA/MER displays US PE net imports with a peak in 1977 and 2006
-10
-5
0
5
10
15
20
25
30
35
1950 1960 1970 1980 1990 2000 2010 2020 2030 2040 2050
net i
mpo
rt q
uad
year
US net import of oil & gas in quad & AEO2010 & AEO2019
AEO2019 oil net importAEO2010 oil net importcons-prod oil 2400 quadoilnet import quadAEO2010 NG net importAEO2019 NG net importcons-prod NG 2750 quadNG net import quad
Jean Laherrere March 2019
oilproduction = crude +NGLconsumption = crude + petroleum

35
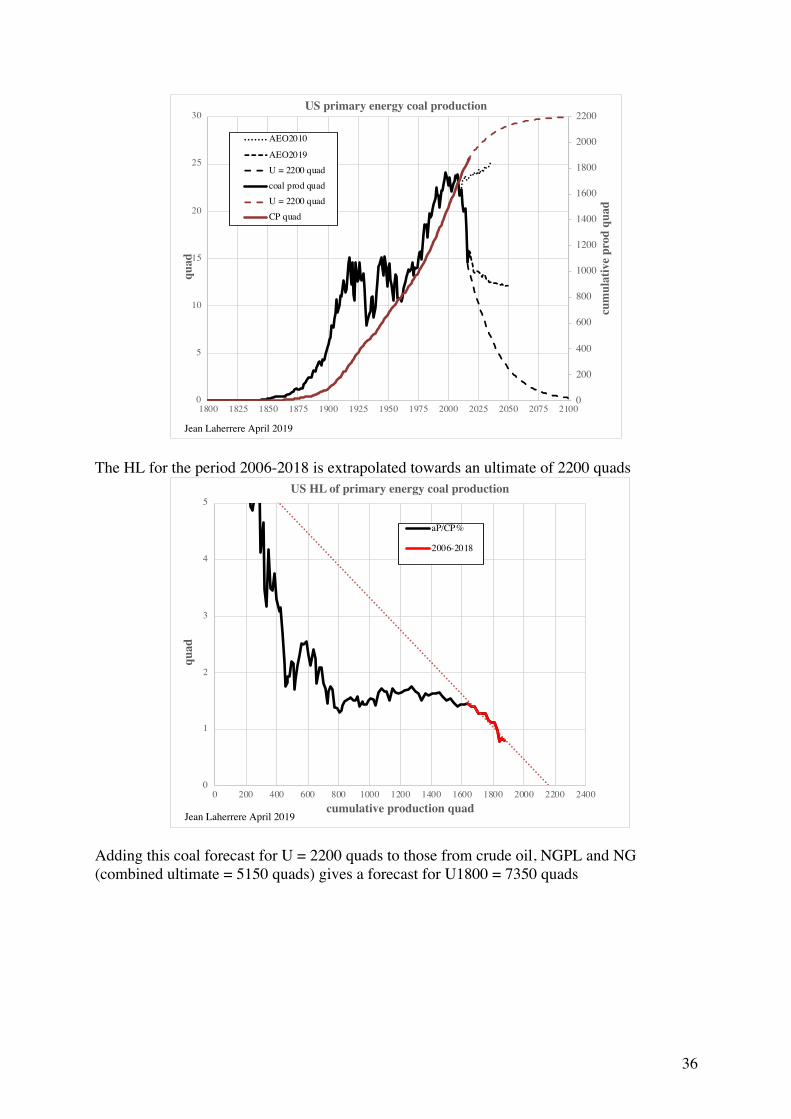
-coal production Rutledge production data before 1950 were converted in quad using an average factor. An ultimate of 2200 quads (from 1800) is used from the HL US coal production peaked in 1998 & 2008 at 24 quads and the decline is sharp. AEO2010 forecasted for 2035 a production of 25 quads when AEO 2019 forecasts about half and my guess is half of AEO2019. The question is what environment rules will be because the resources are still large.
36
The HL for the period 2006-2018 is extrapolated towards an ultimate of 2200 quads
Adding this coal forecast for U = 2200 quads to those from crude oil, NGPL and NG (combined ultimate = 5150 quads) gives a forecast for U1800 = 7350 quads
0
200
400
600
800
1000
1200
1400
1600
1800
2000
2200
0
5
10
15
20
25
30
1800 1825 1850 1875 1900 1925 1950 1975 2000 2025 2050 2075 2100
cum
ulat
ive
prod
qua
d
quad
US primary energy coal production
AEO2010
AEO2019U = 2200 quadcoal prod quadU = 2200 quadCP quad
Jean Laherrere April 2019
0
1
2
3
4
5
0 200 400 600 800 1000 1200 1400 1600 1800 2000 2200 2400
quad
cumulative production quad
US HL of primary energy coal production
aP/CP%
2006-2018
Jean Laherrere April 2019
37
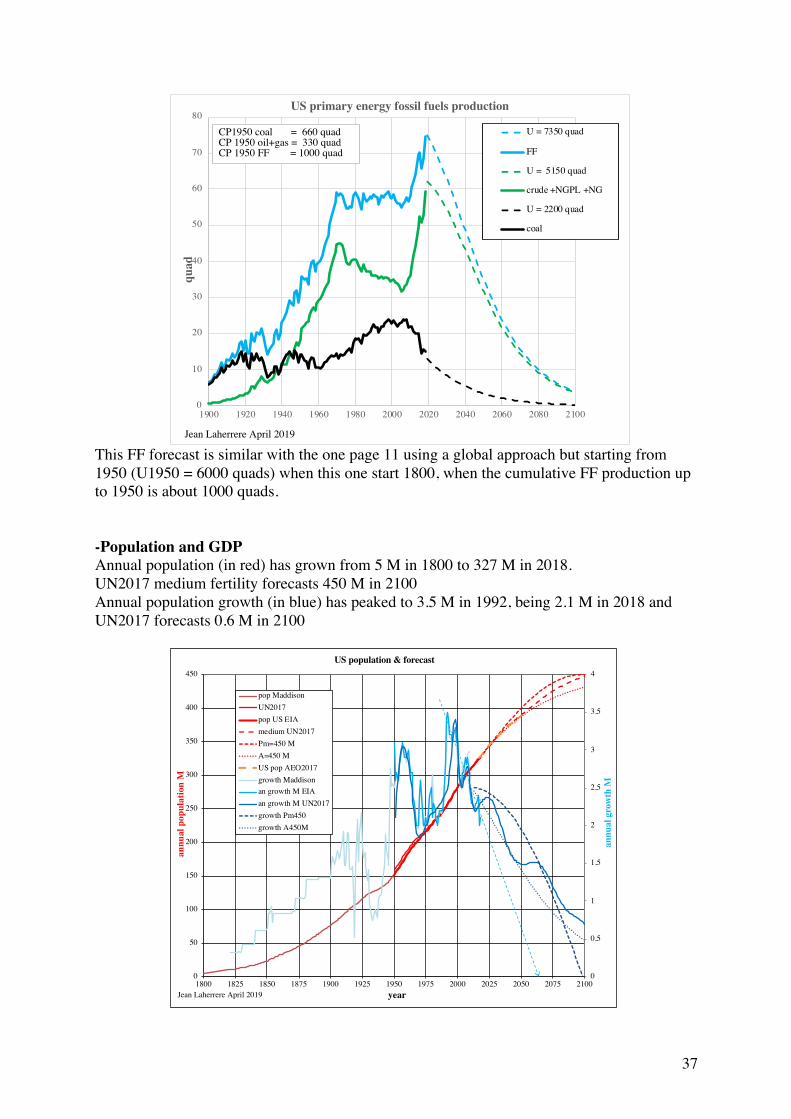
This FF forecast is similar with the one page 11 using a global approach but starting from 1950 (U1950 = 6000 quads) when this one start 1800, when the cumulative FF production up to 1950 is about 1000 quads. -Population and GDP Annual population (in red) has grown from 5 M in 1800 to 327 M in 2018. UN2017 medium fertility forecasts 450 M in 2100 Annual population growth (in blue) has peaked to 3.5 M in 1992, being 2.1 M in 2018 and UN2017 forecasts 0.6 M in 2100
0
10
20
30
40
50
60
70
80
1900 1920 1940 1960 1980 2000 2020 2040 2060 2080 2100
quad
US primary energy fossil fuels production
U = 7350 quad
FF
U = 5150 quad
crude +NGPL +NG
U = 2200 quad
coal
Jean Laherrere April 2019
CP1950 coal = 660 quadCP 1950 oil+gas = 330 quadCP 1950 FF = 1000 quad
0
0,5
1
1,5
2
2,5
3
3,5
4
0
50
100
150
200
250
300
350
400
450
1800 1825 1850 1875 1900 1925 1950 1975 2000 2025 2050 2075 2100
annu
al g
row
th M
annu
al p
opul
atio
n M
year
US population & forecast
pop MaddisonUN2017pop US EIAmedium UN2017Pm=450 MA=450 MUS pop AEO2017growth Maddisonan growth M EIAan growth M UN2017growth Pm450growth A450M
Jean Laherrere April 2019

38
US annual population growth versus population trends for the period 1992-2018 towards 450 M, being either the peak of population or the asymptote.
US GDP in G$ (green) and G$2012 (blue) from EIA and WB. G$2012 is 17 300 in 2018 and is forecasted to be 33 000 in 2050 by AEO2019 or by the S curve towards an asymptote of 50 000
Annual GDP growth G$2012 (red) has peaked in 1999 at 550 G$2012 and the period 1999-2017 trends towards an ultimate of 50 000.
0
1
2
3
4
0 50 100 150 200 250 300 350 400 450
annu
al p
opul
atio
n gr
owth
M
population M
US population annual growth versus population
an growth M EIA
an growth M UN2017
1992-2018
Jean Laherrere Ap 2019
0
100
200
300
400
500
600
0
5 000
10 000
15 000
20 000
25 000
30 000
35 000
40 000
45 000
50 000
1950 1960 1970 1980 1990 2000 2010 2020 2030 2040 2050 2060 2070 2080 2090 2100
annu
al g
row
th
GD
P G
$ &
G$2
012
year
US GDP from EIA & WB
US GDP G$ EIA
US GDP G$2012 EIA
US GDP G$ WB
US GDP G$2010 WB
A 50 000 G$2012
GDP AEO2017 G$2012
US GDP growth G$2012 EIA
Jean Laherrere April 2019

39
In 1880 GDP per capita was 4 k$2012 and PE per capita around 100 MBtu, in 2018 GDP/cap is 55 k$2012 and PE/cap 290 MBtu (peak at 310 in 1970) In 2050 GDP/cap will be 85 k$2012 and PE/cap 285 MBtu for AEO2018 and only 150 for my forecast! But looking at the graph I guess that PE/cap beyond 2020 will be parallel to the decline 1970-2005 as indicated by the dotted arrow, being the middle between my forecast and AEO2019!
The plot GDP/cap versus PE/cap displays different linear trends: first 1850-1970, second opposite 1970-2008 and third 2008-2020 parallel to the first trend and the fourth similar to the second trend. Again, the trend beyond 2020 could be the dotted arrow, forgetting the shale burst of 2008 and back to the post 1970 peak trend !
0
100
200
300
400
500
600
700
800
0 5 000 10 000 15 000 20 000 25 000 30 000 35 000 40 000 45 000 50 000
annu
al g
row
th G
$201
2 &
G$
GDP $2012 & G$
US GDP anual growth versus GDP
US GDP growth G$2012 EIA
1999-2017
US GDP growth G$ EIA
Jean Laherrere April 2019
0
50
100
150
200
250
300
350
0
10
20
30
40
50
60
70
80
90
100
110
120
1850 1875 1900 1925 1950 1975 2000 2025 2050 2075 2100
PE/c
ap M
Btu
GD
P pe
r ca
pita
k$2
012
year
US PE & GDP $2012 per capita
GDP/cap k$2012my forecast GDP per capitaAEO2017PE/cap MBtuU=10 000 quadAEO2017/cap
Jean Laherrere April 2019

40
US PIB is manipulated using a hedonic factor since the 1990s, where the hedonic components represent about 20 % of the GDP.
. In 2013, expenditures on research and development activities and for the creation of entertainment, literary, and artistic originals are now treated as capital expenditures. an accrual basis. The revisions increase the level of GDP by 3.4 % Conclusion The percentage of fossil fuels in the US primary energy production in quad is flat about 80 % for the last 20 years, with renewables and nuclear around 10 % each. The same percentage of
0
10
20
30
40
50
60
70
80
90
0 50 100 150 200 250 300 350
GD
P pe
r ca
pita
k$2
012
PE/cap MBtu
US GDP $2012 per capita versus PE per capita 1870-2050
GDP/cap k$2012AEO2017 GDP/capmy forecast GDP per capita
Jean Laherrere April 2019
1970
1870
2008
2017 2025
20502050
0
5
10
15
20
25
0
5 000
10 000
15 000
20 000
1950 1960 1970 1980 1990 2000 2010 2020
% h
edon
icGD
P G
$
year
US GDP & hedonic components from BEA
US GDP G$ EIA
GDP BEA
hedonic components
% hedonic
Jean Laherrere April 2019
https://www.bea.gov/sites/default/files/papers/hedonic%20update%20Aug%202016.pdf

41
80 % for fossil fuels is found for the world primary energy with 5% nuclear and 15% renewables. AEO2019 forecasts such 80% for FF until 2050, my guess is less optimistic. EIA does not forecast any energetic transition! US shale plays production forecasts are going towards the sky in AEO2019 when shale plays were ignored in AEO2010. IEA/WEO2010 considered Bakken as conventional, as shale oil was ignored, only oil shale (immature kerogen) was forecasted! The funny thing is that the term “shale oil” is wrong, because production comes from tight reservoir and “shale oil” is now called LTO = “light tight oil” Shale plays are like Uber and Tesla, lot of potential and lot of losses! It is imperative to look at production data in energy and not in volume. But the variation of price upsets the picture. Most people believe that US oil production is larger than natural gas production: it is true in value, but wrong in energy. Today US oil production is 2.1 times the gas production in value but only 0.7 times in energy (quad) US primary energy is forecasted by AEO2019 to be in 2050 44 % higher than in 2018 and it is likely to be right globally, but wrong in the components. The difference between the EIA forecasts of 2019 and 2010 is huge. It is likely that EIA 2030 forecast will display also huge difference. US NG price is three times lower than oil price and forecasted by EIA to be four times in 2050: it seems unrealistic leading to wasting natural gas and flaring. It looks unreasonable! The US shale burst will be over soon and back to reality of post 1970 oil peak. US energy independence is a fake news.