Embed Size (px)
Citation preview

UPHMIS
STANDARD OPERATING PROCEDURES

Table of Contents 1. Getting started with DHIS2 ................................................................................................................ 3
1.1 Logging on to DHIS2 ............................................................................................................ 3
2. Data entry ............................................................................................................................................ 4
2.1 Data entry with DHIS2 ................................................................................................................... 4
2.1.1 Selecting the data entry form ................................................................................................ 5
2.1.2 Entering data ........................................................................................................................... 5
2.1.3 Input validation: ....................................................................................................................... 6
2.1.4 Disabled fields: ........................................................................................................................ 7
2.2 Editing and deleting data ............................................................................................................... 7
3. Excel Import………………………………………………………………………………………....7
4. Pivot table & Visualiser…………………………………………………………………………….9
5. GIS……………………………………………………………………………………………........16
6. MPR………………………………………………………………………………………………...19
7. Data Status………………………………………………………………………………………...23

1. Getting started with DHIS2
1.1 Logging on to DHIS2
Getting started with the application is actually quite simple. Below is the set of instructions with
screen by screen description of the steps that you need to follow to login in to the system to
perform your further tasks. The perquisite for logging in is internet connection on your desktop
and the Google Chrome browser.
Login 1.Enter URL in the browser: http://hospdev.hispindia.org/uphmis/ 2.Homescreen as shown to the right hand side will appear 3. Enter your username and password
Once the login is complete the page to the right hand side will appear which is called the Dashboard The Dashboard would later display the data of all the important data elements and Indicators as per the user requirements.

To logout of the instance, go to the Profile at the top right corner and click on ‘Log out’
2. Data entry
2.1 Data entry with DHIS2 To open the data entry window hover over the Apps button. A drop down menu will appear
listing the apps provided by DHIS 2. Click on the Data Entry option. The data entry module is
where aggregated data is manually registered in the DHIS 2 database. Data is registered for an
organisation unit, a period, and a set of data elements (data set) at a time. A data set often
corresponds to a paper based data collection tool.

2.1.1 Selecting the data entry form To start entering data the first step is to open the correct form by following these steps:
1. Locate the orgunit you want to register data for in the tree menu to the left. Expand and close
branches by clicking on the +/- symbols. A quick way to find an orgunit is to use the search box
just above the tree (the green symbol), but you need to write in the full name to get a match.
2. Select a data set from the dropdown list of data sets available to your selected orgunit.
3. Select a period to register data for. The available periods are controlled by the period type of
the data set (reporting frequency). You can jump a year back or forward by using the arrows
above the period.
By now you should see the data entry form. From a form design perspective, there are three
types for forms: default forms, section forms and custom forms. If a custom form exists, it will be
displayed, followed in order of precedence by a section form, and finally a default form. Data
entry Entering data
2.1.2 Entering data Start entering data by clicking inside the first field and type in the value. Move to the next field
using the Tab button. Shift+Tab will take you back one step. You can also use the "up" and
"down" arrow keys, as well as the Enter key, to navigate between the form cells. The values are

saved immediately and do not require to be saved at a later stage. A green field indicates that
the value has been saved in the system (on the server).
2.1.3 Input validation: If you type in an invalid value, e.g. a character in a field that only accepts numeric values you
will get a pop-up that explains the problem and the field will be coloured yellow (not saved) until
you have corrected the value. If you have defined a min/max range for the field (data element+
organisation unit combination) a pop-up message will notify you when the value is out of range,
and the value will remain unsaved until you have changed the value (or updated the range and
then re-entered the value).

2.1.4 Disabled fields: If a field is disabled (grey) it means that the field can and should not be filled. The cursor will
automatically jump to the next open field.
2.2 Editing and deleting data If you wish to enter data which has already been entered, simply replace the data entry value
with the update values. Data entry Validating data in the form. If you want to delete a data value
completely, you should select the value of interest, and press "Delete" on your keyboard. If you
enter a zero and the data element has been configured to not store zeros, the previous data
value (i.e. the one you wish to modify) will not be overwritten with the new value. Therefore, it is
better practice to delete the data value completely (waiting for the cell to turn green) and then to
enter the new value.
3. Excel import This unique functionality enable the user to import data from excel file directly into the portal.
• Under “Apps” Tab you will get “Excel import app”

• Then click on ‘Import facilitywise’ option
• When you click on ‘Import facilitywise, you will need to select the parameters like org unit group, dataset, period etc.
• Then click on org unit group and select the organization unit from the dropdown list like CHC / PHC/ DH/ SC group
• After selecting the orgunit group, select the parent orgunit.
eg: In the screen shot PHC group is selected then “Block Bahadurpur” is selecting in facility section. All PHC under “Block Bahadurpur” are loaded in the top right side”.

• After you have selected the org unit, select the data set from the drop down list
• Select the period from the drop down list
• Now select individual data excel files by clicking on “Choose file” button. Do it for all the loaded orgunits.
• Click on Validate button
• It will validate your data and your data will be stored in the application.
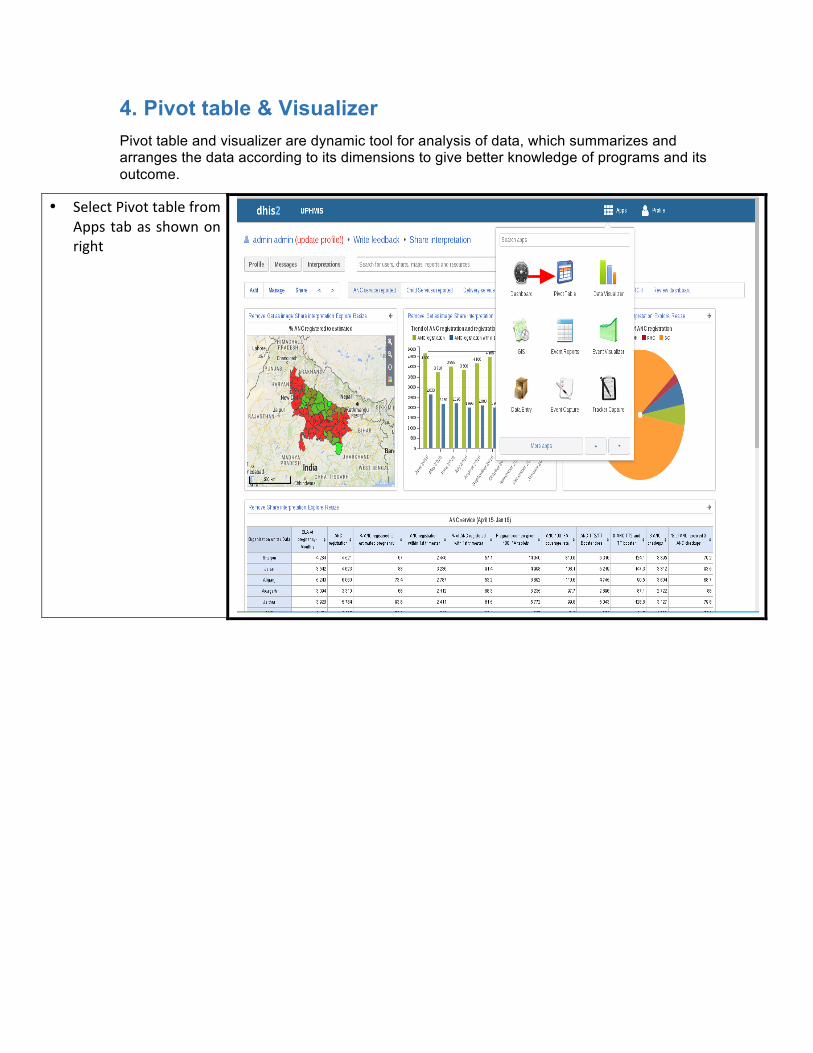
4. Pivot table & Visualizer Pivot table and visualizer are dynamic tool for analysis of data, which summarizes and arranges the data according to its dimensions to give better knowledge of programs and its outcome.
• Select Pivot table from Apps tab as shown on right

• Select indicator or data element from Data tab
• Select type of indicator or data element from drop down list

• Select type of period for which you want to do analysis eg. yearly, monthly etc
• Select organization unit for which you need to do analysis eg District level, Block level or Facility level

• Select update tab to generate the visualizer or table. Layout of particular data can be changed by clicking on layout tab next to update
• Select Visualizer from Apps tab as shown on right

• Select indicator or data element from Data tab
• Select type of indicator or data element from drop down list

• Select type of period for which you want to do analysis eg. yearly, monthly etc
• Select organization unit for which you need to do analysis eg District level, Block level or Facility level

• Select update tab to generate the graph. Layout of particular data can be changed by clicking on layout tab next to update
5. GIS All you need to do is selecting your desired indicator/data element-‐period-‐map combination, then the organisation unit level and finally the parent to define the boundary. If your database has coordinates for these organisation units they will appear on the map.

• Click on GIS app
• Edit the layer by
clicking on it.

• Then select the data element, group & period
• Select the
organization unit

• Define the legend to distinguish the performance of the districts.
• Go to option and
select the labels. You will get the districts boundary with labels in the map after updating it.

3. MPR (Monthly Progress Report) MPR can be generated at two level i.e. district & state. The steps for generating the MPR report at district & state level are same as per the defined user role. We have the option of selecting these reports (MPR state, MPR district) in ‘standard report’.
• Go to the apps and click on ‘report app’

• Then click on ‘report generation’
• Select the
organization unit, report type & period.
• The user can generate these reports at district & state level.
• Steps for generating the MPR for both the level is same.
• Once you click on generate report, you will get the district level MPR report for the selected period.

• Select the report type that you want to generate.
• Here you will get the
types of reports in MPR. You can choose the specfic format from the drop-‐down.
• You can also download the same by clicking “Download as excel” button.

• This type of MPR report will be generated on selecting the type of report from the drop down
3. Data Status Data status is the component of data quality where we can check the completeness of the report.

• Click on ‘report app’
• Go to ‘data status’

• Select the organization unit, data set, period and then click on ‘Data Status-‐ Data Set’.
• Here you get the data
status report of a district. You can check the facility wise completeness of the report through this report.
• You can download this report in excel format by just clicking on download tab.