Embed Size (px)
DESCRIPTION
Uplink Intercell Interference and Capacity in 3G
Citation preview
Uplink Intercell Interference and Capacity in 3GLTE systems
Salah Eddine Elayoubi and Olfa Ben HaddadaFrance Telecom, Research and Development Division
38-40 rue du General Leclerc92130 Issy-les-Moulineaux, France
{salaheddine.elayoubi, olfa.benhaddada}@orange-ftgroup.com
Abstract-In this paper, we study the inter-cell interference in ferent as there is no power control in the downlink, andthe uplink of 3G LTE systems. The multiple access is based the interference is user-dependent.on SC-FDMA. This is an orthogonal access (no intra-cell The remainder of this paper is organized as follows. Ininterference). However, inter-cell interference remains as section II, we model the interference in an SC-FDMAthere is no orthogonality between cells. We then model the system. In section III, we propose a power control algo-inter-cell interference by calculating the distribution of the rithm and use the developed interference model to calcu-number of collisions, taking into account the impact of power late the SINR and the average power emitted by a mobilecontrol. We then use this model to calculate the user capacity late th eRal thodology towerlcmitte by userbileof the system, by mean of a Markovian analysis. We finally station. A general methodology to calculate the user ca-use the developed model to evaluate and compare different pacity of the system is presented in section IV. This ca-interference mitigation schemes. pacity analysis is adapted in section V to the cases of the
different frequency planning schemes. The capacity of theI. INTRODUCTION system and the performances of the frequency reuse
schemes are illustrated by numerical applications in sec-The multiple access for the uplink of 3G Long Term Evo- tion VI. Concluding remarks terminate this paper.lution (LTE) is based on Single-Carrier Frequency Divi-sion Multiple Access (SC-FDMA) with a cyclic prefix to II. INTERFERENCE MODELINGachieve inter-user orthogonality and to enable efficientfrequency-domain equalization at the receiver [1]. In this A. SC-FDMA descriptioncontext, inter-cell interference is a major concern as there SC-FDMA can be considered as a DFT-precoded OF-is no orthogonality between signals ofneighbouring cells. DMA scheme. It consists in allocating to each user a set of
sub-carriers that can be adjacent (Localised FDMA) orIn this work, we develop analytical models for interfer- uniformly spaced (Interleaved FDMA). The user's sym-ence and capacity, taking into account the 3G LTE uplink bols are first precoded with a Direct Fourier Transformparticularities such as power control and adaptive modula- (DFT) matrix and then sent to the sub-carriers. The signaltion and coding. We begin by calculating the distribution samples are generated with IFFT and a Cyclic Prefix (CP)of the number of collisions and the emitted power under a is added.given load, and then use these distributions to develop a This operation is illustrated in Figure 1.Markovian model for the user capacity.
The presented capacity analysis is of major interest for Coded symbol rate=R
several applications, such as cell dimensioning and net- -| insertionDET b-carrier lET CP
work planning. In this paper, we show how to use the de- DFT Mapping IFFTrived model to study different interference mitigation NTX symbolsschemes. In fact, in addition to the classical reuse 3scheme, several mitigation methods have been proposed Size-NTX SiZe-NFFTin the literature based on a fractional frequency reuse. In Figure 1. Principle of SC-FDMA[2], the authors propose a fractional frequency reusescheme consisting of dividing the frequency band intoseveral sub-bands each corresponding to a path loss group The sub-carrier mapping determines which part of theand a different power control target is applied for these spectrum is used for transmission by inserting a suitabledifferent path loss groups. In this paper, we study and number of zeros. In case of localized mapping, zeros arecompare this fraction frequency reuse scheme with two added before and after the subset ofK symbols at the out-other interference mitigation schemes, namely reuse 1 and put of the DFT, and in case of distributed mapping, L-1reuse 3. Note that these schemes were also proposed for zeros are inserted between two consecutive symbols out ofthe OFDMA-based downlink [5], but the analysis is dif- the subset ofK symbols. This is illustrated in
1-4244-1230-7/07/$25.00 ©) 2007 IEEE 537 ICON 2007
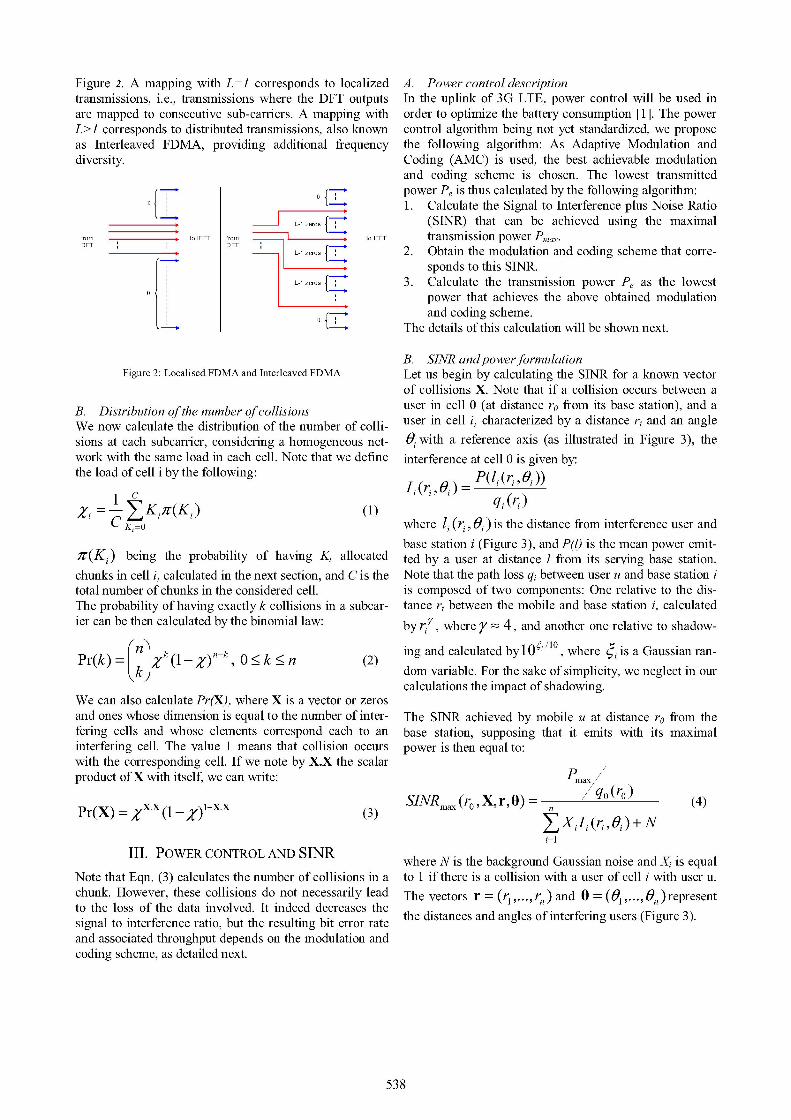
Figure 2. A mapping with L=1 corresponds to localized A. Power control descriptiontransmissions, i.e., transmissions where the DFT outputs In the uplink of 3G LTE, power control will be used inare mapped to consecutive sub-carriers. A mapping with order to optimize the battery consumption [1]. The powerL>1 corresponds to distributed transmissions, also known control algorithm being not yet standardized, we proposeas Interleaved FDMA, providing additional frequency the following algorithm: As Adaptive Modulation anddiversity. Coding (AMC) is used, the best achievable modulation
and coding scheme is chosen. The lowest transmittedf0 1-7_1power Pe is thus calculated by the following algorithm:
j ~ 1. Calculate the Signal to Interference plus Noise RatioL-1zerosI{ (SINR) that can be achieved using the maximal
from to IFFT from to IFFT transmission power Pmax.DFT DFT L-1 zerost-T 2.{. Obtain the modulation and coding scheme that corre-
sponds to this SINR.L-1 zeros 3. Calculate the transmission power Pe as the lowest
power that achieves the above obtained modulationand coding scheme.
of The details of this calculation will be shown next.
B. SINR andpowerformulationFigure 2: Localised FDMA and Interleaved FDMA Let us begin by calculating the SINR for a known vector
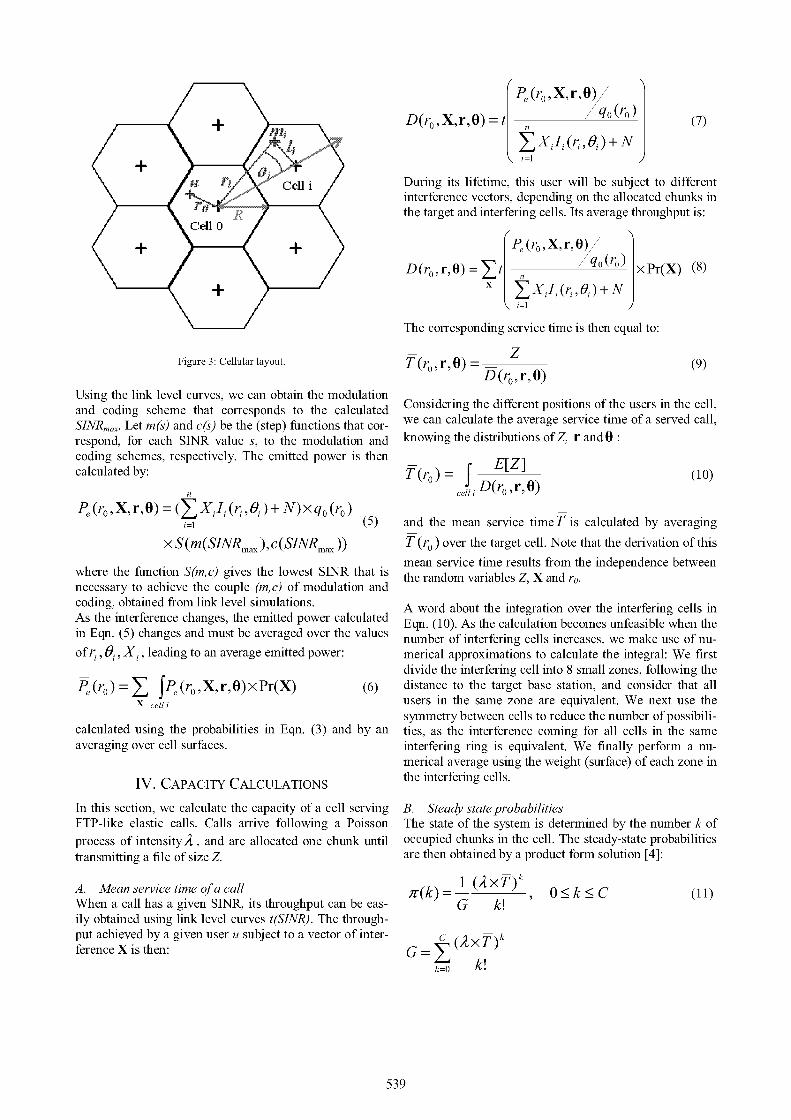
of collisions X. Note that if a collision occurs between a
B. Distribution ofthe number ofcollisions user in cell 0 (at distance ro from its base station), and a
We now calculate the distribution of the number of colli_ user in cell i, characterized by a distance ri and an anglesions at each subcarrier, considering a homogeneous net- 64 with a reference axis (as illustrated in Figure 3), thework with the same load in each cell. Note that we define interference at cell 0 is given by:the load of cell i by the following: I i (ri , Oi
jC A~~~~~~~~~~~~~~~~~~~~~~~~~~~~~~~i(r~,0)q(~(1, O)= 'Kj1f(Kj)(1CK=O where /i (r>, Oi ) is the distance from interference user and
base station i (Figure 3), and P(l) is the mean power emit-ff(Ki) being the probability of having K, allocated ted by a user at distance I from its serving base station.chunks in cell i, calculated in the next section, and C is the Note that the path loss qi between user u and base station itotal number of chunks in the considered cell. is composed of two components: One relative to the dis-The probability of having exactly k collisions in a subcar- tance ri between the mobile and base station i, calculatedier can be then calculated by the binomial law: by r1<, where y ; 4, and another one relative to shadow-
Pr(k) =jXk (l_ Z)n-kS 0 < k< n (2) ing and calculated by 1OI /10, where Ji is a Gaussian ran-Pr(k)k k (I )n-k , 0 <_ k <_ n (2) dom variable. For the sake of simplicity, we neglect in our
calculations the impact of shadowing.We can also calculate Pr(X), where X is a vector or zerosand ones whose dimension is equal to the number of inter- The SINR achieved by mobile u at distance ro from thefering cells and whose elements correspond each to an base station, supposing that it emits with its maximalinterfering cell. The value 1 means that collision occurs power is then equal to:with the corresponding cell. If we note by X.X the scalarproduct ofX with itself, we can write: Pmax /
Pr(X) x.x(I X I-X.X 3 SINRmax (ro , X, r, 0) q=(n0)(4)Pr(X) = xx x (1- (3) l x xE XiIi ( riI 0,) +Ni=l
III. POWER CONTROL AND SINR where N is the background Gaussian noise and Xi is equalNote that Eqn. (3) calculates the number of collisions in a to 1 if there is a collision with a user of cell i with user u.chunk. However, these collisions do not necessarily lead The vectors r = (tj . . ., rn ) and 0) = (t1,. .., Oyn ) representto the loss of the data involved. It indeed decreases thesignal to interference ratio, but the resulting bit error ratethdianeadaglsoitrfigues(Fue3)and associated throughput depends on the modulation andcoding scheme, as detailed next.
538
P (r,X r q0(r) 7~~~~~~~~~~~~~~~D(roIX rxrr0) =t qo /(ro ) (7)
CLXiIi (riI Oi ) +N)
\ fXt>t Cell i / During its lifetime, this user will be subject to differentinterference vectors, depending on the allocated chunks inthe target and interfering cells. Its average throughput is:
/ } ~~cell O0
(+ + K Pe (ro,X,r,O0)D(ro,r,O0) qt n (r0) xPr(X) (8)
ZxE X1I (r, fJ) +N\fX ~~~~~~~~~~~~~~~i=l
The corresponding service time is then equal to:z
Figure 3: Cellular layout. T(rO r, 0) = (9)D(ro,r,0)
Using the link level curves, we can obtain the modulationand coding scheme that corresponds to the calculated Considering the different positions of the users in the cell,SINRmax. Let m(s) and c(s) be the (step) functions that cor- we can calculate the average service time of a served callrespond, for each SINR value s, to the modulation and knowing the distributions of Z, r and0:coding schemes, respectively. The emitted power is then ErZ]calculated by: T(ro) = j (I)(10)
n cell i D(ro) r, 0)VJPe(roIX,r,0) = XjiI(rj,Oj)+ N)xqo(ro)
Pe (r0 , r, 0)=(~X1 (r, +N)xq(r)(5) and the mean service timeT is calculated by averagingx S(m(SINRmax), C(SINRmax)) T (ro ) over the target cell. Note that the derivation of this
mean service time results from the independence betweenwhere the function S(m, c) gives the lowest SINR that iSthradmviblsZXanr0necessary to achieve the couple (m,c) of modulation andcoding, obtained from link level simulations. A word about the integration over the interfering cells inAs the interference changes, the emitted power calculated Eqn. (10). As the calculation becomes unfeasible when thein Eqn. (5) changes and must be averaged over the values number of interfering cells increases, we make use of nu-of ri, 6i, Xi, leading to an average emitted power: merical approximations to calculate the integral: We first
divide the interfering cell into 8 small zones, following thePe (ro) = J,P (ro, X, r, 0) x Pr(X) (6) distance to the target base station, and consider that all
X celli users in the same zone are equivalent. We next use thesymmetry between cells to reduce the number of possibili-
calculated using the probabilities in Eqn. (3) and by an ties, as the interference coming for all cells in the sameaveraging over cell surfaces. interfering ring is equivalent. We finally perform a nu-
merical average using the weight (surface) of each zone in
IV. CAPACITY CALCULATIONS the interfering cells.In this section, we calculate the capacity of a cell serving B. Steady state probabilitiesFTP-like elastic calls. Calls arrive following a Poisson The state of the system is determined by the number k ofprocess of intensity%, and are allocated one chunk until occupied chunks in the cell. The steady-state probabilitiestransmitting a file of size Z. are then obtained by a product form solution [4]:
1 (A kA. Mean servicetimeofa call (k) 1 T )kWhen a call has a given SINR, its throughput can be eas- G k! k.C1ily obtained using link level curves t(SINR). The through-put achieved by a given user u subject to a vector of inter- c QLX T) kference X is then: G __=___
539
Note that this product form is still applicable, even if the of 1, high inter-cell interference is observed. The analysisservice time is not exponential, due to the insensitivity described above is directly applicable in order to obtainproperty [3]. the performance measures.
The load of the cell can be calculated by: B. Frequency reuse of3The classical interference avoidance scheme is by dividing
_1 v(k) the frequency band into 3 equal subbands and allocating-Ck T(k) (12) the subbands to cells so that adjacent cells always use dif-
k=O ferent frequencies. This scheme is called reuse 3. The ideaand the blocking probability is calculated by: behind this is to allow interference only from cells located
in ring 2, leading thus to low interference.b =fT(C) (13)
In order to analyze this scheme, the model presentedNote that these steady state probabilities are calculated abovedcantb applie th atse modificatinabove can be applied provided that some modificationsusing the mean service timeT , itself calculated using the are performed. In fact, the interference in Eqn. (2) is cal-probabilities of collisions (Eqn. (8-1 1)) and the mean culated only from cells in the second ring, and the capac-emitted power Pj by users of cell i (Eqn. (5)). In a homo- ity is calculated taking into account that only one third ofemtedpwe yusr o el Eq.(5) I hm-the chunks are used:geneous network, as the load and mean emitted power is
the same in each cell (Xi =%andP = Po Vi), we pro- I(k) TGk! T (14)pose to use the following iterative algorithm to obtain the G k! k=O k!steady-state probabilities in the whole network:1. Set the initial values for the iterations, e.g. with taking The mean service time T' is now calculated using Eqns.
the load in the interfering cellsXi = 0.5, i . 0. (7-10), but with a collision vector X of smaller size, de-2. For this given value of the load in the interfering scribing the interference from cells in the second ring.
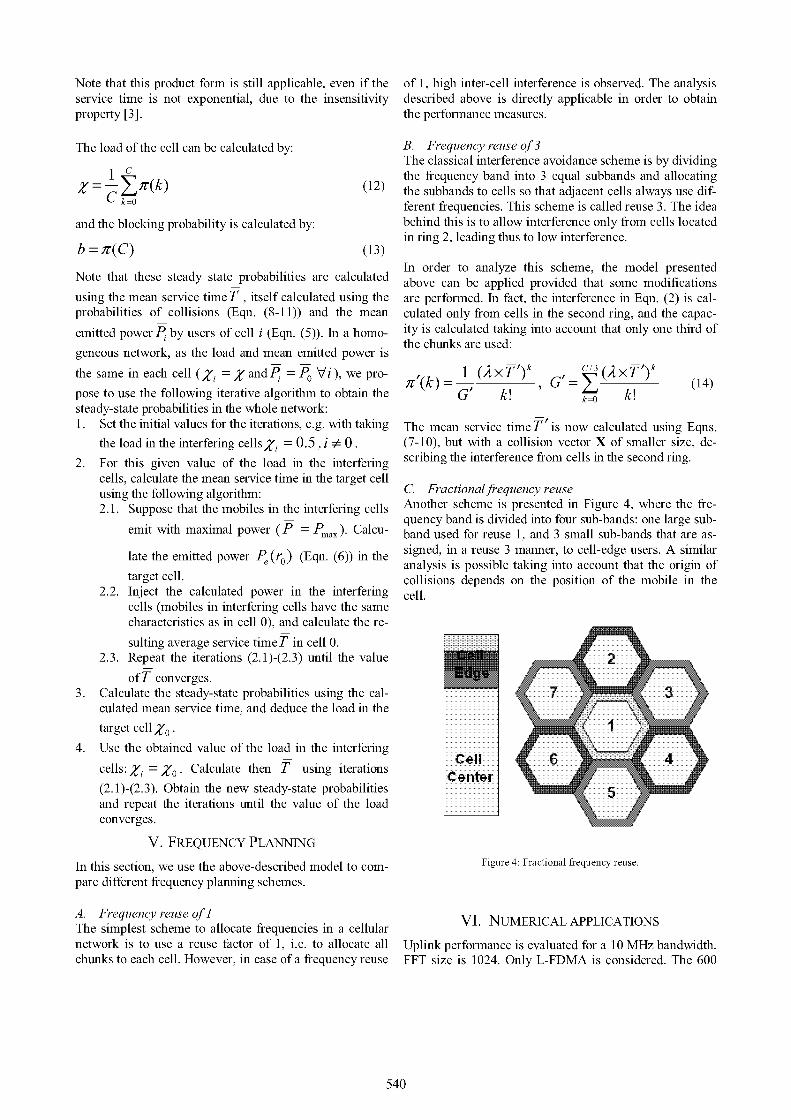
cells, calculate the mean service time in the target cellusing the following algorithm: C. Fractionalfrequency reuse2.1. Suppose that the mobiles in the interfering cells Another scheme is presented in Figure 4, where the fre-2-Suoehttmolsitenefig quency band is divided into four sub-bands: one large sub-
emit with maximal power (P = Pmax) Calcu- band used for reuse 1, and 3 small sub-bands that are as-late the emitedpwer(Eq.(6)i signed, in a reuse 3 manner, to cell-edge users. A similarlateteemitedpoer(ro) Eqn6analysis is possible taking into account that the origin of
target cell. collisions depends on the position of the mobile in the2.2. Inject the calculated power in the interfering cell.
cells (mobiles in interfering cells have the samecharacteristics as in cell 0), and calculate the re-
sulting average service timeT in cell 0.2.3. Repeat the iterations (2.1)-(2.3) until the value2
ofT converges.3. Calculate the steady-state probabilities using the cal-3
culated mean service time, and deduce the load in thetarget cell %o.
4. Use the obtained value of the load in the interfering Cell 6 4cells: i =/ . Calculate then T using iterations Center(2.1)-(2.3). Obtain the new steady-state probabilitiesand repeat the iterations until the value of the loadconverges.
V. FREQUENCY PLANNINGIn this section, we use the above-described model to com- Figure 4: Fractional frequency reuse.pare different frequency planning schemes.
A. Frequency reuse of]lThe simplest scheme to allocate frequencies in a cellular V.NMRCLAPIAINnetwork is to use a reuse factor of 1, i.e. to allocate all Uplinkperformance is evaluated for a 10 MHz bandwidth.chunks to each cell. However, in case of a frequency reuse FFT size is 1024. Only L-FDMA is considered. The 600
540
occupied sub-carriers are divided into 24 chunks of 25consecutive sub-carriers. Hence, the bandwidth associated 3600
to a chunk is about 400 kHz. 3400
_ V L 1 r i :.3200212 unoccupied sub-
} carriers
25 sub-carriers 2 /37J5 kHz I
2600 /
25 sub-carriers
_r X 0~~~~~~~~~~~~~~~~~~~~~~2 00 |S1
24 chunks FFT size =1024reuse 1reuse
2200 -e-fractibnal reuse
25sub-carriers2000Q
2 .65 3 3.5 4 4.6 5 6.5 6 &6. 7-~~~~~~~~~~~~~~~~~~~~~~~~~~~~~ ~~~~~~~~~~~~~~arrival rate
212 unoccupied sub-carriers
_j , Figure 7: Overall cell throughput for different values of the arrival traf-fic.
Figure 5: sub-carriers mapping VII. CONCLUSION
We consider a hexagonal 3G LTE network, with cells of In this paper, we developed an analytical model for theradius R=500 meters. We consider interference from cells capacity in the uplink of 3G LTE systems. We began byin the first two rings. deriving the distribution of the number of collisions, and,We plot in Figure 6 the throughput achieved by a chunk taking into account the power control, we obtain the dis-allocated to a user in different positions in the cell (calcu- tribution of the other-cell interference. Using a Markovianlated from Eqn. (11)) for reuse 1 and reuse 3 and frac- model, we show how to calculate the capacity of the sys-tional reuse schemes. We can see that this throughput has tem for a given configuration of the load in the interferinga step form in reuse 3, corresponding to the different cells. We then develop an iterative algorithm that calcu-modulation and coding schemes. However, in reuse 1 lates the load in the interfering cells, and gives the steadylarge interference fluctuations in each point of the cell state probabilities in a homogeneous network. We finallymake the curve smoother. On the other hand, a fractional use the developed model to compare the two classicalreuse is comparable to reuse 1 at cell center, and to reuse 3 frequency planning schemes (reuse 1 and reuse 3) andat cell edge. show that, although reuse 3 decreases interference, it de-
creases also the overall throughput because of the loss of700 resources. A fractional reuse is then a good compromise in
reuse 1 order to increase cell-edge performance with an accept-600
----reuse 360,0 X ' SX ufractional reuse able overall throughput.500 X REFERENCES
> 40X0 [1] 3GPP TR 25.814, "Physical Layer Aspects for Evolved UniversalTerrestrial Radio Access", 2006.
300 m I [2] 3GPP TSG-RAN WG1 #44, R1-060298, "Uplink inter cellJ=
T-_interference mitigation and text proposal", Nokia.
200 [3] E. Altman, "Capacity of multi-service cellular networks withtransmission-rate control: a queueing analysis", Mobicom'02,Atlanta.100
[4] F. Kelly, "Loss Networks", Journal of applied probabilities, 1992.
0 0 0 0 0 L 0 . [5] S.E Elayoubi, 0. Ben Haddada and B. Fourestie, "On frequency0 &05 0 1 o15 0 2 & 25 0.3 0.35 0 4 0 45 o 5 allocation in 3G LTE systems, IEEE PIMRC'06, Helsinky,
Distance from the base station September 2006.
[6] H. G. Myung, J. Lim, and D. J. Goodman, " Single Carrier FDMAFigure 6: Throughput function of the distance from the base station. for Uplink Wireless Transmission", IEEE Vehicular Technology
However, the overall cell throughput that we plot in Magazine, september 2006.Figure 7 has a different behavior, as the reuse 1 schemeoutperforms the other ones. This is due to the loss of twothirds of the resources in reuse 3, and of two sub-bands inthe fractional reuse. However, this latter remains a goodcompromise between the two classical schemes.
541


![RESEARCH Open Access Uplink interference protection and ... · quently, smaller cell sizes, femto-cell deployment, relays [3,4] and especially inter-cell interference coordination](https://img.pdfslide.net/doc/110x75/5f5c780d18ab1f7ff537e043/research-open-access-uplink-interference-protection-and-quently-smaller-cell.jpg)