Embed Size (px)
Citation preview
417
CHILEAN JOURNAL OF AGRICULTURAL RESEARCH 76(1) JANUARY-MARCH 2016CHILEAN JOURNAL OF AGRICULTURAL RESEARCH 76(4) OCTOBER-DECEMBER 2016
In maize (Zea mays L.) breeding programs, it is very important to define a genetic distance of inbred lines and to establish criteria and biometric methods for the satisfactory germplasm classification. A total of 29 inbred lines from Maize Research Institute “Zemun Polje” (MRIZP) breeding program, Belgrade, Serbia, were used to compare similarities obtained by morphological (according to UPOV - Union Internationale pour la Protection des Obtentions Végétales) and molecular (simple sequence repeats, SSR) markers. The aim was to assess discriminative power of applied markers in the separation of related lines, and to determine the possibility of their application in choosing parental lines for breeding programs. Application of different marker types resulted in adequate separation of inbreds into divergent groups, which facilitates the choice of parental lines. However, there were still many inconsistencies between the field and laboratory results. The quality of information from morphological markers was improved by the application of the appropriate descriptor, measurement scale and the biometric method. According to the correspondence analysis, increased number of SSR markers will enable more reliable results. Regression analysis of morphological visual assessment (MVG) and SSR similarity of individual inbreds pointed out that in some cases morphological, and in others molecular markers more accurately reflected known pedigree information of tested maize lines. In the early generations of maize inbred lines testing, we propose utilization of information resulting from morphological markers, according to UPOV descriptor. However, application of adequate number of molecular (SSR) markers has an economic justification on a smaller number of elite lines in the later generations of line testing.
Key words: Maize breeding, genetic relationships, SSR, UPOV descriptor, Zea mays.
ABSTRACT
UPOV morphological versus molecular markers for maize inbred lines variability determination
RESEARCH
CHILEAN JOURNAL OF AGRICULTURAL RESEARCH 76(4) OCTOBER-DECEMBER 2016
1Maize Research Institute, Zemun Polje, Slobodana Bajica 1, 11185 Belgrade, Serbia. *Corresponding author ([email protected]).2University of Belgrade, Faculty of Economics, Kamenička 6, 11000 Belgrade, Serbia.
Received: 15 March 2016.Accepted: 24 August 2016.doi:10.4067/S0718-58392016000400004 RE
SEARCH
INTRODUCTION
Maize (Zea mays L.) is among the world’s most important cereals in terms of human and animal nutrition and industrial use, and at same time, one of the most diverse crops that exhibit broad genetic and phenotypic variation. Its genetic diversity has been characterized by morphological traits, pedigree analysis, heterosis data, biochemical and DNA molecular markers (Smith and Smith, 1989; Jambrovic et al., 2008; Srdic et al., 2008; Ranatunga et al., 2009; Lauer et al., 2012; Shrestha, 2013). Due to an unknown mechanism of genetic control and a great environmental effect on the trait expression, phenotypic markers are often considered unreliable indicators of genetic relationships for the tested material. However, morphological traits are still very important in determination of the agronomic value and in taxonomic classification of maize and the other plant species (Ortiz et al., 2008). In addition, morphological markers play an important role in the management and maintenance of Plant Genetic Resources (PGR), as well as in Plant Breeders’ Rights (PBR) system. In order to standardize the morphological description for maize, several guidelines for morphological descriptors of maize were published and approved at international level (Law et al., 2011). One of them is the descriptor for maize, published by International Union for the Protection of New Varieties of Plants (Union Internationale pour la Protection des Obtentions Végétales - UPOV) (UPOV TG/2/7, 2009). The aim of UPOV Convention is to ensure conditions for granting the breeder’s right, based on uniform and clearly defined principles. A significant advance by UPOV was made in terms of international standardization of field trials, experimental and statistical designs, data gathering and analyzing, as well as comparisons of various methodologies related to other suggestions corresponding to phylogenetic, taxonomic studies, or issues important for gene bank management. In the UPOV Descriptor, the degradation of measurement scale from scale to ordinal level significantly decreases environmental effects on the quantitative traits. Results obtained using this method are more reliable for genotypes comparison than the results based on mean values of scale measurements over several years or locations. For the same maize inbred lines, morphological data (analyzed by USA and EU descriptors) cannot be transformed and combined into a single set of data in order to define differences between inbreds (Law et al., 2011), although these two systems provide, individually, a similar ranking of compared lines for many traits and identify differences for the protection of breeders’ rights.
Vojka Babic1, Ana Nikolic1*, Violeta Andjelkovic1, Dragan Kovacevic1, Milomir Filipovic1, Vladimir Vasic2, and Snezana Mladenovic-Drinic1
418
CHILEAN JOURNAL OF AGRICULTURAL RESEARCH 76(1) JANUARY-MARCH 2016CHILEAN JOURNAL OF AGRICULTURAL RESEARCH 76(4) OCTOBER-DECEMBER 2016
The limitations of morphological traits are reflected through low level of polymorphism, low heritability, late expression, limited discriminative power and potential to measure relatedness and genetic similarity. Nowadays, molecular markers are considered as the most reliable tool in genetic studies. They identify high level of polymorphism, allow the assessment of genetic diversity at DNA level, can be evaluated at different growing stages, and their expression is independent of environmental conditions. Different molecular markers are used to evaluate genetic diversity, but no single technique is universally appropriate. The selection of particular markers depends on the objective of the study and available facilities. Among DNA-based markers, simple sequence repeats (SSR) have been used comprehensively for maize genetic studies (Ignjatovic-Micic et al., 2007; Adetimirin et al., 2008). The molecular markers ability to distinguish closely related genotypes raises the concern about decreasing minimum required distance for determination of distinctness, number of markers required, and their distribution throughout the genome. Therefore, it is very important to define a set of markers for proper genome coverage (Gunjaca et al., 2008). There is no one individual marker that can give all the information needed in plant adaptation, breeding and conservation, without support from another technique. Generally, a greater number of authors state that relationships between morphological and molecular markers are often unclear, but their triangular shape of relationships has been confirmed and theoretically explained by many authors (Rebourg et al., 2001). Organization of maize germplasm into genetically divergent groups is important for the optimal use of the phenomenon of heterosis in hybrid breeding programs. Two important questions are: What is the distance between maize lines within the same and among the different heterotic groups and what criteria and biometric methods allow adequate grouping of germplasm? The breeder’s dilemma is often which tester(s) is (are) the best to use in testing the inbred derived from a hybrid or the inbred developed by crossing parents belonging to different/distant heterotic groups. Previous studies (Babic et al., 2008; 2014) pointed out that morphological markers (according to the UPOV descriptor) were sufficient for good maize inbred line discrimination, giving useful information for maize breeding. The objectives of this study were (i) to compare similarities obtained by morphological (according to UPOV descriptor) and molecular (SSR) markers, (ii) to assess discriminative power of applied markers in the separation of related lines, and (iii) to determine the possibility of their application in choosing parental lines in breeding programs.
MATERIAL AND METHODS
Morphological characterizationIn this study, 29 inbred lines from Maize Research
Institute “Zemun Polje” (MRIZP) breeding program, Belgrade, Serbia, were used. Each line was sown in two rows, with 20 plants per row, two replicates and at two locations: Zemun Polje (44°52’ N, 20°19’ E, 81 m a.s.l.) and Krnješevci (30 km North from Zemun Polje), according to randomized complete block design. Morphological characterization was performed based on the UPOV descriptor for maize (UPOV TG/2/7, 2009), by a visual assessment for a single observation of a group of plants or parts of plants (VG), and measurement of 10 individual plants or part of plants (MS). Table 1 shows a list of scored characters, plant developmental stage at time of assessment (SDA), method of measurement (TO) and range of possible (according to descriptor) (RND) and obtained scores (RNM). A list of tested lines and information about their origin are given in Table 2.
Marker analysisGenetic characterization of maize inbred lines was done by the application of the SSR markers. Extraction of genomic DNA from fresh leaf tissue was done employing modified method of Saghai-Maroof et al. (1984). A total of 25 SSR primers were selected from the Maize Genetics Database (MaizeGDB; www.maizegdb.org). The amplifications were performed using volumes of 25 μL PCR reaction containing 1 × reaction buffer, 2.4 mM MgCl2, 0.8 mM dNTP, 0.5 µL primers, 1 U Taq polymerase (Thermo Scientific, Waltham, Massachusetts, USA) and 50 ng DNA template. Amplifying program was applied (Thermocycler TProfessional Standard 96, Biometra, Göttingen, Germany) as follows: Initial denaturation at 95 °C for 5 min, 15 cycles of denaturation at 95 °C for 30 s, annealing at 63.5 °C for 1 min (-0.5 °C per cycle) and extension at 72 °C, then 22 cycles of denaturation at 95 °C for 30 s, annealing at 56 °C for 1 min and extension at 72 °C for 1 min and final elongation at 72 °C for 4 min. Electrophoresis was performed on 8% polyacrylamide gels for 1.5 h at 80 mA (Mini Protean Tetra, Cell BioRad, Hercules, California, USA). Gels were stained with ethidium-bromide (0.5 μg μL-1) and photographed under UV light using a gel documentation system (BioDocAnalyze Live, Biometra). Primer names and sequences are presented in Table 3.
Statistical analysis The cluster analysis (Complete-Linkage Clustering method, squared Euclidean distance) was performed on morphological data separately: For the visual assessment (VG) and for scale-measured traits (MS). Additionally, scale- and visually- measured traits were merged (VG+MS) and the same analysis was done. Standardization of data, except in the first set, was done prior to defying the distance. For visual assessment, instead of mean values per replicate/location, the modal value was a measure of central tendency. It has been considered that using this approach, the impact of both, environment and observer’s subjectivity would be partially reduced.
419
CHILEAN JOURNAL OF AGRICULTURAL RESEARCH 76(1) JANUARY-MARCH 2016CHILEAN JOURNAL OF AGRICULTURAL RESEARCH 76(4) OCTOBER-DECEMBER 2016
Molecular markers were scored in a binary form of 1 or 0 for presence or absence of the band, respectively. Genetic similarities were estimated by Jaccard similarity coefficient. Matrices of distances/similarity were used for cluster and correspondence analysis. In order to obtain more detailed presentation of inter-relationships of maize inbred lines in this study, correspondence analysis was used (Dell Software, 2015). For this purpose, morphological distances are transformed into similarities and the results of correspondence analysis are presented on scatter diagrams.
The advantage of such presentation is that results are presented in the form of continuous variation, while the cluster analysis presents results in the form of groups-clusters, even when the continuality in data is present. The relationship between morphological and molecular similarity was presented in scatter diagrams of regression analysis. All statistical analyses were performed using program the SPSS Statistics 23 (IBM, Armonk, New York, USA).
RESULTS AND DISCUSSION
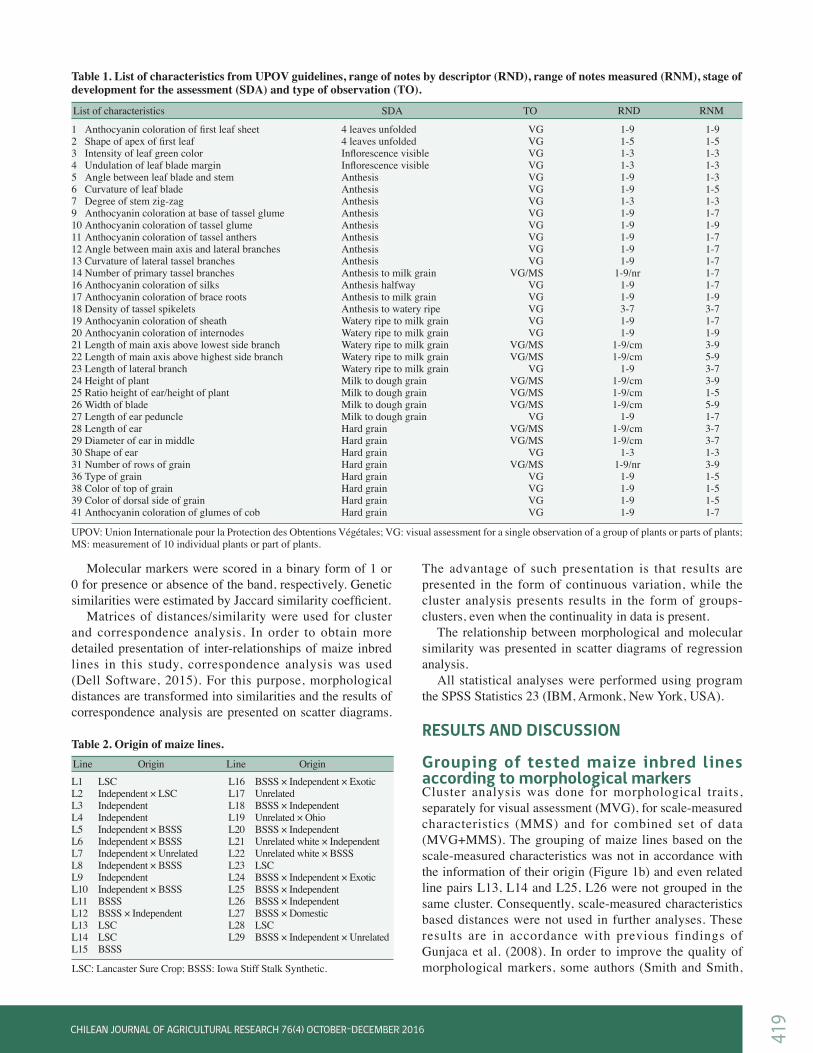
Grouping of tested maize inbred lines according to morphological markersCluster analysis was done for morphological traits, separately for visual assessment (MVG), for scale-measured characteristics (MMS) and for combined set of data (MVG+MMS). The grouping of maize lines based on the scale-measured characteristics was not in accordance with the information of their origin (Figure 1b) and even related line pairs L13, L14 and L25, L26 were not grouped in the same cluster. Consequently, scale-measured characteristics based distances were not used in further analyses. These results are in accordance with previous findings of Gunjaca et al. (2008). In order to improve the quality of morphological markers, some authors (Smith and Smith,
1 Anthocyanin coloration of first leaf sheet 4 leaves unfolded VG 1-9 1-92 Shape of apex of first leaf 4 leaves unfolded VG 1-5 1-53 Intensity of leaf green color Inflorescence visible VG 1-3 1-34 Undulation of leaf blade margin Inflorescence visible VG 1-3 1-35 Angle between leaf blade and stem Anthesis VG 1-9 1-36 Curvature of leaf blade Anthesis VG 1-9 1-57 Degree of stem zig-zag Anthesis VG 1-3 1-39 Anthocyanin coloration at base of tassel glume Anthesis VG 1-9 1-710 Anthocyanin coloration of tassel glume Anthesis VG 1-9 1-911 Anthocyanin coloration of tassel anthers Anthesis VG 1-9 1-712 Angle between main axis and lateral branches Anthesis VG 1-9 1-713 Curvature of lateral tassel branches Anthesis VG 1-9 1-714 Number of primary tassel branches Anthesis to milk grain VG/MS 1-9/nr 1-716 Anthocyanin coloration of silks Anthesis halfway VG 1-9 1-717 Anthocyanin coloration of brace roots Anthesis to milk grain VG 1-9 1-918 Density of tassel spikelets Anthesis to watery ripe VG 3-7 3-719 Anthocyanin coloration of sheath Watery ripe to milk grain VG 1-9 1-720 Anthocyanin coloration of internodes Watery ripe to milk grain VG 1-9 1-921 Length of main axis above lowest side branch Watery ripe to milk grain VG/MS 1-9/cm 3-922 Length of main axis above highest side branch Watery ripe to milk grain VG/MS 1-9/cm 5-923 Length of lateral branch Watery ripe to milk grain VG 1-9 3-724 Height of plant Milk to dough grain VG/MS 1-9/cm 3-925 Ratio height of ear/height of plant Milk to dough grain VG/MS 1-9/cm 1-526 Width of blade Milk to dough grain VG/MS 1-9/cm 5-927 Length of ear peduncle Milk to dough grain VG 1-9 1-728 Length of ear Hard grain VG/MS 1-9/cm 3-729 Diameter of ear in middle Hard grain VG/MS 1-9/cm 3-730 Shape of ear Hard grain VG 1-3 1-331 Number of rows of grain Hard grain VG/MS 1-9/nr 3-936 Type of grain Hard grain VG 1-9 1-538 Color of top of grain Hard grain VG 1-9 1-539 Color of dorsal side of grain Hard grain VG 1-9 1-541 Anthocyanin coloration of glumes of cob Hard grain VG 1-9 1-7
Table 1. List of characteristics from UPOV guidelines, range of notes by descriptor (RND), range of notes measured (RNM), stage of development for the assessment (SDA) and type of observation (TO).
List of characteristics
UPOV: Union Internationale pour la Protection des Obtentions Végétales; VG: visual assessment for a single observation of a group of plants or parts of plants; MS: measurement of 10 individual plants or part of plants.
SDA TO RND RNM
Table 2. Origin of maize lines.
LSC: Lancaster Sure Crop; BSSS: Iowa Stiff Stalk Synthetic.
LineL1 LSC L16 BSSS × Independent × ExoticL2 Independent × LSC L17 UnrelatedL3 Independent L18 BSSS × IndependentL4 Independent L19 Unrelated × OhioL5 Independent × BSSS L20 BSSS × IndependentL6 Independent × BSSS L21 Unrelated white × IndependentL7 Independent × Unrelated L22 Unrelated white × BSSSL8 Independent × BSSS L23 LSCL9 Independent L24 BSSS × Independent × ExoticL10 Independent × BSSS L25 BSSS × IndependentL11 BSSS L26 BSSS × IndependentL12 BSSS × Independent L27 BSSS × DomesticL13 LSC L28 LSC L14 LSC L29 BSSS × Independent × UnrelatedL15 BSSS
Origin Line Origin
420
CHILEAN JOURNAL OF AGRICULTURAL RESEARCH 76(1) JANUARY-MARCH 2016CHILEAN JOURNAL OF AGRICULTURAL RESEARCH 76(4) OCTOBER-DECEMBER 2016
1989) recommended greater number of measurements. Other authors recommend that a photo of ear is reliable and informative enough with a limited number of morphological characteristics (Global Crop Diversity Trust, 2007; Law et al., 2011). Further cluster analysis was done based on a visual assessment (MVG) and combined data for visual assessment and scale-measured traits (MVG+MS) (Figure 1a, 1c). Herein, grouping in both dendrograms were very consistent with pedigree data, especially in highly related lines, such as
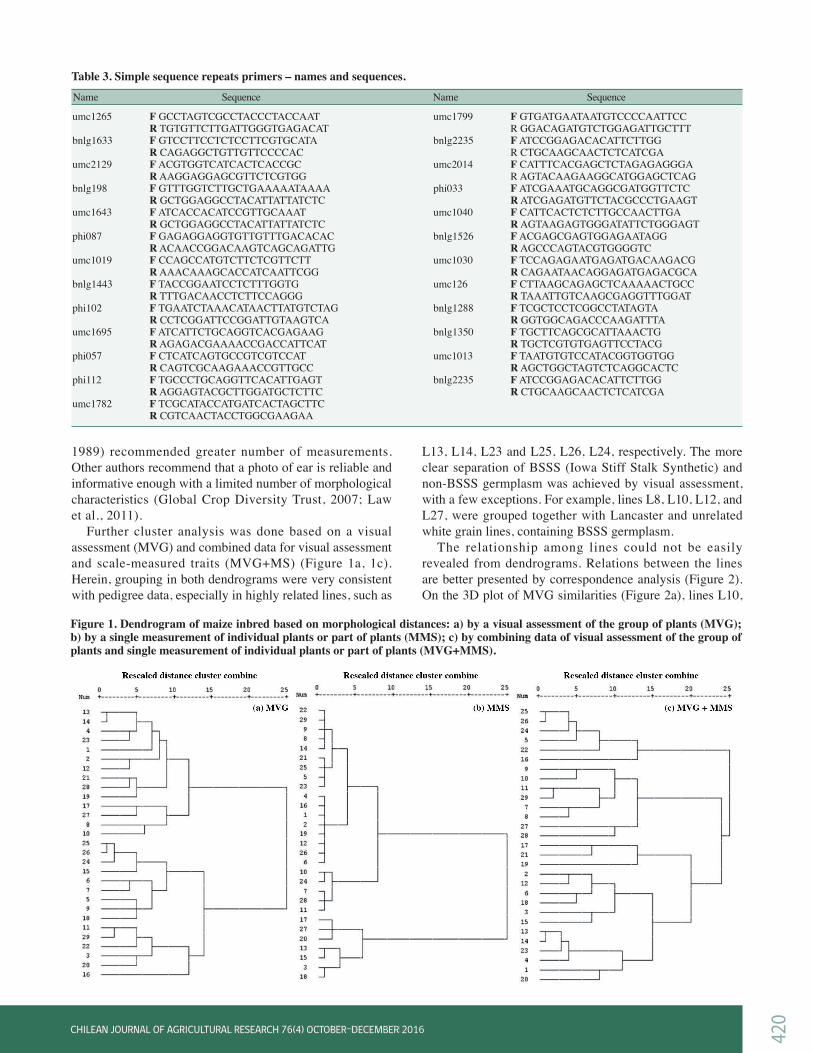
L13, L14, L23 and L25, L26, L24, respectively. The more clear separation of BSSS (Iowa Stiff Stalk Synthetic) and non-BSSS germplasm was achieved by visual assessment, with a few exceptions. For example, lines L8, L10, L12, and L27, were grouped together with Lancaster and unrelated white grain lines, containing BSSS germplasm. The relationship among lines could not be easily revealed from dendrograms. Relations between the lines are better presented by correspondence analysis (Figure 2). On the 3D plot of MVG similarities (Figure 2a), lines L10,
Figure 1. Dendrogram of maize inbred based on morphological distances: a) by a visual assessment of the group of plants (MVG); b) by a single measurement of individual plants or part of plants (MMS); c) by combining data of visual assessment of the group of plants and single measurement of individual plants or part of plants (MVG+MMS).
Table 3. Simple sequence repeats primers – names and sequences.
Name
umc1265 F GCCTAGTCGCCTACCCTACCAAT R TGTGTTCTTGATTGGGTGAGACATbnlg1633 F GTCCTTCCTCTCCTTCGTGCATA R CAGAGGCTGTTGTTCCCCACumc2129 F ACGTGGTCATCACTCACCGC R AAGGAGGAGCGTTCTCGTGGbnlg198 F GTTTGGTCTTGCTGAAAAATAAAA R GCTGGAGGCCTACATTATTATCTCumc1643 F ATCACCACATCCGTTGCAAAT R GCTGGAGGCCTACATTATTATCTCphi087 F GAGAGGAGGTGTTGTTTGACACAC R ACAACCGGACAAGTCAGCAGATTGumc1019 F CCAGCCATGTCTTCTCGTTCTT R AAACAAAGCACCATCAATTCGGbnlg1443 F TACCGGAATCCTCTTTGGTG R TTTGACAACCTCTTCCAGGGphi102 F TGAATCTAAACATAACTTATGTCTAG R CCTCGGATTCCGGATTGTAAGTCAumc1695 F ATCATTCTGCAGGTCACGAGAAG R AGAGACGAAAACCGACCATTCATphi057 F CTCATCAGTGCCGTCGTCCAT R CAGTCGCAAGAAACCGTTGCCphi112 F TGCCCTGCAGGTTCACATTGAGT R AGGAGTACGCTTGGATGCTCTTCumc1782 F TCGCATACCATGATCACTAGCTTC R CGTCAACTACCTGGCGAAGAA
Sequence Name Sequence
umc1799 F GTGATGAATAATGTCCCCAATTCC R GGACAGATGTCTGGAGATTGCTTTbnlg2235 F ATCCGGAGACACATTCTTGG R CTGCAAGCAACTCTCATCGAumc2014 F CATTTCACGAGCTCTAGAGAGGGA R AGTACAAGAAGGCATGGAGCTCAGphi033 F ATCGAAATGCAGGCGATGGTTCTC R ATCGAGATGTTCTACGCCCTGAAGTumc1040 F CATTCACTCTCTTGCCAACTTGA R AGTAAGAGTGGGATATTCTGGGAGTbnlg1526 F ACGAGCGAGTGGAGAATAGG R AGCCCAGTACGTGGGGTCumc1030 F TCCAGAGAATGAGATGACAAGACG R CAGAATAACAGGAGATGAGACGCAumc126 F CTTAAGCAGAGCTCAAAAACTGCC R TAAATTGTCAAGCGAGGTTTGGATbnlg1288 F TCGCTCCTCGGCCTATAGTA R GGTGGCAGACCCAAGATTTAbnlg1350 F TGCTTCAGCGCATTAAACTG R TGCTCGTGTGAGTTCCTACGumc1013 F TAATGTGTCCATACGGTGGTGG R AGCTGGCTAGTCTCAGGCACTCbnlg2235 F ATCCGGAGACACATTCTTGG R CTGCAAGCAACTCTCATCGA
421
CHILEAN JOURNAL OF AGRICULTURAL RESEARCH 76(1) JANUARY-MARCH 2016CHILEAN JOURNAL OF AGRICULTURAL RESEARCH 76(4) OCTOBER-DECEMBER 2016
L12 and L27, being misclassified in cluster analysis (with exception of L8), were located between BSSS (right) and non-BSSS lines (left). Unrelated white grain lines were also clearly differentiated. Next to these lines is line L27, with the larger proportion of B84 germplasm (BSSS), but also with a certain percentage of local germplasm from line V158, which probably influenced the expression of different phenotype and this way of grouping. Troyer and Rocheford (2002) emphasized that introgression of a small amount of DNA can have significant effects on agronomic
performances. Similar results of grouping are observed in Figure 2b, but with a less clear separation of BSSS and non-BSSS germplasm. Apparently, use of adequate statistical methods as well as scale of measurements, significantly increase quality and utility of morphological markers. Previous studies (Babic et al., 2012; 2014) pointed out the sufficient level of discrimination in divergent groups based on morphological markers, according to UPOV descriptor, as well as, the fact that the obtained information can be useful in maize breeding.
Figure 2. Graph of correspondence analysis of maize inbred lines morphological similarities according to MVG similarities (a) and according to MVG+MMG similarities (b).
MVG: Similarities according to visual assessment of the group of plants; MVG+MMS: similarities according to combining data of visual assessment of the group of plants and single measurement of individual plants or part of plants; BSSS: Iowa Stiff Stalk Synthetic.
422
CHILEAN JOURNAL OF AGRICULTURAL RESEARCH 76(1) JANUARY-MARCH 2016CHILEAN JOURNAL OF AGRICULTURAL RESEARCH 76(4) OCTOBER-DECEMBER 2016
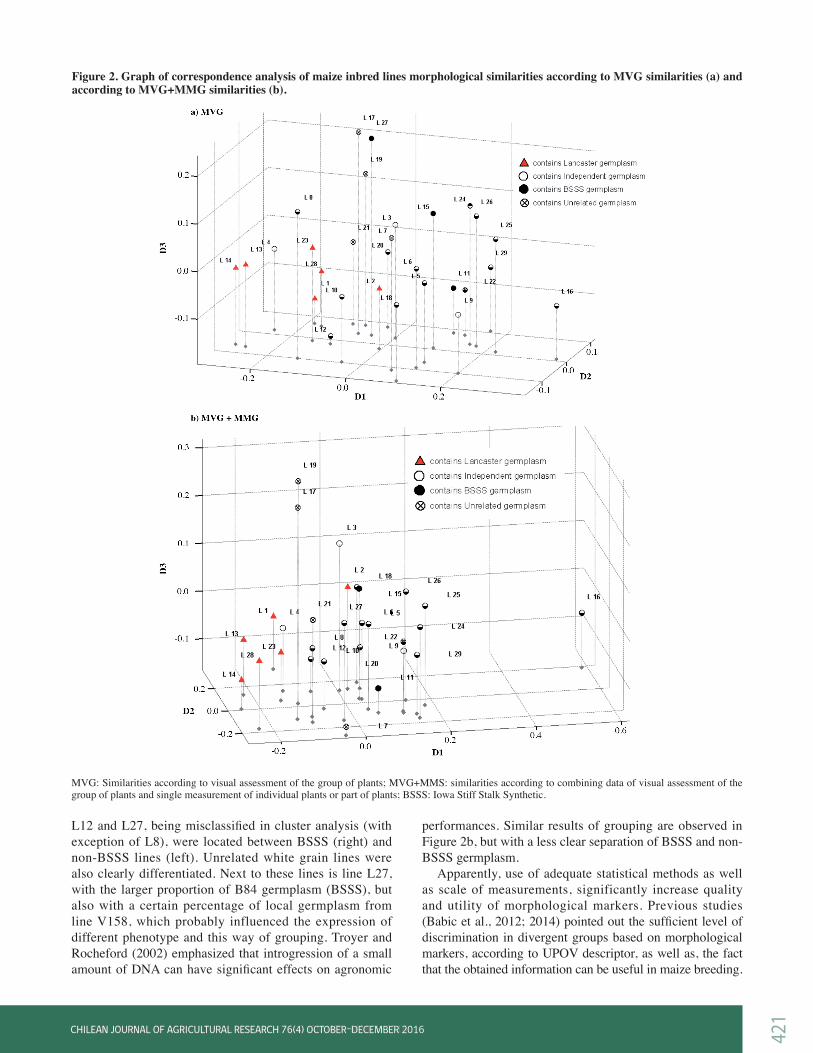
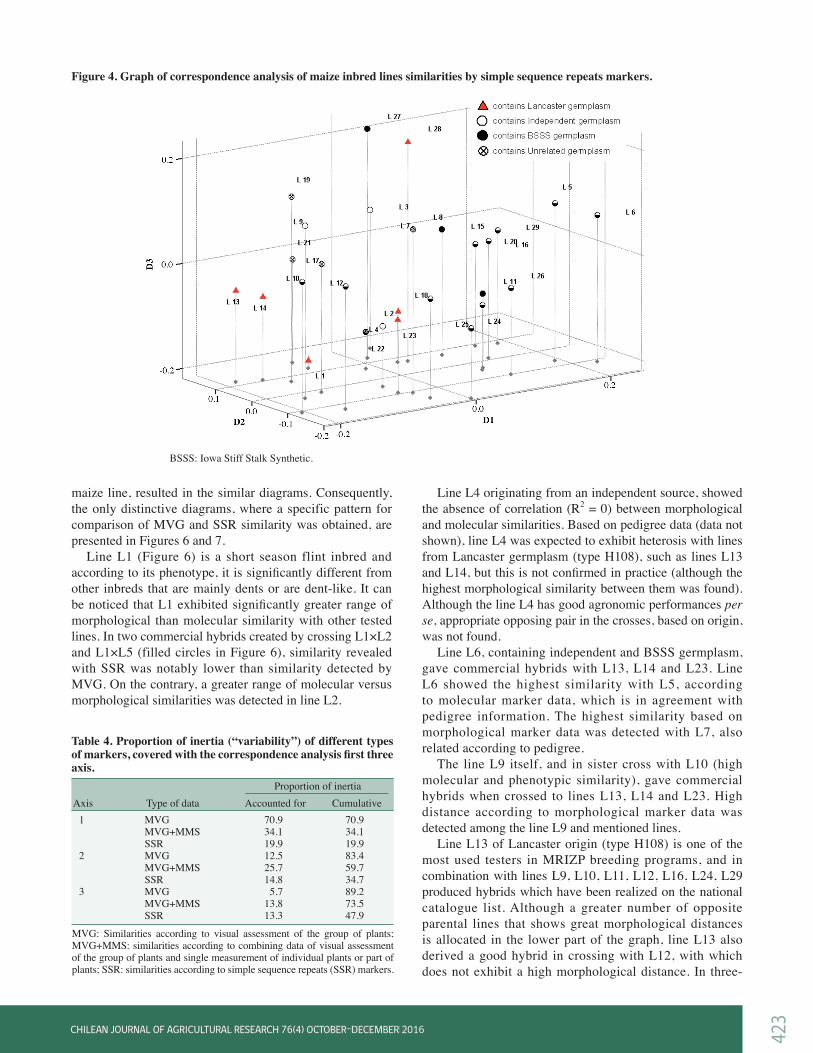
Grouping of tested maize inbred lines according to molecular markersThe SSR analysis revealed 115 polymorphic alleles. Number of alleles was in the range from 1 to 15, with the average number of 5.95 per primer. Marker data were used for similarity calculations, and the dendrograms were constructed according to similarity matrices. Results of SSR markers (Figure 3) are consistent with the information of inbreds origin. The lines sharing common germplasm, such as L7, L8, L9, L10 or L13, L14, L23 or L5, L6, L20, L29 are grouped together. Rahman et al. (2011) compared classification of rice genotypes by morphological and SSR markers and concluded that clustering based on SSR polymorphisms corresponds well to their known pedigree data. Application of SSRs in model-based clustering analysis of 260 maize inbreds, placed them in five groups corresponding to known pedigree data, plus one group of mixed origins (Liu et al., 2003). The correspondence analysis, according to SSR similarity, differentiated non-BSSS and BSSS germplasm, although there are certain exceptions (Figure 4). The inbred L28 from the Lancaster group was clearly differentiated, on the correspondence analysis chart, from the other Lancaster inbreds. Likewise, the position of the inbred L23 was significantly distant from the position of the inbreds L13 and L14, with which it is closely related according to their pedigrees. Inbreds L10 and L12 that partly contain the BSSS germplasm are grouped near unrelated and Lancaster inbreds. Percentage of inertia (“variability”), covered with the first three axis of correspondence analysis (Table 4), is far the largest for MVG markers (89.2), and the lowest for the
SSR markers (47.9). A small percentage of inertia, covered by the first three axis in molecular markers, indicates the insufficient amount of information in order to create axis values confidently. Our results showed that MVG markers (according to UPOV descriptor) gave better quality of information than SSR markers used. Although numerous studies emphasize advantages of molecular markers over phenotypic ones, still a lot of work need to be done on standardization for the use of molecular markers in both, implementation in commercial breeding programs and in the processes of plant variety protection (PVP). In the study of Gunjaca et al. (2008), 41 maize lines were genotyped with 28 SSR markers and results were compared with 32 morphological markers, recommended by UPOV. Results were largely in favor of the use of molecular markers, as a valuable addition to the Distinctness, Uniformity, and Stability (DUS) testing procedure. The authors stated that their wider implementation depend on precise definition of type and number of markers to be used, as well as on determination of threshold values for distinctness and uniformity.
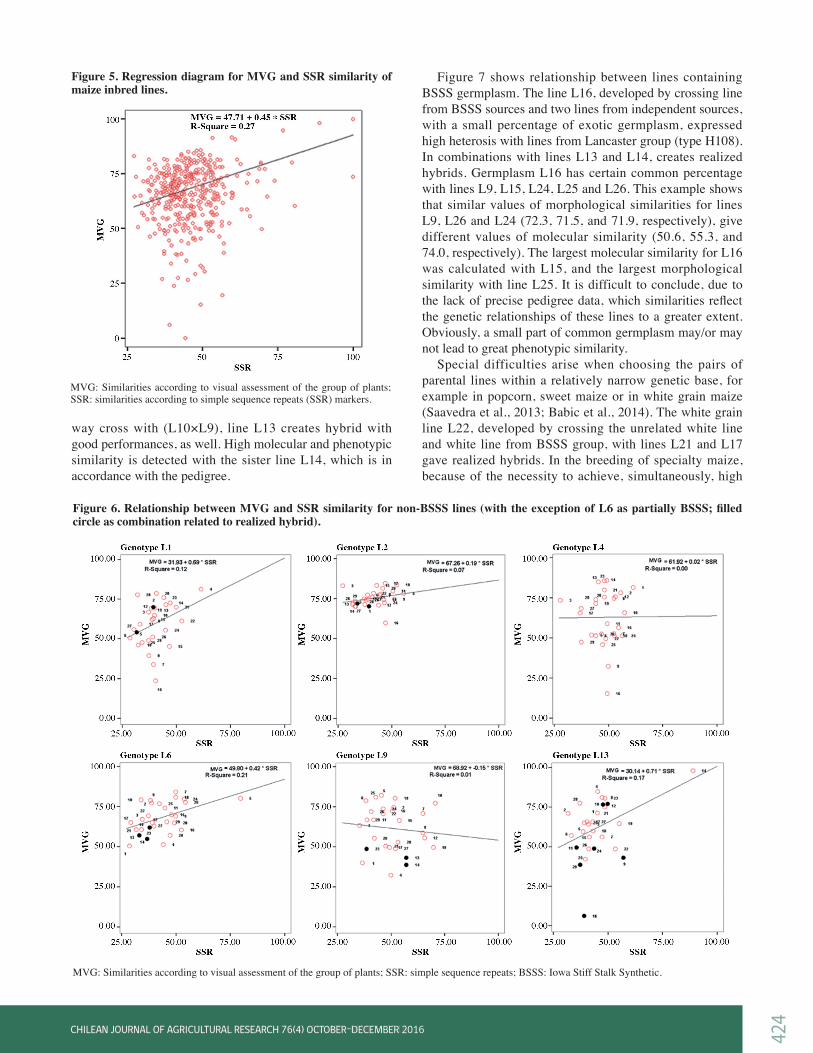
Regression analysis of phenotypic and molecular similaritiesSimilarities of tested lines, obtained by applied markers, were compared using regression and correlation analysis. Correlations between morphological and molecular similarities were significant (data not shown) and their values were moderate and low. Significance of correlation may partially be a consequence of the large number of compared pairs (a large degrees of freedom), and not only a consequence of substantial correlation. The relations between morphological (MVG) and SSR markers similarities are presented on scatter plot (Figure 5). A significantly larger dispersions occurs at y axis (MVG) compared to the x axis (SSR); R2 values indicate that 27% of variation in morphological similarities can be explained by the variation of molecular, i.e. SSR similarities. Maize lines of approximately the same molecular similarities exhibited very different morphological similarities. This suggests that the weakly and moderately related genotypes, based on molecular markers assessment, may exhibit significantly different phenotype. By increasing a molecular similarity, density of points is reduced, but also tendency towards morphological similarities increasing is present. This is in accordance with triangular relationship between molecular and morphological distances (Rebourg et al., 2001): Small molecular marker distances are associated with small phenotypic distances, but high values of marker distances correspond to a wider range of phenotypic distances. Gunjaca et al. (2008) stated that genetically distant individuals could have either similar or diverse phenotype, but genetically closely linked individuals could only have similar phenotype. Dispersion diagrams for certain lines showed different patterns, although comparison of morphological (MVG or MVG+MS) and molecular markers (SSR) for the same
Figure 3. Dendrogram of maize inbred lines based on molecular distances by simple sequence repeats markers.
423
CHILEAN JOURNAL OF AGRICULTURAL RESEARCH 76(1) JANUARY-MARCH 2016CHILEAN JOURNAL OF AGRICULTURAL RESEARCH 76(4) OCTOBER-DECEMBER 2016
BSSS: Iowa Stiff Stalk Synthetic.
Figure 4. Graph of correspondence analysis of maize inbred lines similarities by simple sequence repeats markers.
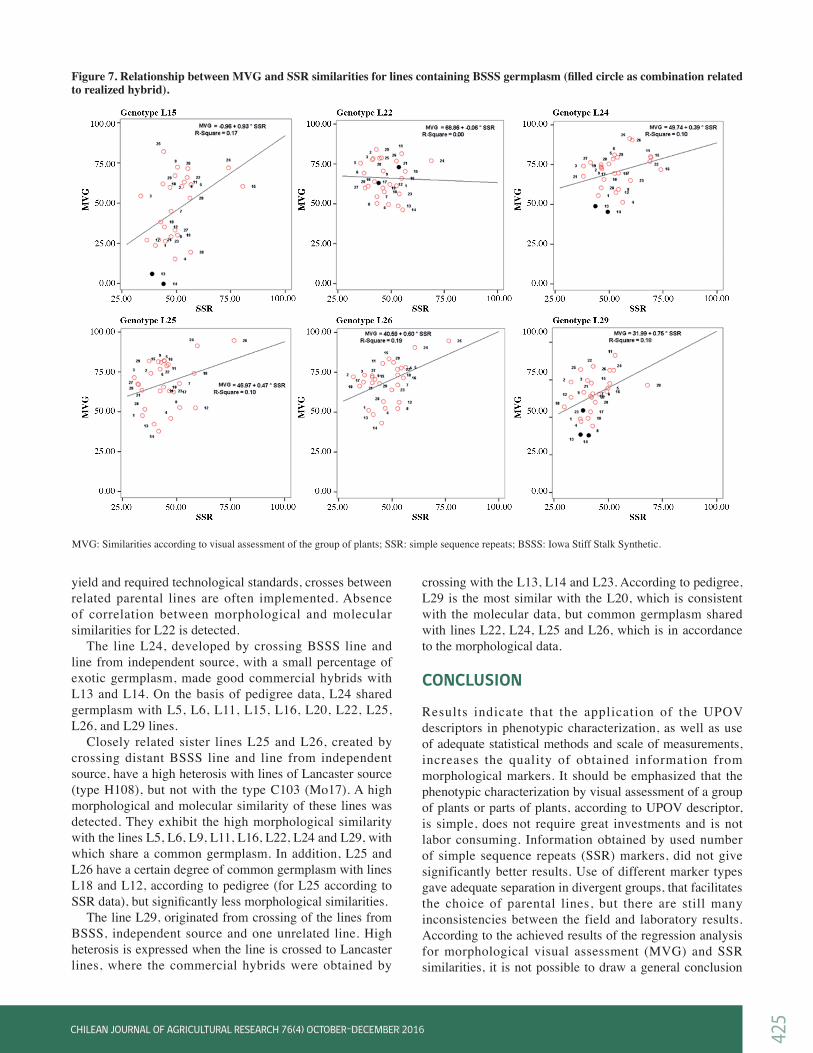
maize line, resulted in the similar diagrams. Consequently, the only distinctive diagrams, where a specific pattern for comparison of MVG and SSR similarity was obtained, are presented in Figures 6 and 7. Line L1 (Figure 6) is a short season flint inbred and according to its phenotype, it is significantly different from other inbreds that are mainly dents or are dent-like. It can be noticed that L1 exhibited significantly greater range of morphological than molecular similarity with other tested lines. In two commercial hybrids created by crossing L1×L2 and L1×L5 (filled circles in Figure 6), similarity revealed with SSR was notably lower than similarity detected by MVG. On the contrary, a greater range of molecular versus morphological similarities was detected in line L2.
Line L4 originating from an independent source, showed the absence of correlation (R2 = 0) between morphological and molecular similarities. Based on pedigree data (data not shown), line L4 was expected to exhibit heterosis with lines from Lancaster germplasm (type H108), such as lines L13 and L14, but this is not confirmed in practice (although the highest morphological similarity between them was found). Although the line L4 has good agronomic performances per se, appropriate opposing pair in the crosses, based on origin, was not found. Line L6, containing independent and BSSS germplasm, gave commercial hybrids with L13, L14 and L23. Line L6 showed the highest similarity with L5, according to molecular marker data, which is in agreement with pedigree information. The highest similarity based on morphological marker data was detected with L7, also related according to pedigree. The line L9 itself, and in sister cross with L10 (high molecular and phenotypic similarity), gave commercial hybrids when crossed to lines L13, L14 and L23. High distance according to morphological marker data was detected among the line L9 and mentioned lines. Line L13 of Lancaster origin (type H108) is one of the most used testers in MRIZP breeding programs, and in combination with lines L9, L10, L11, L12, L16, L24, L29 produced hybrids which have been realized on the national catalogue list. Although a greater number of opposite parental lines that shows great morphological distances is allocated in the lower part of the graph, line L13 also derived a good hybrid in crossing with L12, with which does not exhibit a high morphological distance. In three-
Table 4. Proportion of inertia (“variability”) of different types of markers, covered with the correspondence analysis first three axis.
MVG: Similarities according to visual assessment of the group of plants; MVG+MMS: similarities according to combining data of visual assessment of the group of plants and single measurement of individual plants or part of plants; SSR: similarities according to simple sequence repeats (SSR) markers.
Axis1 MVG 70.9 70.9 MVG+MMS 34.1 34.1 SSR 19.9 19.92 MVG 12.5 83.4 MVG+MMS 25.7 59.7 SSR 14.8 34.73 MVG 5.7 89.2
MVG+MMS 13.8 73.5 SSR 13.3 47.9
Type of data Accounted for CumulativeProportion of inertia
424
CHILEAN JOURNAL OF AGRICULTURAL RESEARCH 76(1) JANUARY-MARCH 2016CHILEAN JOURNAL OF AGRICULTURAL RESEARCH 76(4) OCTOBER-DECEMBER 2016
way cross with (L10×L9), line L13 creates hybrid with good performances, as well. High molecular and phenotypic similarity is detected with the sister line L14, which is in accordance with the pedigree.
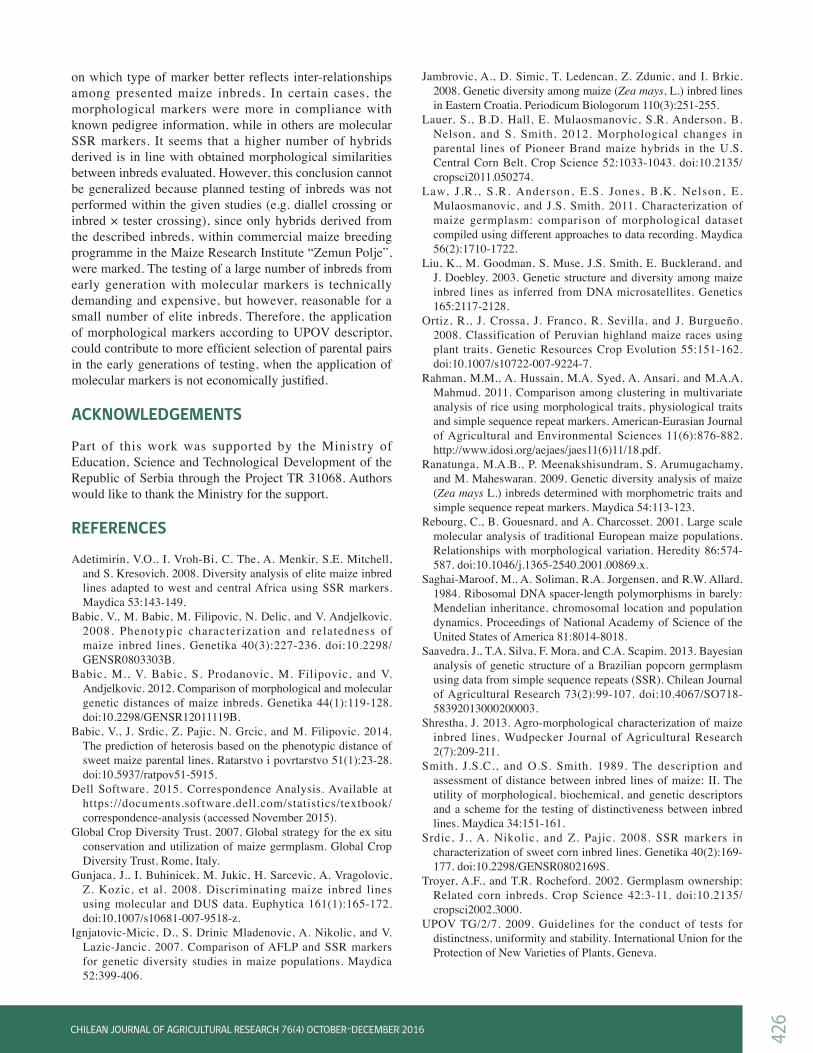
Figure 7 shows relationship between lines containing BSSS germplasm. The line L16, developed by crossing line from BSSS sources and two lines from independent sources, with a small percentage of exotic germplasm, expressed high heterosis with lines from Lancaster group (type H108). In combinations with lines L13 and L14, creates realized hybrids. Germplasm L16 has certain common percentage with lines L9, L15, L24, L25 and L26. This example shows that similar values of morphological similarities for lines L9, L26 and L24 (72.3, 71.5, and 71.9, respectively), give different values of molecular similarity (50.6, 55.3, and 74.0, respectively). The largest molecular similarity for L16 was calculated with L15, and the largest morphological similarity with line L25. It is difficult to conclude, due to the lack of precise pedigree data, which similarities reflect the genetic relationships of these lines to a greater extent. Obviously, a small part of common germplasm may/or may not lead to great phenotypic similarity. Special difficulties arise when choosing the pairs of parental lines within a relatively narrow genetic base, for example in popcorn, sweet maize or in white grain maize (Saavedra et al., 2013; Babic et al., 2014). The white grain line L22, developed by crossing the unrelated white line and white line from BSSS group, with lines L21 and L17 gave realized hybrids. In the breeding of specialty maize, because of the necessity to achieve, simultaneously, high
Figure 5. Regression diagram for MVG and SSR similarity of maize inbred lines.
Figure 6. Relationship between MVG and SSR similarity for non-BSSS lines (with the exception of L6 as partially BSSS; filled circle as combination related to realized hybrid).
MVG: Similarities according to visual assessment of the group of plants; SSR: similarities according to simple sequence repeats (SSR) markers.
MVG: Similarities according to visual assessment of the group of plants; SSR: simple sequence repeats; BSSS: Iowa Stiff Stalk Synthetic.
425
CHILEAN JOURNAL OF AGRICULTURAL RESEARCH 76(1) JANUARY-MARCH 2016CHILEAN JOURNAL OF AGRICULTURAL RESEARCH 76(4) OCTOBER-DECEMBER 2016
yield and required technological standards, crosses between related parental lines are often implemented. Absence of correlation between morphological and molecular similarities for L22 is detected. The line L24, developed by crossing BSSS line and line from independent source, with a small percentage of exotic germplasm, made good commercial hybrids with L13 and L14. On the basis of pedigree data, L24 shared germplasm with L5, L6, L11, L15, L16, L20, L22, L25, L26, and L29 lines. Closely related sister lines L25 and L26, created by crossing distant BSSS line and line from independent source, have a high heterosis with lines of Lancaster source (type H108), but not with the type C103 (Mo17). A high morphological and molecular similarity of these lines was detected. They exhibit the high morphological similarity with the lines L5, L6, L9, L11, L16, L22, L24 and L29, with which share a common germplasm. In addition, L25 and L26 have a certain degree of common germplasm with lines L18 and L12, according to pedigree (for L25 according to SSR data), but significantly less morphological similarities. The line L29, originated from crossing of the lines from BSSS, independent source and one unrelated line. High heterosis is expressed when the line is crossed to Lancaster lines, where the commercial hybrids were obtained by
crossing with the L13, L14 and L23. According to pedigree, L29 is the most similar with the L20, which is consistent with the molecular data, but common germplasm shared with lines L22, L24, L25 and L26, which is in accordance to the morphological data.
CONCLUSION
Results indicate that the application of the UPOV descriptors in phenotypic characterization, as well as use of adequate statistical methods and scale of measurements, increases the quality of obtained information from morphological markers. It should be emphasized that the phenotypic characterization by visual assessment of a group of plants or parts of plants, according to UPOV descriptor, is simple, does not require great investments and is not labor consuming. Information obtained by used number of simple sequence repeats (SSR) markers, did not give significantly better results. Use of different marker types gave adequate separation in divergent groups, that facilitates the choice of parental lines, but there are still many inconsistencies between the field and laboratory results. According to the achieved results of the regression analysis for morphological visual assessment (MVG) and SSR similarities, it is not possible to draw a general conclusion
Figure 7. Relationship between MVG and SSR similarities for lines containing BSSS germplasm (filled circle as combination related to realized hybrid).
MVG: Similarities according to visual assessment of the group of plants; SSR: simple sequence repeats; BSSS: Iowa Stiff Stalk Synthetic.
426
CHILEAN JOURNAL OF AGRICULTURAL RESEARCH 76(1) JANUARY-MARCH 2016CHILEAN JOURNAL OF AGRICULTURAL RESEARCH 76(4) OCTOBER-DECEMBER 2016
on which type of marker better reflects inter-relationships among presented maize inbreds. In certain cases, the morphological markers were more in compliance with known pedigree information, while in others are molecular SSR markers. It seems that a higher number of hybrids derived is in line with obtained morphological similarities between inbreds evaluated. However, this conclusion cannot be generalized because planned testing of inbreds was not performed within the given studies (e.g. diallel crossing or inbred × tester crossing), since only hybrids derived from the described inbreds, within commercial maize breeding programme in the Maize Research Institute “Zemun Polje”, were marked. The testing of a large number of inbreds from early generation with molecular markers is technically demanding and expensive, but however, reasonable for a small number of elite inbreds. Therefore, the application of morphological markers according to UPOV descriptor, could contribute to more efficient selection of parental pairs in the early generations of testing, when the application of molecular markers is not economically justified.
ACKNOWLEDGEMENTS
Part of this work was supported by the Ministry of Education, Science and Technological Development of the Republic of Serbia through the Project TR 31068. Authors would like to thank the Ministry for the support.
REFERENCES
Adetimirin, V.O., I. Vroh-Bi, C. The, A. Menkir, S.E. Mitchell, and S. Kresovich. 2008. Diversity analysis of elite maize inbred lines adapted to west and central Africa using SSR markers. Maydica 53:143-149.
Babic, V., M. Babic, M. Filipovic, N. Delic, and V. Andjelkovic. 2008. Phenotypic characterization and relatedness of maize inbred lines. Genetika 40(3):227-236. doi:10.2298/GENSR0803303B.
Babic, M., V. Babic, S. Prodanovic, M. Filipovic, and V. Andjelkovic. 2012. Comparison of morphological and molecular genetic distances of maize inbreds. Genetika 44(1):119-128. doi:10.2298/GENSR12011119B.
Babic, V., J. Srdic, Z. Pajic, N. Grcic, and M. Filipovic. 2014. The prediction of heterosis based on the phenotypic distance of sweet maize parental lines. Ratarstvo i povrtarstvo 51(1):23-28. doi:10.5937/ratpov51-5915.
Dell Software. 2015. Correspondence Analysis. Available at https://documents.software.dell.com/statistics/textbook/correspondence-analysis (accessed November 2015).
Global Crop Diversity Trust. 2007. Global strategy for the ex situ conservation and utilization of maize germplasm. Global Crop Diversity Trust, Rome, Italy.
Gunjaca, J., I. Buhinicek, M. Jukic, H. Sarcevic, A. Vragolovic, Z. Kozic, et al. 2008. Discriminating maize inbred lines using molecular and DUS data. Euphytica 161(1):165-172. doi:10.1007/s10681-007-9518-z.
Ignjatovic-Micic, D., S. Drinic Mladenovic, A. Nikolic, and V. Lazic-Jancic. 2007. Comparison of AFLP and SSR markers for genetic diversity studies in maize populations. Maydica 52:399-406.
Jambrovic, A., D. Simic, T. Ledencan, Z. Zdunic, and I. Brkic. 2008. Genetic diversity among maize (Zea mays, L.) inbred lines in Eastern Croatia. Periodicum Biologorum 110(3):251-255.
Lauer, S., B.D. Hall, E. Mulaosmanovic, S.R. Anderson, B. Nelson, and S. Smith. 2012. Morphological changes in parental lines of Pioneer Brand maize hybrids in the U.S. Central Corn Belt. Crop Science 52:1033-1043. doi:10.2135/cropsci2011.050274.
Law, J.R., S.R. Anderson, E.S. Jones, B.K. Nelson, E. Mulaosmanovic, and J.S. Smith. 2011. Characterization of maize germplasm: comparison of morphological dataset compiled using different approaches to data recording. Maydica 56(2):1710-1722.
Liu, K., M. Goodman, S. Muse, J.S. Smith, E. Bucklerand, and J. Doebley. 2003. Genetic structure and diversity among maize inbred lines as inferred from DNA microsatellites. Genetics 165:2117-2128.
Ortiz, R., J. Crossa, J. Franco, R. Sevilla, and J. Burgueño. 2008. Classification of Peruvian highland maize races using plant traits. Genetic Resources Crop Evolution 55:151-162. doi:10.1007/s10722-007-9224-7.
Rahman, M.M., A. Hussain, M.A. Syed, A. Ansari, and M.A.A. Mahmud. 2011. Comparison among clustering in multivariate analysis of rice using morphological traits, physiological traits and simple sequence repeat markers. American-Eurasian Journal of Agricultural and Environmental Sciences 11(6):876-882. http://www.idosi.org/aejaes/jaes11(6)11/18.pdf.
Ranatunga, M.A.B., P. Meenakshisundram, S. Arumugachamy, and M. Maheswaran. 2009. Genetic diversity analysis of maize (Zea mays L.) inbreds determined with morphometric traits and simple sequence repeat markers. Maydica 54:113-123.
Rebourg, C., B. Gouesnard, and A. Charcosset. 2001. Large scale molecular analysis of traditional European maize populations. Relationships with morphological variation. Heredity 86:574-587. doi:10.1046/j.1365-2540.2001.00869.x.
Saghai-Maroof, M., A. Soliman, R.A. Jorgensen, and R.W. Allard. 1984. Ribosomal DNA spacer-length polymorphisms in barely: Mendelian inheritance, chromosomal location and population dynamics. Proceedings of National Academy of Science of the United States of America 81:8014-8018.
Saavedra, J., T.A. Silva, F. Mora, and C.A. Scapim. 2013. Bayesian analysis of genetic structure of a Brazilian popcorn germplasm using data from simple sequence repeats (SSR). Chilean Journal of Agricultural Research 73(2):99-107. doi:10.4067/SO718-58392013000200003.
Shrestha, J. 2013. Agro-morphological characterization of maize inbred lines. Wudpecker Journal of Agricultural Research 2(7):209-211.
Smith, J.S.C., and O.S. Smith. 1989. The description and assessment of distance between inbred lines of maize: II. The utility of morphological, biochemical, and genetic descriptors and a scheme for the testing of distinctiveness between inbred lines. Maydica 34:151-161.
Srdic, J., A. Nikolic, and Z. Pajic. 2008. SSR markers in characterization of sweet corn inbred lines. Genetika 40(2):169-177. doi:10.2298/GENSR0802169S.
Troyer, A.F., and T.R. Rocheford. 2002. Germplasm ownership: Related corn inbreds. Crop Science 42:3-11. doi:10.2135/cropsci2002.3000.
UPOV TG/2/7. 2009. Guidelines for the conduct of tests for distinctness, uniformity and stability. International Union for the Protection of New Varieties of Plants, Geneva.


![Phenotyping of Hybrid Maize (Zea mays L.) at Seedling ...Oriza sativa), and maize (Zea mays), which provide over 50% of human calo-ries, are predicted to decrease [4]. It provides](https://img.pdfslide.net/doc/110x75/5ea6c60aa3205b46545f968a/phenotyping-of-hybrid-maize-zea-mays-l-at-seedling-oriza-sativa-and-maize.jpg)