Embed Size (px)
Citation preview

Prepared for:
Beaverhead Conservation District
Beaverhead Watershed Committed
420 Barrett Street
Dillon, MT 59715
Upper Beaverhead
Preliminary Flushing Flow Plan
Draft Report
March 6, 2014
Prepared by:
Applied Geomorphology, Inc.
211 N Grand Ave, Suite C
Bozeman, MT 59715
406-587-6352
Beaverhead Conservation District
Beaverhead Watershed Committed
Upper Beaverhead Sediment Project
Preliminary Flushing Flow Plan
--DRAFT--
Draft Report
March 6, 2014
Applied Geomorphology, Inc.
Sediment Project
Preliminary Flushing Flow Plan
Beaverhead Sediment Project Page | ii
Applied Geomorphology February 2014
B e a v e r h e a d S e d i m e n t P r o j e c t P a g e | i
Applied Geomorphology February 2014
Contents 1 Introduction .......................................................................................................................................... 3
2 Report Review ....................................................................................................................................... 6
2.1 BOR Flushing Flow Studies ............................................................................................................ 6
2.2 Clark Canyon Creek Sediment Reduction Project ......................................................................... 7
2.3 Beaverhead TMDL ......................................................................................................................... 9
3 Flushing Flow Plan .............................................................................................................................. 11
3.1 Defining a Sediment Event .......................................................................................................... 11
3.1.1 Clark Canyon Peak Flow Record .......................................................................................... 11
3.1.1 Relating Clark Canyon Creek Flows to Beaverhead Flows .................................................. 11
3.1.2 Relating Peak Flow Events to Precipitation ........................................................................ 16
3.2 Flushing Flow Criteria .................................................................................................................. 17
3.2.1 Total Available Flushing Flow Volume ................................................................................ 17
3.2.2 Peak Discharge .................................................................................................................... 17
3.2.3 Peak Discharge Duration ..................................................................................................... 17
3.2.4 Rising and Falling Limb Criteria ........................................................................................... 18
3.3 Timing of Flushing Flows ............................................................................................................. 21
4 Example Flushing Flow Hydrographs .................................................................................................. 22
5 A Combined Alternative: Feasibility and Recommended Timelines .................................................. 25
6 Monitoring Effectiveness .................................................................................................................... 27
7 Flushing Flow MOU ............................................................................................................................. 28
8 References .......................................................................................................................................... 29
9 Appendix A: Selected Spring Hydrographs ........................................................................................ 30
10 Appendix B: Flushing Flow Tables ...................................................................................................... 36
List of Figures Figure 1. Location Map, Clark Canyon Reservoir and Clark Canyon Creek Watershed (Allied Engineering,
2013). ............................................................................................................................................................ 3
Figure 2. View upstream showing Clark Canyon Creek fine sediment contributions from left of photo;
Beaverhead Watershed Committee (Allied Engineering, 2013). .................................................................. 4
Figure 3. Discharges necessary to mobilize the D90 particle size at selected cross sections (BOR, 2013). 7
Figure 4. Conceptual layout of a settling pond near the outlet of the East Fork Clark Canyon Creek (Allied
Engineering, 2013). ...................................................................................................................................... 9
Figure 5. Peak discharge record, Clark Canyon Creek (USGS 06015430)................................................... 12
Figure 6. Gage locations in the project area (Allied, 2013); reservoir releases are also recorded by BOR.
.................................................................................................................................................................... 12

Beaverhead Sediment Project Page | ii
Applied Geomorphology February 2014
Figure 7. Peak annual discharge on Clark Canyon Creek (red solid line) showing reservoir releases on
same day (blue solid line); black circles identify conditions where Clark Canyon flows exceeded 30cfs and
releases were less than 100cfs on same day. ............................................................................................. 13
Figure 8. Spring hydrographs from 2009 showing annual peak Clark Canyon Creek discharge in mid-June.
.................................................................................................................................................................... 16
Figure 9. Mean monthly discharge and suspended sediment concentrations on the Mfolozi River, South
Africa (Grenfell and Ellery, 2009). ............................................................................................................... 19
Figure 10. Mean hourly hydrograph and suspended sediment concentrations (mg/l) for Wedding of the
Waters, Bighorn River, Wyoming, March 28-30, 1994 (Wiley, et al, 1995). ............................................... 20
Figure 11. Mean hourly hydrograph and suspended sediment concentrations (mg/l) for the Mills Main
Channel, Bighorn River, Wyoming, March 28-30, 1994 (Wiley et al, 1995). .............................................. 20
Figure 12. Flushing flow hydrograph scenario with 100cfs base flows from Clark Canyon Dam. ............. 23
Figure 13. Flushing flow hydrograph scenario with 100cfs base flows from Clark Canyon Dam. .............. 23
Figure 14. Proposed hourly hydrograph with cumulative acre feet for proposed test flow, Bighorn River
(Wiley et al, 1995). ...................................................................................................................................... 24
List of Tables Table 1. Sediment Source Assessment, Allocations and TMDL for Clark Canyon Creek (MTDEQ, 2012). . 10
Table 2. Flow relationships between Clark Canyon Creek and Beaverhead River with potential sediment
events highlighted. ...................................................................................................................................... 14
Table 3. Summary of Allied (2013) modeling results showing modeled peak Clark Canyon Creek outflows
(HEC-HMS) for given storm events. ............................................................................................................ 16
Table 4. Flushing Flow Criteria for Developing Hydrographs ..................................................................... 22
Table 5. Flushing flow prescription for a 100 cfs dam release baseflow. .................................................. 36
Table 6. Flushing flow prescription for a 25 cfs dam release baseflow. .................................................... 40

B e a v e r h e a d F l u s h i n g F l o w s P a g e | 3
Applied Geomorphology February 2014
1 Introduction This document summarizes the development of a preliminary flushing flow plan for the Beaverhead
River at Clark Canyon Dam near Dillon, Montana. The need for a flushing flow from Clark Canyon Dam
stems from problematic “sediment events” originating from Clark Canyon Creek, a tributary that enters
the Beaverhead River approximately 1.5 miles downstream of the dam (Figure 1). When Clark Canyon
Creek experiences a significant runoff event, it delivers large quantities of fine sediment to the
Beaverhead River. If Beaverhead streamflows are low, the sediment is not effectively flushed
downstream, which results in fine sediment deposition that has been associated with impacts to
spawning habitat, macroinvertebrate populations, and significantly reduced trout populations (Figure 2).
Figure 1. Location Map, Clark Canyon Reservoir and Clark Canyon Creek Watershed (Allied Engineering,
2013).

B e a v e r h e a d F l u s h i n g F l o w s P a g e | 4
Applied Geomorphology February 2014
Figure 2. View upstream showing Clark Canyon Creek fine sediment contributions from left of photo;
Beaverhead Watershed Committee (Allied Engineering, 2013).
The consequences of a sediment event and associated fisheries impacts on the Beaverhead are not
trivial. Immediately downstream of Clark Canyon dam, the Beaverhead River hosts some of the highest
fish abundances and sizes in the state of Montana relative to its size (M. Jaeger, pers comm.). Fish
abundances of approximately 2,000 to 3,000 trout per mile are estimated below the dam. The river
supports over forty thousand angler days per year, and almost $6 million per year is estimated to be
spent annually by Beaverhead River anglers in Beaverhead County.
Sediment events on the Beaverhead River have likely increased in frequency since the construction of
Clark Canyon Dam. As the reservoir is currently managed primarily in support of irrigation, the natural
hydrograph has been altered to store water during winter and spring, and then release that water later
during the irrigation season (Allied Engineering, 2013). Beaverhead River flows in winter and spring are
consequently suppressed, which has increased the potential for sediment events to occur before the
irrigation season which typically starts in early June.
The Beaverhead River fishery is also affected by overwintering flow releases from the reservoir, however
that issue is not addressed here.
Efforts to address sediment loading from Clark Canyon Creek have focused reducing sediment sourcing
in the Clark Canyon Creek watershed, trapping sediment before it reaches the Beaverhead River, and
maintaining sufficient sediment transport capacities in the Beaverhead River should a sediment event
occur. The sediment transport capacity issue is being addressed through the development of a “flushing
flow”, or a strategically-developed hydrograph that can be released from Clark Canyon Dam to minimize

B e a v e r h e a d F l u s h i n g F l o w s P a g e | 5
Applied Geomorphology February 2014
fisheries impacts of a sediment event. This flushing flow has been evaluated by the US Bureau of
Reclamation, which has released two reports with recommendations (BOR 2010; BOR, 2013).
Additionally, source area sediment management strategies have been described in several previous
efforts, including Total Maximum Daily Load (TMDL) assessments (MTDEQ, 2012), and a sediment
management alternatives report (Allied Engineering, 2013).
The intent of this document is to present recommendations for a flushing flow hydrograph on the
Beaverhead River, and to provide additional recommendations to integrate the flushing flow strategy
with previously described sediment control methods for the Clark Canyon Creek watershed.
This project encompasses three primary tasks:
1. Review previous flushing flow and sediment management reports.
2. Develop a Flushing Flow Plan to be used by the Bureau of Reclamation, Montana Fish
Wildlife and Parks, and the Clark Canyon Joint Board of Irrigation.
3. Assess feasibility, benefits, limitations, and overall effectiveness of implementing both
sediment management and flushing flow alternatives independently or synchronously.
B e a v e r h e a d F l u s h i n g F l o w s P a g e | 6
Applied Geomorphology February 2014
2 Report Review The following section contains a general summary of documents relevant to the flushing flow plan
development, including results of two individual hydraulics/sediment transport analyses performed by
the Bureau of Reclamation (BOR, 2010; BOR, 2013), a Clark Canyon Creek Sediment Reduction
Alternatives report by Allied Engineering, Inc. (Allied Engineering, 2013), and a TMDL-driven sediment
source assessment completed by Montana DEQ.
2.1 BOR Flushing Flow Studies
Two flushing flow studies have been released by the Bureau of Reclamation. They are both based on a
hydraulic analysis of the Beaverhead River below Clark Canyon Dam, and an assessment of sediment
transport capacity under a range of flows relative to pebble count sediment gradation data. The general
objective of each effort is to define a critical discharge at which point transport will be initiated for a
given grain size. Each of the reports provides a recommended flushing flow for the Beaverhead River;
the 2010 report recommends a 350 cfs flushing flow, and the 2013 report recommends 600cfs.
In reviewing the two BOR documents, it is apparent that the 2013 had more detailed topographic data
available for the hydraulic model, more recent substrate data that reflected coarsening following the
2011 flood event, and a more rigorous requirement for flushing flow criteria (mobilization of the D90*
particle size versus the D50* particle size). All of these issues combine to result in an almost doubling of
the recommended flushing flow.
In the first study (BOR, 2010), the BOR concluded that the D50 of approximately 20mm would mobilize
at 350 cfs. Using the Meyer-Peter-Mueller sediment transport equation, they concluded that 200 cfs
would mobilize a 15-17mm particle size, and then suggested that the D90 of 39mm would move at
relatively low flows as well. There is no clear documentation as to the flows required to mobilize the
D90 particle size, however 350cfs was presented as an appropriate flushing flow.
In the second report, the BOR utilized better topographic data for the hydraulic model and the Parker
sediment transport equation. The approach assumed that in order to flush fine sediment of less than 1
mm from the interstitial spaces of a gravel bed river, the discharge needs to be high enough to just
mobilize the largest gravel or cobble size based on other studies (Kondolf et al 1996). To that end, BOR
used the D90 as the critical grain size for initiation of movement. The conclusion was that at most
pebble count locations, 600 cfs would mobilize the D90 and thus allow interstitial fine sediment to be
flushed downstream (Figure 3).
*Note: the “D90” is the grain size measured at a pebble count site of which 90% of the measured particles are
finer. The D100 is the maximum grain size measured, and the D50 is the median value. Thus the D90 represents
the coarse component of the overall sediment gradation.

B e a v e r h e a d F l u s h i n g F l o w s P a g e | 7
Applied Geomorphology February 2014
Figure 3. Discharges necessary to mobilize the D90 particle size at selected cross sections (BOR, 2013).
As described later in this document, the original BOR flushing flow recommendation of 350 cfs is
typically exceeded on the Beaverhead during Clark Canyon Creek runoff events, indicating that 350cfs is
probably not sufficient to consistently flush fine sediment. Based on an evaluation of the technical
approach, input data quality, and results of both reports, the revised flushing flow of 600 cfs
recommended most recently by BOR has been used in the development of a preliminary flushing flow
plan in this document. It is important to note that the original 350 cfs value has been used as a
recommended flushing flow in other reports, such as the Montana Department of Environmental
Quality TMDL water quality protection plan. These recommendations were made prior to the release of
the 2013 BOR study.
2.2 Clark Canyon Creek Sediment Reduction Project
In January of 2013, Allied Engineering Inc. (Allied) released a report entitled “Final Technical Report:
Clark Canyon Creek Sediment Reduction Project” (Allied Engineering, 2013). The purpose of this report
was to develop and evaluate several alternatives to reduce or manage sediment loading from Clark
Canyon Creek into the Beaverhead River.

B e a v e r h e a d F l u s h i n g F l o w s P a g e | 8
Applied Geomorphology February 2014
Allied looked at five alternatives to mitigate sediment delivery to the Beaverhead including a settling
pond, water spreading, flushing flows on the Beaverhead, irrigation practice modifications, and check
dams. The only alternative selected for further consideration was on on-stream settling pond on the
lowermost reach of East Fork Clark Canyon Creek, just upstream of its confluence with the main fork
(Figure 4). The estimated cost to construct a single on-stream storage/settling pond was approximately
$11,000 per acre-foot of storage.
Primary results of this effort include the following:
1. Sediment production in Clark Canyon watershed is primarily from the East Fork Clark Canyon
Creek and most likely reflects natural inputs with minimal anthropogenic contributions.
2. Estimated hillslope sediment contributions from the Clark Canon Creek watershed are 146
tons per year, which is estimated at an average of about 137 cubic yards per year delivered
to the Beaverhead River.
3. Estimated runoff volumes for the 5-year and 25-year storm events (precipitation) are 20
acre-feet and 50 acre feet. These events produce discharges in the creek on the order of
82cfs and 235cfs, respectively.
4. The offending sediment is silt characterized as silt with a particle size greater than 0.01mm.
Results of the Allied report indicate that problem sediment sourced in the Canyon Creek watershed is
largely silt, which is large enough to gravitationally settle out in a detention basin. Allied also indicates
that the construction of a settling pond that has a storage volume of 19 acre-feet would store the runoff
from the estimated 5-year storm event. A 49 acre-foot settling pond would impound estimated excess
runoff from East Fork Clark Canyon Creek up to a 25-year storm event. The excess runoff from a 5-year
storm event is estimated to result in a Clark Canyon Creek discharge of 82cfs, and a 25-year storm
results in a 235cfs streamflow. Anything over the 5-year storm event is thus quite capable of creating a
sediment event on the Beaverhead River, as described in Section 3.1.

B e a v e r h e a d F l u s h i n g F l o w s P a g e | 9
Applied Geomorphology February 2014
Figure 4. Conceptual layout of a settling pond near the outlet of the East Fork Clark Canyon Creek (Allied
Engineering, 2013).
To further refine the alternatives analysis, Allied recommended the following:
1. Better characterize problematic sediment deposits in the Beaverhead;
2. Evaluate the feasibility of a settling pond with a minimum storage volume of 19 acre-feet
and maximum storage volume of approximately 49 acre-feet; and,
3. Perform a site evaluation to further explore the potential of using check dams to address
gully erosion.
2.3 Beaverhead TMDL
The TMDL development for the Beaverhead Planning area describes the need for a flushing flow on the
Beaverhead River below Clark Canyon dam to flush fine sediment delivered by Clark Canyon Creek
(MTDEQ, 2012). The recommended flushing flow is 350cfs, taken from the 2010 BOR report.
B e a v e r h e a d F l u s h i n g F l o w s P a g e | 10
Applied Geomorphology February 2014
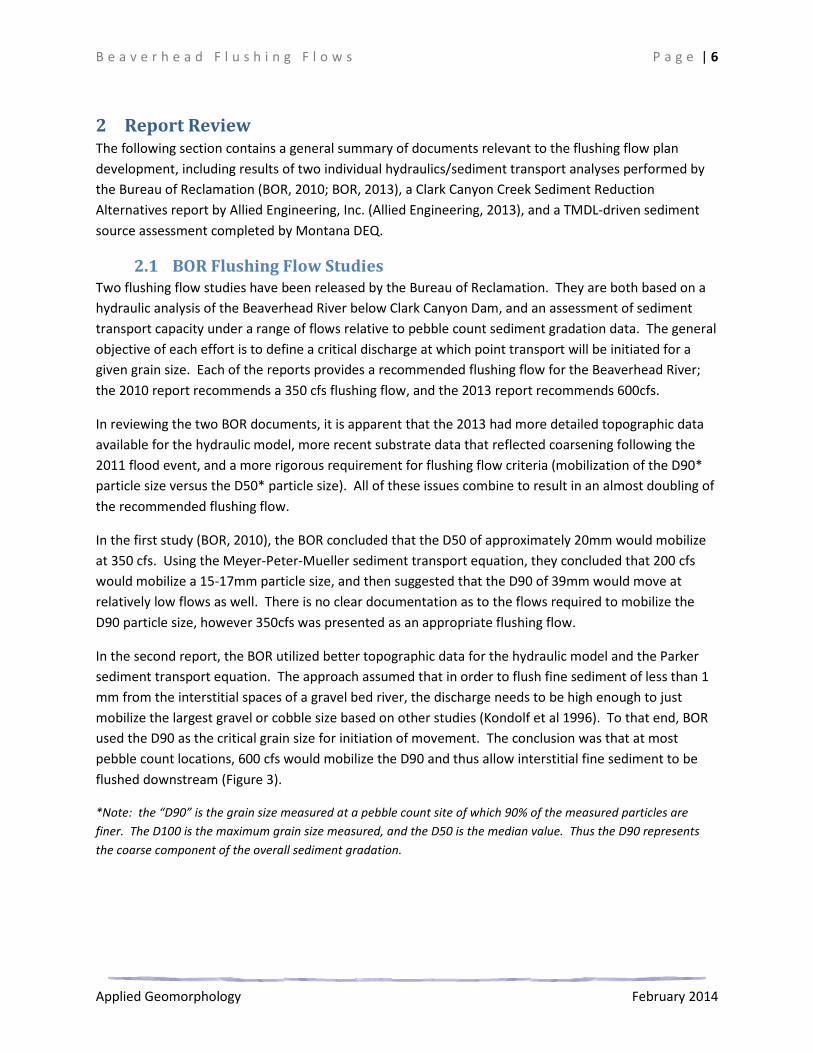
Whereas previous reports have indicated that most of the sediment sourced from the Clark Canyon
Creek watershed is derived from hillslope and gully erosion, the results of the TMDL sediment source
assessment conclude that 88% of the total sediment load is from bank erosion, and furthermore, 80% of
that sediment is anthropogenically influenced by factors such as riparian grazing (Table 1). The TMDL
document approximates that over 1,000 tons of sediment is sourced annually from eroding banks in the
watershed. The TMDL issued for Clark Canyon Creek prescribes a 59% reduction in total sediment
loading from the watershed, with reduced sediment input from roads, streambanks, and upland erosion.
The total sediment load estimated from Clark Canyon Creek estimated in the TMDL is 1,230 tons per
year. This equates to over 1,100 cubic yards of sediment delivered to the Beaverhead River on an
annual basis, or approximately 0.7 acre-feet of sediment per year. In the event that a settling basin
option is pursued, the discrepancy in estimated sediment delivery volumes will have to be considered in
assessing how often the pond will have to be cleaned out.
Table 1. Sediment Source Assessment, Allocations and TMDL for Clark Canyon Creek (MTDEQ, 2012).

B e a v e r h e a d F l u s h i n g F l o w s P a g e | 11
Applied Geomorphology February 2014
3 Flushing Flow Plan The following section describes the development of a flushing flow plan to address sediment events on
the Beaverhead River below Clark Canyon Dam. This includes a discussion of what constitutes a
sediment event, the identification of specific criteria for the flushing flow, and the presentation of
scenario-based flushing flow hydrographs.
3.1 Defining a Sediment Event
Thus far, characterizations of sediment events on the Beaverhead River have been based on observed
relationships between Clark Canyon runoff events, sediment deposition in the Beaverhead River, and
reduced fish abundances below Clark Canyon Dam. These events have occurred when flow in the
Beaverhead River is relatively low. Although the reduced fish abundances following an event have been
quantified, there has been no similar quantitative characterization of the size of the storm event to hit
the Clark Canyon Creek watershed, the discharge from the creek, or the discharge of the receiving
Beaverhead River.
Existing information regarding sediment events is limited. In general, the events tend to occur when
discharges from Clark Canyon Creek are relatively high prior to June 1st when Clark Canyon Reservoir
releases are low. Based on reports from FWP, a total of four events occurred between 1974 and 2004,
two of which occurred before June 1. Between 2005 and 2012, five events occurred, two of which
occurred prior to June 1. One of the sediment events occurred in March 2009.
3.1.1 Clark Canyon Peak Flow Record
The USGS gaging station at Clark Canyon Creek (USGS 06015430) has a peak annual discharge record
extending from 1975 to 2012 (Figure 5). The records show that during that timeframe, the highest peak
flow on Clark Canyon Creek occurred on May 17, 1984 when a peak flow of 415cfs was measured. The
second largest event from Clark Canyon occurred on June 8 2011, with an event that measured 315cfs.
Since 1975, a total of 25 annual peak discharges exceeded 30cfs. Since the record only provides one
peak discharge per year, there may have been additional significant runoff events during any given year
that were not recorded because they were less than the maximum peak.
For the purposes of looking at the historic record, a 30cfs Clark Canyon Creek annual peak discharge has
been used here as a fairly conservative minimum flow that might be associated with a sediment event.
3.1.1 Relating Clark Canyon Creek Flows to Beaverhead Flows
Since 1975 there have been a total of 25 events on Clark Canyon Creek that exceeded 30 cfs, however
whether or not these or any other events resulted in a “sediment event” is largely dependent on the
flows in the Beaverhead at the time. To try and identify specific events in the record, the specific dates
of the Clark Fork Canyon peak discharges were compared to the flow released from Clark Canyon
Reservoir on that day (Figure 6). As the USGS gage below the reservoir has been discontinued, the
reservoir release data were obtained from archived BOR records (http://www.usbr.gov/gp/hydromet/).
The results show that since 1975, there were six instances where the Clark Canyon flows exceeded 30cfs
on the same day that Clark Canyon Reservoir releases were less than 100cfs (Figure 7). These years

B e a v e r h e a d F l u s h i n g F l o w s P a g e | 12
Applied Geomorphology February 2014
include 1977, 1990, 1991, 1994, 2005, and 2006. All of these events occurred between mid-March and
mid-May (Figure 7 and Table 2). In each of these years, the discharge from Clark Canyon Creek was
approximately 30% of the flow release from the reservoir or greater.
Figure 5. Peak discharge record, Clark Canyon Creek (USGS 06015430)
Figure 6. Gage locations in the project area (Allied, 2013); reservoir releases are also recorded by BOR.

B e a v e r h e a d F l u s h i n g F l o w s P a g e | 13
Applied Geomorphology February 2014
Figure 7. Peak annual discharge on Clark Canyon Creek (red solid line) showing reservoir releases on same day (blue solid line); black circles identify
conditions where Clark Canyon flows exceeded 30cfs and releases were less than 100cfs on same day.
1
10
100
1000
1975 1980 1985 1990 1995 2000 2005 2010 2015
Dis
cha
rge
(cf
s)
Year
Clark Canyon Creek
Potential "Sediment Events"
Clark Canyon Peak Annual Discharge
Clark Canyon Release
100 cfs
30 cfs
April 9
March 20 May 19 April 22May 17 April 5
Potential
Sediment
Event

B e a v e r h e a d F l u s h i n g F l o w s P a g e | 14
Applied Geomorphology February 2014
Table 2. Flow relationships between Clark Canyon Creek and Beaverhead River with potential sediment
events highlighted.
Year Date Clark Canyon
Peak
Discharge
(cfs)
Return
Interval
(HEC-HMS)
Clark
Canyon
Reservoir
Release (cfs)
Mean Daily Flow
Beaverhead at
Barretts (cfs)
Clark
Canyon/Reservoir
Outflow
1975 6/19/1975 211 10-25 year 375 1340 56%
1976 5/12/1976 147 10-25 year 366 648 40%
1977 4/9/1977 52 2-5 year 100 197 52%
1978 5/20/1978 43 2-5 year 780 925 6%
1979 5/29/1979 36 2-5 year 748 690 5%
1980 5/26/1980 43 2-5 year 314 848 14%
1981 5/27/1981 95 5-10 year 833 1110 11%
1982 5/2/1982 36 2-5 year 350 471 10%
1983 7/9/1983 33 2-5 year 627 668 5%
1984 5/17/1984 415 50-100 year 788 1240 53%
1985 4/10/1985 18 <2 year 215 411 8%
1986 5/27/1986 31 2-5 year 672 828 5%
1987 5/17/1987 39 2-5 year 529 986 7%
1988 4/26/1988 4 <2 year 139 274 3%
1989 3/11/1989 20 2 year 55 135 36%
1990 3/20/1990 35 2-5 year 30 161 117%
1991 5/19/1991 43 2-5 year 78 229 55%
1992 6/16/1992 54 2-5 year 406 717 13%
1993 5/17/1993 41 2-5 year 272 331 15%
1994 4/22/1994 49 2-5 year 105 266 47%
1995 6/6/1995 183 10-25 year 501 1320 37%
1996 4/9/1996 27 2-5 year 500 826 5%
1998 4/24/1998 45 2-5 year 550 686 8%
1999 5/30/1999 29 2-5 year 685 1000 4%
2000 7/19/2000 15 <2 year 966 898 2%
2002 6/4/2002 19 <2 year 412 559 5%
2003 5/28/2003 7 <2 year 553 634 1%
2004 6/11/2004 13 <2 year 373 467 3%
2005 5/17/2005 108 5-10 year 26 229 415%
2006 4/5/2006 58 2-5 year 28 206 207%
2007 6/7/2007 28 2-5 year 296 698 9%
2008 5/22/2008 24 2-5 year 512 703 5%
2009 6/20/2009 150 10-25 year 277 604 54%
2010 6/16/2010 187 10-25 year 485 775 39%
2011 6/8/2011 315 25-50 year 353 791 89%
2012 3/19/2012 72 2-5 year 256 320 28%
Likely Sediment Event

B e a v e r h e a d F l u s h i n g F l o w s P a g e | 15
Applied Geomorphology February 2014
A sediment event was recorded on the Beaverhead River in early spring of 2009, although that year does
not meet the criteria (Figure 7). On June 20th 2009, the annual peak flow recorded on Clark Canyon
Creek was 150cfs. On that same day, the release from Clark Canyon Reservoir was 277cfs, which is
significantly exceeds the minimum criteria of 100cfs. However, a plot of flow hydrographs earlier in the
season shows distinct pulses at the Barretts gage in late March and April when reservoir releases were
around 35cfs (Figure 8). This demonstrates the fact the annual peak flow data for Clark Canyon Creek
likely misses other significant events. Data collection in support of the Beaverhead Flushing Flow Plan
would greatly benefit from upgrades to the gaging station at the mouth of Clark Canyon Creek to record
mean daily flow as well as annual peaks.
Defining the conditions that create a sediment event will help managers anticipate and quickly respond
so as to minimize impacts to the Beaverhead River fishery. This document provides an initial attempt to
define those conditions, but with more information the criteria should be refined. Based on the
available data, the minimum conditions that are considered likely to result in a sediment event are:
1. Flow release from the reservoir of less than 100cfs; and,
2. A greater than 30cfs event on Clark Fork Canyon Creek on the same day.
These criteria identify a total of six likely events since 1975 (Figure 7 and Table 2). It’s interesting to
note that all of these events do not reflect rare floods on Clark Canyon Creek; most are less than a 5-
year event. If the 30cfs minimum discharge for a Clark Canyon Creek event is raised to 50cfs, only three
historic occurrences meet the criteria. Alternatively, if 200cfs is used as the maximum flow threshold
from the reservoir releases, the same 6 events meet the criteria.
This characterization of sediment events will evolve as more information and monitoring results become
available. Appendix A contains a series plots showing the Beaverhead River hydrograph with the Clark
Canyon Creek peak discharge plotted for all years that Clark Canyon Creek experienced a discharge in
excess of 30cfs. The plots show the timing of and magnitude of the Clark Canyon Creek event relative to
Beaverhead flows at both the reservoir and Barretts diversion, and the hydrographs commonly capture
a distinct rise in the Beaverhead flows due to the Clark Canyon Creek inputs. Stakeholders who are
familiar with the history of sediment events can use these plots to see if the six events identified here
are correct, and to identify additional events that will help guide any necessary revisions to the criteria.

B e a v e r h e a d F l u s h i n g F l o w s P a g e | 16
Applied Geomorphology February 2014
Figure 8. Spring hydrographs from 2009 showing annual peak Clark Canyon Creek discharge in mid-June.
3.1.2 Relating Peak Flow Events to Precipitation
The HEC-HMS modeling results for the Clark Canyon watershed (Allied, 2013) can be used to
approximate the magnitude of a rainfall event that would have resulted in a given peak discharge
entering the Beaverhead River. For example, the results of the modeling indicated that a precipitation
event of 2.8 inches (a 50-year storm) over the Clark Canyon Creek watershed would be expected to
create excess runoff that would result in the neighborhood of a 415 cfs peak discharge (Table 3). This
relationship allows the estimation of a precipitation event that would likely be capable of generating a
sediment event on the Beaverhead River. Based on these results, a sediment event can be considered
to be likely any time the Clark Canyon Reservoir Releases are less than 100 cfs and the Clark Canyon
Creek watershed receives anything over approximately 1.6 inches of rain. This ~3-year storm event
produces about a 40cfs discharge. A ~3-year storm frequency indicates that sediment events are likely
to be quite common if Beaverhead River flows are consistently suppressed in the late winter and early
spring months.
Table 3. Summary of Allied (2013) modeling results showing modeled peak Clark Canyon Creek outflows
(HEC-HMS) for given storm events.
Storm Return Interval
(years)
Precipitation
(in)
Peak Discharge HEC-
HMS Model(cfs)
2 1.4 20
5 1.8 82
10 2.0 120
25 2.4 235
50 2.8 411
100 2.9 490
0
200
400
600
800
1000
10-Feb 2-Mar 22-Mar 11-Apr 1-May 21-May 10-Jun 30-Jun 20-Jul
Flo
w (
cfs)
Beaverhead River and Clark Canyon Creek
Spring Flows 2009
2009 Beaverhead Barretts
Clark Cyn Event
Clark Canyon Outflow

B e a v e r h e a d F l u s h i n g F l o w s P a g e | 17
Applied Geomorphology February 2014
3.2 Flushing Flow Criteria
The following section contains criteria used to develop the Flushing Flow Plan. These criteria are based
on the assumption that a sediment event has occurred, and that an MOU is in place for rapid
implementation of a flushing flow release at Clark Canyon Dam. The overall objective is to create a
programmed release of a high-magnitude, short-duration flow event that will initiate bedload transport,
flush interstitial fine sediment, and enhance natural recruitment of salmonids (Wiley et al, 1995).
The development of flushing flow criteria draws heavily from a similar effort on the Bighorn River (Wiley
et al, 1995). That flushing flow plan development was based largely on an assessment of a trial flushing
flow in the Bighorn River in March of 1994. Data obtained from this test release provided information
used to develop a flushing flow magnitude, duration, and timing with goals of scouring pool habitat,
flushing fines from spawning gravel, and inundating seasonal channels. The intent is to develop a
preliminary plan with available information, and then to modify that plan upon monitoring to maximize
its effectiveness on the Beaverhead River.
3.2.1 Total Available Flushing Flow Volume
For the purposes of this preliminary plan, the total amount of water assumed to be available for a
flushing flow is 2,100 acre-feet. This is equal to the amount stored in Clark Canyon Reservoir during the
winter of 2013-2014 for a flushing flow (M. Jaeger, pers. comm.). If the total amount of water available
for a flushing flow changes, the proposed release hydrograph can be modified. To facilitate any
necessary modifications to the release hydrograph, additional criteria regarding the shape of the
flushing flow hydrograph are provided below.
Total Volume Criteria: 2,100 acre feet
3.2.2 Peak Discharge
The criteria for peak flushing flow is a maximum discharge of 600 cfs as prescribed by the BOR flushing
flow study (BOR, 2013). According to that study, a 600cfs flow will mobilize the D90 particle size at most
cross sections, allowing flushing of both surficial and interstitial fine sediment.
Peak Discharge Criteria: 600 cfs
3.2.3 Peak Discharge Duration
The duration of the peak flushing flow refers to the amount of time that the maximum discharge is
sustained. In their work on developing a flushing flow on the Bighorn River, Wiley and others (1995)
provide a literature review of other flushing flow studies. Although the original reports they reference
were not available for review here, these authors describe one flushing flow study on the Yampa River
that concluded that flows approaching the natural peak of the hydrograph for 24-48 hours might be
necessary for the long-term maintenance of a relatively sand-free cobble bed (Obrien, 1987). On a
flushing flow study on the Henry’s Fork of the Snake River, Idaho, Wesche (1994) recommended a peak
flow duration of 9 hours. For the Beaverhead, the 2013 BOR flushing flow study recommended that a
peak flushing flow event be at least 6 hours long (BOR, 2013).

B e a v e r h e a d F l u s h i n g F l o w s P a g e | 18
Applied Geomorphology February 2014
In developing an appropriate flushing flow duration, Wiley and others (1995) considered how far the
fine sediment would travel during the peak flow period. They assumed that the amount of time for the
sediment to travel a given distance is 1.5 times that of the water. Applying that assumption and the
reported hydraulic parameters in the BOR flushing flow study allows an estimation of the distance the
sediment will travel during a flush. The hydraulics modeling output indicates that a typical flow velocity
between Clark Canyon Dam and Barretts diversion dam is 3.7 feet per second at ~700cfs (BOR, 2013).
Thus the water would travel at approximately 2.5 miles per hour, and fine sediment would therefore
travel at 1.7 miles per hour. The distance from the mouth of Clark Canyon Creek to Barretts Diversion
Dam is 13.5 miles, so at a flow velocity of 3.7 feet per second, it would take an estimated 7.9 hours for
the sediment to travel from the mouth of Clark Canyon Creek to Barretts diversion.
Using this logic, Wiley and others (1995) concluded that a nine hour peak flow duration was appropriate
for the Bighorn River flushing flow. Similarly, on the Beaverhead River it appears that if the primary
flushing area extends from Clark Canyon Creek to Barretts diversion, a peak duration of at least eight
hours is appropriate. This will promote that transport of fine sediment downstream of the confluence
of Grasshopper Creek.
Peak Discharge Duration Criteria: Minimum of 8 hours
3.2.4 Rising and Falling Limb Criteria
Transport of suspended sediment typically creates a hysteresis pattern with respect to discharge. That
is, suspended sediment concentrations tend to be highest on the rising limb of hydrograph. This is
apparent during the spring snowmelt in Montana, as early runoff is characterized by the highest
turbidity. Figure 9 shows a graphic example of hysteresis on an annual basis, with suspended sediment
concentrations peaking on a South African River in November, in the early part of the wet season, prior
to the peak in discharge in January (Grenfell and Ellery, 2009).

B e a v e r h e a d F l u s h i n g F l o w s P a g e | 19
Applied Geomorphology February 2014
Figure 9. Mean monthly discharge and suspended sediment concentrations on the Mfolozi River, South
Africa (Grenfell and Ellery, 2009).
Flushing flows were monitoried in the Bighorn study for suspended sediment concentrations at several
locations on the Bighorn River (Wiley et al, 1995). Figure 10 and Figure 11 show the results of the
monitoring at two sites. At the most upstream site (Figure 10) stepped increases in discharge were
associated with suspended sediment concentration spikes immediately following each increase. Further
downstream (Figure 11), the sediment spike was most pronounced only with the first step. Based on
this information and other studies that show hysteresis in suspended sediment transport, the rising limb
and peak portions of the flushing flow hydrograph will likely be the most effective timeframe for
sediment transport. In addition, stepping the hydrograph on the rising limb can result in sequential
sediment flushing events as larger particle sizes are mobilized. Falling limbs can then be used for coarse
sediment sorting and habitat creation.
Based on the results shown in Figure 10 and Figure 11, a stepped ascending limb is recommended for
the flushing flow criteria. This will allow for longer duration flows on the rising limb to mobilize and
transport surficial fine sediment, followed by a shorter, more intensive pulse to mobilize interstitial
sediment. In the event that there is enough water available after the peak, the descending limb could
also include a step at moderate durations to transport the fines further downstream and contribute to
habitat rejuvination.
Rising and Falling Limb Criteria: Stepped rising Limb, falling limb less important, but stepped as flow
volume allows.

B e a v e r h e a d F l u s h i n g F l o w s P a g e | 20
Applied Geomorphology February 2014
Figure 10. Mean hourly hydrograph and suspended sediment concentrations (mg/l) for Wedding of the
Waters, Bighorn River, Wyoming, March 28-30, 1994 (Wiley, et al, 1995).
Figure 11. Mean hourly hydrograph and suspended sediment concentrations (mg/l) for the Mills Main
Channel, Bighorn River, Wyoming, March 28-30, 1994 (Wiley et al, 1995).

B e a v e r h e a d F l u s h i n g F l o w s P a g e | 21
Applied Geomorphology February 2014
3.3 Timing of Flushing Flows
In some instances such as on the Bighorn River, the recommended timing for flushing flows relates
directly to fisheries biology; for example the Bighorn recommendation was for a flushing flow in mid- to
late- March to precede rainbow trout spawning. One interesting additional benefit cited for a March
flushing flow on the Bighorn is a lower water temperature that will increase water density and sediment
transport capacity (Wiley et al, 1995).
In this case, flushing flows will be released in response to an event on Clark Canyon Creek. To that end, it
will be important to develop an adaptive management component of the flushing flow time, to
determine the potential responsiveness of managers to a flushing flow request. In the event that
reservoir releases are going to be increased above 600 cfs shortly after a sediment event for irrigation
purposes, a flushing flow may be unnecessary. If not, a flushing flow immediately following an event
may be most beneficial. However, there may be specific time periods when a flushing flow is
undesirable for other aspects of river function and use such as irrigation, fisheries biology, or recreation
The temporal aspect of the flushing flow criteria will therefore require some collaboration between
stakeholders in the river corridor.
In general, however, it is anticipated that flushing flows will occur between mid-March and mid-May,
when sediment events are most likely to occur (Section 3.1).
Timing Criteria: To be negotiated with stakeholders, but most likely Mid-March through Mid-May.

B e a v e r h e a d F l u s h i n g F l o w s P a g e | 22
Applied Geomorphology February 2014
4 Example Flushing Flow Hydrographs
Table 4 summarizes the flushing flow criteria developed in Section 3.2.
Table 4. Flushing Flow Criteria for Developing Hydrographs
Criteria Value (units)
Total Volume 2100 acre feet
Peak Discharge 600 cfs
Duration of Peak Discharge 8 hours
Rising Limb Stepped
Falling Limb Stepped only if flow volume available allows
Timing Most likely mid-March through mid-May, but to be
negotiated in MOU.
Two example flushing flow hydrographs are presented below that meet the criteria listed in Table 4
(Figure 12 and Figure 13). The variation in the hydrographs is only with regard to the total discharge,
and reflects differences in the Beaverhead River base flows at the time the flushing flow is applied. The
release patterns and timing for both scenarios are exactly the same, and show that whether the
Beaverhead River base flows are 25cfs or 100cfs, the criteria can be met or exceeded. Using a total
flushing flow volume of 2091 acre-feet, the hydrograph includes the following:
1. Steep ramping to 400 cfs to initiate mobilization of surface fines. Eight hours at 400cfs.
2. Gradual ramping over 8 hours to 600 cfs for maximum flushing flow.
3. Twelve hours at 600 cfs flushing flow
4. Reduced flows to 500 cfs for 7 hours to continue flushing sediment downstream and to sort
habitat elements.
5. Reduced flows to 400 cfs for 8 hours for continued sorting.
6. Flow reductions over 9 hours to return to baseflow condition.
Based on the criteria established, the volume of water available allows for a stepped receding limb to
facilitate habitat development with declining flows. This is similar to the proposed hydrograph for the
Bighorn River project (Figure 14; Wiley et al, 1995).
Appendix B contains tabulated hourly flow release rates and resulting Beaverhead River discharges for
the two scenarios.

B e a v e r h e a d F l u s h i n g F l o w s P a g e | 23
Applied Geomorphology February 2014
Figure 12. Flushing flow hydrograph scenario with 100cfs base flows from Clark Canyon Dam.
Figure 13. Flushing flow hydrograph scenario with 100cfs base flows from Clark Canyon Dam.
0
500
1000
1500
2000
2500
0
100
200
300
400
500
600
700
800
0 10 20 30 40 50 60 70 80
Acr
e F
ee
t
Flo
w (
cfs)
Time (Hours)
Beaverhead River
2100 AF Flushing Flow ScenarioAssumes 100 cfs Baseflow and 150cfs Event
Total Beaverhead River Flow (cfs)
Release
Clark Cyn Estimate
Cumulative Flushing Flow Volume (af)
Clark Cyn Event
Total Release: 2,091 AF
0
500
1000
1500
2000
2500
0
100
200
300
400
500
600
700
0 10 20 30 40 50 60 70 80
Acr
e F
ee
t
Flo
w (
cfs)
Time (Hours)
Beaverhead River
2100 AF Flushing Flow ScenarioAssumes 25 cfs Baseflow and 150cfs Event
Total Beaverhead River Flow (cfs)
Release
Clark Cyn Estimate
Cumulative Flushing Flow Volume (af)
Clark Cyn Event
Total Release: 2,091 AF

B e a v e r h e a d F l u s h i n g F l o w s P a g e | 24
Applied Geomorphology February 2014
Figure 14. Proposed hourly hydrograph with cumulative acre feet for proposed test flow, Bighorn River
(Wiley et al, 1995).

B e a v e r h e a d F l u s h i n g F l o w s P a g e | 25
Applied Geomorphology February 2014
5 A Combined Alternative: Feasibility and Recommended Timelines Considering the impact of fine sediment on the Beaverhead River fishery and the results of work
performed to date, adopting an integrated approach to preventing and managing sediment events is
appropriate. Encouraging the implementation of the TMDL water quality management plan and thus
reducing sediment sourcing in the basin will help reduce loading from its source. As these loading and
allocation values are reported in the TMDL document, the Beaverhead Watershed Committee should be
able to pursue 319 funding to apply best management practices to reduce sourcing. According to the
TMDL Plan, the sediment load derived from Clark Canyon Creek could be reduced by 59% with the
implementation of BMPs alone (MTDEQ, 2012). However, it is not clear as to whether the
implementation of BMPs alone will solve the problem of sediment events on the Beaverhead River.
Field observations indicate that hillslope and gully erosion is a major source of fine sediment in Clark
Canyon Creek, and it is not clear as to whether the sediment source assessment effectively captured
these processes. Furthermore, the geology in the watershed consists of erosive volcanic units that are
prone to mass failure and gullying, and these processes can be difficult to arrest by implementing BMPs
such as grazing management alone.
It is my professional judgment that excessive fine sediment sourcing from Clark Canyon Creek that is
capable of creating sediment events on the Beaverhead River will continue even with the concerted
implementation of BMP strategies such as grazing management. As such, a settling pond in the middle
basin area on the lower East Fork confluence appears to be a good means of trapping excessive fine
sediment that continues to be produced.
The third tier of the integrated approach is the release of flushing flows from Clark Canyon Dam during
or shortly following a sediment event. This is an appropriate third component of the management plan,
and as described in previous sections of this document, appears entirely feasible.
As far as the timing of implementation, the following approach is recommended:
1. The results of the TMDL sediment source assessment indicates that eroding streambanks
are the primary sediment source in the Clark Canyon Creek watershed, and that 80% of that
volume is related to human influences such as grazing land uses. If that is the case, the
implementation of BMPs to reduce that volume should immediately commence.
Implementing BMPs such as grazing exclosures will also facilitate riparian buffer
establishment, which will help trap and store upland-derived sediment in the valley
bottoms.
2. Based on field observations and evaluation of watershed geology, I have concerns that the
implementation of BMPS alone will not reduce sediment loading to the point where
sediment events cease to occur. The volcanic ash-dominated geology, “lollipop” drainage
pattern, extensive gullying, and mass wasting processes in this relatively small watershed
indicate that it is inherently prone to high sediment loads. To that end, I recommend
pursuing the further design and implement of a settling pond in the basin as proposed by

B e a v e r h e a d F l u s h i n g F l o w s P a g e | 26
Applied Geomorphology February 2014
Allied Engineering (Allied, 2013). To maximize longevity and minimize maintenance
requirements at the pond, any areas upstream that were inventoried in the TMDL sediment
source assessment as having high anthropogenic-influenced bank sediment loading rates
should be treated with appropriate BMPs prior to pond construction.
3. Flushing flows from Clark Canyon Dam provide the third component of the sediment
management plan. As these flows are used in a responsive fashion, they will have to be
proactively stored in the reservoir and then released using an adaptive
management/response strategy.

B e a v e r h e a d F l u s h i n g F l o w s P a g e | 27
Applied Geomorphology February 2014
6 Monitoring Effectiveness Monitoring the effectiveness of the overall sediment management plan will be crucial. The following
strategies are recommended for consideration:
1. Install a rain gage in the Clark Canyon Creek watershed to measure precipitation
events;
2. Upgrade the existing stream gage at the mouth of Clark Canyon Creek to measure
mean daily discharge in addition to instantaneous peak flow;
3. Place transects on the Beaverhead River to monitor sedimentation patterns and
habitat conditions before and after an event;
4. Repeat BOR pebble count sampling after events;
5. Carefully document each flushing flow event, measuring discharge, suspended
sediment concentrations, and qualitative aspects of system response.
The criteria for defining an anticipated sediment event (Section 3.1) include a Clark Canyon Creek
discharge in excess of 30cfs Clark Canyon Creek and synchronous reservoir releases of less than 100cfs.
These estimated criteria are based purely on an evaluation of flow data, and are not calibrated by actual
reported dates of sediment events. To that end, it is critical that the assessment provided here be
expanded on with more information regarding reservoir releases, Clark Canyon Creek floods, and
resulting impacts to the Beaverhead River so that local managers can most accurately predict sediment
events, and most rapidly respond with a flushing flow release.

B e a v e r h e a d F l u s h i n g F l o w s P a g e | 28
Applied Geomorphology February 2014
7 Flushing Flow MOU The anticipated components of a flushing flow MOU between the BOR and MTFWP include the
following:
1. Describe the objective of water banking for purposes of a spring flushing flow from Clark Canyon
Reservoir.
2. Identify those provisions that would trigger conducting a flushing flow.
3. Determine potential flushing flow release quantity, shape, duration, and timeframe.
4. Identify roles and procedures for coordinating, determining, and releasing the call of stored
water.
5. Outline the terms agreed to by the parties of the MOU.
6. Identify representatives for each of the parties responsible for monitoring and implementing the
MOU.
It is anticipated that this document will help develop items 1-3 in the MOU.

B e a v e r h e a d F l u s h i n g F l o w s P a g e | 29
Applied Geomorphology February 2014
8 References Allied Engineering, 2013. Clark Canyon Creek Sediment Reduction Project Beaverhead County,
Montana: Final Technical Report, 21p.
Grenfell, S.E. and W.N. Ellery, 2009. Hydrology, sediment transport dynamics and geomorphology of a
variable flow river: the Mfolozi River, South Africa: Water SA (Online) vol.35 no. 3 Pretoria, Apr. 2009.
Kondolf, G.M., and P.R. Wilcock (1996). The flushing flow problem: Defining and evaluating objectives:
Water Resources Research, Vol. 32, no. 8, pp. 2589-2599.
Montana Department of Environmental Quality (MDEQ), 2012. Beaverhead Sediment Total Maximum
Daily Loads and Framework Water Quality Protection Plan: Report prepared by MDEQ Water Quality
Planning Bureau, Watershed Management Section, 148p.
O’brien, J.S. 1987. A case study of minimum streamflow for fishery habitat in the Yampa River, in:
Sediment transport in Gravel Bed Rivers: Cr. Thorne, J.C. Bathurst, and R.D Hey, eds. John Wiley,
Chinester, pp 921-946.
United States Bureau of Reclamation (BOR), 2010. Beaverhead River Flushing Flow Study: Clark Canyon
Dam, Montana Area Office, Billings MT, 41p.
United States Bureau of Reclamation (BOR), 2013. Beaverhead River Flushing Flow Study: Technical
Report SRH-2013-10: Clark Canyon Dam, East Bench Unit, Montana Area Office, Billings MT, 34p.
Wesche, T.A. 1994. Flushing flow investigations: Henry’s Fork of the Snake River. Final Report submitted
to the State of Idaho Department of Environmental Quality, Idaho Falls, Idaho.
Wiley, D.E, T.A. Wesche, and W.A. Hubert, 1995. Development and Evaluation of Flushing Flow
Recommendations for the Bighorn River: Phase 1 Report submitted to Wyoming Water Resources
Center, University of Wyoming, Laramie Wyoming and USDI Bureau of Reclamation and The Wyoming
Department of Game and Fish, 103p.
B e a v e r h e a d F l u s h i n g F l o w s P a g e | 30
Applied Geomorphology February 2014
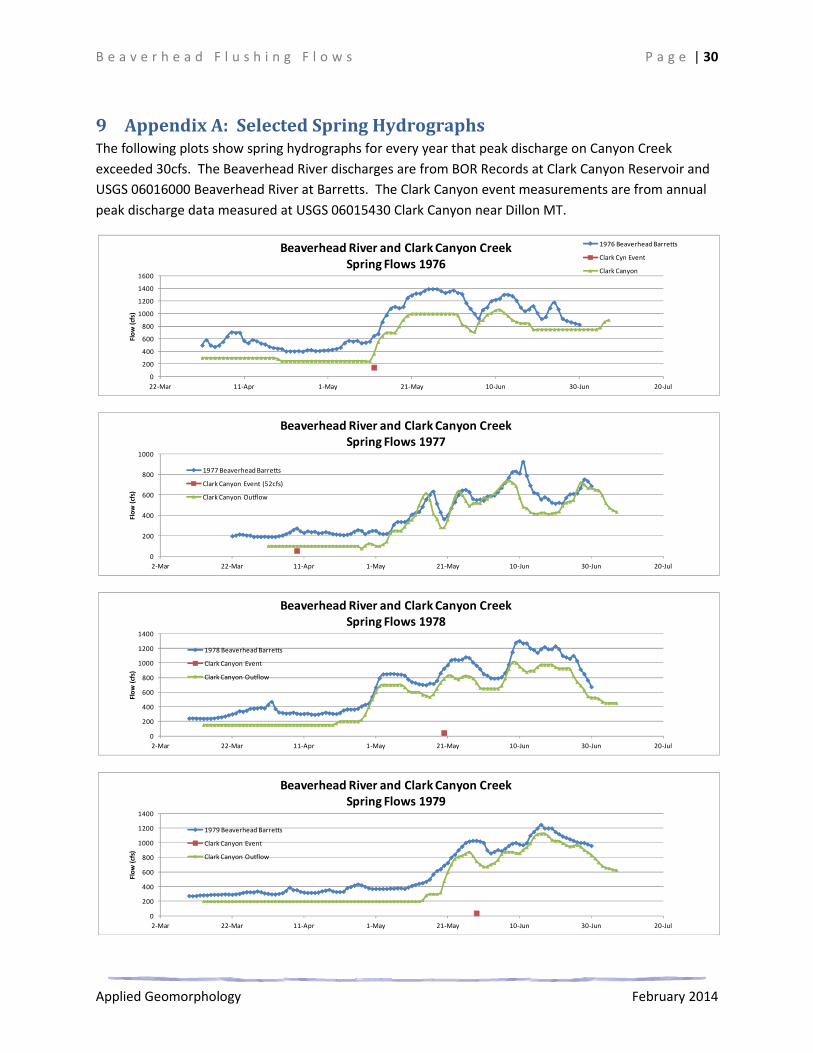
9 Appendix A: Selected Spring Hydrographs The following plots show spring hydrographs for every year that peak discharge on Canyon Creek
exceeded 30cfs. The Beaverhead River discharges are from BOR Records at Clark Canyon Reservoir and
USGS 06016000 Beaverhead River at Barretts. The Clark Canyon event measurements are from annual
peak discharge data measured at USGS 06015430 Clark Canyon near Dillon MT.
0
200
400
600
800
1000
1200
1400
1600
22-Mar 11-Apr 1-May 21-May 10-Jun 30-Jun 20-Jul
Flo
w (
cfs)
Beaverhead River and Clark Canyon Creek
Spring Flows 1976
1976 Beaverhead Barretts
Clark Cyn Event
Clark Canyon
0
200
400
600
800
1000
2-Mar 22-Mar 11-Apr 1-May 21-May 10-Jun 30-Jun 20-Jul
Flo
w (
cfs)
Beaverhead River and Clark Canyon Creek
Spring Flows 1977
1977 Beaverhead Barretts
Clark Canyon Event (52cfs)
Clark Canyon Outflow
0
200
400
600
800
1000
1200
1400
2-Mar 22-Mar 11-Apr 1-May 21-May 10-Jun 30-Jun 20-Jul
Flo
w (
cfs)
Beaverhead River and Clark Canyon Creek
Spring Flows 1978
1978 Beaverhead Barretts
Clark Canyon Event
Clark Canyon Outflow
0
200
400
600
800
1000
1200
1400
2-Mar 22-Mar 11-Apr 1-May 21-May 10-Jun 30-Jun 20-Jul
Flo
w (
cfs)
Beaverhead River and Clark Canyon Creek
Spring Flows 1979
1979 Beaverhead Barretts
Clark Canyon Event
Clark Canyon Outflow

B e a v e r h e a d F l u s h i n g F l o w s P a g e | 31
Applied Geomorphology February 2014
0
200
400
600
800
1000
1200
2-Mar 22-Mar 11-Apr 1-May 21-May 10-Jun 30-Jun 20-Jul
Flo
w (
cfs)
Beaverhead River and Clark Canyon Creek
Spring Flows 1980
1980 Beaverhead Barretts
Clark Canyon Event
Clark Canyon Outflow
0
200
400
600
800
1000
1200
1400
22-Mar 11-Apr 1-May 21-May 10-Jun 30-Jun 20-Jul
Flo
w (
cfs)
Beaverhead River and Clark Canyon Creek
Spring Flows 19811981 Beaverhead Barretts
Clark Cyn Event
Clark Canyon Outflow
0
200
400
600
800
1000
1200
1400
2-Mar 22-Mar 11-Apr 1-May 21-May 10-Jun 30-Jun 20-Jul
Flo
w (
cfs)
Beaverhead River and Clark Canyon Creek
Spring Flows 1982
1982 Beaverhead Barretts
Clark Canyon Event
Clark Canyon Outflow
0
200
400
600
800
1000
1200
1400
2-Mar 22-Mar 11-Apr 1-May 21-May 10-Jun 30-Jun 20-Jul 9-Aug 29-Aug
Flo
w (
cfs)
Beaverhead River and Clark Canyon Creek
Spring Flows 1983
1983 Beaverhead Barretts
Clark Canyon Event
Clark Canyon Outflow

B e a v e r h e a d F l u s h i n g F l o w s P a g e | 32
Applied Geomorphology February 2014
0
500
1000
1500
2000
2500
3000
22-Mar 11-Apr 1-May 21-May 10-Jun 30-Jun 20-Jul
Flo
w (
cfs)
Beaverhead River and Clark Canyon Creek
Spring Flows 1984
1984 Beaverhead Barretts
Clark Cyn Event
Clark Canyon Outflow
0
200
400
600
800
1000
1200
1400
2-Mar 22-Mar 11-Apr 1-May 21-May 10-Jun 30-Jun 20-Jul 9-Aug 29-Aug
Flo
w (
cfs)
Beaverhead River and Clark Canyon Creek
Spring Flows 1986
1986 Beaverhead Barretts
Clark Canyon Event
Clark Canyon Outflow
0
200
400
600
800
1000
1200
2-Mar 22-Mar 11-Apr 1-May 21-May 10-Jun 30-Jun 20-Jul
Flo
w (
cfs)
Beaverhead River and Clark Canyon Creek
Spring Flows 1987
1987 Beaverhead Barretts
Clark Canyon Event
Clark Canyon Outflow
0
200
400
600
800
1000
2-Mar 22-Mar 11-Apr 1-May 21-May 10-Jun 30-Jun 20-Jul
Flo
w (
cfs)
Beaverhead River and Clark Canyon Creek
Spring Flows 1990
1990 Beaverhead Barretts
Clark Canyon Event (35 cfs)
Clark Canyon Outflow

B e a v e r h e a d F l u s h i n g F l o w s P a g e | 33
Applied Geomorphology February 2014
0
200
400
600
800
1000
1200
2-Mar 22-Mar 11-Apr 1-May 21-May 10-Jun 30-Jun 20-Jul
Flo
w (
cfs)
Beaverhead River and Clark Canyon Creek
Spring Flows 1991
1991 Beaverhead Barretts
Clark Canyon Event (43 cfs)
Clark Canyon Outflow
0
100
200
300
400
500
600
700
800
900
2-Mar 22-Mar 11-Apr 1-May 21-May 10-Jun 30-Jun 20-Jul
Flo
w (
cfs)
Beaverhead River and Clark Canyon Creek
Spring Flows 1992
1992 Beaverhead Barretts
Clark Canyon Event
Clark Canyon Outflow
0
100
200
300
400
500
600
700
800
900
2-Mar 22-Mar 11-Apr 1-May 21-May 10-Jun 30-Jun 20-Jul
Flo
w (
cfs)
Beaverhead River and Clark Canyon Creek
Spring Flows 1993
1993 Beaverhead Barretts
Clark Canyon Event (41 cfs)
Clark Canyon Outflow
0
100
200
300
400
500
600
700
800
900
2-Mar 22-Mar 11-Apr 1-May 21-May 10-Jun 30-Jun 20-Jul
Flo
w (
cfs)
Beaverhead River and Clark Canyon Creek
Spring Flows 1994
1994 Beaverhead Barretts
Clark Cyn Event (49cfs)
Clark Canyon Outflow

B e a v e r h e a d F l u s h i n g F l o w s P a g e | 34
Applied Geomorphology February 2014
0
200
400
600
800
1000
1200
1400
1600
22-Mar 11-Apr 1-May 21-May 10-Jun 30-Jun 20-Jul
Flo
w (
cfs)
Beaverhead River and Clark Canyon Creek
Spring Flows 1995
1995 Beaverhead Barretts
Clark Cyn Event
Clark Canyon Outflow
0
100
200
300
400
500
600
22-Mar 11-Apr 1-May 21-May 10-Jun 30-Jun 20-Jul
Flo
w (
cfs)
Beaverhead River and Clark Canyon Creek
Spring Flows 2005
2005 Beaverhead Barretts
Clark Cyn Event
Clark Canyon Outflow
0
200
400
600
800
1000
2-Mar 22-Mar 11-Apr 1-May 21-May 10-Jun 30-Jun 20-Jul
Flo
w (
cfs)
Beaverhead River and Clark Canyon Creek
Spring Flows 2006
2006 Beaverhead Barretts
Clark Cyn Event (58cfs)
Clark Canyon Outflow
0
200
400
600
800
1000
10-Feb 2-Mar 22-Mar 11-Apr 1-May 21-May 10-Jun 30-Jun 20-Jul
Flo
w (
cfs)
Beaverhead River and Clark Canyon Creek
Spring Flows 2009
2009 Beaverhead Barretts
Clark Cyn Event
Clark Canyon Outflow

B e a v e r h e a d F l u s h i n g F l o w s P a g e | 35
Applied Geomorphology February 2014
0
200
400
600
800
1000
1200
22-Mar 11-Apr 1-May 21-May 10-Jun 30-Jun 20-Jul
Flo
w (
cfs)
Beaverhead River and Clark Canyon Creek
Spring Flows 2010
2010 Beaverhead Barretts
Clark Cyn Event
Clark Canyon Outflow
0
200
400
600
800
1000
1200
22-Mar 11-Apr 1-May 21-May 10-Jun 30-Jun 20-Jul
Flo
w (
cfs)
Beaverhead River and Clark Canyon Creek
Spring Flows 2011
2011 Beaverhead Barretts
Clark Cyn Event
Clark Canyon Outflow
0
100
200
300
400
500
600
700
800
900
10-Feb 2-Mar 22-Mar 11-Apr 1-May 21-May 10-Jun 30-Jun 20-Jul
Flo
w (
cfs)
Beaverhead River and Clark Canyon Creek
Spring Flows 2012
2012 Beaverhead Barretts
Clark Cyn Event
Clark Canyon Outflow

B e a v e r h e a d F l u s h i n g F l o w s P a g e | 36
Applied Geomorphology February 2014
10 Appendix B: Flushing Flow Tables
Table 5. Flushing flow prescription for a 100 cfs dam release baseflow.
Hour Day Baseflow Clark Cyn
Estimate
Release Portion of
day
Acre Feet per
time
increment
Total
Beaverhead
River Flow (cfs)
Cumulative
Flushing Flow
Volume (af)
1 1 100 0 0 0.042 0 100 0
2 1 100 70 0 0.042 0 170 0.0
3 1 100 130 0 0.042 0 230 0.0
4 1 100 150 0 0.042 0.0 250 0.0
5 1 100 130 0 0.042 0.0 230 0.0
6 1 100 70 0 0.042 0.0 170 0.0
7 1 100 40 0 0.042 0.0 140 0.0
8 1 100 10 0 0.042 0.0 110 0.0
9 1 100 10 0 0.042 0.0 110 0.0
10 1 100 10 0 0.042 0.0 110 0.0
11 1 100 10 100 0.042 8.3 210 8.3
12 1 100 10 120 0.042 9.9 230 18.2
13 1 100 10 140 0.042 11.6 250 29.7
14 1 100 10 160 0.042 13.2 270 43.0
15 1 100 10 220 0.042 18.2 330 61.1
16 1 100 10 350 0.042 28.9 460 90.1
17 1 100 10 375 0.042 31.0 485 121.0
18 1 100 10 400 0.042 33.1 510 154.1
19 1 100 10 400 0.042 33.1 510 187.1
20 1 100 10 400 0.042 33.1 510 220.2
21 1 100 10 400 0.042 33.1 510 253.2
22 1 100 10 400 0.042 33.1 510 286.3
23 1 100 10 400 0.042 33.1 510 319.3
24 2 100 10 400 0.042 33.1 510 352.4
25 2 100 10 400 0.042 33.1 510 385.4
26 2 100 10 420 0.042 34.7 530 420.1
27 2 100 10 440 0.042 36.4 550 456.5
28 2 100 10 460 0.042 38.0 570 494.5
29 2 100 10 480 0.042 39.7 590 534.2
30 2 100 10 500 0.042 41.3 610 575.5
31 2 100 10 520 0.042 43.0 630 618.4
32 2 100 10 540 0.042 44.6 650 663.1
33 2 100 10 600 0.042 49.6 710 712.6
34 2 100 10 600 0.042 49.6 710 762.2
35 2 100 10 600 0.042 49.6 710 811.8
36 2 100 10 600 0.042 49.6 710 861.4
37 2 100 10 600 0.042 49.6 710 910.9
38 2 100 10 600 0.042 49.6 710 960.5
39 2 100 10 600 0.042 49.6 710 1010.1
40 2 100 10 600 0.042 49.6 710 1059.7
41 2 100 10 600 0.042 49.6 710 1109.2
42 2 100 10 600 0.042 49.6 710 1158.8
43 2 100 10 600 0.042 49.6 710 1208.4
44 2 100 10 600 0.042 49.6 710 1258.0
45 2 100 10 550 0.042 45.4 660 1303.4
46 2 100 10 500 0.042 41.3 610 1344.7
47 2 100 10 500 0.042 41.3 610 1386.0
48 2 100 10 500 0.042 41.3 610 1427.3
49 3 100 10 500 0.042 41.3 610 1468.7

B e a v e r h e a d F l u s h i n g F l o w s P a g e | 37
Applied Geomorphology February 2014
Hour Day Baseflow Clark Cyn
Estimate
Release Portion of
day
Acre Feet per
time
increment
Total
Beaverhead
River Flow (cfs)
Cumulative
Flushing Flow
Volume (af)
50 3 100 10 500 0.042 41.3 610 1510.0
51 3 100 10 500 0.042 41.3 610 1551.3
52 3 100 10 500 0.042 41.3 610 1592.6
53 3 100 10 475 0.042 39.2 585 1631.8
54 3 100 10 450 0.042 37.2 560 1669.0
55 3 100 10 400 0.042 33.1 510 1702.1
56 3 100 10 400 0.042 33.1 510 1735.1
57 3 100 10 400 0.042 33.1 510 1768.2
58 3 100 10 400 0.042 33.1 510 1801.2
59 3 100 10 400 0.042 33.1 510 1834.3
60 3 100 10 400 0.042 33.1 510 1867.3
61 3 100 10 400 0.042 33.1 510 1900.4
62 3 100 10 400 0.042 33.1 510 1933.4
63 3 100 10 375 0.042 31.0 485 1964.4
64 3 100 10 325 0.042 26.9 435 1991.3
65 3 100 10 275 0.042 22.7 385 2014.0
66 3 100 10 250 0.042 20.7 360 2034.6
67 3 100 10 225 0.042 18.6 335 2053.2
68 3 100 10 200 0.042 16.5 310 2069.8
69 3 100 10 150 0.042 12.4 260 2082.2
70 3 100 10 100 0.042 8.3 210 2090.4
71 3 100 10 10 0.042 0.8 120 2091.2
72 3 100 10 0 0.042 0.0 110 2091.2
73 3 100 10 0 0.042 0.0 110 2091.2
74 3 100 10 0 0.042 0.0 110 2091.2
75 3 100 10 0 0.042 0.0 110 2091.2
76 3 100 10 0 0.042 0.0 110 2091.2
77 3 100 10 0 0.042 0.0 110 2091.2
78 3 100 10 0 0.042 0.0 110 2091.2
79 3 100 10 0 0.042 0.0 110 2091.2
80 3 100 10 0 0.042 0.0 110 2091.2

B e a v e r h e a d F l u s h i n g F l o w s P a g e | 38
Applied Geomorphology February 2014
Table 6. Flushing flow prescription for a 25 cfs dam release baseflow.
Hour Day Baseflow Clark Cyn
Estimate
Release Portion of
day
Acre Feet per
time
increment
Total
Beaverhead
River Flow (cfs)
Cumulative
Flushing Flow
Volume (af)
1 1 100 0 0 0.042 0 100 0
2 1 100 70 0 0.042 0 170 0.0
3 1 100 130 0 0.042 0 230 0.0
4 1 100 150 0 0.042 0.0 250 0.0
5 1 100 130 0 0.042 0.0 230 0.0
6 1 100 70 0 0.042 0.0 170 0.0
7 1 100 40 0 0.042 0.0 140 0.0
8 1 100 10 0 0.042 0.0 110 0.0
9 1 100 10 0 0.042 0.0 110 0.0
10 1 100 10 0 0.042 0.0 110 0.0
11 1 100 10 100 0.042 8.3 210 8.3
12 1 100 10 120 0.042 9.9 230 18.2
13 1 100 10 140 0.042 11.6 250 29.7
14 1 100 10 160 0.042 13.2 270 43.0
15 1 100 10 220 0.042 18.2 330 61.1
16 1 100 10 350 0.042 28.9 460 90.1
17 1 100 10 375 0.042 31.0 485 121.0
18 1 100 10 400 0.042 33.1 510 154.1
19 1 100 10 400 0.042 33.1 510 187.1
20 1 100 10 400 0.042 33.1 510 220.2
21 1 100 10 400 0.042 33.1 510 253.2
22 1 100 10 400 0.042 33.1 510 286.3
23 1 100 10 400 0.042 33.1 510 319.3
24 2 100 10 400 0.042 33.1 510 352.4
25 2 100 10 400 0.042 33.1 510 385.4
26 2 100 10 420 0.042 34.7 530 420.1
27 2 100 10 440 0.042 36.4 550 456.5
28 2 100 10 460 0.042 38.0 570 494.5
29 2 100 10 480 0.042 39.7 590 534.2
30 2 100 10 500 0.042 41.3 610 575.5
31 2 100 10 520 0.042 43.0 630 618.4
32 2 100 10 540 0.042 44.6 650 663.1
33 2 100 10 600 0.042 49.6 710 712.6
34 2 100 10 600 0.042 49.6 710 762.2
35 2 100 10 600 0.042 49.6 710 811.8
36 2 100 10 600 0.042 49.6 710 861.4
37 2 100 10 600 0.042 49.6 710 910.9
38 2 100 10 600 0.042 49.6 710 960.5
39 2 100 10 600 0.042 49.6 710 1010.1
40 2 100 10 600 0.042 49.6 710 1059.7
41 2 100 10 600 0.042 49.6 710 1109.2
42 2 100 10 600 0.042 49.6 710 1158.8
43 2 100 10 600 0.042 49.6 710 1208.4
44 2 100 10 600 0.042 49.6 710 1258.0
45 2 100 10 550 0.042 45.4 660 1303.4
46 2 100 10 500 0.042 41.3 610 1344.7
47 2 100 10 500 0.042 41.3 610 1386.0
48 2 100 10 500 0.042 41.3 610 1427.3
49 3 100 10 500 0.042 41.3 610 1468.7
50 3 100 10 500 0.042 41.3 610 1510.0
51 3 100 10 500 0.042 41.3 610 1551.3
52 3 100 10 500 0.042 41.3 610 1592.6

B e a v e r h e a d F l u s h i n g F l o w s P a g e | 39
Applied Geomorphology February 2014
Hour Day Baseflow Clark Cyn
Estimate
Release Portion of
day
Acre Feet per
time
increment
Total
Beaverhead
River Flow (cfs)
Cumulative
Flushing Flow
Volume (af)
53 3 100 10 475 0.042 39.2 585 1631.8
54 3 100 10 450 0.042 37.2 560 1669.0
55 3 100 10 400 0.042 33.1 510 1702.1
56 3 100 10 400 0.042 33.1 510 1735.1
57 3 100 10 400 0.042 33.1 510 1768.2
58 3 100 10 400 0.042 33.1 510 1801.2
59 3 100 10 400 0.042 33.1 510 1834.3
60 3 100 10 400 0.042 33.1 510 1867.3
61 3 100 10 400 0.042 33.1 510 1900.4
62 3 100 10 400 0.042 33.1 510 1933.4
63 3 100 10 375 0.042 31.0 485 1964.4
64 3 100 10 325 0.042 26.9 435 1991.3
65 3 100 10 275 0.042 22.7 385 2014.0
66 3 100 10 250 0.042 20.7 360 2034.6
67 3 100 10 225 0.042 18.6 335 2053.2
68 3 100 10 200 0.042 16.5 310 2069.8
69 3 100 10 150 0.042 12.4 260 2082.2
70 3 100 10 100 0.042 8.3 210 2090.4
71 3 100 10 10 0.042 0.8 120 2091.2
72 3 100 10 0 0.042 0.0 110 2091.2
73 3 100 10 0 0.042 0.0 110 2091.2
74 3 100 10 0 0.042 0.0 110 2091.2
75 3 100 10 0 0.042 0.0 110 2091.2
76 3 100 10 0 0.042 0.0 110 2091.2
77 3 100 10 0 0.042 0.0 110 2091.2
78 3 100 10 0 0.042 0.0 110 2091.2
79 3 100 10 0 0.042 0.0 110 2091.2
80 3 100 10 0 0.042 0.0 110 2091.2


![Bureau of Watershed Management Regulatory Proposal Chapter 102 [Erosion and Sediment Control] Erosion, Sediment and Stormwater Management February 21,](https://img.pdfslide.net/doc/110x75/5697bfd61a28abf838cae07f/bureau-of-watershed-management-regulatory-proposal-chapter-102-erosion-and.jpg)