Embed Size (px)
Citation preview

Central Washington University Central Washington University
ScholarWorks@CWU ScholarWorks@CWU
Geological Sciences Faculty Scholarship College of the Sciences
2-4-2016
Upper Mantle Structure of Central and West Antarctica from Array Upper Mantle Structure of Central and West Antarctica from Array
Analysis of Rayleigh Wave Phase Velocities Analysis of Rayleigh Wave Phase Velocities
David S. Heeszel Washington University in St. Louis
Douglas A. Wiens Washington University in St. Louis
Sridhar Anandakrishnan The Pennsylvania State University
Richard C. Aster Colorado State University - Fort Collins
Ian W.D. Dalziel University of Texas at Austin
See next page for additional authors
Follow this and additional works at: https://digitalcommons.cwu.edu/geological_sciences
Part of the Geophysics and Seismology Commons, and the Tectonics and Structure Commons
Recommended Citation Recommended Citation Heeszel, D.S. et al. (2016). Upper mantle structure of central and West Antarctica from array analysis of Rayleigh wave phase velocities. Journal of Geophysical Research - Solid Earth 121(3), 1758-1775. DOI: 10.1002/2015JB012616
This Article is brought to you for free and open access by the College of the Sciences at ScholarWorks@CWU. It has been accepted for inclusion in Geological Sciences Faculty Scholarship by an authorized administrator of ScholarWorks@CWU. For more information, please contact [email protected].

Authors Authors David S. Heeszel, Douglas A. Wiens, Sridhar Anandakrishnan, Richard C. Aster, Ian W.D. Dalziel, Audrey D. Huerta, Andrew A. Nyblade, Terry J. Wilson, and J. Paul Winberry
This article is available at ScholarWorks@CWU: https://digitalcommons.cwu.edu/geological_sciences/15

Upper mantle structure of central and West Antarcticafrom array analysis of Rayleigh wave phase velocitiesDavid S. Heeszel1,2, Douglas A. Wiens1, Sridhar Anandakrishnan3, Richard C. Aster4, Ian W. D. Dalziel5,Audrey D. Huerta6, Andrew A. Nyblade3, Terry J. Wilson7, and J. Paul Winberry6
1Department of Earth and Planetary Sciences, Washington University, St. Louis, Missouri, USA, 2United States NuclearRegulatory Commission, Washington, District of Columbia, USA, 3Department of Geosciences, Pennsylvania StateUniversity, University Park, Pennsylvania, USA, 4Geosciences Department, Warner College of Natural Resources, ColoradoState University, Fort Collins, Colorado, USA, 5Institute for Geophysics, University of Texas at Austin, Austin, Texas, USA,6Department of Geological Sciences, Central Washington University, Ellensburg, Washington, USA, 7Department ofGeological Sciences, Ohio State University, Columbus, Ohio, USA
Abstract The seismic velocity structure of Antarctica is important, both as a constraint on the tectonichistory of the continent and for understanding solid Earth interactions with the ice sheet. We use Rayleighwave array analysis methods applied to teleseismic data from recent temporary broadband seismographdeployments to image the upper mantle structure of central and West Antarctica. Phase velocity maps aredetermined using a two–plane wave tomography method and are inverted for shear velocity using a MonteCarlo approach to estimate three-dimensional velocity structure. Results illuminate the structural dichotomybetween the East Antarctic Craton and West Antarctica, with West Antarctica showing thinner crust andslower upper mantle velocity. West Antarctica is characterized by a 70–100 km thick lithosphere, underlain bya low-velocity zone to depths of at least 200 km. The slowest anomalies are beneath Ross Island and theMarie Byrd Land dome and are interpreted as upper mantle thermal anomalies possibly due to mantleplumes. The central Transantarctic Mountains are marked by an uppermost mantle slow-velocity anomaly,suggesting that the topography is thermally supported. The presence of thin, higher-velocity lithosphere todepths of about 70 km beneath the West Antarctic Rift System limits estimates of the regionally averagedheat flow to less than 90mW/m2. The Ellsworth-Whitmore block is underlain by mantle with velocities thatare intermediate between those of the West Antarctic Rift System and the East Antarctic Craton. We interpretthis province as Precambrian continental lithosphere that has been altered by Phanerozoic tectonic andmagmatic activity.
1. Introduction
The upper mantle seismic structure of Antarctica provides insight into the geological and tectonic history ofthe continent, which is poorly understood due to very limited geological exposure as a result of the thick icesheet. Seismic structure can also provide important constraints on factors that control interactions betweenthe solid Earth and the ice sheet, including the estimates of lithospheric strength and mantle viscosity struc-ture required for glacial isostatic adjustment modeling [Ivins and Sammis, 1995; van der Wal et al., 2015] andfor heat flow at the base of the ice sheet [Shapiro and Ritzwoller, 2004; Pollard et al., 2005; Larour et al., 2012].
Due to the challenges associated with deploying seismometers in the harsh climate of Antarctica, the seismicvelocity structure of the continent to date has primarily been estimated through continent-scale studiesbased on teleseismic surface waves recorded at sparse permanent seismic stations [Roult and Rouland,1992; Danesi and Morelli, 2000, 2001; Ritzwoller et al., 2001; Morelli and Danesi, 2004]. The earliest regionaltomography studies using temporary seismic networks and methods that are commonly used on othercontinents occurred in the TAMSEIS project [Lawrence et al., 2006a, 2006b, 2006c; Watson et al., 2006; Pyleet al., 2010] which provided insight into the structure and tectonic setting of the Transantarctic Mountains(TAM) in the South Victoria Land and Ross Sea region.
Recent large-scale deployments of temporary broadband seismic stations in West Antarctica (POLENET/ANET) and in central East Antarctica (AGAP/GAMSEIS) now make it possible to seismically image much ofthe Antarctic continent at a new level of resolution. Recent studies have used these data to derive large-scalebody wave [Hansen et al., 2014] and surface wave [An et al., 2015] models of the Antarctic region, and to
HEESZEL ET AL. MANTLE STRUCTURE OF WEST ANTARCTICA 1758
PUBLICATIONSJournal of Geophysical Research: Solid Earth
RESEARCH ARTICLE10.1002/2015JB012616
Key Points:• Slow mantle velocities delineate athermal anomaly beneath Marie ByrdLand, possibly representing a mantleplume
• Seventy kilometer thick high-velocitylithosphere beneath the WestAntarctic Rift System limits averageheat flow to less than 90 mW/m
2
• Ellsworth-Whitmoremantle lithospherehas intermediate velocity suggesting aPrecambrian block with tectonicalteration
Supporting Information:• Table S1
Correspondence to:D. A. Wiens,[email protected]
Citation:Heeszel, D. S., D. A. Wiens,S. Anandakrishnan, R. C. Aster,I. W. D. Dalziel, A. D. Huerta, A. A. Nyblade,T. J. Wilson, and J. P. Winberry (2016),Upper mantle structure of central andWest Antarctica from array analysisof Rayleigh wave phase velocities,J. Geophys. Res. Solid Earth, 121,1758–1775, doi:10.1002/2015JB012616.
Received 21 OCT 2015Accepted 29 JAN 2016Accepted article online 4 FEB 2016Published online 7 MAR 2016
©2016. American Geophysical Union.All Rights Reserved.

constrain crustal thicknesses [Chaput et al., 2014] and seismic anisotropy [Accardo et al., 2014]. In this paper,we utilize a comprehensive data set from these recent deployments, in conjunction with array-based phasevelocity determination techniques, to obtain new surface wave models of the upper mantle beneathAntarctica. The data set used combines POLENET/ANET, AGAP/GAMSEIS, TAMSEIS, and other data from thesparse network of permanent Antarctic seismic stations to perform teleseismic Rayleigh wave phase velocitytomography using the two�plane wave method of Forsyth and Li [2005]. We then invert the derived phasevelocity maps for a three-dimensional shear velocity structural model and discuss the implications of thevelocity variations for the structure and tectonic history of Antarctica.
2. Tectonic Setting
The large-scale tectonic framework of Antarctic continental interior is subject to many uncertainties. With theexception of rock outcrops near the edges of the continent and in the TAMS, which define the boundarybetween East and West Antarctica, direct sampling of bedrock is limited due to the thick ice cover.Therefore, knowledge of the geologic structure and tectonic history is based almost solely on extrapolatingobservations from the limited surface geological exposures, guided by the interpretation of subglacial topo-graphy in association with aerogeophysical, seismic, gravity, and magnetic data. In this section, we brieflyoutline the tectonic setting and history of the study region.
The Gamburtsev Subglacial Mountains (GSM) in East Antarctica are poorly understood, in large part dueto a complete absence of geological samples, and their history and tectonic origin is widely debated[van de Flierdt et al., 2008; Hansen et al., 2010; Ferraccioli et al., 2011]. Various tectonic scenarios have beenpresented to link geological evidence from the periphery with possible tectonic effects on the interior[Fitzsimons, 2000a, 2000b, 2003; Goodge and Fanning, 2010; Boger, 2011]. The AGAP/GAMSEIS investigationrevealed highly thickened crust [Hansen et al., 2010] and fast lithosphere extending to depths of about250 km [Heeszel et al., 2013; Lloyd et al., 2013]. These studies hypothesized that the modern GSM are ofPermian age and represent a reactivation of an older structure, with the age of the continental lithospherein the region dating to the Archean and Paleoproterozoic. A series of subglacial basins and interveninghighlands lie between the GSM and the TAMS. The basins represent major subglacial topographiclows, and their large-scale, internal structure is known primarily through geophysical studies [Stern andten Brink, 1989; ten Brink and Stern, 1992; ten Brink et al., 1993; Studinger et al., 2004; Ferraccioli et al.,2009; Pyle et al., 2010].
The TAMS are a 2500 km long noncompressional mountain range that marks the tectonic boundary betweenEast and West Antarctica and originated in the Neoproterozoic when another craton, possibly Laurentia,drifted away [Dalziel, 1991]. Through geologic time, the region has undergone multiple instances of orogen-esis including the Nimrod (~1.7 Ga) [Goodge et al., 2001] and the Ross-Delamarian orogenies (550–450Ma)[Fitzsimons, 2000a]. Late Mesozoic to Cenozoic uplift of the TAMS has been suggested to result from flexuraluplift associated with the growth of the West Antarctic Rift System (WARS) [Stern and ten Brink, 1989; ten Brinkand Stern, 1992; ten Brink et al., 1993], crustal thickening [Studinger et al., 2004], or a hybrid model of these twoeffects [Lawrence et al., 2006a].
West Antarctica is composed of several crustal blocks that have undergone motion relative to each other andthe East Antarctic craton [Dalziel and Elliot, 1982; Jankowski and Drewry, 1981]. The WARS, extending from theRoss Sea to the Ellsworth-Whitmore and Antarctic Peninsula blocks, has undergone continental rifting begin-ning in the Mesozoic and extending into the Cenozoic [Cooper and Davey, 1985; Davey and Brancolini, 1995;Wilson, 1995; Siddoway, 2008]. Deep topographic lows and basin-scale features mapped by aerogeophysicaltechniques have been interpreted as representing rift basins [Jordan et al., 2010], and locally thinned conti-nental crust is associated with the most prominent of these [Winberry and Anandakrishnan, 2004; Chaputet al., 2014]. Evidence from the Ross Sea Embayment indicates that multiple extension pulses are requiredto fit paleomagnetic constraints [DiVenere et al., 1994; Cande et al., 2000; Davey et al., 2006; Wilson andLuyendyk, 2006]. This evidence indicates large-scale extension of the WARS ending at about 48Ma, followedby possible transcurrent or transpressional motion between 48 and 17Ma [Wilson and Luyendyk, 2009; Granotet al., 2010, 2013]. A final phase of extension is inferred beginning at 17Ma, coincident with highly localizedextension and crustal thinning at the Terror Rift bordering the TAMS in the Ross Sea Embayment [Henryset al., 2007; Fielding et al., 2008; Granot et al., 2010]. This is consistent with geodynamic modeling that
Journal of Geophysical Research: Solid Earth 10.1002/2015JB012616
HEESZEL ET AL. MANTLE STRUCTURE OF WEST ANTARCTICA 1759

supports a progression from a broadregion of extension during the earlystages of WARS formation to a morefocused form of extension near theTAMS during later stages [Huerta andHarry, 2007].
The WARS is bounded to the southeastby the Ellsworth-Whitmore block, afragment of the margin of the EastAntarctic craton that has separated,translated, and rotated into WestAntarctica [Schopf, 1969; Dalziel andElliot, 1982; Grunow et al., 1991;Randall and Mac Niocaill, 2004]. MarieByrd Land, defining the complemen-tary edge of the rift system, is anuplifted region that has undergonePaleozoic through Cenozoic magmaticactivity [Hole and LeMasurier, 1994;Panter et al., 1997; Corr and Vaughan,2008; Paulson and Wilson, 2010; Loughet al., 2013] and shows somewhatthicker crust [Chaput et al., 2014]Recent work supports a plume hypoth-esis for uplift of Marie Byrd Land. Linesof evidence include igneous rocks witha geochemical plume affinity [Weaveret al., 1994; Panter et al., 1997] anddeep seated low-velocity anomaliesobserved seismically [Sieminski et al.,2003; Hansen et al., 2014]. Althoughthere is no prominent thinning of thetransition zone immediately beneaththe volcanism as might be expected
for the thermal influence of a deep seated plume, thinning is found in adjacent regions [Emry et al., 2015],perhaps indicating a deflected plume. An inferred ~3 km of uplift since 28–30Ma also supports a plumehypothesis for the development of the Marie Byrd Land dome [LeMasurier and Landis, 1996].
3. Data and Methods3.1. Seismic Arrays and Data Selection
Data for this study were collected from three large temporary broadband seismic deployments (TAMSEIS,AGAP/GAMSEIS, and POLENET/ANET) and by three permanent seismic stations. This station distributionenables us to image the structure from the GSM throughout most of West Antarctica (Figure 1). TheTAMSEIS array (Lawrence et al., 2006a) was a temporary network of 42 seismic stations that collected dataduring the austral summers of 2001–2003. The deployment consisted of three components: a coastal arrayon the Ross Sea in the region of Ross Island; an east-west array extending from McMurdo station, acrossthe TAMS and onto the East Antarctic Ice Sheet; and a long, crossing array that ran from Terra Nova Bay, overthe TAMS, and onto the East Antarctic Ice Sheet. The AGAP/GAMSEIS network was a multinational deploy-ment of 28 broadband seismic stations designed to study the seismic structure of the GSM as an elementof the 2007–2009 International Polar Year [Hansen et al., 2010; Heeszel et al., 2013]. The network consistedof two lines of stations that crossed near dome A, one an extension of the long TAMSEIS line and the othera north-south line.
Figure 1. Seismic station locations and geographical regions on a map ofsubglacial bedrock topography [Fretwell et al., 2013]. Heavy grey lineoutlines the study region. Station locations are grey (GAMSEIS), blackinverted (TAMSEIS), or red (POLENET/ANET) triangles depending onseismic network. Major subglacial features are labeled in red: LR, GSM, VSH,VSL, MSB, PSB, WSB, TAMS, EWM, WARS, MBL, CL, and VL are the LambertRift, Gamburtsev Subglacial Mountains, Vostok Subglacial Highlands,Vostok Subglacial Lake, Maud Subglacial Basin, Polar Subglacial Basin,Wilkes Subglacial Basin, Transantarctic Mountains, Ellsworth WhitmoreMountains, West Antarctic Rift System, Marie Byrd Land, Coates Land, andVictoria Land, respectively. A-A′, B-B′, and C-C′ denote locations of crosssections in Figure 8.
Journal of Geophysical Research: Solid Earth 10.1002/2015JB012616
HEESZEL ET AL. MANTLE STRUCTURE OF WEST ANTARCTICA 1760

The third temporary network utilized inthis study is the POLENET/ANET deploy-ment across West Antarctica [Accardoet al., 2014; Chaput et al., 2014], from whichwe analyze data recorded by 39 stationsduring 2008–2012. This network wasdesigned to study the crustal and uppermantle structure of West Antarctica. Twoelements of POLENET/ANET are utilizedhere; a longer-term backbone array and alinear transection of temporary stationsdeployed from early 2010 to early 2012extending from the Whitmore Mountainsacross the West Antarctic Rift System(WARS) to Marie Byrd Land. Our imagingalso utilized data from three permanentstations associated with the GlobalSeismographic Network: QSPA at SouthPole, VNDA in the McMurdo Dry Valleys,and SBA on Ross Island. We parameterizethe imaged sector of Antarctica using a gridof nodes (Figure 2a). Our methods require aspacing of no greater than a few hundredkilometers between seismic stations, sowe do not solve for the velocity in regionswith extremely sparse station distribution(masked regions in Figures 4–7).
We select global earthquakes shallowerthan 100 km based on distance fromthe array and the surface wave magni-tude of the earthquake (Figure 2b). Forepicentral distances between 30° and60° we examine earthquakes with MS≥ 4.5,whereas for distances of 60°–150° weapply a larger magnitude threshold ofMS ≥ 5.5. We applied a less stringent mag-nitude requirements for earthquakesoccurring nearer the study region to allowthe use of more earthquakes locatedalong the circum-Antarctic ridge systemand in the subduction zones of theSouthern Hemisphere. Instrument responseis removed from all data, and we visuallyinspect data to eliminate records with lowsignal-to-noise ratio or data dropouts andother artifacts. We filter high-quality datawith a two-pass four-pole Butterworth filter
at 25 period bands between 18 and 182 s and then apply a time window around the fundamental modeRayleigh waves.
3.2. Phase Velocity Inversion
We determine the Rayleigh wave phase velocity as a function of period and position using the two–planewave method [Forsyth and Li, 2005]. This method utilizes both phase and amplitude information to modelthe incoming surface wave as the interference of two plane waves. The method improves on traditional
Figure 2. Map of (a) model nodes and (b) earthquakes used in thisstudy. Nodes in black are associated with West Antarctica, and thosein white are associated with East Antarctica in the regionalizationand in Figure 3 (Figure 2a). Red triangles are seismic stations, and theimaged region is outlined in yellow. Earthquakes used in this studyare shown in red with lines showing the approximate propagationpath to the array (Figure 2b). Events show a good azimuthal distribu-tion relative to the study area. The blue rectangle denotes the imagedregion and corresponds to yellow outline in Figure 2a.
Journal of Geophysical Research: Solid Earth 10.1002/2015JB012616
HEESZEL ET AL. MANTLE STRUCTURE OF WEST ANTARCTICA 1761

two-station surface wave tomography methods by better accommodating effects due to wavefield scatter-ing, multipathing, and off-great circle path effects [Li et al., 2003; Forsyth and Li, 2005]. We further utilize mod-ifications to the method that reduce the effect of off-great circle path energy by including 2-D sensitivitykernels in the inversion [Yang and Forsyth, 2006] that are based on the Born approximation [Zhou et al.,2004]. The processing and inversion methods used here are very similar to those applied in a smaller-scalestudy around the Gamburtsev Subglacial Mountains [Heeszel et al., 2013].
The two–plane wave method may encounter problems with continent-scale arrays, in that the imagingregion is too large for the wavefronts to be adequately approximated as plane waves. To preserve the useful-ness of the plane wave assumption, we adopt an approach in which we divide the large seismic array intomultiple smaller subarrays (Table S1 in the supporting information) and process a single earthquakeobserved across the entire array as a separate event within each subarray following the method of Yanget al. [2008]. This allows us to preserve the plane wave assumption locally and to jointly invert all of the datasimultaneously to produce a single phase velocity model [Yang et al., 2008]. An alternative to this approach isto invert for each subarray separately and average regions of overlap [Yang and Ritzwoller, 2008]. However,this approach adds computational complexity and could create subarray boundary artifacts.
In the first stage of the inversion process, we solve for the average phase velocity as a function of periodacross the East Antarctic and West Antarctic subregions (Figure 2a). This division is necessary because thecrust and upper mantle velocity structure in the two regions differ greatly [Danesi and Morelli, 2001;Ritzwoller et al., 2001; Lawrence et al., 2006a; Block et al., 2009], and it is necessary to have a reasonable startingmodel in each region for the inversion to converge (Figure 3). In the second stage, we perform a tomographicinversion for the 2-D phase velocity variations across the study region, using a parameterization of 1120nodes with the primary region of the inversion having a node spacing of 110 km. Two rows of nodes aroundthe edges have a spacing of 220 km to more coarsely parameterize seismic structure outside of the primarystudy region (Figure 2a).
The inversion method solves for the 2-D phase velocities as spatially sampled at the location of the nodes. Toproduce a continuous phase velocity model, we perform Gaussian weighted spatial interpolation of theresults [Forsyth and Li, 2005]. After making a number of tests, we chose a smoothing length of 240 km.Uncertainties in the derived phase velocity maps are quantified by plotting the standard errors calculatedfrom the a posteriori model covariance matrix [Forsyth and Li, 2005].
3.3. Shear Velocity Inversion3.3.1. Linear InversionWe invert the phase velocity maps for a depth-dependent shear velocity structure using the approachdescribed in Heeszel et al. [2013]. We first extract the phase velocity dispersion curve at each node and per-form a linear inversion to determine the least squares best fit shear velocity [Herrmann and Ammon, 2002]
Figure 3. (a) Average 1-D phase velocity and (b) vertically polarized shear velocity for East Antarctica (blue) and WestAntarctica (red) compared to the Preliminary Reference Earth Model (PREM) SV global model (black) [Dziewonski andAnderson, 1981]. East Antarctica is characterized by a much thicker crust and much faster mantle compared to PREM,which is dominated by oceanic structure. In contrast, West Antarctica shows a dispersion curve and velocity structure muchmore similar to PREM. Note that the PREM model is referenced to 200 s period, whereas the models in this study are notreferenced to a particular period due to the lack of a reliable attenuation model.
Journal of Geophysical Research: Solid Earth 10.1002/2015JB012616
HEESZEL ET AL. MANTLE STRUCTURE OF WEST ANTARCTICA 1762

and then conduct a Monte Carlo resampling around the linear solution to find the best model (section 3.3.2).The ice layer thickness is fixed using Bedmap2 [Fretwell et al., 2013].
Crustal thicknesses for the linear inversion are taken from a crustal thickness map of Antarctica determinedfrom the inversion of short period Rayleigh wave phase and group velocities derived from noise correlationdata [Sun et al., 2013]. Crustal thicknesses from receiver functions alone are subject to errors caused by theuse of inappropriate crustal velocity models [e.g., Schulte-Pelkum and Ben-Zion, 2012], so the use of noise cor-relation data results in more robust estimates. The Sun et al. [2013] model used crustal thickness estimatesfrom receiver functions to define a smoothed map of crustal thickness as a starting model [Winberry andAnandakrishnan, 2004; Reading, 2006; Lawrence et al., 2006a; Hansen et al., 2009, 2010; Finotello et al., 2011;Chaput et al., 2014]. A higher-resolution crustal thickness map was then constructed from a linearized inver-sion of phase and group velocities, with the Moho velocity defined by comparing the shear velocity structurewith the receiver function constraints. Finally, a Monte Carlo simulation was run to explore the trade-offbetween velocities in the lower crust/upper mantle and the total crustal thickness.
The crust in the linearized inversion is parameterized by three layers, with a thin upper crust (one eighth ofthe total thickness), a thicker middle crust (three eighths of the total thickness), and a lower crust (one halfof the total thickness). The uppermost 100 km of the mantle is parameterized by 10 km thick layers, andthe next 80 km is divided into 20 km thick layers. The remainder of the model is divided into 40 km thicklayers down to a depth of 400 km. Since the P wave velocity has much less influence on the phase velocitiesthan the shear velocity, we set the P velocity assuming VP/VS ratios of 1.73 for the crust and 1.81 for the uppermantle. We use different starting models for nodes located in East and West Antarctica (Figure 3b). The start-ing model for each region is the mean model that results from a linear shear velocity inversion and MonteCarlo resampling of the average phase velocity result for each region (Figure 3b).3.3.2. Monte Carlo InversionBecause there is a trade-off between upper mantle velocity and crustal thickness, and the crustal thicknessmust be assumed a priori in the linearized inversion, we perform Monte Carlo modeling of the shear velocityinversion results. The use of forward sampling techniques for exploring the model space is an increasinglycommon approach [e.g., Shapiro and Ritzwoller, 2002; Sambridge and Mosegaard, 2002; Shen et al., 2012].Here we apply the method of Heeszel et al. [2013] to perform Monte Carlo modeling, which performs a ran-dom walk around the initial model to generate a number of acceptable shear velocity models that fit thephase velocity results within an acceptable level of uncertainty. We parameterize the crustal layers in thesame manner as in the linear inversion and allow the velocity to vary by 5%, while fixing the velocity ofthe ice layer. Layer thicknesses are also fixed, with the exception of the lower crustal and the uppermost man-tle layer which are allowed to vary by up to ±5 km. Shear velocities in the mantle are allowed to vary by up to7% in the upper 200 km and 3% in the depth range of 200–280 km. We search the model space around thelinear inverse solution, seeking to minimize the cost (C) in equation (1) below
C ¼ χ2redffiffiffiffiffiffiISE
p(1)
χ2red ¼ 1N
XnN
dobsi � dpredi
� �2σobsi
� �2 (2)
ISE ¼Xm�1
j¼2
Δv jþ1j � Δv j
j�1
Δz jþ1j � Δz jj�1
" #forward
� Δv jþ1j � Δv j
j�1
Δz jþ1j � Δz jj�1
" #inverse
!2(3)
In the above equations, χ2 is the reduced chi-square misfit determined by summing the misfit betweenobserved and predicted phase velocities (d) over the observed standard deviation (σ), and ISE is a measureof model roughness determined by comparing the velocity change between layers in the forward andinverse models [Heeszel et al., 2013]. Because individual layers of the model are not independently resolved,it is possible for models with excessive oscillations of the velocity structure to fit the data within an accepta-ble level of misfit, so we apply the ISE cost function to penalize models with large velocity jumps betweenmantle layers in order to ensure that nonphysical models (i.e., models with oscillating velocity reversals)are not included as acceptable models. The ISE metric is not applied to the crust or to the Moho discontinuity,
Journal of Geophysical Research: Solid Earth 10.1002/2015JB012616
HEESZEL ET AL. MANTLE STRUCTURE OF WEST ANTARCTICA 1763
where such large velocity discontinuities are expected. If a model falls within the corridor of acceptablemodels, we include it in our meanmodel and uncertainty estimates. To limit the effect of varying VP or densityon the models, we fix VP/VS and density in the forward models to values in the linear inverse model.
The mean and median velocity models are determined by the Monte Carlo sampling smooth structure verti-cally because they represent an ensemble of all acceptable models. These vertically smoothmodels representimportant statistical points within the model space but do not accurately represent our best estimate of theamount of variability within the Earth. They may also be biased toward the linear model, since the MonteCarlo perturbations in the sampling are centered on the linear model. To avoid these limitations in ourinterpretation, we utilize the best fit (lowest cost) model for constructing the preferred model. Because eachnode is sampled independently, we apply the same Gaussian horizontal smoothing parameters to the shearwave velocity models as we do to the phase velocity inversions to limit the introduction of poorly constrainedhorizontal roughness into the final shear velocity model and to ensure that features in the final model areconsistent with the estimated spatial resolution of the data [Heeszel et al., 2013].
4. Results4.1. Phase velocities
The results of the 2-D phase velocity tomography show large and well-resolved variability in structure acrossthe study region (Figure 4). Standard error maps (Figure 5) reveal that lateral resolution across the study areais good. We clip all maps at the 0.04 km/s standard error contour at 85 s period for interpretation purposes.
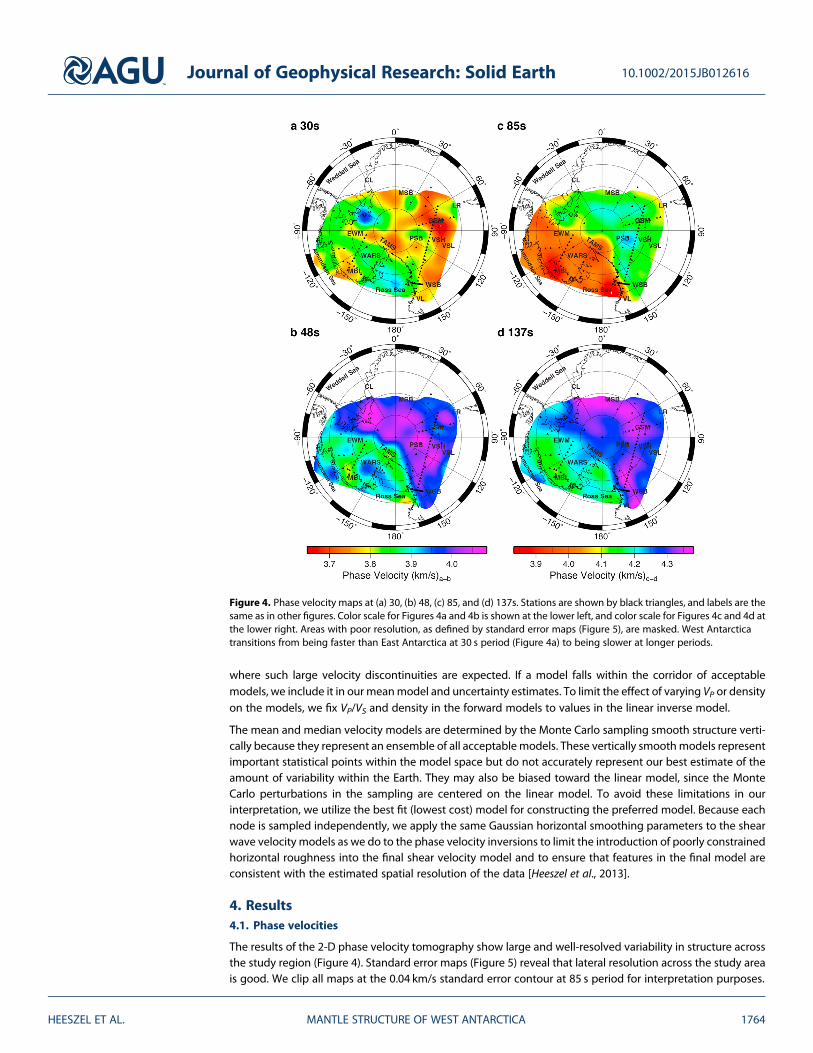
Figure 4. Phase velocity maps at (a) 30, (b) 48, (c) 85, and (d) 137s. Stations are shown by black triangles, and labels are thesame as in other figures. Color scale for Figures 4a and 4b is shown at the lower left, and color scale for Figures 4c and 4d atthe lower right. Areas with poor resolution, as defined by standard error maps (Figure 5), are masked. West Antarcticatransitions from being faster than East Antarctica at 30 s period (Figure 4a) to being slower at longer periods.
Journal of Geophysical Research: Solid Earth 10.1002/2015JB012616
HEESZEL ET AL. MANTLE STRUCTURE OF WEST ANTARCTICA 1764

Slow phase velocities characterize East Antarctica relative to West Antarctica at periods of 20–30 s (Figure 4a).At these periods phase velocities are highly sensitive to crustal thickness, and slower velocities are indicativeof regions with thicker crust. Prominent slow phase velocities are localized beneath the GamburtsevSubglacial Mountains (GSM), where previous receiver functions, gravity, and surface wave studies indicatecrustal thickness greater than 50 km [Hansen et al., 2010; Ferraccioli et al., 2011; Heeszel et al., 2013].
At longer periods for which phase velocities sample mantle depths, we observe velocities that are fasterthan the 1-D average model in the interior of East Antarctica. Due to the smoothing length (240 km)required in assembling this geographically extensive model, we are unable to image the East Antarcticcraton with as high resolution as obtained in the Heeszel et al. [2013] study, which focused on EastAntarctica using only data from the array of seismic stations surrounding the GSM. Thus, we will focus mostof our discussion on West Antarctica, which has not been previously imaged with surface wave phasevelocity tomography using local stations.
The phase velocity tomography shows that West Antarctica has a structure that is much different fromEast Antarctica. The shortest period observations (18–30 s) have significantly faster phase velocities com-pared to East Antarctica (Figure 4a). This is consistent with the region’s thinner crust [Winberry andAnandakrishnan, 2004; Chaput et al., 2014] due to extension during the Mesozoic and Cenozoic [Candeet al., 2000; Siddoway et al., 2004; Siddoway, 2008;Wilson and Luyendyk, 2009; Granot et al., 2010]. At longerperiods (Figures 4b–4d), phase velocities in West Antarctica are consistently slower than global averagesand much slower than those in East Antarctica. Slow-velocity anomalies are concentrated beneath MarieByrd Land, Ross Island, and in the Ross Sea region, extending inland toward the Central Transantarctic
Figure 5. A posteriori standard error plot at different periods for the 2-D phase velocity inversion. Labels are the same asin Figure 1.
Journal of Geophysical Research: Solid Earth 10.1002/2015JB012616
HEESZEL ET AL. MANTLE STRUCTURE OF WEST ANTARCTICA 1765

Mountains. These relatively narrow phasevelocity anomalies appear to broaden withincreasing period (Figure 4d). At the long-est periods (>100 s) anomalous slow-velocity structure is centered beneathMarie Byrd Land.
4.2. Shear Velocities
Moho depths determined by the MonteCarlo inversion are shown in Figure 6. Inmost regions Moho depths do not deviatesignificantly from the a priori Moho depthsbased on the receiver function and noise cor-relation results. Thus, the surface wave dataare generally well fit by the previous esti-mates. Although crustal velocities are solvedfor by both the linear and the Monte Carloinversions, the resulting velocities are gener-ally not well constrained. Since the meanWest Antarctic crustal thickness is only about25 km, Rayleigh wave phase velocities fromperiods shorter than 18 s, the minimum per-iod of teleseismic surface wave studies,would be required to develop good crustalmodels. In addition, the crustal layers usedin the inversions were fixed to rather arbi-trary thicknesses. Therefore, we do not inter-pret or discuss the crustal model further.
Upper mantle velocity structure (Figure 7) shows the exceptionally strong velocity contrast betweenEast and West Antarctica throughout the entire depth of good resolution. The high-velocity continentallithosphere of the East Antarctic craton extends to depths greater than 220 km (Figure 7d). WestAntarctica is characterized by slower mantle velocities, with the exception of the region between theEllsworth-Whitmore Mountains and Coats Land. Prominent upper mantle slow-velocity anomalies arecentered on Ross Island and the Terror Rift, the Marie Byrd Land dome, and the Central TAMS, extendingto at least 200 km depth (Figure 7c). Cross-section plots show that the West Antarctic slow-velocityanomalies lie beneath a high-velocity lithosphere of variable thickness (Figure 8). Spatial resolutionbecomes limited at 220 km depth, but the slowest velocities become centered beneath the Marie ByrdLand dome.
5. Discussion5.1. East Antarctic Craton
The East Antarctic craton is defined by fast seismic velocities to depths of greater than 200 km throughoutthe region (Figure 7d). The velocity anomalies in this region are consistent with the bulk of East Antarcticabeing composed of Archean/Paleoproterozoic crustal blocks that were assembled during the Precambrian[Elliot, 1975; Dalziel, 1991; Boger et al., 2001; Fitzsimons, 2000a, 2000b, 2003; Goodge et al., 2010; Goodge andFinn, 2010; Boger, 2011]. A cross section extending from the southward extension of the Lambert RiftSystem (RFS) across the Gamburtsev Subglacial Mountains (GSM) and Wilkes Subglacial Basin and termi-nating in the Ross Sea region (Figure 8a) shows high mantle seismic velocities and thick crust underlyingmuch of the craton. The region of greatest lithospheric thickness extends across the GSM and generallycorrelates with the thickest crust and the highest elevations. A more detailed, higher-resolution study ofthe surface wave structure of central East Antarctica as well as further discussion is presented in Heeszelet al. [2013].
Figure 6. Map of crustal thicknesses resulting from the Monte Carloinversion of surface wave velocities. Seismic station locations areshown as black triangles, and labels are the same as in Figure 1.
Journal of Geophysical Research: Solid Earth 10.1002/2015JB012616
HEESZEL ET AL. MANTLE STRUCTURE OF WEST ANTARCTICA 1766

5.2. Thermal Anomalies Beneath the Transantarctic Mountains and the Western Ross Sea
A region of slow seismic velocity in the upper mantle (60–120 km depth) follows the TAMS from the RossIsland region through the central TAMS and joins another slow-velocity anomaly extending across theWARS near the Whitmore Mountains. Watson et al. [2006] and Lawrence et al. [2006a, 2006b, 2006c] notedlow velocities and high attenuation in the Ross Island region of their studies and attributed it to an uppermantle thermal anomaly. However, due to the limited extent of the array across the Ross Embayment, theywere unable resolve the structure fully or comment on its lateral extent. The results in this study suggest thatthe anomaly occurs along the entire TAM front from the Ross Island region to the Ellsworth-WhitmoreMountains. This alignment of slow velocities follows the approximate trace of thin crustal thicknesses alongthe Terror Rift astride the flank of the TAMS, representing the youngest lithosphere in the Ross Sea [Wilsonand Luyendyk, 2009]. Although extension along the Terror rift initiated at 17Ma, GPS measurements andthe absence of significant seismicity suggest that it is currently relatively inactive [Henrys et al., 2007;Fielding et al., 2008]. Thus, the slow-velocity anomaly in this region may represent a residual area of elevatedtemperatures in the upper mantle along the TAMS side of the Ross Sea remaining from the Miocene to recentextensional tectonism. This is consistent with the modeling of Huerta and Harry [2007], who found evidencefor a progression from diffuse extension early in Ross Sea history to focused extension near the TAM front andthe boundary between East and West Antarctica during the most recent extensional phase.
The slow-velocity anomaly along the TAM front does not vary significantly along the strike of the mountainfront at 60 km depth, but the anomaly in the Ross Island region becomes much larger at greater depths andextends to at least 200 km (Figure 7). Resolution is reduced below 200 km, and it is difficult to determine
Figure 7. Shear velocity maps at depths of (a) 60, (b) 110, (c) 170, and (d) 220 km. Labels are same as in Figure 1. Areas withpoor resolution, as defined by standard error maps (Figure 5), are masked.
Journal of Geophysical Research: Solid Earth 10.1002/2015JB012616
HEESZEL ET AL. MANTLE STRUCTURE OF WEST ANTARCTICA 1767

whether the anomaly extends deeper. This anomaly is in agreement with previous results showing slowseismic velocity anomalies beneath Ross Island [Sieminski et al., 2003; Watson et al., 2006; Lawrence et al.,2006a, 2006b; Hansen et al., 2014]. The results here are consistent with the suggestion that active and recentvolcanism in this region results from a mantle plume [e.g., Kyle et al., 1992], since the inferred thermal anom-aly in the upper 200 km is larger than in surrounding regions. However, the full depth extent of this feature isunknown, and studies of transition zone thickness do not show a thinning in this region, as would beexpected for a mantle plume extending into the lower mantle [Reusch et al., 2008; Emry et al., 2015].
The central to southern TAMS near 86°S, 160°W show larger uppermost mantle velocity anomalies extendingfarther into East Antarctica than elsewhere along the TAMS (Figures 4c and 7b). Block et al. [2009] andO’Donnell and Nyblade [2014] estimated crustal thicknesses in excess of 45 km in the region based on satellitegravity lows, indicating a mass deficit in this region. However, receiver function crustal thickness estimates
Figure 8. Seismic cross sections along the three lines shown in Figure 1. Geographical labels are the same as in Figure 1.(a) A-A′ parallels the long line of TAMSEIS and AGAP/GAMSEIS seismic stations from the Ross Sea coast across theGamburtsev Subglacial Mountains. (b) B-B′ extends from the Amundsen Sea across the West Antarctic Rift System andthe Ross Sea to the Transantarctic Mountains. (c) C-C′ parallels the line of POLENET/ANET stations from the Marie ByrdLand coast across the Whitmore Mountains. Topography from Fretwell et al. [2013] is shown along the top. Crustal structureis not interpreted here.
Journal of Geophysical Research: Solid Earth 10.1002/2015JB012616
HEESZEL ET AL. MANTLE STRUCTURE OF WEST ANTARCTICA 1768

clearly show thinner crustal thickness in this region [Chaput et al., 2014], indicating that the mass deficit doesnot result from a thick crustal root. The mantle structure imaged in this study shows very slow mantle velo-cities extending to 140 km depth. This velocity anomaly, combined with the mass deficit observations fromgravity suggest a thermal anomaly located in the upper mantle extending into East Antarctica. This regionis also notable as the only location along the entire TAMS with late Cenozoic volcanism located on theEast Antarctic side of the mountain range (Mount Early) [Stump et al., 1980; LeMasurier, 1990].
There are two possible interpretations for the broad upper mantle anomaly extending into East Antarctica inthe central TAMS. One possibility is that the extension was relatively concentrated in the Terror Rift area nearRoss Island and at other regions along the TAM front in the Ross Sea area but becomes more diffuse andextended into East Antarctica in the central TAMS region, modifying and reheating the lithosphere in thisregion. Maximum K-Ar ages of volcanics in the area of Mount Early range from 15 to 19Ma [Stump et al.,1980] or approximately the same time as extension initiated on the Terror Rift, suggesting the thermalanomaly in this area formed at the same time as the initiation of early Miocene rifting.
An alternativemodel suggests that the anomalous area of the central TAMS, characterized by high elevations,strong slow mantle velocity anomaly extending into East Antarctica, Cenozoic volcanism, and observed massdeficit in the gravity data, represents a region of lithospheric delamination or destruction. Removal of old,cold continental lithosphere and replacement with warmer asthenospheric material have been associatedwith uplift and mountain building in several regions [Zandt et al., 2004; Frassetto et al., 2011; Bezada et al.,2014]. The location of the anomaly at depths of 70–140 km is consistent with the replacement of continentallithosphere by warm asthenosphere around 17Ma, further supporting this model.
5.3. Lithospheric Structure and Heat Flow of the West Antarctic Rift System
The WARS is characterized by a mantle lid of faster seismic velocities (VS~ 4.4–4.7 km/s) extending to depthsof 70–100 km, underlain by slower velocities (Vs~ 4.2–4.3 km/s) to depths of at least 180 km (Figures 7–8). Inthe low-velocity zone, the slowest anomalies extend across the central WARS, merging with the slow anoma-lies along the TAM front at the Whitmore Mountains to the south and with the large anomaly beneath theMarie Byrd Land (MBL) dome to the north. We interpret the low velocities as indicating a thermal anomalyin the upper mantle, representing thermally perturbed mantle from Mesozoic through Cenozoic extensionin the WARS [Siddoway, 2008; Wilson and Luyendyk, 2009; Granot et al., 2010].
We interpret the higher-velocity seismic lid as the seismological expression of a mantle lithosphere of vari-able thickness, consistent with gravity modeling near the TAM front [Huerta, 2007]. The central WARSbetweenMBL and Ellsworth-Whitmore Mountains (EWM) shows slower lid velocities and inferred lithosphericthicknesses of about 70 km, whereas the eastern Ross Sea coastal regions show faster lid velocities and litho-spheric thicknesses of up to 100 km (Figure 8b). The eastern Ross Sea and adjacent coast is thought to be thesite of the oldest extension in the region, with ages of approximately 100–70Ma [Wilson and Luyendyk, 2009],so that the thicker and faster lithosphere is consistent with significant cooling of the lithosphere since thecessation of tectonic activity inferred for this area.
There has been considerable discussion about the possibility of high geothermal heat flow in West Antarcticaand its probable effects on the West Antarctic Ice Sheet [Pollard et al., 2005; Vogel and Tulaczyk, 2006; Larouret al., 2012]. However, the heat flow is poorly constrained by existingmeasurements andmodeling. High heatflow has been estimated from the WAIS ice core [Clow et al., 2012], and a recent heat flowmeasurement frombeneath Subglacial Lake Whillans estimated an extremely high flux of 285 ± 85mW/m2 [Fisher et al., 2015].Radar observations of subglacial water along with a hydrologic model suggest an average geothermal fluxof about 115mW/m2 in the Thwaites Glacier catchment [Schroeder et al., 2014]. Earlier estimates of the aver-age heat flow of West Antarctica from lower resolution seismic studies suggest heat flow of 100–125mW/m2
for central west Antarctica [Shapiro and Ritzwoller, 2004], although estimates based on the depth of the Curieisotherm from satellite magnetic studies are much less [Maule et al., 2005].
The presence of a thin but significant lithosphere places an upper bound on the average heat flow estimatedin the WARS and MBL. A rough steady state calculation can be made assuming that the bottom of the litho-sphere represents the intersection of a mantle adiabat with a conductive cooling thermal gradient in thelithosphere, assuming average values of crustal heat generation. Such calculations suggest that lithospherethicknesses of 70 km are compatible with surface geothermal heat flow values of 70–80mW/m2, whereas
Journal of Geophysical Research: Solid Earth 10.1002/2015JB012616
HEESZEL ET AL. MANTLE STRUCTURE OF WEST ANTARCTICA 1769

thicknesses of 100 km correspond to heat flow of 60–70mW/m2 (see for example Figure 3 in Lee et al. [2011]).The latter estimate corresponds well with the measured heat flow of 69mW/m2 measured from the SipleDome drill core near the east coast of the Ross Sea [Engelhardt, 2004], where we find thicker lithosphere.Conversely, the observed lithospheric thicknesses are incompatible with the highest heat flow measure-ments. It is possible that the geothermal gradient beneath the WARS is not steady state, with the lower litho-sphere recently undergoing large-scale heating, for example, by asthenospheric flow from an MBL plume.However, in this case there would have been insufficient time for the high heat flow from the recent altera-tion of the lower lithosphere to propagate to the surface. For recent activity (within the last ~ 10Ma), onlyvery shallow perturbations will be expressed as increased surface heat flow, and the presence of the litho-sphere shows that such shallow thermal perturbations have not occurred over large regions. Thus,allowing for reasonable uncertainties in the various parameters, we can estimate the maximum possiblegeothermal heat flow averaged over large regions of the WARS to be about 90mW/m2.
While the above provides an estimate of average regional heat flux, there is also a variety of evidence forlocally higher geothermal heat flow beneath the WARS, including heat flow measurements [Clow et al.,2012; Fisher et al., 2015], estimates from aerogeophysics [Schroeder et al., 2014], and evidence of recent sub-glacial and active intracrustal magmatism [e.g., Blankenship et al., 1993; Behrendt et al., 1994; Lough et al.,2013]. Because of the large smoothing length of long period Rayleigh waves, this study lacks the resolutionto resolve small regions of thermally perturbed lithosphere that may correspond to limited Neogene exten-sional activity. A recent body wave tomographic study [Lloyd et al., 2015] with higher spatial resolution butreduced depth resolution across West Antarctica inferred a geographically limited mantle thermal anomalyassociated with the Bentley Trench and associated crustal thinning [Chaput et al., 2014] just north of theEWM and suggested it corresponded to a limited Neogene extension event coincident with the Terror Riftin the Ross Sea region [Henrys et al., 2007; Fielding et al., 2008; Granot et al., 2010]. Thus, isolated measure-ments of high heat flow may indicate localized areas of recent tectonic activity. Higher-resolution seismicmodels mapping the upper mantle structure of West Antarctica will be required to provide better constraintson mantle thermal structure and the regional variation of heat flow on smaller spatial scale lengths.
5.4. The Ellsworth-Whitmore Mountains: A Distinct Province of Altered Precambrian Lithosphere
The Ellsworth-Whitmore Mountains (EWM) crustal block of West Antarctica is a region of GondwanaPrecambrian cratonic margin crust that has been incorporated into West Antarctica [Dalziel and Elliot,1982; Grunow et al., 1987; Randall and Mac Niocaill, 2004]. Rayleigh wave phase velocities in the region arewell fit by crustal thicknesses greater than that of the WARS (Figure 6), consistent with crustal thicknessesof 30–37 km obtained from receiver functions [Chaput et al., 2014], but much less than the 40–55 km thickcrust found in the East Antarctic Craton [Hansen et al., 2009, 2010; An et al., 2015]. The results shown here indi-cate that the uppermost mantle structure of the region is also distinct from both the WARS and EastAntarctica. The low asthenospheric velocities of the WARS are bounded by the EWM, and velocities at100 km depth are about 4.4 km/s as compared to 4.25 km/s for the WARS and 4.6 km/s for East Antarctica(Figures 7b and 8c). Better spatial resolution of this region is provided by shear wave body wave tomography[Lloyd et al., 2015], which shows a velocity transition along the POLENET/ANET line of seismographsoccurs about 150 km north of the crest of the Whitmore Mountains, with mantle velocities at depths of100–200 km beneath the Whitmore Mountains being about 4% higher than beneath the WARS, consistentwith this study.
Our results are consistent with the interpretation of the EWM as a Precambrian terrain originally locatedbetween the East Antarctic and African cratons, as indicated by inferred Grenvillian age crustal basement[Curtis et al., 1999]. The lithosphere was then significantly altered before or during Gondwana breakup whenit was translated as a rotated into its current tectonic position [Randall and Mac Niocaill, 2004]. The intermedi-ate upper mantle velocities found in this study are consistent with a continental lithosphere block that hasbeen significantly thinned or thermally altered during those tectonic events. However, the lithosphere issignificantly thicker and cooler than lithosphere throughout most of the WARS, which has been thermallyrejuvinated by much more recent Cretaceous through Neogene extension. It is also possible that althoughGrenvillian age rocks are exposed to the north of the Ellsworth Mountains, the basement between theEllsworth and Whitmore Mountains may be early Paleozoic Ross orogen magmatic arc rocks, with inherentlythinner and less distinctive lithospheric velocity and thickness.
Journal of Geophysical Research: Solid Earth 10.1002/2015JB012616
HEESZEL ET AL. MANTLE STRUCTURE OF WEST ANTARCTICA 1770
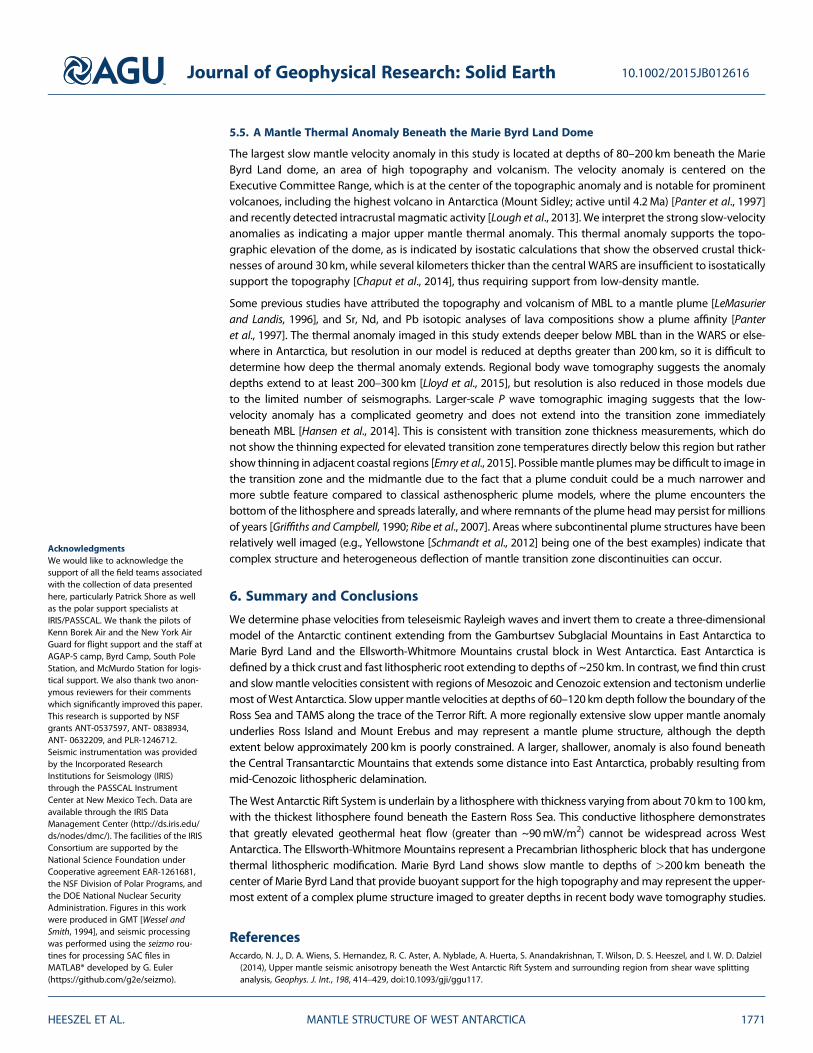
5.5. A Mantle Thermal Anomaly Beneath the Marie Byrd Land Dome
The largest slow mantle velocity anomaly in this study is located at depths of 80–200 km beneath the MarieByrd Land dome, an area of high topography and volcanism. The velocity anomaly is centered on theExecutive Committee Range, which is at the center of the topographic anomaly and is notable for prominentvolcanoes, including the highest volcano in Antarctica (Mount Sidley; active until 4.2Ma) [Panter et al., 1997]and recently detected intracrustal magmatic activity [Lough et al., 2013]. We interpret the strong slow-velocityanomalies as indicating a major upper mantle thermal anomaly. This thermal anomaly supports the topo-graphic elevation of the dome, as is indicated by isostatic calculations that show the observed crustal thick-nesses of around 30 km, while several kilometers thicker than the central WARS are insufficient to isostaticallysupport the topography [Chaput et al., 2014], thus requiring support from low-density mantle.
Some previous studies have attributed the topography and volcanism of MBL to a mantle plume [LeMasurierand Landis, 1996], and Sr, Nd, and Pb isotopic analyses of lava compositions show a plume affinity [Panteret al., 1997]. The thermal anomaly imaged in this study extends deeper below MBL than in the WARS or else-where in Antarctica, but resolution in our model is reduced at depths greater than 200 km, so it is difficult todetermine how deep the thermal anomaly extends. Regional body wave tomography suggests the anomalydepths extend to at least 200–300 km [Lloyd et al., 2015], but resolution is also reduced in those models dueto the limited number of seismographs. Larger-scale P wave tomographic imaging suggests that the low-velocity anomaly has a complicated geometry and does not extend into the transition zone immediatelybeneath MBL [Hansen et al., 2014]. This is consistent with transition zone thickness measurements, which donot show the thinning expected for elevated transition zone temperatures directly below this region but rathershow thinning in adjacent coastal regions [Emry et al., 2015]. Possiblemantle plumesmay be difficult to image inthe transition zone and the midmantle due to the fact that a plume conduit could be a much narrower andmore subtle feature compared to classical asthenospheric plume models, where the plume encounters thebottom of the lithosphere and spreads laterally, andwhere remnants of the plume headmay persist for millionsof years [Griffiths and Campbell, 1990; Ribe et al., 2007]. Areas where subcontinental plume structures have beenrelatively well imaged (e.g., Yellowstone [Schmandt et al., 2012] being one of the best examples) indicate thatcomplex structure and heterogeneous deflection of mantle transition zone discontinuities can occur.
6. Summary and Conclusions
We determine phase velocities from teleseismic Rayleigh waves and invert them to create a three-dimensionalmodel of the Antarctic continent extending from the Gamburtsev Subglacial Mountains in East Antarctica toMarie Byrd Land and the Ellsworth-Whitmore Mountains crustal block in West Antarctica. East Antarctica isdefined by a thick crust and fast lithospheric root extending to depths of ~250 km. In contrast, we find thin crustand slowmantle velocities consistent with regions of Mesozoic and Cenozoic extension and tectonism underliemost ofWest Antarctica. Slow uppermantle velocities at depths of 60–120 km depth follow the boundary of theRoss Sea and TAMS along the trace of the Terror Rift. A more regionally extensive slow upper mantle anomalyunderlies Ross Island and Mount Erebus and may represent a mantle plume structure, although the depthextent below approximately 200 km is poorly constrained. A larger, shallower, anomaly is also found beneaththe Central Transantarctic Mountains that extends some distance into East Antarctica, probably resulting frommid-Cenozoic lithospheric delamination.
TheWest Antarctic Rift System is underlain by a lithosphere with thickness varying from about 70 km to 100 km,with the thickest lithosphere found beneath the Eastern Ross Sea. This conductive lithosphere demonstratesthat greatly elevated geothermal heat flow (greater than ~90mW/m2) cannot be widespread across WestAntarctica. The Ellsworth-Whitmore Mountains represent a Precambrian lithospheric block that has undergonethermal lithospheric modification. Marie Byrd Land shows slow mantle to depths of >200km beneath thecenter of Marie Byrd Land that provide buoyant support for the high topography andmay represent the upper-most extent of a complex plume structure imaged to greater depths in recent body wave tomography studies.
ReferencesAccardo, N. J., D. A. Wiens, S. Hernandez, R. C. Aster, A. Nyblade, A. Huerta, S. Anandakrishnan, T. Wilson, D. S. Heeszel, and I. W. D. Dalziel
(2014), Upper mantle seismic anisotropy beneath the West Antarctic Rift System and surrounding region from shear wave splittinganalysis, Geophys. J. Int., 198, 414–429, doi:10.1093/gji/ggu117.
Journal of Geophysical Research: Solid Earth 10.1002/2015JB012616
HEESZEL ET AL. MANTLE STRUCTURE OF WEST ANTARCTICA 1771
AcknowledgmentsWe would like to acknowledge thesupport of all the field teams associatedwith the collection of data presentedhere, particularly Patrick Shore as wellas the polar support specialists atIRIS/PASSCAL. We thank the pilots ofKenn Borek Air and the New York AirGuard for flight support and the staff atAGAP-S camp, Byrd Camp, South PoleStation, and McMurdo Station for logis-tical support. We also thank two anon-ymous reviewers for their commentswhich significantly improved this paper.This research is supported by NSFgrants ANT-0537597, ANT- 0838934,ANT- 0632209, and PLR-1246712.Seismic instrumentation was providedby the Incorporated ResearchInstitutions for Seismology (IRIS)through the PASSCAL InstrumentCenter at New Mexico Tech. Data areavailable through the IRIS DataManagement Center (http://ds.iris.edu/ds/nodes/dmc/). The facilities of the IRISConsortium are supported by theNational Science Foundation underCooperative agreement EAR-1261681,the NSF Division of Polar Programs, andthe DOE National Nuclear SecurityAdministration. Figures in this workwere produced in GMT [Wessel andSmith, 1994], and seismic processingwas performed using the seizmo rou-tines for processing SAC files inMATLAB® developed by G. Euler(https://github.com/g2e/seizmo).

An, M., D. A. Wiens, Y. Zhao, M. Feng, A. A. Nyblade, M. Kanao, Y. Li, A. Maggi, and J. J. Lévêque (2015), S-velocity model and inferred Mohotopography beneath the Antarctic Plate from Rayleigh waves, J. Geophys. Res. Solid Earth, 120, 359–383, doi:10.1002/2014JB011332.
Behrendt, J. C., D. D. Blankenship, C. A. Finn, R. E. Bell, R. E. Sweeney, S. M. Hodge, and J. M. Brozena (1994), Casertz aeromagnetic data reveallate Cenozoic flood basalts (?) in the West Antarctic Rift System, Geology, 22, 527–530.
Bezada, M. J., E. D. Humphreys, J. M. Davila, and R. Carbonell (2014), Piecewise delamination of Moroccan lithosphere from beneath the AtlasMountains, Geochem. Geophys. Geosyst., 15, 975–985, doi:10.1002/2013GC005059.
Blankenship, D. D., R. E. Bell, S. M. Hodge, J. M. Brozena, J. C. Behrendt, and C. A. Finn (1993), Active volcanism beneath the West Antarctic IceSheet and implications for ice-sheet stability, Nature, 361, 526–529.
Block, A. E., R. E. Bell, and M. Studinger (2009), Antarctic crustal thickness from satellite gravity: Implications for the Transantarctic andGamburtsev Subglacial Mountains, Earth Planet. Sci. Lett., 288, 194–203, doi:10.1016/j.epsl.2009.09.022.
Boger, S. D. (2011), Antarctica—Before and after Gondwana, Precambrian Res., 19, 335–371, doi:10.1016/j.gr.2010.09.003.Boger, S. D., C. J. L. Wilson, and C. M. Fanning (2001), Early Paleozoic tectonism within the East Antarctic craton: The final suture between east
and west Gondwana?, Geology, 29(5), 463–466, doi:10.1130/0091-7613(2001)029<0463:EPTWTE>2.0.CO;2.Cande, S. C., J. M. Stock, R. D. Müller, and T. Ishihara (2000), Cenozoic motion between East and West Antarctica, Nature, 404, 145–150,
doi:10.1038/35004501.Chaput, J., R. C. Aster, A. Huerta, X. Sun, A. Lloyd, D. Wiens, A. Nyblade, S. Anandakrishnan, J. P. Winberry, and T. Wilson (2014), The crustal
thickness of West Antarctica, J. Geophys. Res. Solid Earth, 119, 378–395, doi:10.1002/2013JB010642.Clow, G. D., K. M. Cuffey, and E. D. Waddington (2012), High heat-flow beneath the central portion of the West Antarctic ice sheet, In AGU Fall
Meeting Abstracts (p. 0577).Cooper, A. K., and F. J. Davey (1985), Episodic rifting of Phanerozoic rocks in the Victoria Land Basin, western Ross Sea, Antarctica, Science,
229(4718), 1085–1087.Corr, H. F. J., and D. G. Vaughan (2008), A recent volcanic eruption beneath the West Antarctic ice sheet, Nat. Geosci., 1, 122–125, doi:10.1038/
ngeo106.Curtis, M. L., P. T. Leat, T. R. Riley, B. C. Storey, I. L. Millar, and D. E. Randall (1999), Middle Cambrian rift-related volcanism in the Ellsworth
Mountains, Antarctica: Tectonic implications for the palaeo-Pacific margin of Gondwana, Tectonophysics, 304, 275–299.Dalziel, I. W. D. (1991), Pacific margins of Laurentia and East Antarctica-Australia as a conjugate rift pair: Evidence and implications for an
Eocambrian supercontinent, Geology, 19, 598–601.Dalziel, I. W. D., and D. H. Elliot (1982), West Antarctica: Problem child of Gondwanaland, Tectonics, 1(1), 3–19.Danesi, S., and A. Morelli (2000), Group velocity of Rayleigh waves in the Antarctic region, Phys. Earth Planet Int., 122, 55–66, doi:10.1016/
S0031-9201(00)00186-2.Danesi, S., and A. Morelli (2001), Structure of the upper mantle under the Antarctic Plate from surface wave tomography, Geophys. Res. Lett.,
28(23), 4395–4398.Davey, F. J., and G. Brancolini (1995), The late Mesozoic and Cenozoic structural setting of the Ross Sea region, Antarct. Res. Ser., 68, 167–182.Davey, F. J., S. C. Cande, and J. M. Stock (2006), Extension in the western Ross Sea region-links between Adare Basin and Victoria Land Basin,
Geophys. Res. Lett., 33, L20315, doi:10.1029/2006GL027383.DiVenere, V. J., D. V. Kent, and I. W. D. Dalziel (1994), Mid-Cretaceous paleomagnetic results from Marie Byrd Land, West Antarctica: A test of
post-100 Ma relative motion between East and West Antarctica, J. Geophys. Res., 99(B8), 15,115–15,139.Dziewonski, A. M., and D. L. Anderson (1981), Preliminary reference Earth model, Phys. Earth Planet. Inter., 25, 297–356.Elliot, D. H. (1975), Tectonics of Antarctica: A review, Am. J. Sci., 275(A), 45–106.Emry, E. L., A. A. Nyblade, J. Julià, S. Anandakrishnan, R. C. Aster, D. A. Wiens, A. D. Huerta, and T. J. Wilson (2015), The mantle transition zone
beneath West Antarctica: Seismic evidence for hydration and thermal upwellings, Geochem. Geophys. Geosyst., 16, 40–58, doi:10.1002/2014GC005588.
Engelhardt, H. (2004), Ice temperature and high geothermal flux at Siple Dome, West Antarctica, from borehole measurements, J. Glaciol., 50,251–256.
Ferraccioli, F., E. Armadillo, T. Jordan, E. Bozzo, and H. Corr (2009), Aeromagnetic exploration over the East Antarctic Ice Sheet: A new view ofthe Wilkes Subglacial Basin, Tectonophysics, 478, 62–77, doi:10.1016/j.tecto.2009.03.013.
Ferraccioli, F., C. A. Finn, T. A. Jordan, R. E. Bell, L. M. Anderson, and D. Damaske (2011), East Antarctic rifting triggers uplift of the GamburtsevMountains, Nature, 479, 388–392, doi:10.1038/nature10566.
Fielding, C. R., J. Whittaker, S. A. Henrys, T. J. Wilson, and T. R. Naish (2008), Seismic facies and stratigraphy of the Cenozoic succession inMcMurdo Sound, Antarctica: Implications for tectonic, climatic and glacial history, Palaeogeogr. Palaeoclimatol. Palaeoecol., 260(1),8–29.
Finotello, M., A. Nyblade, J. Julia, D. A. Wiens, and S. Anandakrishnan (2011), Crustal Vp-Vs ratios and thickness for Ross Island and theTransantarctic Mountain front, Antarctica, Geophys. J. Int., 185, 85–92, doi:10.1111/j.1365-246X.2011.04946.x.
Fisher, A. T., K. D. Mankoff, S. M. Tulaczyk, S. W. Tyler, and N. Foley (2015), High geothermal heat flux measured below the West Antarctic IceSheet, Sci. Adv., 1(6), e1500093, doi:10.1126/sciadv.1500093.
Fitzsimons, I. C. W. (2000a), A review of tectonic events in the East Antarctic Shield and their implications for Gondwana and earliersupercontinents, J. Afr. Earth Sci., 31(1), 3–23.
Fitzsimons, I. C. W. (2000b), Grenville-age basement provinces in East Antarctica: Evidence for three separate collisional orogens, Geology,28(10), 879–882, doi:10.1130/0091-7613(2000)28<879:GBPIEA>2.0.CO;2.
Fitzsimons, I. C. W. (2003), Proterozoic basement provinces in southern and southwestern Australia, and their correlation with Antarctica, inProterozoic East Gondwana: Supercontinent Assembly and Breakup, Geol. Soc. London Spec. Publ., edited by M. Yoshida, B. F. Windley, andS. Dasgupta, pp. 93–130, London.
Forsyth, D. W., and A. Li (2005), Array analysis of two-dimensional variations in surface wave phase velocity and azimuthal anisotropy in thepresence of multipathing interference, in Seismic Earth: Array Analysis of Broadband Seismograms, edited by A. Levander and G. Nolet,pp. 81–97, AGU, Washington, D. C.
Frassetto, A., G. Zandt, H. Gilbert, T. J. Owens, and C. H. Jones (2011), Lithospheric structure of the Sierra Nevada from receiver functions andimplications for lithospheric foundering, Geosphere, 7, 898–921, doi:10.1130/GES00570.1.
Fretwell, P., et al. (2013), Bedmap2: Improved ice bed, surface and thickness datasets for Antarctica, Cryosphere, 7, 375–393, doi:10.5194/tc-7-375-2013.
Goodge, J. W., and C. M. Fanning (2010), Composition and age of the East Antarctic Shield in eastern Wilkes Land determined by proxy ofOligocene-Pleistocene glaciomarine sediment and Beacon Supergroup sandstones, Antarctica, Geol. Soc. Am. Bull., 122, 1135–1159,doi:10.1130/B30079.1.
Journal of Geophysical Research: Solid Earth 10.1002/2015JB012616
HEESZEL ET AL. MANTLE STRUCTURE OF WEST ANTARCTICA 1772

Goodge, J. W., and C. A. Finn (2010), Glimpses of East Antarctica: Aeromagnetic and satellite magnetic view from the central TransantarcticMountains of East Antarctica, J. Geophys. Res., 115, B09103, doi:10.1029/2009JB006890.
Goodge, J. W., C. M. Fanning, and V. C. Bennett (2001), U-Pb evidence of ~1.7 Ga crustal tectonism during the Nimrod Orogeny in theTransantarctic Mountains, Antarctica: Implications for Proterozoic plate reconstructions, Precambrian Res., 112, 261–288.
Goodge, J. W., C. M. Fanning, D. M. Brecke, K. J. Licht, and E. F. Palmer (2010), Continuation of the Laurentian Grenville Province across theRoss Sea Margin of East Antarctica, J. Geol., 118(6), 601–619, doi:10.1086/656385.
Granot, R., S. C. Cande, J. M. Stock, F. J. Davey, and R. W. Clayton (2010), Postspreading rifting in the Adare Basin, Antarctica: Regional tectonicconsequences, Geochem. Geophys. Geosyst., 11, Q08005, doi:10.1029/2010GC003105.
Granot, R., S. C. Cande, J. M. Stock, and D. Damaske (2013), Revised Eocene-Oligocene kinematics for the West Antarctic rift system,Geophys. Res. Lett., 40, 279–284, doi:10.1029/2012GL054181.
Griffiths, R. W., and I. H. Campbell (1990), Stirring and structure in mantle starting plumes, Earth Planet. Sci. Lett., 99, 66–78.Grunow, A. M., I. W. D. Dalziel, and D. V. Kent (1987), Ellsworth-Whitmore Mountains Crustal Block, Western Antarctica: New paleomagnetic
results and their tectonic significance, in Gondwana Six: Structure, Tectonics, and Geophysics, pp. 161–171, AGU, Washington, D. C.Grunow, A. M., D. V. Kent, and I. W. D. Dalziel (1991), New paleomagnetic data from Thurston Island: Implications for the tectonics of West
Antarctica and Weddell Sea opening, J. Geophys. Res., 96(B11), 17,935–17,954.Hansen, S. E., J. Julià, A. A. Nyblade, M. L. Pyle, D. A. Wiens, and S. Anandakrishnan (2009), Using S wave receiver functions to estimate crustal
structure beneath ice sheets: An application to the Transantarctic Mountains and East Antarctic craton, Geochem. Geophys. Geosyst., 10,Q08014, doi:10.1029/2009GC002576.
Hansen, S. E., A. A. Nyblade, D. S. Heeszel, D. A. Wiens, P. J. Shore, and M. Kanao (2010), Crustal structure of the Gamburtsev Mountains,East Antarctica, from S-wave receiver functions and Rayleigh wave phase velocities, Earth Planet. Sci. Lett., 300, 395–401, doi:10.1016/j.epsl.2010.10.022.
Hansen, S. E., J. H. Graw, L. M. Kenyon, A. A. Nyblade, D. A. Wiens, R. C. Aster, A. D. Huerta, S. Anandakrishnan, and T. Wilson (2014), Imagingthe Antarctic mantle using adaptively parameterized P-wave tomography: Evidence for heterogeneous structure beneath WestAntarctica, Earth Planet. Sci. Lett., 408, 66–78.
Heeszel, D. S., D. A. Wiens, A. A. Nyblade, S. E. Hansen, M. Kanao, M. An, and Y. Zhao (2013), Rayleigh wave constraints on the structure andtectonic history of the Gamburtsev Subglacial Mountains, East Antarctica, J. Geophys. Res. Solid Earth, 118, 2138–2153, doi:10.1002/jgrb.50171.
Henrys, S. A., T. J. Wilson, J. M. Whittaker, C. R. Fielding, J. M. Hall, and T. Naish (2007), Tectonic history of mid-Miocene to present southernVictoria Land Basin, inferred from seismic stratigraphy in McMurdo Sound, Antarctica, in Antarctica: A Keystone in a Changing World –
Online Proceedings of the 10th ISAES, U.S. Geol. Surv. Open File Rep. 2007-1047, Short Res. Pap. 049, edited by A. K. Cooper et al., 4 pp.,doi:10.3133/of2007-1047.srp049.
Herrmann, R. B., and C. J. Ammon (2002), Computer Programs in Seismology: Surface Waves, Receiver Functions and Crustal Structure, 110 pp.,St. Louis Univ, St. Louis, Mo.
Hole, M. J., and W. E. LeMasurier (1994), Tectonic controls on the geochemical composition of Cenozoic, mafic alkaline volcanic rocks fromWest Antarctica, Contib. Mineral. Petrol., 117, 187–202.
Huerta, A. D. (2007), Lithospheric structure across the Transantarctic Mountains constrained by an analysis of gravity and thermal structure,in Antarctica: A Keystone in a Changing World, U.S. Geol. Surv. Open File Rep. 2007-1047, edited by A. K. Cooper and C. R. Raymond, pp. 1–4,U.S. Geol. Surv., Reston, Va.
Huerta, A. D., and D. L. Harry (2007), The transition from diffuse to focused extension: Modeled evolution of the West Antarctic Rift system,Earth Planet. Sci. Lett., 255, 133–147, doi:10.1016/j.epsl.2006.12.011.
Ivins, E. R., and C. G. Sammis (1995), On lateral viscosity contrast in the mantle and the rheology of low frequency geodynamics, Geophys. J.Int., 123, 305–322.
Jankowski, E. J., and D. J. Drewry (1981), The structure of West Antarctica from geophysical studies, Nature, 291, 17–21, doi:10.1038/291017a0.Jordan, T. A., F. Ferraccioli, D. G. Vaughan, J. W. Holt, H. Corr, D. D. Blankenship, and T. M. Diehl (2010), Aerogravity evidence for major crustal
thinning under the Pine Island Glacier region (West Antarctica), Geol. Soc. Am. Bull., 122(5–6), 714–726.Kyle, P. R., J. A. Moore, and M. F. Thirlwall (1992), Petrologic evolution of anorthoclase phonolite lavas at Mount Erebus, Ross Island,
Antarctica, J. Petrol., 33, 849–875.Larour, E., M. Morlighem, H. Seroussi, J. Schiermeier, and E. Rignot (2012), Ice flow sensitivity to geothermal heat flux of Pine Island Glacier,
Antarctica, J. Geophys. Res., 117, F04023, doi:10.1029/2012JF002371.Lawrence, J. F., D. A. Wiens, A. A. Nyblade, S. Anandakrishnan, P. J. Shore, and D. Voigt (2006a), Crust and upper mantle structure of the
Transantarctic Mountains and surrounding regions from receiver functions, surface waves, and gravity: Implications for uplift models,Geochem. Geophys. Geosyst., 7, Q10011, doi:10.1029/2006GC001282.
Lawrence, J. F., D. A. Wiens, A. A. Nyblade, S. Anandakrishnan, P. J. Shore, and D. Voigt (2006b), Upper mantle thermal variations beneath theTransantarctic Mountains inferred from teleseismic S-wave attenuation, Geophys. Res. Lett., 33, L03303, doi:10.1029/2005GL024516.
Lawrence, J. F., D. A. Wiens, A. A. Nyblade, S. Anandakrishnan, P. J. Shore, and D. Voigt (2006c), Rayleigh wave phase velocity analysis of theRoss Sea, Transantarctic Mountains, and East Antarctica from a temporary seismograph array, J. Geophys. Res., 111, B06302, doi:10.1029/2005JB003812.
Lee, C.-T. A., P. Luffi, and E. J. Chin (2011), Building and destroying continental mantle, Ann Rev. Earth Planet. Sci., 39, 59–90.LeMasurier, W. E. (1990), Late Cenozoic volcanism on the Antarctic Plate, in Volcanoes of the Antarctic Plate and Southern Oceans, Antarct. Res.
Ser., vol. 48, edited by W. E. LeMasurier and J. W. Thomson, AGU, Washington, D. C.LeMasurier, W. E., and C. A. Landis (1996), Mantle-plume activity recorded by low-relief erosion surfaces in West Antarctica and New Zealand,
Geol. Soc. Am. Bull., 108, 1450–1466, doi:10.1130/0016-7606.Li, A., D. W. Forsyth, and K. M. Fischer (2003), Shear velocity structure and azimuthal anisotropy beneath eastern North America from Rayleigh
wave inversion, J. Geophys. Res., 108(B8), 2362, doi: 10.1029/2002JB002259.Lloyd, A. J., A. A. Nyblade, D. A. Wiens, S. E. Hansen, M. Kanao, P. J. Shore, and D. Zhao (2013), Upper mantle seismic structure beneath central
East Antarctica from body wave tomography: Implications for the origin of the Gamburtsev Subglacial Mountains, Geochem. Geophys.Geosyst., 14, 902–920, doi:10.1002/ggge.20098.
Lloyd, A. J., D. A. Wiens, A. A. Nyblade, S. Anandakrishnan, R. C. Aster, A. D. Huerta, T. J. Wilson, I. W. D. Dalziel, P. J. Shore, and D. Zhao (2015), Aseismic transect across West Antarctica: Evidence for mantle thermal anomalies beneath the Bentley Subglacial Trench and the MarieByrd Land Dome, J. Geophys. Res. Solid Earth, 120, 8439–8460.
Lough, A. C., D. A. Wiens, C. G. Barcheck, S. Anandakrishnan, R. C. Aster, D. D. Blankenship, A. D. Huerta, A. Nyblade, D. A. Young, andT. J. Wilson (2013), Seismic detection of an active subglacial magmatic complex in Marie Byrd Land, Antarctica, Nat. Geosci., 6, 1031–1035,doi:10.1038/ngeo1992.
Journal of Geophysical Research: Solid Earth 10.1002/2015JB012616
HEESZEL ET AL. MANTLE STRUCTURE OF WEST ANTARCTICA 1773

Maule, C. F., M. E. Puruckerd, N. Olsen, and K. Mosegaard (2005), Heat flux anomalies in Antarctica revealed by satellite magnetic data,Science, 309, 464–467.
Morelli, A., and S. Danesi (2004), Seismological imaging of the Antarctic continental lithosphere: A review, Global Planet. Change, 42, 155–165,doi:10.1016/j.gloplacha.2003.12.005.
O’Donnell, J. P., and A. A. Nyblade (2014), Antarctica’s hypsometry and crustal thickness: Implications for the origin of anomalous topographyin East Antarctica, Earth Planet. Sci. Lett., 388, 143–155.
Panter, K. S., P. R. Kyle, and J. L. Smellie (1997), Petrogenesis of a phonolite-trachyte succession at Mount Sidley, Marie Byrd Land, Antarctica,J. Petrol., 38(9), 1225–1253.
Paulson, T. S., and T. J. Wilson (2010), Evolution of Neogene volcanism and stress patterns in the glaciated West Antarctic Rift, Marie ByrdLand, Antarctica, J. Geol. Soc. London, 167, 401–416, doi:10.1144/0016-76492009-044.
Pollard, D., R. M. DeConto, and A. A. Nyblade (2005), Sensitivity of Cenozoic Antarctic ice sheet variations to geothermal heat flux, GlobalPlanet. Change, 49(1), 63–74.
Pyle, M. L., D. A. Wiens, A. A. Nyblade, and S. Anandakrishnan (2010), Crustal structure of the Transantarctic Mountains near the Ross Sea fromambient seismic noise tomography, J. Geophys. Res., 115, B11310, doi:10.1029/2009JB007081.
Randall, D. E., and C. Mac Niocaill (2004), Cambrian palaeomagnetic data confirm a Natal Embayment location for the Ellsworth-WhitmoreMountains, Antarctica, in Gondwana reconstructions, Geophys. J. Int., 157(1), 105–116.
Reading, A. M. (2006), The seismic structure of Precambrian and early Palaeozoic terranes in the Lambert Glacier region, East Antarctica,Earth Planet. Sci. Lett., 244, 44–57, doi:10.1016/j.epsl.2006.01.031.
Reusch, A. M., A. A. Nyblade, M. H. Benoit, D. A. Wiens, S. Anandakrishnan, D. Voigt, and P. J. Shore (2008), Mantle transition zone thicknessbeneath Ross Island, the Transantarctic Mountains, and East Antarctica, Geophys. Res. Lett., 35, L12301, doi:10.1029/2008GL033873.
Ribe, N., A. Davaille, and U. R. Christensen (2007), Fluid dynamics of mantle plumes, in Mantle Plumes, pp. 1–48, Springer, Berlin.Ritzwoller, M. H., N. M. Shapiro, A. L. Levshin, and G. M. Leahy (2001), Crustal and upper mantle structure beneath Antarctica and surrounding
oceans, J. Geophys. Res., 106(12), 30,645–30,670.Roult, G., and D. Rouland (1992), Antarctica I: Deep structure investigations inferred from seismology: A review, Phys. Earth Planet. Int., 84,
15–32.Sambridge, M., and K. Mosegaard (2002), Monte-Carlo methods in geophysical inverse problems, Rev. Geophys., 40(3), 1009, doi:10.1029/
2000RG000089.Schmandt, B., K. Dueker, G. Humphreys, and S. Hansen (2012), Hot mantle upwelling across the 660 beneath Yellowstone, Earth Planet. Sci.
Lett., 331–332, 224–236.Schopf, J. M. (1969), Ellsworth Mountains: Position in West Antarctica due to sea-floor spreading, Science, 164(3875), 63–66.Schroeder, D. M., D. D. Blankenship, D. A. Young, and E. Quartini (2014), Evidence for elevated and spatially variable geothermal flux beneath
the West Antarctic Ice Sheet, Proc. Natl. Acad. Sci. U.S.A., 111(25), 9070–9072.Schulte-Pelkum, V., and Y. Ben-Zion (2012), Apparent vertical Moho offsets under continental strike-slip faults from lithology contrasts in the
seismogenic crust, Bull. Seismol. Soc. Am., 102, 2757–1763.Shapiro, N. M., and M. H. Ritzwoller (2002), Monte-Carlo inversion for a global shear-velocity model of the crust and upper mantle, Geophys. J.
Int., 151, 88–105.Shapiro, N. M., and M. H. Ritzwoller (2004), Inferring surface heat flux distributions guided by a global seismic model: Particular application to
Antarctica, Earth Planet. Sci. Lett., 223, 213–224.Shen, W., M. H. Ritzwoller, V. Schulte-Pelkum, and F.-C. Lin (2012), Joint inversion of surface wave dispersion and receiver functions: A
Bayesian Monte-Carlo approach, Geophys. J. Int., 192(2), 807–836, doi:10.1093/gji/ggs050.Siddoway, C. S. (2008), Tectonics of the West Antarctic Rift System: New light on the history and dynamics of distributed intracontinental
extension, in Antarctica: A Keystone in a Changing World, pp. 91–114, Natl. Acad. Press, Washington, D. C.Siddoway, C. S., S. L. Baldwin, P. G. Fitzgerald, C. M. Fanning, and B. P. Luyendyk (2004), Ross Sea mylonites and the timing of intracontinental
extension within the West Antarctic rift system, Geology, 32(1), 57–60, doi:10.1130/G20005.1.Sieminski, A., E. Debayle, and J.-J. Leveque (2003), Seismic evidence for deep low-velocity anomalies in the transition zone beneath West
Antarctica, Earth Planet. Sci. Lett., 216, 645–661, doi:10.1016/S0012-821X(03)00518-1.Stern, T. A., and U. S. ten Brink (1989), Flexural uplift of the Transantarctic Mountains, J. Geophys. Res., 94(B8), 10,315–310,330.Studinger, M., R. E. Bell, W. R. Buck, G. D. Karner, and D. D. Blankenship (2004), Sub-ice geology inland of the Transantarctic Mountains in light
of new aerogeophysical data, Earth Planet. Sci. Lett., 220, 391–408, doi:10.1016/S0012-821X(04)00066-4.Stump, E., M. F. Sheridan, S. G. Borg, and J. F. Sutter (1980), Early Miocene subglacial basalts, the East Antarctic Ice Sheet, and uplift of the
Transantarctic Mountains, Science, 207(4432), 757–759, doi:10.1126/science.207.4432.757.Sun, X., D. A. Wiens, A. Nyblade, S. Anandakrishnan, R. C. Aster, J. A. Chaput, A. D. Huerta, and T. J. Wilson (2013), Three dimensional crust and
upper mantle velocity structure of Antarctica from seismic noise correlation, Abstract T12A-02 presented at 2013 Fall Meeting, AGU,San Francisco, Calif., 9-13 Dec.
ten Brink, U. S., and T. A. Stern (1992), Rift flank uplifts and hinterland basins: Comparisons of the Transantarctic Mountains with the GreatEscarpment of Southern Africa, J. Geophys. Res., 97(B1), 569–585.
ten Brink, U. S., S. Bannister, B. C. Beaudoin, and T. A. Stern (1993), Geophysical investigations of the tectonic boundary between East andWest Antarctica, Science, 261, 45–50.
van de Flierdt, T., S. R. Hemming, S. L. Goldstein, G. E. Gehrels, and S. E. Cox (2008), Evidence against a young volcanic origin of theGamburtsev Subglacial Mountains, Antarctica, Geophys. Res. Lett., 35, L21303, doi:10.1029/2008GL035564.
van der Wal, W., P. L. Whitehouse, and E. J. Schrama (2015), Effect of GIA models with 3D composite mantle viscosity on GRACE mass balanceestimates for Antarctica, Earth Planet. Sci. Lett., 414, 134–143.
Vogel, S. W., and S. Tulaczyk (2006), Ice-dynamical constraints on the existence and impact of subglacial volcanism on West Antarctic icesheet stability, Geophys. Res. Lett., 33, L23502, doi:10.1029/2006GL027345.
Watson, T., A. Nyblade, D. A. Wiens, S. Anandakrishnan, M. Benoit, P. J. Shore, D. Voigt, and J. VanDecar (2006), P and S velocity structure of theupper mantle beneath the Transantarctic Mountains, East Antarctic craton, and Ross Sea from travel time tomography, Geochem.Geophys. Geosyst., 7, Q07005, doi:10.1029/2005GC001238.
Weaver, S. D., B. C. Storey, R. J. Pankhurst, S. B. Mukasa, V. J. DiVenere, and J. D. Bradshaw (1994), Antarctica-New Zealand rifting and MarieByrd Land lithospheric magmatism linked to ridge subduction and mantle plume activity, Geology, 22, 811–814.
Wessel, P., and W. H. F. Smith (1998), New, improved version of Generic Mapping Tools released, Eos Trans. AGU, 79(47), 579–579.Wilson, D. S., and B. P. Luyendyk (2006), Bedrock platforms within the Ross Embayment, West Antarctica: Hypotheses for ice sheet history,
wave erosion, Cenozoic extension, and thermal subsidence, Geochem. Geophys. Geosyst., 7, Q12011, doi:10.1029/2006GC001294.
Journal of Geophysical Research: Solid Earth 10.1002/2015JB012616
HEESZEL ET AL. MANTLE STRUCTURE OF WEST ANTARCTICA 1774

Wilson, D. S., and B. P. Luyendyk (2009), West Antarctic paleotopography estimated at the Eocene-Oligocene climate transition, Geophys. Res.Lett., 36, L16302, doi:10.1029/2009GL039297.
Wilson, T. J. (1995), Cenozoic trans-tension along the Transantarctic Mountains-West Antarctic Rift boundary, southern Victoria Land,Antarctica, Tectonics, 14(2), 531–545.
Winberry, J. P., and S. Anandakrishnan (2004), Crustal structure of the West Antarctic rift system and Marie Byrd Land hotspot, Geology,32(11), 977–980, doi:10.1130/G20768.1.
Yang, Y., and D. W. Forsyth (2006), Regional tomographic inversion of the amplitude and phase of Rayleigh waves with 2-D sensitivitykernels, Geophys. J. Int., 166, 1148–1160, doi:10.1111/j.1365-246X.2006.02972.x.
Yang, Y., and M. H. Ritzwoller (2008), Teleseismic surface wave tomography in the western U.S. using the transportable array component ofUSArray, Geophys. Res. Lett., 35, L04308, doi:10.1029/2007GL032278.
Yang, Y., M. H. Ritzwoller, F.-C. Lin, M. P. Moschetti, and N. M. Shapiro (2008), Structure of the crust and uppermost mantle beneath thewestern United States revealed by ambient noise and earthquake tomography, J. Geophys. Res., 113, B12310, doi:10.1029/2008JB005833.
Zandt, G., H. Gilbert, T. J. Owens, M. Ducea, J. Saleeby, and C. H. Jones (2004), Active foundering of a continental arc root beneath thesouthern Sierra Nevada in California, Nature, 431, 41–46.
Zhou, Y., F. A. Dahlen, and G. Nolet (2004), Three-dimensional sensitivity kernels for the surface-wave observables, Geophys. J. Int., 158,142–168, doi:10.1111/j.1365-246X.2004.02324.x.
Journal of Geophysical Research: Solid Earth 10.1002/2015JB012616
HEESZEL ET AL. MANTLE STRUCTURE OF WEST ANTARCTICA 1775