Embed Size (px)
Citation preview
Journal of Oceanology and LimnologyVol. 38 No. 2, P. 314-333, 2020 https://doi.org/10.1007/s00343-019-9059-z
Upper ocean response to typhoon Kujira (2015) in the South China Sea by multiple means of observation*
GUO Jie 1, 2, 3, ** , ZHANG Tianlong 1, 4 , XU Chenqi 1, 4 , XIE Qiang 5 1 Key Laboratory of Coastal Environmental Processes and Ecological Remediation, Yantai Institute of Coastal Zone Research
(YIC), Chinese Academy of Sciences (CAS), Yantai 264003, China 2 Shandong Key Laboratory of Coastal Environmental Processes, YICCAS, Yantai 264003, China 3 Center for Ocean Mega-Science, CAS, Qingdao 266071, China 4 University of Chinese Academy of Sciences, Beijing 100049, China 5 Institute of Deep-sea Science and Engineering, CAS, Sanya 572000, China
Received Apr. 2, 2019; accepted in principle Jun. 4, 2019; accepted for publication Aug. 20, 2019 © Chinese Society for Oceanology and Limnology, Science Press and Springer-Verlag GmbH Germany, part of Springer Nature 2020
Abstract The impact of typhoon Kujira (2015) on the ocean environment around Yongxing Island in the South China Sea was observed using multiple-satellite sensors and on-site data. A subsurface buoy and Agro fl oat were located to the left and lower right of the track of the typhoon. Satellite observations revealed sea surface cooling of up to 2.5°C, a maximum decrease in sea surface salinity of 2 in the main study area because of heavy rain, and increases in the chlorophyll concentration induced by the slow-moving typhoon with a maximum observed instantaneous wind speed of 35.1 m/s. The sea surface temperature to the right of the typhoon track changed more than that on the left owing to a right bias of the typhoon associated with coupling of the typhoon with wind stress on the sea surface. In the ocean interior, there was obvious downwelling at 24.7 m and upwelling at a depth of 35.7 m with the vertical entrainment and agitation of the typhoon, and the eff ects extended to diff erent depths of up to more than 1 000 m. When the typhoon passed through the main study area, the maximum fl ow velocity change at depths of 51 and 660 m was about 0.44 and 0.04 m/s, respectively. The typhoon aff ected the fl ow fi eld to a depth of 660 m as it formed and decayed in 11 h, moved at an average speed of 60 m/h, and aff ected the sea surface over a range exceeding 700 km as it moved slowly and stayed at sea for 2 d. Vertical entrainment and agitation generated by the typhoon, as well as rainfall, cooled the sea surface. This inhibited the strengthening of the typhoon, but the energy transmitted to the ocean led to divergence-convergence fl ow from a shallow to deep layer.
Keyword : typhoon Kujira (2015); downwelling; upwelling; fl ow fi eld; wind fi eld; salinity; temperature
1 INTRODUCTION
The oceanic response to tropical cyclones (TCs) has attracted considerable attention because of its importance to environmental and ecological protection. The rapid development of remote sensing satellites and the fusion of various remote sensing data have clarifi ed the eff ects of typhoon transits on coastal oceans (Herbeck et al., 2011; Guo et al., 2018). Over a reasonably short period, a typhoon can alter the structure of oceanic water (Price, 1981; Price et al., 1994; Dickey et al., 1998; Li et al., 2012), reduce the sea surface temperature (SST) (Stramma et al., 1986; Shay et al., 2000; Lin et al., 2003, 2005; Shang et al., 2008; Mei et al., 2012; Knaff et al., 2013; Domingues
et al., 2015; Li et al., 2015; Wei et al., 2015), increase sea surface salinity (SSS) (Knaff et al., 2013; Liu et al., 2014; Yue et al., 2018), enhance sediment transport (Chang et al., 2001; Bian et al., 2010; Liu et al., 2011), and boost phytoplankton blooms (Price et al., 1994; Iverson et al., 1997; Chu et al., 2000; Zheng and Tang, 2007; Byju and Kumar, 2011; Lin et al., 2012; Zhao et al., 2013; Li et al., 2015) in the aff ected marine area.
* Supported by the National Natural Science Foundation of China (Nos. 41576032, 41176160), the International Cooperation, CAS, Chinese-Foreign Cooperation in Key Projects (No. 133337KYSB20160002), and the National Key R&D Program of China (No. 2017YFC1405600) ** Corresponding author: [email protected]
315No.2 GUO et al.: Upper ocean response to typhoon
The response of the upper ocean to the passage of a hurricane can be divided into two stages: a forced stage and a relaxation stage (Gill, 1984; Price et al., 1994). In the forced stage, the strong winds of typhoons stir the upper ocean through local entrainment and vertical mixing and other nonlocal eff ects (e.g., upwelling (Sun et al., 2009), and horizontal advection (Yang et al., 2010; Sun et al., 2014)), thus cooling the surface water (Price, 1981; Sun et al., 2009; Li et al., 2012; Ye et al., 2018). Price (1981) believed that entrainment caused 85% of the irreversible heat fl ux fl owing into the mixing layer (ML), with air-sea heat exchange accounting for the remainder. Rabe et al. (2015) believed that the eff ects of wave driven turbulence by typhoons was one of the causes of changes in the upper ocean. Some scholars consider that the mechanism of the response of oceans to typhoons is Ekman pumping (Xu et al., 2018) or wind-pump eff ects (Ye et al., 2019). Chang and Anthes (1978) supposed that SST cooling may reduce or even shut down heat fl uxes from the ocean to the atmosphere, thus aff ecting the evolution and intensity fl uctuations of typhoons; i.e., a negative feedback of the ocean. In the relaxation stage, typhoon-induced near-inertial motions are dominant (Guan et al., 2014; Rayson et al., 2015; Shen et al., 2017; Yang et al., 2019).
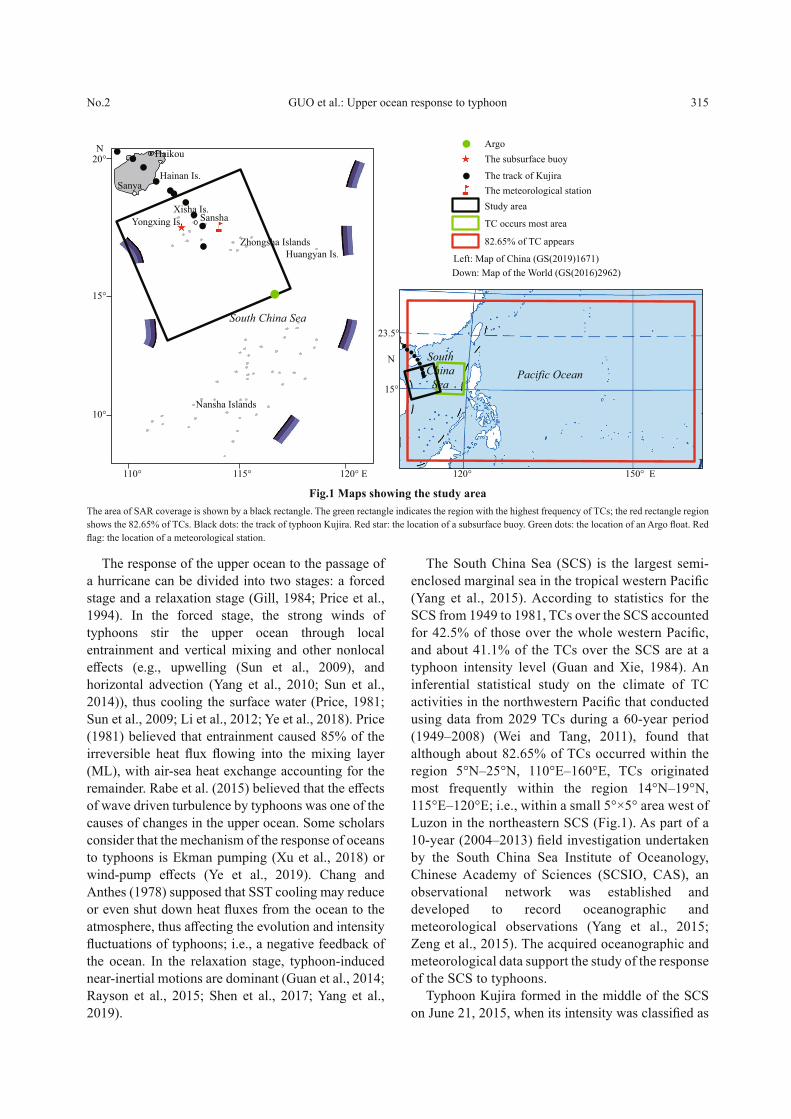
The South China Sea (SCS) is the largest semi-enclosed marginal sea in the tropical western Pacifi c (Yang et al., 2015). According to statistics for the SCS from 1949 to 1981, TCs over the SCS accounted for 42.5% of those over the whole western Pacifi c, and about 41.1% of the TCs over the SCS are at a typhoon intensity level (Guan and Xie, 1984). An inferential statistical study on the climate of TC activities in the northwestern Pacifi c that conducted using data from 2029 TCs during a 60-year period (1949–2008) (Wei and Tang, 2011), found that although about 82.65% of TCs occurred within the region 5°N–25°N, 110°E–160°E, TCs originated most frequently within the region 14°N–19°N, 115°E–120°E; i.e., within a small 5°×5° area west of Luzon in the northeastern SCS (Fig.1). As part of a 10-year (2004–2013) fi eld investigation undertaken by the South China Sea Institute of Oceanology, Chinese Academy of Sciences (SCSIO, CAS), an observational network was established and developed to record oceanographic and meteorological observations (Yang et al., 2015; Zeng et al., 2015). The acquired oceanographic and meteorological data support the study of the response of the SCS to typhoons.
Typhoon Kujira formed in the middle of the SCS on June 21, 2015, when its intensity was classifi ed as
Sanya
20°
120° E 120° 150° E
N
N
15°
15°
23.5°
115°
10°
110°
Sansha
Haikou
Hainan Is.
Xisha Is.
Zhongsha Islands
South China Sea
Nansha Islands
Huangyan Is.
●●●●●
●●●●
●
●
●●
●●●
●●
●●
● Argo
The subsurface buoy
Pacific Ocean
● The track of Kujira
The meteorological station
Study area
TC occurs most area
82.65% of TC appears
Left: Map of China (GS(2019)1671)
Down: Map of the World (GS(2016)2962)
Yongxing Is.
SouthChinaSea
Fig.1 Maps showing the study area The area of SAR coverage is shown by a black rectangle. The green rectangle indicates the region with the highest frequency of TCs; the red rectangle region shows the 82.65% of TCs. Black dots: the track of typhoon Kujira. Red star: the location of a subsurface buoy. Green dots: the location of an Argo fl oat. Red fl ag: the location of a meteorological station .
Vol. 38316 J. OCEANOL. LIMNOL., 38(2), 2020
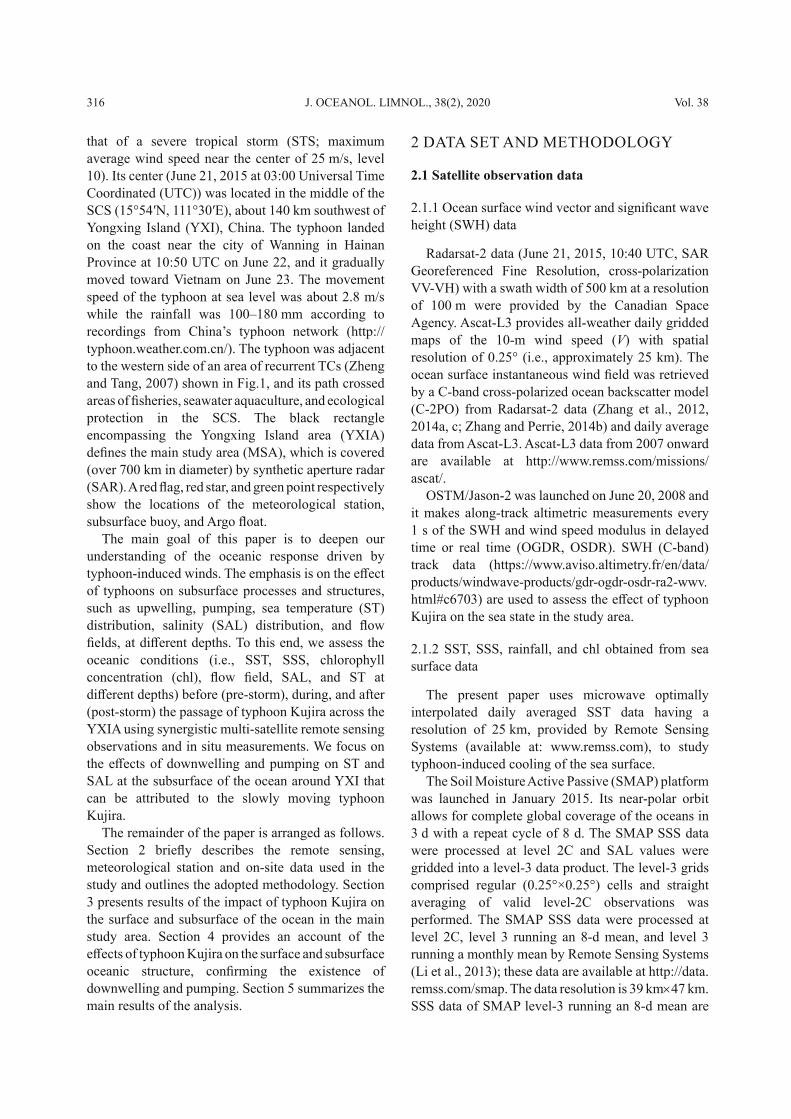
that of a severe tropical storm (STS; maximum average wind speed near the center of 25 m/s, level 10). Its center (June 21, 2015 at 03:00 Universal Time Coordinated (UTC)) was located in the middle of the SCS (15°54′N, 111°30′E), about 140 km southwest of Yongxing Island (YXI), China. The typhoon landed on the coast near the city of Wanning in Hainan Province at 10:50 UTC on June 22, and it gradually moved toward Vietnam on June 23. The movement speed of the typhoon at sea level was about 2.8 m/s while the rainfall was 100–180 mm according to recordings from China’s typhoon network (http://typhoon.weather.com.cn/). The typhoon was adjacent to the western side of an area of recurrent TCs (Zheng and Tang, 2007) shown in Fig.1, and its path crossed areas of fi sheries, seawater aquaculture, and ecological protection in the SCS. The black rectangle encompassing the Yongxing Island area (YXIA) defi nes the main study area (MSA), which is covered (over 700 km in diameter) by synthetic aperture radar (SAR). A red fl ag, red star, and green point respectively show the locations of the meteorological station, subsurface buoy, and Argo fl oat.
The main goal of this paper is to deepen our understanding of the oceanic response driven by typhoon-induced winds. The emphasis is on the eff ect of typhoons on subsurface processes and structures, such as upwelling, pumping, sea temperature (ST) distribution, salinity (SAL) distribution, and fl ow fi elds, at diff erent depths. To this end, we assess the oceanic conditions (i.e., SST, SSS, chlorophyll concentration (chl), fl ow fi eld, SAL, and ST at diff erent depths) before (pre-storm), during, and after (post-storm) the passage of typhoon Kujira across the YXIA using synergistic multi-satellite remote sensing observations and in situ measurements. We focus on the eff ects of downwelling and pumping on ST and SAL at the subsurface of the ocean around YXI that can be attributed to the slowly moving typhoon Kujira.
The remainder of the paper is arranged as follows. Section 2 briefl y describes the remote sensing, meteorological station and on-site data used in the study and outlines the adopted methodology. Section 3 presents results of the impact of typhoon Kujira on the surface and subsurface of the ocean in the main study area. Section 4 provides an account of the eff ects of typhoon Kujira on the surface and subsurface oceanic structure, confi rming the existence of downwelling and pumping. Section 5 summarizes the main results of the analysis.
2 DATA SET AND METHODOLOGY
2.1 Satellite observation data
2.1.1 Ocean surface wind vector and signifi cant wave height (SWH) data
Radarsat-2 data (June 21, 2015, 10:40 UTC, SAR Georeferenced Fine Resolution, cross-polarization VV-VH) with a swath width of 500 km at a resolution of 100 m were provided by the Canadian Space Agency. Ascat-L3 provides all-weather daily gridded maps of the 10-m wind speed ( V ) with spatial resolution of 0.25° (i.e., approximately 25 km). The ocean surface instantaneous wind fi eld was retrieved by a C-band cross-polarized ocean backscatter model (C-2PO) from Radarsat-2 data (Zhang et al., 2012, 2014a, c; Zhang and Perrie, 2014b) and daily average data from Ascat-L3. Ascat-L3 data from 2007 onward are available at http://www.remss.com/missions/ascat/.
OSTM/Jason-2 was launched on June 20, 2008 and it makes along-track altimetric measurements every 1 s of the SWH and wind speed modulus in delayed time or real time (OGDR, OSDR). SWH (C-band) track data (https://www.aviso.altimetry.fr/en/data/products/windwave-products/gdr-ogdr-osdr-ra2-wwv. html#c6703) are used to assess the eff ect of typhoon Kujira on the sea state in the study area.
2.1.2 SST, SSS, rainfall, and chl obtained from sea surface data
The present paper uses microwave optimally interpolated daily averaged SST data having a resolution of 25 km, provided by Remote Sensing Systems (available at: www.remss.com), to study typhoon-induced cooling of the sea surface.
The Soil Moisture Active Passive (SMAP) platform was launched in January 2015. Its near-polar orbit allows for complete global coverage of the oceans in 3 d with a repeat cycle of 8 d. The SMAP SSS data were processed at level 2C and SAL values were gridded into a level-3 data product. The level-3 grids comprised regular (0.25°×0.25°) cells and straight averaging of valid level-2C observations was performed. The SMAP SSS data were processed at level 2C, level 3 running an 8-d mean, and level 3 running a monthly mean by Remote Sensing Systems (Li et al., 2013); these data are available at http://data.remss.com/smap. The data resolution is 39 km 47 km. SSS data of SMAP level-3 running an 8-d mean are
317No.2 GUO et al.: Upper ocean response to typhoon
used in this paper to analyze SSS changes before and during the passage of TP Kujira.
The rainfall (C-band, L3) used in the present paper is Global Precipitation Measurement (GPM) daily average data (having a resolution of 0.1°×0.1°). The GPM mission is an international network of satellites that provide next-generation global observations of rain and snow. Building upon the success of the Tropical Rainfall Measuring Mission, the GPM concept centers on the deployment of a “core” satellite carrying an advanced radar/radiometer system to measure precipitation from space and serves as a reference standard for unifying precipitation measurements from a constellation of research and operational satellites (https://pmm.nasa.gov/data-access/downloads/gpm).
Chl data of the sea surface are taken from the website of the European Space Agency (https://www.oceancolour.org/thredds/catalog-cci.html). Fusion data for 8 d, having a resolution of 4 km, are used in this paper.
The present paper uses the remote sensing data listed above to assess the sea surface before, during, and after the passage of typhoon Kujira.
2.2 In situ observation data
2.2.1 Meteorological station data
The meteorological observation station (indicated by a red fl ag in Fig.1) on YXI (16°50′24′′N, 112°19′48′′W) (Yang et al., 2015) is affi liated with SCSIO, CAS in Fig.1. The data acquired include the 1-min and 3-s averaged wind fi eld, rainfall and rainfall duration. The 3-s averaged wind fi eld data are used for analysis in this paper.
2.2.2 Subsurface buoy and Argo fl oat data
Data from a subsurface buoy (16°50′57′′N, 110°40′37′′E) are obtained from SCSIO, CAS (Rayson et al., 2015). The buoy (red star in Fig.1) had two acoustic Doppler current profi lers (ADCPs)
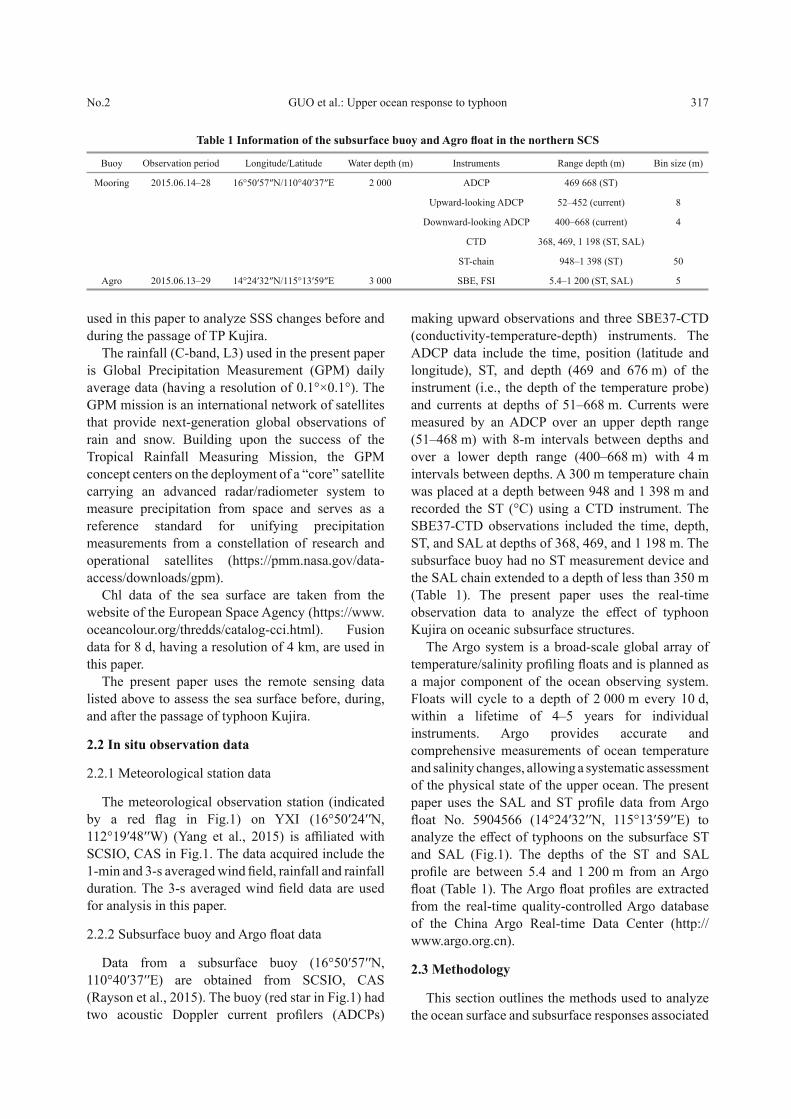
making upward observations and three SBE37-CTD (conductivity-temperature-depth) instruments. The ADCP data include the time, position (latitude and longitude), ST, and depth (469 and 676 m) of the instrument (i.e., the depth of the temperature probe) and currents at depths of 51–668 m. Currents were measured by an ADCP over an upper depth range (51–468 m) with 8-m intervals between depths and over a lower depth range (400–668 m) with 4 m intervals between depths. A 300 m temperature chain was placed at a depth between 948 and 1 398 m and recorded the ST (°C) using a CTD instrument. The SBE37-CTD observations included the time, depth, ST, and SAL at depths of 368, 469, and 1 198 m. The subsurface buoy had no ST measurement device and the SAL chain extended to a depth of less than 350 m (Table 1). The present paper uses the real-time observation data to analyze the eff ect of typhoon Kujira on oceanic subsurface structures.
The Argo system is a broad-scale global array of temperature/salinity profi ling fl oats and is planned as a major component of the ocean observing system. Floats will cycle to a depth of 2 000 m every 10 d, within a lifetime of 4–5 years for individual instruments. Argo provides accurate and comprehensive measurements of ocean temperature and salinity changes, allowing a systematic assessment of the physical state of the upper ocean. The present paper uses the SAL and ST profi le data from Argo fl oat No. 5904566 (14°24′32′′N, 115°13′59′′E) to analyze the eff ect of typhoons on the subsurface ST and SAL (Fig.1). The depths of the ST and SAL profi le are between 5.4 and 1 200 m from an Argo fl oat (Table 1). The Argo fl oat profi les are extracted from the real-time quality-controlled Argo database of the China Argo Real-time Data Center (http://www.argo.org.cn).
2.3 Methodology
This section outlines the methods used to analyze the ocean surface and subsurface responses associated
Table 1 Information of the subsurface buoy and Agro fl oat in the northern SCS
Buoy Observation period Longitude/Latitude Water depth (m) Instruments Range depth (m) Bin size (m)
Mooring 2015.06.14–28 16°50′57″N/110°40′37″E 2 000 ADCP 469 668 (ST)
Upward-looking ADCP 52–452 (current) 8
Downward-looking ADCP 400–668 (current) 4
CTD 368, 469, 1 198 (ST, SAL)
ST-chain 948–1 398 (ST) 50
Agro 2015.06.13–29 14°24′32″N/115°13′59″E 3 000 SBE, FSI 5.4–1 200 (ST, SAL) 5
Vol. 38318 J. OCEANOL. LIMNOL., 38(2), 2020
with the passage of typhoon Kujira using multi-satellite, meteorological and buoy observation data. Figure 1 illustrates the track of typhoon Kujira (black dots) in the MSA covered by Radarsat-2 SAR (black rectangle, 13°30′N–17°27′N, 109°39′36′′E– 115°16′48′′E). The subsurface buoy and the weather station are respectively on the left and bottom right of the typhoon track. The selection of such observation points is conducive to analyzing the eff ects of typhoon Kujira on the surface and sub-surface sea water in this region.
2.3.1 Wind fi eld inversion
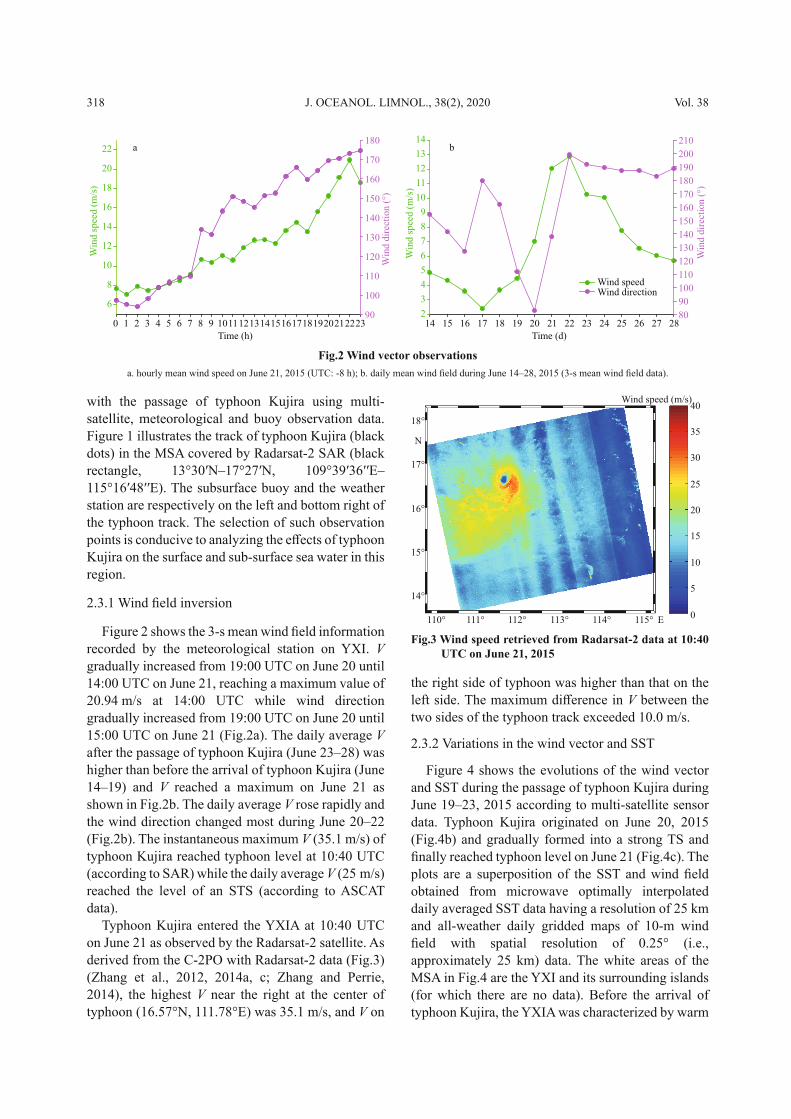
Figure 2 shows the 3-s mean wind fi eld information recorded by the meteorological station on YXI. V gradually increased from 19:00 UTC on June 20 until 14:00 UTC on June 21, reaching a maximum value of 20.94 m/s at 14:00 UTC while wind direction gradually increased from 19:00 UTC on June 20 until 15:00 UTC on June 21 (Fig.2a). The daily average V after the passage of typhoon Kujira (June 23–28) was higher than before the arrival of typhoon Kujira (June 14–19) and V reached a maximum on June 21 as shown in Fig.2b. The daily average V rose rapidly and the wind direction changed most during June 20–22 (Fig.2b). The instantaneous maximum V (35.1 m/s) of typhoon Kujira reached typhoon level at 10:40 UTC (according to SAR) while the daily average V (25 m/s) reached the level of an STS (according to ASCAT data).
Typhoon Kujira entered the YXIA at 10:40 UTC on June 21 as observed by the Radarsat-2 satellite. As derived from the C-2PO with Radarsat-2 data (Fig.3) (Zhang et al., 2012, 2014a, c; Zhang and Perrie, 2014), the highest V near the right at the center of typhoon (16.57°N, 111.78°E) was 35.1 m/s, and V on
the right side of typhoon was higher than that on the left side. The maximum diff erence in V between the two sides of the typhoon track exceeded 10.0 m/s.
2.3.2 Variations in the wind vector and SST
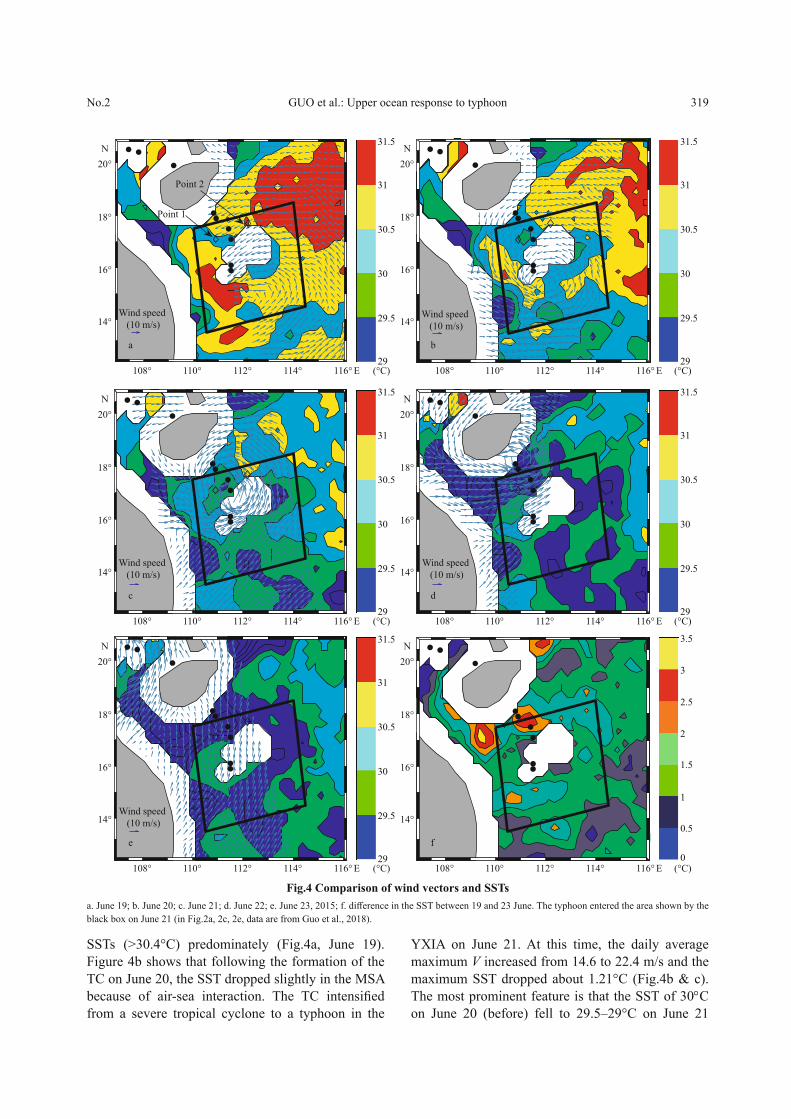
Figure 4 shows the evolutions of the wind vector and SST during the passage of typhoon Kujira during June 19–23, 2015 according to multi-satellite sensor data. Typhoon Kujira originated on June 20, 2015 (Fig.4b) and gradually formed into a strong TS and fi nally reached typhoon level on June 21 (Fig.4c). The plots are a superposition of the SST and wind fi eld obtained from microwave optimally interpolated daily averaged SST data having a resolution of 25 km and all-weather daily gridded maps of 10-m wind fi eld with spatial resolution of 0.25° (i.e., approximately 25 km) data. The white areas of the MSA in Fig.4 are the YXI and its surrounding islands (for which there are no data). Before the arrival of typhoon Kujira, the YXIA was characterized by warm
Time (h)
0 1 2 3 4 5 6 7 8 9 1011121314151617181920212223
Win
d s
pee
d (
m/s
)
6
8
10
12
14
16
18
20
22
Win
d d
irec
tion (
°)
90
100
110
120
130
140
150
160
170
180
Time (d)
14
ba
15 16 17 18 19 20 21 22 23 24 25 26 27 28
Win
d s
pee
d (
m/s
)
2
3
4
5
6
7
8
9
10
11
12
13
14
Win
d d
irec
tion (
°)
80
90
100
110
120
130
140
150
160
170
180
190
200
210
Wind speedWind direction
Fig.2 Wind vector observations a. hourly mean wind speed on June 21, 2015 (UTC: -8 h); b. daily mean wind fi eld during June 14–28, 2015 (3-s mean wind fi eld data).
110° 111° 112° 113° 114° 115° E
Wind speed (m/s)
N
14°
15°
16°
17°
18°
0
5
10
15
20
25
30
35
40
Fig.3 Wind speed retrieved from Radarsat-2 data at 10:40 UTC on June 21, 2015
319No.2 GUO et al.: Upper ocean response to typhoon
SSTs (>30.4°C) predominately (Fig.4a, June 19). Figure 4b shows that following the formation of the TC on June 20, the SST dropped slightly in the MSA because of air-sea interaction. The TC intensifi ed from a severe tropical cyclone to a typhoon in the
YXIA on June 21. At this time, the daily average maximum V increased from 14.6 to 22.4 m/s and the maximum SST dropped about 1.21°C (Fig.4b & c). The most prominent feature is that the SST of 30 C on June 20 (before) fell to 29.5–29°C on June 21
Wind speed
(10 m/s)
108° 110° 112° 114° E 116°
14°
16°
18°
20°
N
108° 110° 112° 114° E 116°
14°
16°
18°
20°
N
Point 1
Point 2
29
29.5
30
30.5
31
31.5
29
29.5
30
30.5
31
31.5
108° 110° 112° 114° E 116°
14°
16°
18°
20°
N
108° 110° 112° 114° E 116°
14°
16°
18°
20°
N
29
29.5
30
30.5
31
31.5
29
29.5
30
30.5
31
31.5
108° 110° 112° 114° E 116°
14°
16°
18°
20°
N
108°
ba
dc
fe
110° 112° 114° E 116° (°C) (°C)
(°C) (°C)
(°C) (°C)
14°
16°
18°
20°
N
29
29.5
30
30.5
31
31.5
0
0.5
1
1.5
2
2.5
3
3.5
Wind speed
(10 m/s)
Wind speed
(10 m/s)
Wind speed
(10 m/s)Wind speed
(10 m/s)
Fig.4 Comparison of wind vectors and SSTs a. June 19; b. June 20; c. June 21; d. June 22; e. June 23, 2015; f. diff erence in the SST between 19 and 23 June. The typhoon entered the area shown by the black box on June 21 (in Fig.2a, 2c, 2e, data are from Guo et al., 2018).
Vol. 38320 J. OCEANOL. LIMNOL., 38(2), 2020
(during) in the MSA. On June 22, the center of the typhoon was about to leave the MSA (June 22, Fig.4d) and the maximum SST fell by another 1°C in the MSA. By June 23, the center of the typhoon had completely left the MSA and the area was dominated
by an SST of 29°C (Fig4e). Figure 4f shows the diff erence in the SST in the MSA between before (June 19) and after (June 23) the typhoon. The maximum drop in SST in the MSA before (June 19) and after (June 23) the typhoon was 2.5°C. Figure 2a shows that the daily average V reached a maximum of 20.94 m/s near the weather station at about 14:00 UTC. This location was about 90 km to the right of the center of the typhoon. Figure 3 shows the typhoon passing through the MSA and wind fi eld retrieval (where the instantaneous maximum wind was 35.1 m/s) from Radarsat-2 at 10:40 UTC on June 21, at which time the typhoon had not reached its maximum intensity. After making landfall at Hainan at about 10:50 UTC on June 22 (Fig.4d), the typhoon gradually decayed. The typhoon subsequently made a second landfall over northern Vietnam at about 03:40 UTC on June 24, as shown in Fig.4e.
3 RESULT
3.1 Responses of the sea surface to the typhoon
3.1.1 SSS and chl responses
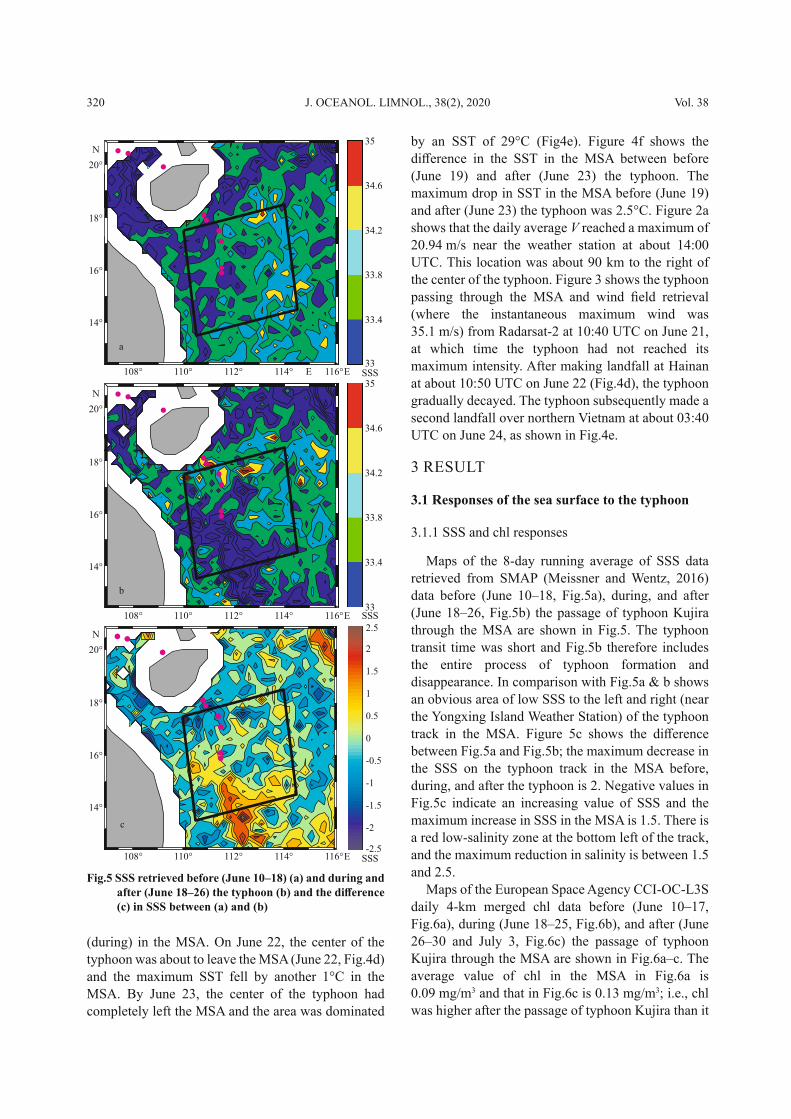
Maps of the 8-day running average of SSS data retrieved from SMAP (Meissner and Wentz, 2016) data before (June 10–18, Fig.5a), during, and after (June 18–26, Fig.5b) the passage of typhoon Kujira through the MSA are shown in Fig.5. The typhoon transit time was short and Fig.5b therefore includes the entire process of typhoon formation and disappearance. In comparison with Fig.5a & b shows an obvious area of low SSS to the left and right (near the Yongxing Island Weather Station) of the typhoon track in the MSA. Figure 5c shows the diff erence between Fig.5a and Fig.5b; the maximum decrease in the SSS on the typhoon track in the MSA before, during, and after the typhoon is 2. Negative values in Fig.5c indicate an increasing value of SSS and the maximum increase in SSS in the MSA is 1.5. There is a red low-salinity zone at the bottom left of the track, and the maximum reduction in salinity is between 1.5 and 2.5.
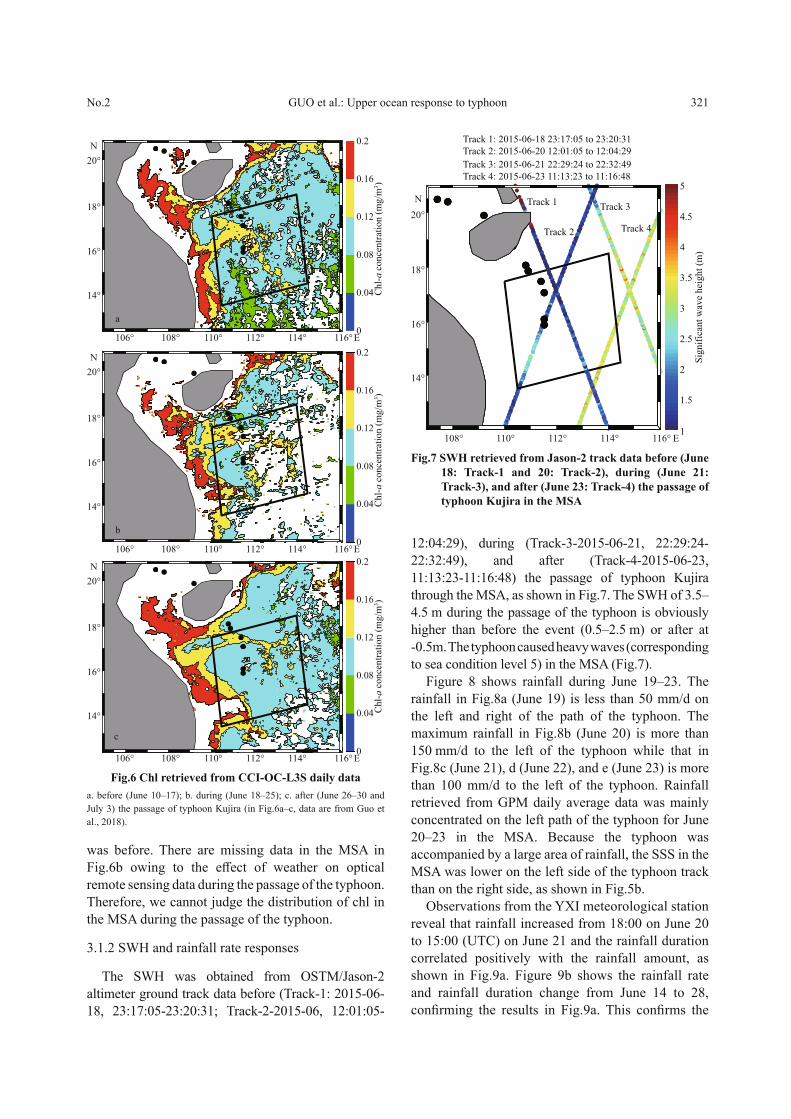
Maps of the European Space Agency CCI-OC-L3S daily 4-km merged chl data before (June 10–17, Fig.6a), during (June 18–25, Fig.6b), and after (June 26–30 and July 3, Fig.6c) the passage of typhoon Kujira through the MSA are shown in Fig.6a–c. The average value of chl in the MSA in Fig.6a is 0.09 mg/m 3 and that in Fig.6c is 0.13 mg/m 3 ; i.e., chl was higher after the passage of typhoon Kujira than it
33SSS
SSS
SSS
33.4
33.8
34.2
34.6
35
33
33.4
33.8
34.2
34.6
35
108° 110° 112° 114° 116°
14°
16°
18°
20°
N
108° 110° 112° 114° E
E
116°
14°
16°
18°
20°
N
108°
b
c
a
110° 112° 114° E E 116°
14°
16°
18°
20°
N
b
-2.5
-2
-1.5
-1
-0.5
0
0.5
1
1.5
2
2.5
c
Fig.5 SSS retrieved before (June 10–18) (a) and during and after (June 18–26) the typhoon (b) and the diff erence (c) in SSS between (a) and (b)
321No.2 GUO et al.: Upper ocean response to typhoon
was before. There are missing data in the MSA in Fig.6b owing to the eff ect of weather on optical remote sensing data during the passage of the typhoon. Therefore, we cannot judge the distribution of chl in the MSA during the passage of the typhoon.
3.1.2 SWH and rainfall rate responses
The SWH was obtained from OSTM/Jason-2 altimeter ground track data before (Track-1: 2015-06-18, 23:17:05-23:20:31; Track-2-2015-06, 12:01:05-
12:04:29), during (Track-3-2015-06-21, 22:29:24-22:32:49), and after (Track-4-2015-06-23, 11:13:23-11:16:48) the passage of typhoon Kujira through the MSA, as shown in Fig.7. The SWH of 3.5–4.5 m during the passage of the typhoon is obviously higher than before the event (0.5–2.5 m) or after at -0.5m. The typhoon caused heavy waves (corresponding to sea condition level 5) in the MSA (Fig.7).
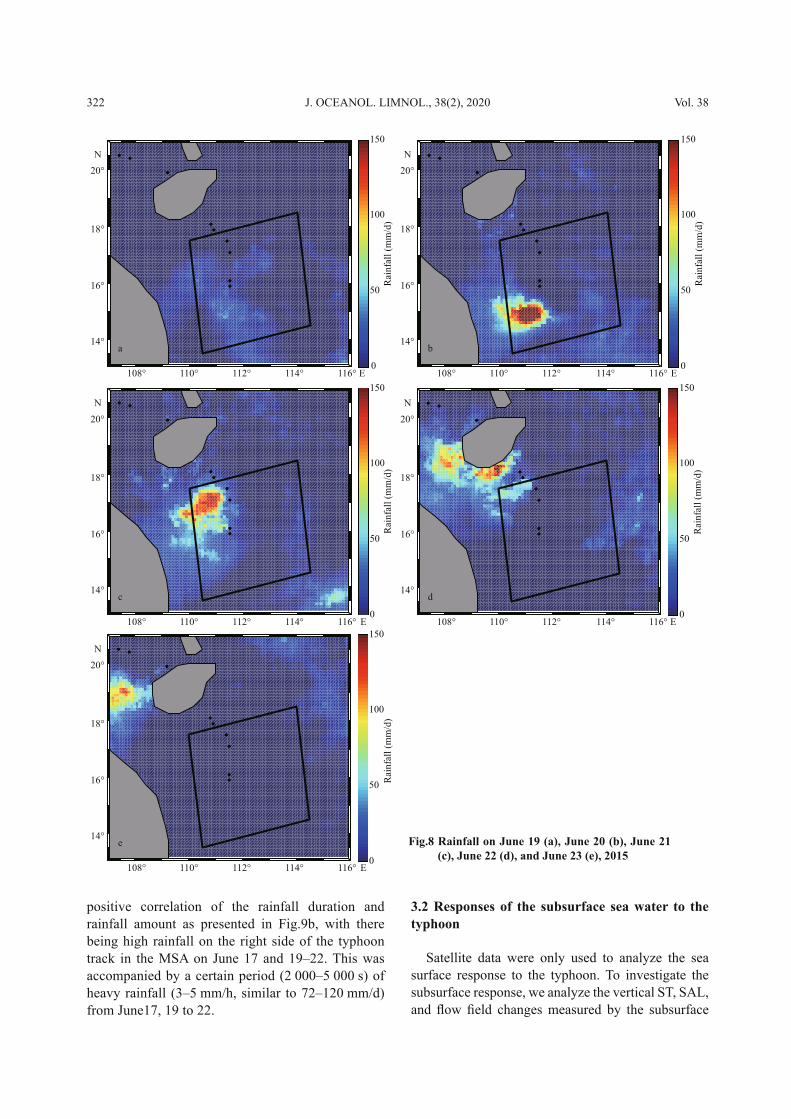
Figure 8 shows rainfall during June 19–23. The rainfall in Fig.8a (June 19) is less than 50 mm/d on the left and right of the path of the typhoon. The maximum rainfall in Fig.8b (June 20) is more than 150 mm/d to the left of the typhoon while that in Fig.8c (June 21), d (June 22), and e (June 23) is more than 100 mm/d to the left of the typhoon. Rainfall retrieved from GPM daily average data was mainly concentrated on the left path of the typhoon for June 20–23 in the MSA. Because the typhoon was accompanied by a large area of rainfall, the SSS in the MSA was lower on the left side of the typhoon track than on the right side, as shown in Fig.5b.
Observations from the YXI meteorological station reveal that rainfall increased from 18:00 on June 20 to 15:00 (UTC) on June 21 and the rainfall duration correlated positively with the rainfall amount, as shown in Fig.9a. Figure 9b shows the rainfall rate and rainfall duration change from June 14 to 28, confi rming the results in Fig.9a. This confi rms the
Track 1: 2015-06-18 23:17:05 to 23:20:31
Track 2: 2015-06-20 12:01:05 to 12:04:29
Track 3: 2015-06-21 22:29:24 to 22:32:49
Track 4: 2015-06-23 11:13:23 to 11:16:48
1
1.5
2
2.5
Sig
nif
ican
t w
ave
hei
ght
(m)
3
3.5
4
4.5
5
Track 3
Track 4
Track 1
Track 2
108° 110° 112° 114° E 116°
14°
16°
18°
20°
N
Fig.7 SWH retrieved from Jason-2 track data before (June 18: Track-1 and 20: Track-2), during (June 21: Track-3), and after (June 23: Track-4) the passage of typhoon Kujira in the MSA
0
0.04
0.08
0.12
0.16
0.2
108° 110° 112° 114° E 116°106°
14°
16°
18°
20°
N
0
0.04
0.08
0.12
0.16
0.2
108° 110° 112° 114° E 116°106°
a
b
14°
16°
18°
20°
N
0
0.04
0.08
0.12
0.16
0.2
108° 110° 112° 114° E 116°106°
c
14°
16°
18°
20°
N
Ch
l-a
conce
ntr
atio
n (
mg/m
3)
Ch
l-a
conce
ntr
atio
n (
mg/m
3)
Chl-
a co
nce
ntr
atio
n (
mg/m
3)
Fig.6 Chl retrieved from CCI-OC-L3S daily data a. before (June 10–17); b. during (June 18–25); c. after (June 26–30 and July 3) the passage of typhoon Kujira (in Fig.6a–c, data are from Guo et al., 2018).
Vol. 38322 J. OCEANOL. LIMNOL., 38(2), 2020
positive correlation of the rainfall duration and rainfall amount as presented in Fig.9b, with there being high rainfall on the right side of the typhoon track in the MSA on June 17 and 19–22. This was accompanied by a certain period (2 000–5 000 s) of heavy rainfall (3–5 mm/h, similar to 72–120 mm/d) from June17, 19 to 22.
3.2 Responses of the subsurface sea water to the typhoon
Satellite data were only used to analyze the sea surface response to the typhoon. To investigate the subsurface response, we analyze the vertical ST, SAL, and fl ow fi eld changes measured by the subsurface
0
50
100
150
0
50
100
150
0
50
100
150
0
50
100
150
0
50
100
150
108°
a
110° 112° 114° E 116°
14°
16°
18°
20°
N
108°
b
110° 112° 114° E 116°
14°
16°
18°
20°
N
108°
c
110° 112° 114° E 116°
14°
16°
18°
20°
N
108°
e
110° 112° 114° E 116°
14°
16°
18°
20°
N
108°
d
110° 112° 114° E 116°
14°
16°
18°
20°
N
Rai
nfa
ll (
mm
/d)
Rai
nfa
ll (
mm
/d)
Rai
nfa
ll (
mm
/d)
Rai
nfa
ll (
mm
/d)
Rai
nfa
ll (
mm
/d)
Fig.8 Rainfall on June 19 (a), June 20 (b), June 21 (c), June 22 (d), and June 23 (e), 2015
323No.2 GUO et al.: Upper ocean response to typhoon
buoy and Argo fl oat before, during, and after the passage of typhoon Kujira.
3.2.1 Responses of the subsurface-layer ST and SAL were recorded by the subsurface buoy to the typhoon
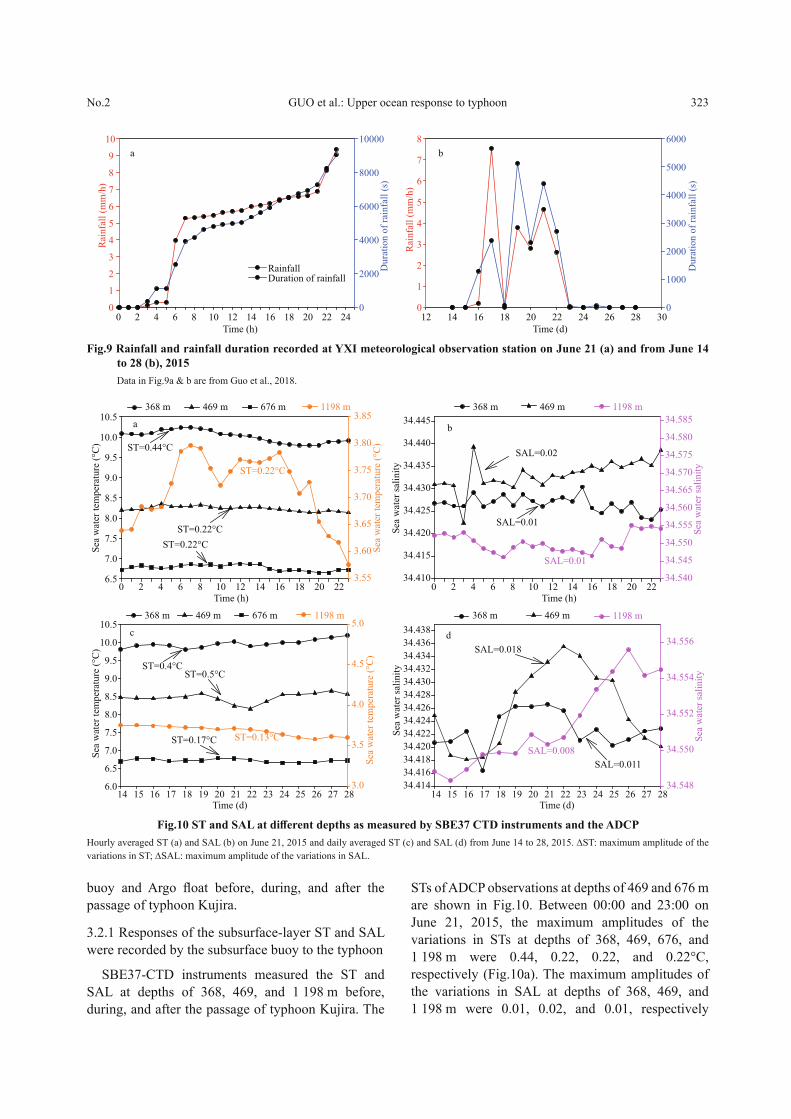
SBE37-CTD instruments measured the ST and SAL at depths of 368, 469, and 1 198 m before, during, and after the passage of typhoon Kujira. The
STs of ADCP observations at depths of 469 and 676 m are shown in Fig.10. Between 00:00 and 23:00 on June 21, 2015, the maximum amplitudes of the variations in STs at depths of 368, 469, 676, and 1 198 m were 0.44, 0.22, 0.22, and 0.22°C, respectively (Fig.10a). The maximum amplitudes of the variations in SAL at depths of 368, 469, and 1 198 m were 0.01, 0.02, and 0.01, respectively
Time (d)14 15 16 17 18 19 20 21 22 23 24 25 26 27 28
Sea
wat
er s
alin
ity
34.414
34.416
34.418
34.420
34.422
34.424
34.426
34.428
34.430
34.432
34.434
34.436
34.438
Sea
wat
er s
alin
ity
34.548
34.550
34.552
34.554
34.556
368 m 469 m 1198 m
SAL=0.018
SAL=0.008
SAL=0.011
Time (d)14 15 16 17 18 19 20 21 22 23 24 25 26 27 28
Sea
wat
er t
emper
ature
(°C
)
6.0
6.5
7.0
7.5
8.0
8.5
9.0
9.5
10.0
10.5
Sea
wat
er t
emper
ature
(°C
)
3.0
3.5
4.0
4.5
5.0368 m 469 m 676 m 1198 m
ST=0.4°C
ST=0.13°C
ST=0.5°C
ST=0.17°C
Time (h)
0 2 4 6 8 10 12 14 16 18 20 22
Sea
wat
er s
alin
ity
34.410
34.415
34.420
34.425
34.430
34.435
34.440
34.445
Sea
wat
er s
alin
ity
34.540
34.545
34.550
34.555
34.560
34.565
34.570
34.575
34.580
34.585
368 m 469 m 1198 m
SAL=0.02
SAL=0.01
SAL=0.01
Time (h)
0 2 4 6 8 10 12 14 16 18 20 22
Sea
wat
er t
emper
ature
(°C
)
6.5
7.0
7.5
8.0
8.5
9.0
9.5
10.0
10.5
Sea
wat
er t
emper
ature
(°C
)
3.55
3.60
3.65
3.70
3.75
3.80
3.85368 m
dc
ba
469 m 676 m 1198 m
ST=0.44°C
ST=0.22°C
ST=0.22°C
ST=0.22°C
Fig.10 ST and SAL at diff erent depths as measured by SBE37 CTD instruments and the ADCP Hourly averaged ST (a) and SAL (b) on June 21, 2015 and daily averaged ST (c) and SAL (d) from June 14 to 28, 2015. ST: maximum amplitude of the variations in ST; SAL: maximum amplitude of the variations in SAL.
Time (h)
0 2 4 6 8 10 12 14 16 18 20 22 240
1
2
3
4
5
6
7
8
9
10
0
2000
4000
6000
8000
10000
RainfallDuration of rainfall
Time (d)
12 14 16 18 20 22 24 26 28 30
Rai
nfa
ll (
mm
/h)
Rai
nfa
ll (
mm
/h)
0
1
2
3
4
5
6
7a b
8
Dura
tion o
f ra
infa
ll (
s)
Dura
tion o
f ra
infa
ll (
s)
0
1000
2000
3000
4000
5000
6000
Fig.9 Rainfall and rainfall duration recorded at YXI meteorological observation station on June 21 (a) and from June 14 to 28 (b), 2015 Data in Fig.9a & b are from Guo et al., 2018.
Vol. 38324 J. OCEANOL. LIMNOL., 38(2), 2020
(Fig.10b). The amplitude of the ST change was largest at 368 m, and SAL gradually decreased after 15:00 as shown in Fig.10b. Although the SAL at a depth of 469 m fl uctuated considerably between 03:00 and 04:00, it increased gradually after 12:00. Similarly, ST fl uctuated between 03:00 and 05:00 but then gradually decreased after 12:00. The slight increase and decrease in ST at a depth of 1 198 m corresponded to the slight decrease and increase in SAL (Fig.10a & b).
Analysis of data for the week after the passage of typhoon Kujira (June 22–28, 2015) reveals that the ST gradually increased relative to the week before the typhoon passage (June 14–20, 2015) at a depth of 368 m (Fig.10c) and the ST increased by 0.4°C. Conversely, SAL gradually decreased at a depth of 368 m after June 22 (Fig.10d) and the average decrease in SAL was 0.011. There was a considerable decrease in ST at a depth of 469 m from June 19 to 22, which constituted the largest variation in amplitude of 0.5°C (Fig.10c). However, this was followed by a substantial recovery during June 23–27. Concurrently, SAL at a depth of 469 m had the opposite tendency, and the amplitude of variation of SAL at this depth was the largest (Fig.10d). The ST at a depth of 676 m decreased gradually during the week after the passage of the typhoon compared with the week before. During June 22–26, at a depth of 1 198 m, the ST was slightly lower and SAL was slightly higher than before the passage of typhoon Kujira (Fig.10c & d). Table 2 gives the weekly averaged ST and SAL data after the passage of typhoon Kujira at depths of 368, 469, and 1 198 m, compared with results for the Northern South China Sea (NCAS) open cruise in 2011 (Zeng et al., 2015). After the passage of the typhoon, at a depth of 368 m, the ST increased by 0.03°C and SAL decreased by 0.07. The ST decreased by 0.54°C and SAL increased by 0.03 at a depth of 469 m while the ST decreased by 0.36°C and SAL increased by 0.05 at a depth of 1 198 m. These results are consistent with the trends found during the week before the passage of the typhoon.
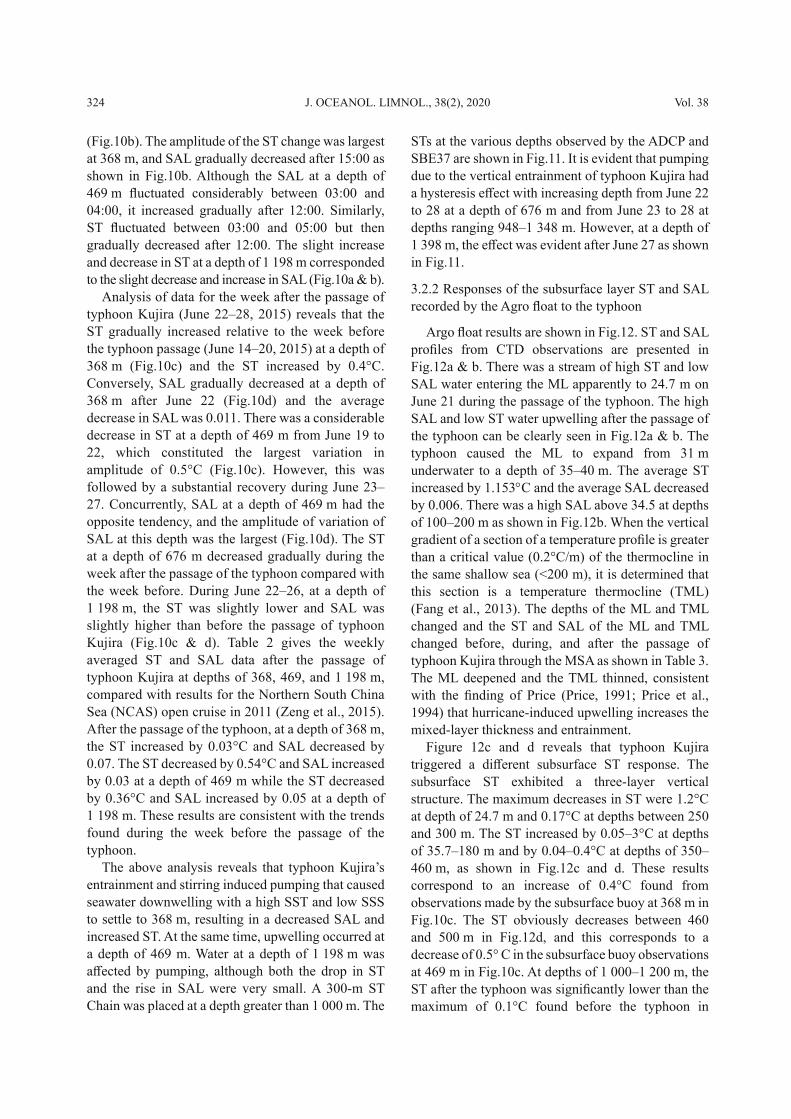
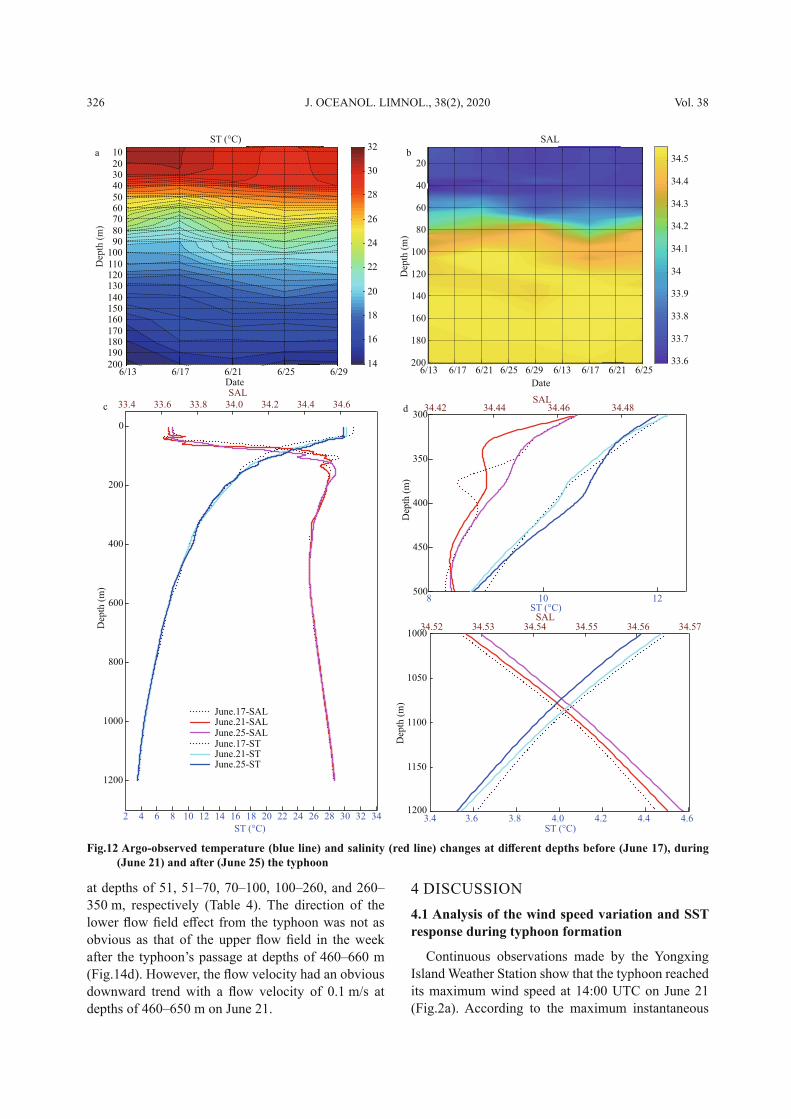
The above analysis reveals that typhoon Kujira’s entrainment and stirring induced pumping that caused seawater downwelling with a high SST and low SSS to settle to 368 m, resulting in a decreased SAL and increased ST. At the same time, upwelling occurred at a depth of 469 m. Water at a depth of 1 198 m was aff ected by pumping, although both the drop in ST and the rise in SAL were very small. A 300-m ST Chain was placed at a depth greater than 1 000 m. The
STs at the various depths observed by the ADCP and SBE37 are shown in Fig.11. It is evident that pumping due to the vertical entrainment of typhoon Kujira had a hysteresis eff ect with increasing depth from June 22 to 28 at a depth of 676 m and from June 23 to 28 at depths ranging 948–1 348 m. However, at a depth of 1 398 m, the eff ect was evident after June 27 as shown in Fig.11.
3.2.2 Responses of the subsurface layer ST and SAL recorded by the Agro fl oat to the typhoon
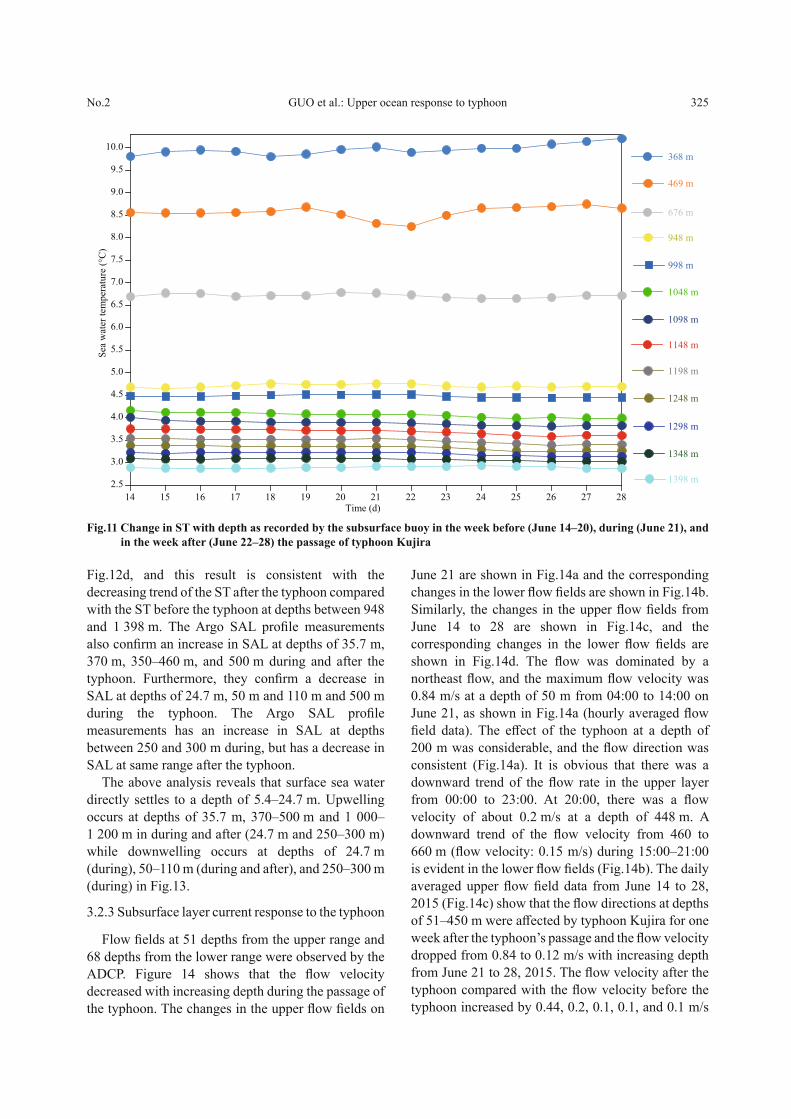
Argo fl oat results are shown in Fig.12. ST and SAL profi les from CTD observations are presented in Fig.12a & b. There was a stream of high ST and low SAL water entering the ML apparently to 24.7 m on June 21 during the passage of the typhoon. The high SAL and low ST water upwelling after the passage of the typhoon can be clearly seen in Fig.12a & b. The typhoon caused the ML to expand from 31 m underwater to a depth of 35–40 m. The average ST increased by 1.153 C and the average SAL decreased by 0.006. There was a high SAL above 34.5 at depths of 100–200 m as shown in Fig.12b. When the vertical gradient of a section of a temperature profi le is greater than a critical value (0.2°C/m) of the thermocline in the same shallow sea (<200 m), it is determined that this section is a temperature thermocline (TML) (Fang et al., 2013). The depths of the ML and TML changed and the ST and SAL of the ML and TML changed before, during, and after the passage of typhoon Kujira through the MSA as shown in Table 3. The ML deepened and the TML thinned, consistent with the fi nding of Price (Price, 1991; Price et al., 1994) that hurricane-induced upwelling increases the mixed-layer thickness and entrainment.
Figure 12c and d reveals that typhoon Kujira triggered a diff erent subsurface ST response. The subsurface ST exhibited a three-layer vertical structure. The maximum decreases in ST were 1.2°C at depth of 24.7 m and 0.17°C at depths between 250 and 300 m. The ST increased by 0.05–3°C at depths of 35.7–180 m and by 0.04–0.4°C at depths of 350–460 m, as shown in Fig.12c and d. These results correspond to an increase of 0.4°C found from observations made by the subsurface buoy at 368 m in Fig.10c. The ST obviously decreases between 460 and 500 m in Fig.12d, and this corresponds to a decrease of 0.5° C in the subsurface buoy observations at 469 m in Fig.10c. At depths of 1 000–1 200 m, the ST after the typhoon was signifi cantly lower than the maximum of 0.1°C found before the typhoon in
325No.2 GUO et al.: Upper ocean response to typhoon
Fig.12d, and this result is consistent with the decreasing trend of the ST after the typhoon compared with the ST before the typhoon at depths between 948 and 1 398 m. The Argo SAL profi le measurements also confi rm an increase in SAL at depths of 35.7 m, 370 m, 350–460 m, and 500 m during and after the typhoon. Furthermore, they confi rm a decrease in SAL at depths of 24.7 m, 50 m and 110 m and 500 m during the typhoon. The Argo SAL profi le measurements has an increase in SAL at depths between 250 and 300 m during, but has a decrease in SAL at same range after the typhoon.
The above analysis reveals that surface sea water directly settles to a depth of 5.4–24.7 m. Upwelling occurs at depths of 35.7 m, 370–500 m and 1 000–1 200 m in during and after (24.7 m and 250–300 m) while downwelling occurs at depths of 24.7 m (during), 50–110 m (during and after), and 250–300 m (during) in Fig.13.
3.2.3 Subsurface layer current response to the typhoon
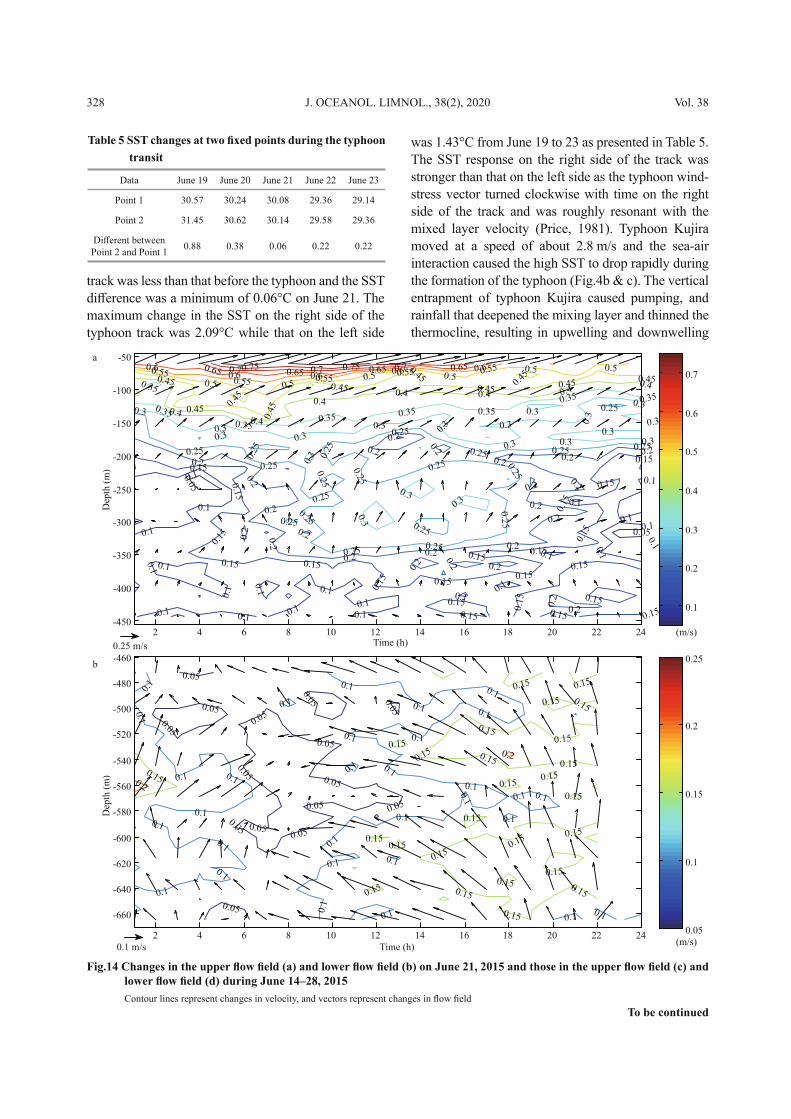
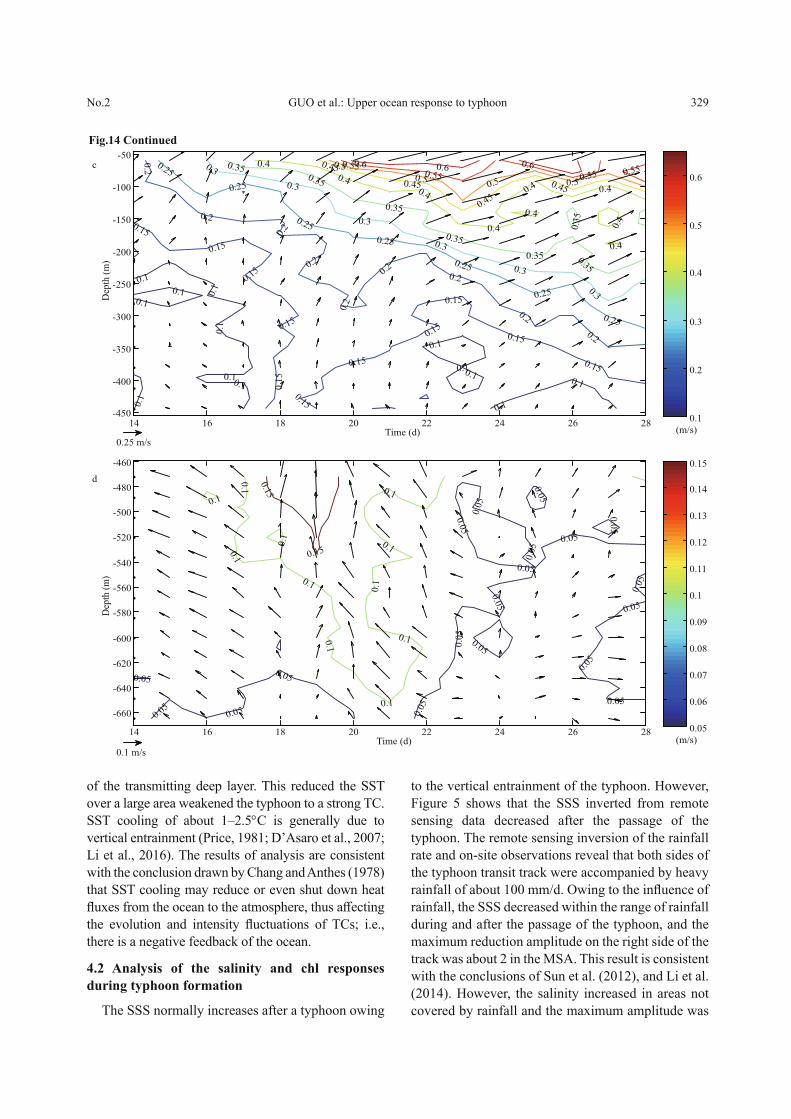
Flow fi elds at 51 depths from the upper range and 68 depths from the lower range were observed by the ADCP. Figure 14 shows that the fl ow velocity decreased with increasing depth during the passage of the typhoon. The changes in the upper fl ow fi elds on
June 21 are shown in Fig.14a and the corresponding changes in the lower fl ow fi elds are shown in Fig.14b. Similarly, the changes in the upper fl ow fi elds from June 14 to 28 are shown in Fig.14c, and the corresponding changes in the lower fl ow fi elds are shown in Fig.14d. The fl ow was dominated by a northeast fl ow, and the maximum fl ow velocity was 0.84 m/s at a depth of 50 m from 04:00 to 14:00 on June 21, as shown in Fig.14a (hourly averaged fl ow fi eld data). The eff ect of the typhoon at a depth of 200 m was considerable, and the fl ow direction was consistent (Fig.14a). It is obvious that there was a downward trend of the fl ow rate in the upper layer from 00:00 to 23:00. At 20:00, there was a fl ow velocity of about 0.2 m/s at a depth of 448 m. A downward trend of the fl ow velocity from 460 to 660 m (fl ow velocity: 0.15 m/s) during 15:00–21:00 is evident in the lower fl ow fi elds (Fig.14b). The daily averaged upper fl ow fi eld data from June 14 to 28, 2015 (Fig.14c) show that the fl ow directions at depths of 51–450 m were aff ected by typhoon Kujira for one week after the typhoon’s passage and the fl ow velocity dropped from 0.84 to 0.12 m/s with increasing depth from June 21 to 28, 2015. The fl ow velocity after the typhoon compared with the fl ow velocity before the typhoon increased by 0.44, 0.2, 0.1, 0.1, and 0.1 m/s
Time (d)14 15 16 17 18 19 20 21 22 23 24 25 26 27 28
Sea
wat
er t
emper
atu
re (
°C)
2.5
3.0
3.5
4.0
4.5
5.0
5.5
6.0
6.5
7.0
7.5
8.0
8.5
9.0
9.5
10.0368 m
469 m
676 m
948 m
998 m
1048 m
1098 m
1148 m
1198 m
1248 m
1298 m
1348 m
1398 m
Fig.11 Change in ST with depth as recorded by the subsurface buoy in the week before (June 14–20), during (June 21), and in the week after (June 22–28) the passage of typhoon Kujira
Vol. 38326 J. OCEANOL. LIMNOL., 38(2), 2020
at depths of 51, 51–70, 70–100, 100–260, and 260–350 m, respectively (Table 4). The direction of the lower fl ow fi eld eff ect from the typhoon was not as obvious as that of the upper fl ow fi eld in the week after the typhoon’s passage at depths of 460–660 m (Fig.14d). However, the fl ow velocity had an obvious downward trend with a fl ow velocity of 0.1 m/s at depths of 460–650 m on June 21.
4 DISCUSSION 4.1 Analysis of the wind speed variation and SST response during typhoon formation
Continuous observations made by the Yongxing Island Weather Station show that the typhoon reached its maximum wind speed at 14:00 UTC on June 21 (Fig.2a). According to the maximum instantaneous
ST (°C)
ST (°C)
Date
Dep
th (
m)
Dep
th (
m)
ST (°C)
6/13 6/17 6/21 6/25 6/29
10
203040
506070
8090
100
110120130
140150160
170180190
200 14
16
18
20
22
24
26
28
30
32
SALSAL
SAL
a b
c d
ST (°C)
Date
Dep
th (
m)
SAL
6/13 6/17 6/21 6/25 6/29 6/13 6/17 6/21 6/25
20
40
60
80
100
120
140
160
180
200 33.6
33.7
33.8
33.9
34
34.1
34.2
34.3
34.4
34.5
33.4 33.6 33.8 34.0 34.2 34.4 34.6
0
200
400
600
800
1000
1200
2 4 6 8 10 12 14 16 18 20 22 24 26 28 30 32 34
June.17-SALJune.21-SALJune.25-SALJune.17-STJune.21-STJune.25-ST
34.52 34.53 34.54 34.55 34.56 34.57
Dep
th (
m)
1000
1050
1100
1150
12003.4 3.6 3.8 4.0 4.2 4.4 4.6
34.42 34.44 34.46 34.48D
epth
(m
)300
350
400
450
5008 10 12
Fig.12 Argo-observed temperature (blue line) and salinity (red line) changes at diff erent depths before (June 17), during (June 21) and after (June 25) the typhoon
327No.2 GUO et al.: Upper ocean response to typhoon
wind speed of 35.1 m/s inverted from Radarsat-2 data at 10:40 UTC on June 21, it can be judged that a typhoon intensity was reached between 10:40 and 14:00 UTC on June 21, which is essentially consistent with results published on the China meteorological website.
To better study SST changes following the passage of the typhoon through the MSA, point 1 and point 2 were selected either side of the track of the typhoon as shown in Fig.4a. The SST variations from June 19 to 23 are presented in Table 5. The SST on the right side of the track before the passage of the typhoon was 0.88 and 0.38°C higher than that on the left side on June 19 and 20, respectively. During and after the typhoon, the SST diff erence between the right and left sides of the
Table 4 Change in velocity before and after the passage of the typhoon with depth
Time Depth (m) Flow velocity (m/s)
Before 51 0.4
After 51 0.84
Before 51–70 0.4
After 51–70 0.6
Before 70–100 0.4
After 70–100 0.5
Before 100–260 0.2
After 100–260 0.3
Before 260–350 0.1
After 260–350 0.2
Table 2 Weekly averaged data of the ST and SAL at diff erent depths, after the passage of typhoon Kujira, compared with NCAS observation data
Depth (m) ST (°C) Salinity ST (°C) Salinity ST (°C) Salinity
Data of subsurface buoy Data of NCAS Diff erent Diff erent
368 10.03 34.42 10 34.5 +0.03 -0.07
469 8.46 34.43 9 34.4 -0.54 +0.03
1 198 3.64 34.55 4 34.5 -0.36 +0.05
Table 3 Average changes in the ST and SAL in the ML and TML before, during, and after the typhoon
Item Before During After
ML-depth (m) 5.6–31 5.5–36 5.2–40
TML-depth (m) 32–60 37–56 41–50
ML-SST (°C) 30.96 30.178 29.807
ML-SAL 33.669 33.657 33.663
TML-SST (°C) 27.989 27.385 27.191
TML-SAL 33.707 5 33.657 33.764
368 m
469 m
948 m
1398 m
24.7 m
DuringDuring
After
35.7 m
100 m120 m
320 m340 m
After
370 m
480 m
500 m
1000 m
1200 m
Downwelling
Upwelling
Rainfall area
Meteorological station
Subsurface buoy
Agro floatTyphoon track
Fig.13 Idealized sketch of initial fi elds after storm passage
Vol. 38328 J. OCEANOL. LIMNOL., 38(2), 2020
track was less than that before the typhoon and the SST diff erence was a minimum of 0.06°C on June 21. The maximum change in the SST on the right side of the typhoon track was 2.09°C while that on the left side
was 1.43°C from June 19 to 23 as presented in Table 5. The SST response on the right side of the track was stronger than that on the left side as the typhoon wind-stress vector turned clockwise with time on the right side of the track and was roughly resonant with the mixed layer velocity (Price, 1981). Typhoon Kujira moved at a speed of about 2.8 m/s and the sea-air interaction caused the high SST to drop rapidly during the formation of the typhoon (Fig.4b & c). The vertical entrapment of typhoon Kujira caused pumping, and rainfall that deepened the mixing layer and thinned the thermocline, resulting in upwelling and downwelling
0.05
0.05
0.05
0.05
0.050.05
0.05 0.05
0.05
0.05
0.05
0.05
0.05
0.05 0.050.1
0.1 0.1
0.10.1
0.1
0.1
0.1
0.1
0.1
0.1
0.1
0.1
0.1
0.1
0.1
0.1 0.1
0.1
0.1
0.1
0.1
0.1 0.10.1
0.1
0.1
0.1
0.1
0.1 0.1
0.15
0.15
0.15
0.15
0.15
0.150.15
0.15
0.150.150.15
0.150.15
0.15
0.15
0.15
0.150.15
0.15
0.15
0.15
0.15
0.15
0.15
0.15
0.15
0.2
0.2
Time (h)
Dep
th (
m)
2 4 6 8 10 12 14 16 18 20 22 24
-660
-640
-620
-600
-580
-560
-540
-520
-500
-480
-460
0.05
0.1
0.15
0.2
0.25
0.25 m/s
0.05
0.05
0.1
0.1
0.1
0.10.1 0.10.1
0.1
0.1
0.1
0.1
0.1
0.1
0.1
0.1
0.1
0.1
0.1
0.10.1
0.1
0.1
0.15
0.15
0.1
5
0.15
0.15 0.15
0.15
0.15
0.15
0.15
0.150.15
0.150.15
0.15
0.150.15
0.15
0.1
5
0.15
0.15
0.20.20.2
0.2
0.2
0.2
0.20.2
0.2
0.2
0.2
0.2
0.2
0.2 0.2
0.2
0.2
0.2
0.20.2 0.2
0.2
0.2
0.2
0.250.250.25
0.25
0.25
0.25
0.25 0.25
0.2
5
0.250.25
0.25
0.25
0.25
0.25
0.25
0.25
0.2
5
0.25
0.25
0.30.30.3
0.3
0.3
0.3
0.3
0.3
0.30.3
0.30.3
0.3
0.3
0.3
0.3
0.30.3
0.3
0.350.35
0.350.350.35
0.35
0.35
0.350.4
0.40.40.40.4
0.40.4
0.450.45
0.45
0.450.45
0.450.45
0.45
0.45
0.45
0.50.50.50.5
0.50.5
0.550.55
0.550.55
0.55 0.60.60.60.6
0.6 0.650.650.650.65 0.70.70.70.75 0.75
Time (h)
Dep
th (
m)
0.1 m/s
2
a
b
4 6 8 10 12 14 16 18 20 22 24-450
-400
-350
-300
-250
-200
-150
-100
-50
0.1
(m/s)
(m/s)
0.2
0.3
0.4
0.5
0.6
0.7
Fig.14 Changes in the upper fl ow fi eld (a) and lower fl ow fi eld (b) on June 21, 2015 and those in the upper fl ow fi eld (c) and lower fl ow fi eld (d) during June 14–28, 2015 Contour lines represent changes in velocity, and vectors represent changes in fl ow fi eld
To be continued
Table 5 SST changes at two fi xed points during the typhoon transit
Data June 19 June 20 June 21 June 22 June 23
Point 1 30.57 30.24 30.08 29.36 29.14
Point 2 31.45 30.62 30.14 29.58 29.36
Diff erent between Point 2 and Point 1 0.88 0.38 0.06 0.22 0.22
329No.2 GUO et al.: Upper ocean response to typhoon
of the transmitting deep layer. This reduced the SST over a large area weakened the typhoon to a strong TC. SST cooling of about 1–2.5 C is generally due to vertical entrainment (Price, 1981; D’Asaro et al., 2007; Li et al., 2016). The results of analysis are consistent with the conclusion drawn by Chang and Anthes (1978) that SST cooling may reduce or even shut down heat fl uxes from the ocean to the atmosphere, thus aff ecting the evolution and intensity fl uctuations of TCs; i.e., there is a negative feedback of the ocean.
4.2 Analysis of the salinity and chl responses during typhoon formation
The SSS normally increases after a typhoon owing
to the vertical entrainment of the typhoon. However, Figure 5 shows that the SSS inverted from remote sensing data decreased after the passage of the typhoon. The remote sensing inversion of the rainfall rate and on-site observations reveal that both sides of the typhoon transit track were accompanied by heavy rainfall of about 100 mm/d. Owing to the infl uence of rainfall, the SSS decreased within the range of rainfall during and after the passage of the typhoon, and the maximum reduction amplitude on the right side of the track was about 2 in the MSA. This result is consistent with the conclusions of Sun et al. (2012), and Li et al. (2014). However, the salinity increased in areas not covered by rainfall and the maximum amplitude was
Fig.14 Continued
0.25 m/s
0.1 m/s
c
d
0.1
0.10.1
0.10.1
0.1
0.1
0.1
0.1
0.1
0.1
0.1
0.1
0.1
5
0.15
0.15
0.15
0.15
0.15
0.15
0.15
0.15
0.15
0.15
0.2
0.2
0.20.2
0.2
0.2
0.2
0.2
0.2
0.25
0.25
0.25
0.25
0.25
0.25
0.25
0.3
0.3
0.3
0.3
0.3
0.3
0.350.35
0.35
0.35
0.35
0.35
0.3
5
0.40.4
0.4
0.4
0.4
0.4
0.4
0.4
0.4
0.45
0.45
0.45
0.45
0.50.50.5
0.50.55
0.550.55 0.550.60.6 0.6
Time (d)
Dep
th (
m)
14 16 18 20 22 24 26 28-450
-400
-350
-300
-250
-200
-150
-100
-50
0.1
0.2
0.3
0.4
0.5
0.6
0.050.05
0.050.05
0.05
0.05
0.05
0.05
0.050.0
5
0.0
5
0.05
0.05
0.05
0.0
5
0.05
0.05
0.05
0.0
5
0.1
0.1
0.1
0.1
0.1
0.1
0.1
0.10.1
0.1
0.1
0.15
0.15
Time (d)
Dep
th (
m)
14 16 18 20 22 24 26 28
-660
-640
-620
-600
-580
-560
-540
-520
-500
-480
-460
0.05
0.06
0.07
0.08
0.09
0.1
0.11
0.12
0.13
0.14
0.15
(m/s)
(m/s)
Vol. 38330 J. OCEANOL. LIMNOL., 38(2), 2020
2. However, we found that the heavy rainfall on the right side of the track was not refl ected by the GPM data.
Figure 6b shows the distribution of the chl in the MSA during the typhoon and 4 d after the typhoon. Owing to weather conditions, optical remote sensing data are not complete and cannot be evaluated. However, data for the following 5 d show that the chl in the MSA and the adjacent coastal area was higher than that before the typhoon in Fig.6c. Our conclusion is basically consistent with the conclusion drawn by Zheng and Tang (2007) that both typhoon winds and rain enhance the production of marine phytoplankton.
4.3 Analysis of the response of the subsurface layer to the typhoon
The analysis of fl ow fi elds reveals that typhoon Kujira aff ected the fl ow fi eld at depths to 660 m and that the eff ect remained substantial at depths less than 450 m in the week after the typhoon’s passage. The typhoon aff ected the fl ow fi eld to a depth of 660 m as it formed and decayed over a period of 11 h and moved at an average speed of 60 m/h. We clearly see that the energy transferred to the ocean by the vertical entrainment and stirring of the typhoon is transferred downward layer by layer from Fig.13. Therefore, the upwelling and downwelling of seawater at diff erent depths due to the wind pump eff ect (including vertical mixing and upwelling) and the transfer to the deep sea can be analyzed using the fl uctuations of the ST and SAL recorded by the subsurface buoy and Agro fl oat.
A comparison of the ST and SAL data recorded by the subsurface buoy revealed that downwelling occurred at a depth of 368 m after the typhoon’s passage and that the upwelling occurred at a depth of 469 m as a pumping phenomenon. The eff ect of upwelling on the ST was found to lag increasingly with increasing depth. The data acquired by the 300-m ST Chain at a depth of 1 000 m indicate that pumping had diff erent degrees of infl uence on the MSA (Fig.12). Remote sensing data reveal the eff ect of the typhoon’s passage on the sea surface. The typhoon caused the SWH to reach 3.5–4 m, which aided the stirring of seawater. A comparison of meteorological observation data and remote sensing data reveals that the rainfall rate retrieved by remote sensing does not refl ect the large rainfall rate on the right side of the track of the typhoon. The SSTs shown in Fig.2c (during the typhoon’s passage) and in Fig.2d & e (after the typhoon’s passage) are obviously lower than those before the passage of the typhoon owing to
vertical entrainment, air-sea interaction, and rainfall. The SSS shown in Fig.5b (during and after the typhoon’s passage) is lower than that before the typhoon (Fig.5a) in the area of rainfall (+), while the SSS in the area without rainfall is higher (−) owing to vertical entrainment in Fig.5c. The decrease in SSS was induced by the intense precipitation associated with typhoon Kujira, because rainfall injects fresh water into the ocean. The above analysis reveals that wind pumping generated by typhoon Kujira contributed substantially to the decrease in SST and the increase in SSS but rainfall also played a role in reducing SSS.
5 CONCLUSION
The surface and subsurface physical responses of the ocean to typhoon Kujira were quantifi ed using available multi-satellite observations, weather station observations, and Argo fl oat and subsurface buoy data. The typhoon moved at a speed of about 2.8 m/s; however, its impact on the YXIA persisted for over a week. Analysis of both satellite observations and on-site data confi rms that strong winds increased the SWH and that vertical entrainment and stirring resulted in a maximum decrease in the sea surface temperature of 2.5°C while heavy rain resulted in a maximum decrease in sea surface salinity of 2, leading to upwelling and downwelling of the deep sea. The high temperature and low salinity at the sea surface downwelling directly to 24.7 m, and the ST and SAL of the subsidence are basically consistent with the SST and SSS results of remote sensing inversion. Agro buoy data, with lower ST and higher SAL from the mixed layer to the sea surface, clearly shows an increase in SSS (with maximum amplitude of 2) with no cover by rain area and chl (0.04 mg/m 3 ). The SST decreased not only the immediate vertical entrainment associated with heat extraction and redistribution but also that associated with pumping and persistent upwelling below the ML. However, rainfall reduced the SSS after the passage of the typhoon at rain-covered area. Large-scale rainfall not only dilutes the sea surface salinity but, accompanied by upwelling, also rapidly reduces the sea surface temperature, which inhibits the strengthening of slow-moving (<2.8 m/s) typhoons. With a reduction in the sea surface temperature, typhoons lack energy and weaken to TCs within 1 d. In any event, strong vertical entrainment and mixing due to typhoon-strength winds transfer energy to the ocean, strengthening the near-surface ocean current and
331No.2 GUO et al.: Upper ocean response to typhoon
deep transfer accompanied by upwelling and downwelling.
Typhoon Kujira had been moving across the sea surface for less than 2 d, and its initial wind force had just reached typhoon level. However, it transferred a huge amount of energy to the ocean, the typhoon aff ected the fl ow fi eld to a depth of 660 m as it formed and decayed over a period of 11 h and moved at an average speed of 60 m/h. Typhoon entrainment induced pumping which aff ected diff erent depths to about 1 km for 1 week after the typhoon in buoys and bringing vitality to the sea area of Yongxing Island. The SST response on the right side of the track was stronger than that on the left side as the typhoon wind-stress vector turned clockwise with time on the right side of the track and was roughly resonant with the ML velocity. The ML deepened and the TML thinned from the subsurface layer. This shallow divergence-convergence fl ow can lead to a shallow overturning fl ow in the upper ocean, potentially aff ecting large-scale ocean circulations and climates.
6 DATA AVAILABILITY STATEMENT
Data available on request from the authors.
7 ACKNOWLEDGMENT
We thank the South China Sea Institute of Oceanology for providing observation data from the weather station on Yongxing Island, and QI Yiquan of the South China Sea Institute of Oceanology for providing the moored ADCP data. Helpful advice from Dr. LI Xiaofeng is also greatly appreciated.
References
Bian C W, Jiang W S, Song D H. 2010. Terrigenous transportation to the Okinawa Trough and the infl uence of typhoons on suspended sediment concentration. Continental Shelf Research , 30 (10-11): 1 189-1 199, https://doi.org/10.1016/j.csr.2010.03.008.
Byju P, Kumar S P. 2011. Physical and biological response of the Arabian Sea to tropical cyclone Phyan and its implications. Marine Environmental Research , 71 (5): 325-330, https://doi.org/10.1016/j.marenvres.2011.02.008.
Chang G C, Dickey T D, Williams III A J. 2001. Sediment resuspension over a continental shelf during hurricanes Edouard and Hortense. Journal of Geophysical Research : Oceans , 106 (C5): 9 517-9 531.
Chang S W, Anthes R A. 1978. Numerical simulations of the ocean’s nonlinear baroclinic response to translating hurricanes. Journal of Geophysical Research , 8 (3): 468-480.
Chu P C, Veneziano J M, Fan C W, Carron M J, Liu W T. 2000.
Response of the South China Sea to tropical cyclone Ernie 1996. Journal of Geophysical Research , 105 (C6): 13 991-14 009.
D’Asaro E A, Sanford T B, Niiler P P, Terrill E J. 2007. Cold wake of hurricane Frances. Geophysical Research Letters , 34 (15): L15609, https://doi.org/10.1029/2007GL030160.
Dickey T, Frye D, McNeil J, Manov D, Nelson N, Sigurdson D, Jannasch H, Siegel D, Michaels T. Johnson R. 1998. Upper-ocean temperature response to hurricane Felix as measured by the Bermuda testbed mooring. Monthly Weather Review , 126 (5): 1 195-1 201.
Domingues R, Goni G, Bringas F, Lee S K, Kim H S, Halliwell G, Dong J L, Morell J, Pomales L. 2015. Upper ocean response to Hurricane Gonzalo (2014): Salinity eff ects revealed by targeted and sustained underwater glider observations. Geophysical Research Letters , 42 (17): 7 131-7 138.
Fang X J, Wang C X, Xu J J. 2013. Seasenal and interannual variations of the thermocline depth in the South China Sea. Transactions of Oceanology and Limnology , (3): 45-55, https://doi.org/10.13984/j.cnki.cn37-1141. (Chinese)
Gill A E. 1984. On the behavior of internal waves in the wakes of storms. Journal of Physical Oceanography , 14 (7): 1 129-1 151.
Guan F C, Xie Q H. 1984. The statistical characteristics of typhoon in the South China Sea. Marine Science Bulletin , 3 (4): 19-27. (Chinese)
Guan S D, Zhao W, Huthnance J, Tian J W, Wang J H. 2014. Observed upper ocean response to typhoon Megi(2010) in the Northern South China Sea. Journal of Geophysical Research : Ocean , 119 (5): 3 134-3 157, https://doi.org/10. 1002/2013JC009661
Guo J, Zhang T L, Zhang B, Mu Y K. 2018. Upper ocean response of Yongxing Island area to typhoon ‘Kujira’ in the South China Sea from multiple-satellite and fi xed-point observation. In : 2018 Progress in Electromagnetics Research Symposium. Toyama, Japan: IEEE, https://ieeexplore.ieee.org/document/8597611/metrics#metrics.
Herbeck L S, Unger D, Krumme U, Liu S M, Jennerjahn T C. 2011. Typhoon-induced precipitation impact on nutrient and suspended matter dynamics of a tropical estuary aff ected by human activities in Hainan, China. Estuarine Coastal and Shelf Science , 93 (4): 375-388.
Iverson R L. 1997. Mesoscale oceanic phytoplankton patchiness caused by hurricane eff ects on nutrient distribution in the Gulf of Mexico. In : Andersen N R, Zahuranec B J eds. Oceanic Sound Scattering Prediction. Plenum Press, Plenum. p.767-778.
Knaff J A, DeMaria M, Sampson C R, Peak J E, Cummings J, Schubert W H. 2013. Upper oceanic energy response to tropical cyclone passage. Journal of Climate , 26 (8): 2 631-2 650.
Li X F, Zhang J A, Yang X F, Pichel W G, DeMaria M, Long D, Li Z W. 2013. Tropical cyclone morphology from space borne synthetic aperture radar. Bulletin of the American Meteorological Society , 94 (2): 215-230.
Li Y H, Wang A J, Qiao L, Fang J Y, Chen J. 2012. The impact
Vol. 38332 J. OCEANOL. LIMNOL., 38(2), 2020
of typhoon Morakot on the modern sedimentary environment of the mud deposition center off the Zhejiang-Fujian Coast, China. Continental Shelf Research , 37 : 92-100.
Li Y H, Xu X H, Yin X J, Fang J Y, Hu W Y, Chen J. 2015. Remote-sensing observations of Typhoon Soulik (2013) forced upwelling and sediment transport enhancement in the northern Taiwan Strait. International Journal of Remote Sensing , 36 (8): 2 201-2 218, https://doi.org/10.1080/01431161.2015.1035407.
Li Y X, Yang Y J, Sun L, Fu Y F. 2016. The upper ocean environment responses to typhoon Prapiroon (2012). In : Proceedings of SPIE 9261, Ocean Remote Sensing and Monitoring from Space. SPIE, Beijing, China. 92610Up, https://doi.org/10.1117/12.2069263.
Lin I I, Wu C C, Emanuel K A, Lee I H, Wu C R, Pun I F. 2005. The interaction of supertyphoon Maemi (2003) with a warm ocean eddy. Monthly Weather Review , 133 (9): 2 635-2 649.
Lin I I. 2012. Typhoon-induced phytoplankton blooms and primary productivity increase in the western north Pacifi c subtropical ocean. Journal of Geophysical Research : Oceans , 117 (C3): C03039, https://doi.org/10.1029/ 2011JC007626.
Lin I, Liu W T, Wu C C, Wong G T F, Hu C M, Chen Z Q, Liang W D, Yang Y, Liu K K. 2003. New evidence for enhanced ocean primary production triggered by tropical cyclone. Geophysical Research Letters , 30 (13): 1 718, https://doi.org/10.1029/2003GL017141.
Liu J L, Cai S Q, Wang S G. 2011. Observations of strong near-bottom current after the passage of typhoon Pabuk in the South China Sea. Journal of Marine Systems , 87 (1): 102-108, https://doi.org/10.1016/j.jmarsys.2011.02.023.
Liu Z H, Xu J P, Sun C H, Wu X F. 2014. An upper ocean response to typhoon Bolaven analyzed with Argo profi ling fl oats. Acta Oceanologica Sinica , 33 (11): 90-101.
Mei W, Pasquero C. 2012. Restratifi cation of the upper ocean after the passage of a tropical cyclone: A numerical study. Journal of Physical Oceanography , 42 (9): 1 377-1 401.
Meissner T, Wentz F J. 2016. Remote Sensing Systems SMAP ocean surface salinities [Level 2C, Level 3 Running 8-day, Level 3 Monthly], Version 2.0 validated release. Remote Sensing Systems, Santa Rosa, CA, USA. Available at http://images.remss.com/papers/rsstech/2016_Meissner_SMAP_SSS_Release_V2.pdf.
Price J F, Sanford T B, Forristall G Z. 1994. Forced stage response to a moving hurricane. Journal of Physical Oceanography , 24 (2): 233-260.
Price J F. 1981. Upper ocean response to a hurricane. Journal of Physical Oceanography , 11 (2): 153-175, https://doi.org/10.1175/1520-0485(1981)011<0153:UORTAH>2.0.CO;2.
Rabe T J, Kukulka T, Ginis I, Hara T, Reichl B G, D’Asaro E A, Harcourt R R, Sullivan P P. 2015. Langmuir turbulence under hurricane Gustav (2008). Journal of Physical Oceanography , 45 (3): 657-677.
Rayson M D, Ivey G N, Jones N L, Lowe R J, Wake G W,
McConochie J D. 2015. Near-inertial ocean response to tropical cyclone forcing on the Australian north-west shelf. Journal of Geophysical Research : Oceans , 120 (12): 7 722-7 751.
Shang S L, Li L, Sun F Q, Wu J Y, Hu C M, Chen D W, Ning X R, Qiu Y, Zhang C Y, Shang S P. 2008. Changes of temperature and bio-optical properties in the South China Sea in response to Typhoon Lingling, 2001. Geophysical Research Letters , 35 (10): L10602, https://doi.org/10. 1029/2008GL033502.
Shay L K, Goni G J, Black P G. 2000. Eff ects of a warm oceanic feature on hurricane opal. Monthly Weather Review , 128 (5): 1 366-1 383.
Shen J Q, Qiu Y, Zhang S W, Kuang F F. 2017. Observation of tropical cyclone induced shallow water currents in Taiwan Strait. Journal of Geophysical Research : Oceans , 122 (6): 5 005-5 021.
Stramma L, Cornillon P, Price J F. 1986. Satellite observations of sea surface cooling by hurricanes. Journal of Geophysical Research : Oceans , 91 (C4): 5 031-5 035.
Sun L, Li Y X, Yang Y J, Wu Q Y, Chen X T, Li Q Y, Li Y B, Xian T. 2014. Eff ects of super typhoons on cyclonic ocean eddies in the western north pacifi c: A satellite data-based evaluation between 2000 and 2008. Journal of Geophysical Research : Oceans , 119 (9): 5 585-5 598, https://doi.org/10.1002/2013JC009575.
Sun L, Yang Y J, Fu Y F. 2009. Impacts of typhoons on the Kuroshio large meander observation evidences. Atmospheric and Oceanic Science Letters , 2 (1): 45-50.
Sun L, Yang Y J, Xian T, Wang Y, Fu Y F. 2012. Ocean responses to typhoon Namtheun explored with Argo fl oats and multiplatform satellites. Atmosphere - Ocean , 50 (S1): 15-26, https://doi.org/10.1080/07055900.2012.742420.
Wei J Z, Tang D L. 2011. A Statistical study of origin and intensity of tropical cyclone on the north western Pacifi c. Journal of Applied Statistics and Management , 30 (3): 512-521. (in Chinese)
Wei W, Lien C C, Lin I I, Xie S P. 2015. Tropical cyclone-induced ocean response: a comparative study of the South China Sea and tropical northwest Pacifi c. Journal of Climate , 28 (15): 5 952-5 968.
Xu H B, Tang D L, Sheng J Y, Liu Y P, Sui Y. 2018. Study of dissolved oxygen responses to tropical cyclones in the Bay of Bengal based on Argo and satellite observations. Science of the Total Environment , 659 : 912-922
Yang B, Hou Y J, Li M. 2019. Response of the western north Pacifi c subtropical ocean to the slow-moving super typhoon Nanmadol. Journal of Oceanology and Limnology , 37 (3): 938-956, https://doi.org/10.1007/s00343-019-8114-0.
Yang L, Wang D X, Huang J, Wang X, Zeng L L, Shi R, He Y K, Xie Q, Wang S G, Chen R Y, Yuan J N, Wang Q, Chen J, Zu T T, Li J, Sui D D, Peng S Q. 2015. Toward a mesoscale hydrological and marine meteorological observation network in the South China Sea. Bulletin of the American Meteorological Society , 96 (7): 1 117-1 135, https://doi.org/10.1175/BAMS-D-14-00159.1.
333No.2 GUO et al.: Upper ocean response to typhoon
Yang Y J, Sun L, Liu Q, Xian T, Fu Y F. 2010. The biophysical responses of the upper ocean to the typhoons Namtheun and Malou in 2004. International Journal of Remote Sensing , 31 (17-18): 4 559-4 568.
Ye H J, Sheng J Y, Tang D L, Morozov E, Ali Kalhoro M, Wang S F, Xu H B. 2018. Examining the impact of tropical cyclones on air-sea CO 2 exchanges in the Bay of Bengal based on satellite data and in-situ observations. Journal of Geophysical Research : Oceans , 124 (1): 555-576, https://doi.org/10.1029/2018JC014533.
Yue X X, Zhang B, Liu G Q, Li X F, Zhang H, He Y J. 2018. Upper ocean response to typhoon Kalmaegi and Sarika in the South China Sea from multiple-satellite observations and numerical simulations. Remote sensing , 10 (3): 348, https://doi.org/10.3390/rs10020348.
Zeng L L, Wang Q, Xie Q, Shi P, Yang L, Shu Y Q, Chen J, Sui D D, He Y K, Chen R Y, Wang D X. 2015. Hydrographic fi eld investigations in the Northern South China Sea by open cruises during 2004-2013. Science Bulletin , 60 (6): 607-615.
Zhang B, Perrie W, Vachon P W, Li X F, Pichel W G, Guo J, He Y J. 2012. Ocean vector winds retrieval from C-band fully polarimetric SAR measurements. IEEE Transactions on
Geoscience and Remote Sensing , 50 (11): 4 252-4 261, https://doi.org/10.1109/TGRS.2012.2194157.
Zhang B, Perrie W, Zhang J A, Uhlhorn E, He Y J. 2014a. High resolution hurricane vector winds from C-band dual-polarization SAR observations. Journal of Atmospheric and Oceanic Technology , 31 (2): 272-286, https://doi.org/10.1175/JTECH-D-13-00006.1.
Zhang B, Perrie W. 2014b. Recent progress on high wind speed retrieval from multi-p4olarization SAR imagery: a review. International Journal of Remote Sensing 35 (11-12): 4 031-4 045.
Zhang G S, Zhang B, Perrie W, Xu Q, He Y J. 2014c. R. IEEE Transactions on Geoscience and Remote Sensing , 52 (11): 7 186-7 194, https://doi.org/10.1109/TGRS.2014.2308839.
Zhao H, Han G Q, Zhang S W, Wang D X. 2013. Two phytoplankton blooms near Luzon Strait generated by lingering typhoon Parma. Journal of Geophysical Research , 118 (2): 412-421.
Zheng G M, Tang D L. 2007. Off shore and nearshore chlorophyll increases induced by typhoon winds and subsequent terrestrial rainwater runoff . Marine Ecology - Progress Series , 333 : 61-74. https://doi.org/10.3354/meps333061.