Embed Size (px)
Citation preview

UPPER WEST FORK GALLATIN RIVER – NITRATE MONITORING PROJECT
SUMMER 2009
Prepared for: Blue Water Task Force PO Box 160513 Big Sky, MT 59716 Prepared by:
Songline Environmental, LLC 5361 Violet Road Bozeman, Montana 59718

Upper West Fork Gallatin River – Nitrate Monitoring Project - Summer 2009
TABLE OF CONTENTS
1.0 Background…………………………………………………………………………..1 2.0 Project Goals……..…………………………………………………………………..2
3.0 Methods………….…………………………………………………………………...2
3.1 Monthly Sample..……………………………………………………...………..2 3.2 Stormwater Sample..…………………………………………………...……….3 3.3 Algal Growth – Photo Documentation...………………………………..………7 3.4 Shallow Groundwater Monitoring Wells.…………………………..…………..7
4.0 Results…………………………...…………………………………………………...8
4.1 Monthly Sample..……………………………………………………...………..8 4.2 Shallow Groundwater Monitoring Wells …………………………...………...10 4.3 Algal Growth – Photo Documentation...………………………………………11
5.0 Discussion…………………………………….……………………………..………14
5.1 In-Stream Sample……………………………………………………..………..14 5.2 Tributary Sample…………...……………………………………….…………15 5.3 Shallow Groundwater Monitoring Well Sample..……………………………..15 5.4 Algal Growth – Photo Documentation………………………………………...15 5.5 ISCO 6712 Auto Sampler……………………………………………………...15 5.6 Recommendations for Future Study…………………………………………...16
6.0 Summary……………………………………………………………...……………..16 Appendix A. Nitrate + Nitrite Grab Sample Results, Upper West Fork of the Gallatin River Summer 2009

Upper West Fork Gallatin River – Nitrate Monitoring Project - Summer 2009
1
1.0 Background Waters in Montana are protected from excessive nutrient concentrations by narrative standards, which stipulate:
“State surface waters must be free from substances attributable to municipal, industrial, agricultural practices or other discharges that will create conditions which produce undesirable aquatic life” [ARM 17.30.637 (1)(e)].
As part of the Upper Gallatin Total Maximum Daily Load assessments in the West Fork watershed, extensive streamwater nitrogen data was collected between September 2005 and August 2008 by Montana State Univerisity researchers, and PBS&J consulting. Results indicate: • Maximum nitrate concentrations occurred during winter when biotic (plants, algae, microbes)
demand for nutrients and stream flows were minimal (Figure 2, Figure 3) [Gardner and McGlynn, in press].
• Minimum nitrate concentrations occurred when the summer high stream flows diluted
concentrations or later in the summer when biotic demand for nutrients on land and in streams (e.g., algae, plants) was at a maximum (Figure 3) [Gardner and McGlynn, 2009].
• Generally, nitrate concentrations were highest in the upper and lower West Fork watershed
where more human sources of nitrogen occur (e.g., fertilizers, septic systems, and golf courses) (Figure 3).
• During both the July and August monitoring timeframes, the nitrate+nitrite load increased
notably between the Bunker site and the Little Coyote site on the West Fork Gallatin River (Figure 4) [PBS&J 2008].
• Phosphate, ammonium, and nitrite concentrations at all sites were close to or below the
analytical detection level [PBS&J 2008; Gardner and McGlynn, 2009]. • Although nitrate concentrations in the West Fork were slightly above target values (between
0.06 and 0.08 mg/L) during the growing season, excess algal growth was observed [PBS&J 2008].
• Chlorophyll a data collected during summer 2005 indicated concentrations above
background levels in the lower reaches of the West Fork and South Fork Gallatin [PBS&J 2008].
• Algae growth within the West Fork Gallatin River increased in a downstream direction along
the golf course and the waster water treatment ponds, with generally homogenous growth across the entire streambed at the sites just upstream of the confluence with the South Fork West Fork Gallatin River [PBS&J 2008].

Upper West Fork Gallatin River – Nitrate Monitoring Project - Summer 2009
2
2.0 Project Goals for the Summer 2009 Field Season The goal of the Upper West Fork of the Gallatin River Nitrate Monitoring Plan, Summer 2009 was to:
1) Create a monthly ‘snapshot’ of nitrate-nitrite concentrations in the Upper West Fork of the Gallatin River. This data-set was to be used to identify potential nutrient pollution sources and / or patterns in increased nitrate-nitrate load along the Upper West Fork of the Gallatin River
2) Conduct photo-documentation of algal growth patterns along the reach 3) Install, test, and verify the use of ISCO 6712 auto-sampling equipment for the purpose of
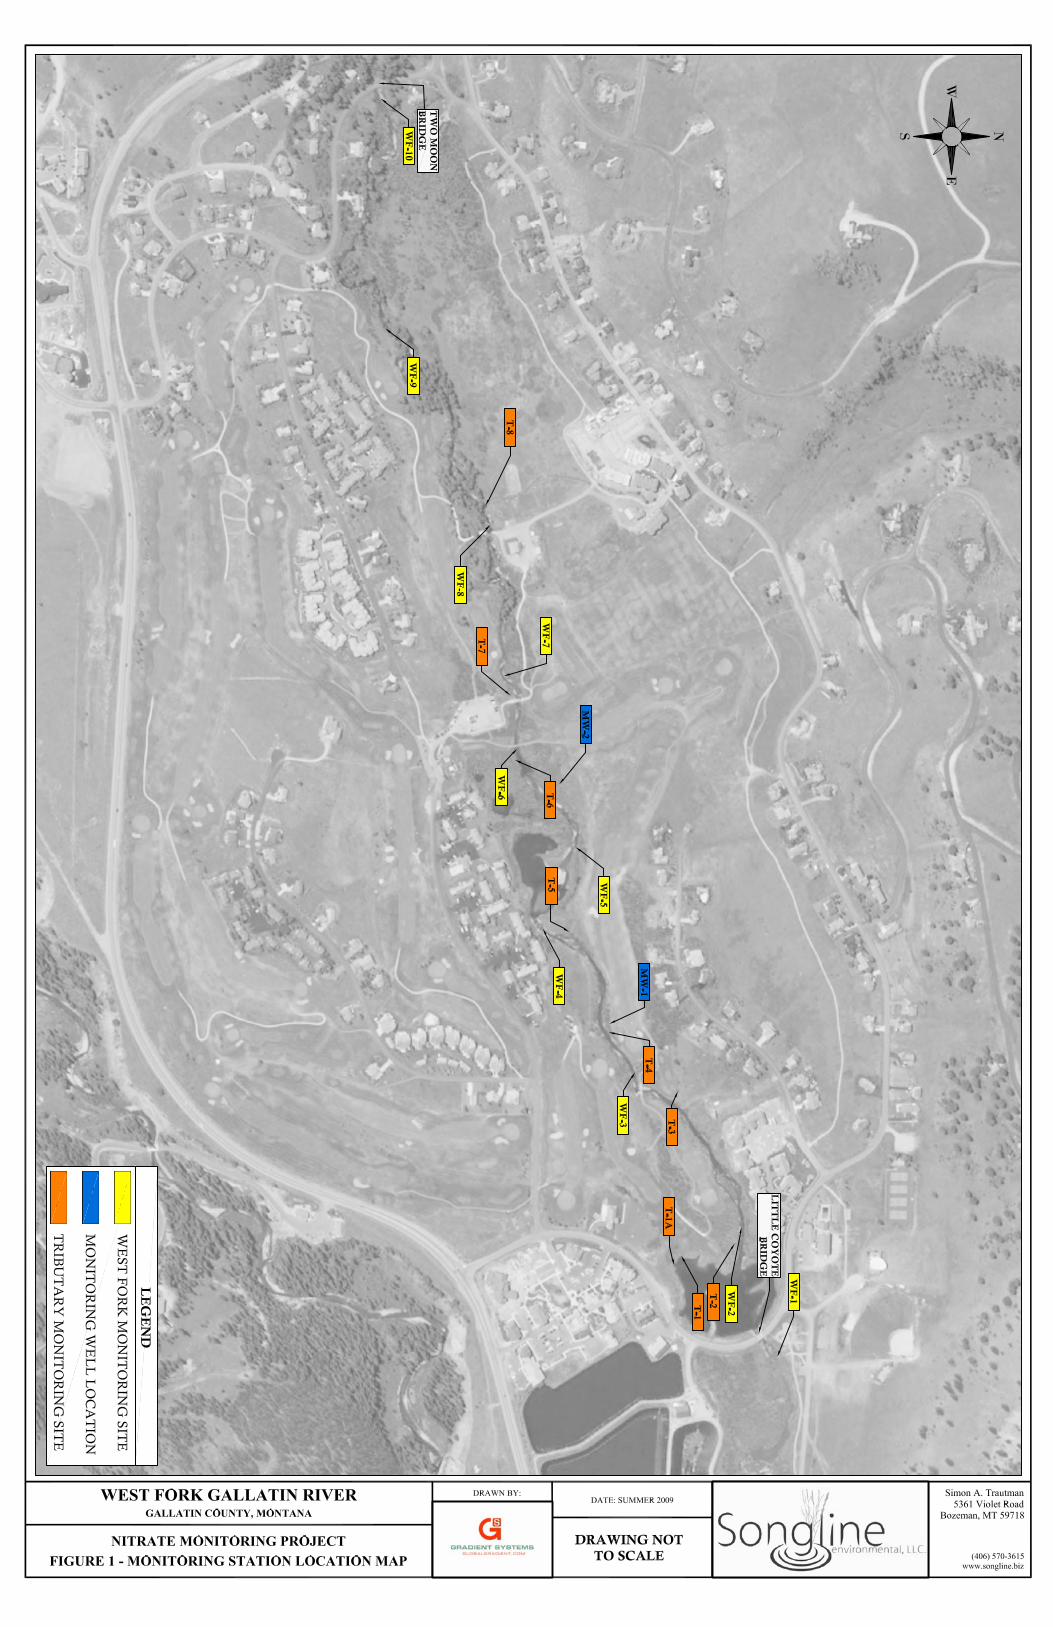
collecting data during storm water runoff events 3.0 Methods For the purpose of this study, the Upper West Fork of the Gallatin River is defined by the reach of the West Fork of the Gallatin River that runs through the Big Sky Golf Course; more specifically extending from the 2 Moon Bridge, downstream to the Little Coyote Bridge (Figure 1). Grab samples were collected in 250ml containers, and stabilized with sulfuric acid. Nitrate + Nitrite concentrations were determined by Energy Laboratories in Billings, Montana. 3.1 Monthly Sample Ten in-stream monitoring sites and eight surface water tributaries to the Upper West Fork were identified through field reconnaissance during May of 2009 (Figure 1). In-stream sampling sites were located between surface water inputs from small tributaries along the reach. The designation of surface water tributaries was confined to those small streams where grab sample collection was possible. There are many small scale gains where wetlands and seeps enter the river that were not sampled. Monthly sampling began at the end of May and concluded in October. As expected, several of the identified surface water tributaries ceased to flow during mid summer. In-stream grab samples from the Upper West Fork were collected mid-stream, while samples from tributaries were collected at the point the tributary intersects the stream. On a given sampling day, the sample set was completed within 2 hours. Monitoring site descriptions and specific geographic locations can be found in Table 1.

Upper West Fork Gallatin River – Nitrate Monitoring Project - Summer 2009
3
Table 1. Nitrate-Nitrite Monitoring Sites, Upper West Fork of the Gallatin River, Summer 2009
Designation Description Latitude Longitude
WF-1 East of Little Coyote bridge. Accounts for upstream wetland area, as well as T-1, T-2
45 16.217
111 16.450
WF-2 Upstream of wetland area. Accounts for hole 3 and T-3 45 16.180
111 17.616
WF-3 Upstream of bridge connecting holes 2 and 3. Accounts for hole 2, as well as T-4, T-5
45 16.097
111 17.771
WF-4 Downstream of central wetland area 45 16.027
111 17.929
WF-5 Upstream of central wetland area 45 16.046
111 18.043
WF-6 Downstream from hole 1 bridge. Accounts for Practice Area, T-6, T-7 (hole 18) 45 15.993
111 18.145
WF-7 Upstream from Practice Area bridge. Accounts for upper practice area and maintenance shop
45 15.994
111 18.174
WF-8 Upstream from maintenance shop bridge. Accounts for T-8 45 15.965
111 18.385
WF-9 Downstream of Curly Bear housing 45 15.877
111 18.616
WF-10 Upstream of 2 Moon Bridge - highest point in area of interest 45 15.873
111 18.864
T-1 Surface water input from drain on SE side of the church 45 16.130
111 17.587
T-1A Surface water input from church parking lot drain 45 16.122
111 17.581
T-2 Surface water input that splits holes 3 and 4 45 16.179
111 17.586
T-3 Surface water input that runs north of hole 2 shelter T-4 Hole 2 under drain (east)
T-5 Beaver dam diversion 45 16.037
111 17.932
T-6 Surface water input from pro shop area 45 15.944
111 18.133
T-7 Surface water input from parking area and hole 18 wetland system 45 15.989
111 18.203
T-8 Swale west of maintenance shop (drains condo development and Crail Creek overflow)
45 15.965
111 18.406
MW-1 Topographic low - hole 1 and Practice area 45 16.014
111 18.123
MW-2 Topographic low - hole 2 45 16.072
111 17.833
3.2 Storm Water Sample In an effort to document nutrient introduction via overland flow, automated samplers (ISCO 6712) were installed to monitor storm events greater than ½ inch of water. The samplers were placed above and below the golf course reach (WF-10 and WF-1). Samplers were installed at the beginning of August and were initially programmed to retrieve 5 samples every 20 minutes after a rainstorm of ½ inch or greater in a 1 hour period. Additionally, the sampler would take an additional 15 hourly samples after another ½ inch or greater rain. Field tests (manual triggering of the rain gauge) were conducted at each site to determine that the systems were working properly. Manual monitoring during the month of August revealed that the few rain events in

Upper West Fork Gallatin River – Nitrate Monitoring Project - Summer 2009
4
August were not sufficient to trigger the sampler. At this time the program was changed so that the sampling plan explained above would be triggered upon ½ inch of rain during a 3 hour period.
Figure 2. ISCO 6712 sampling site at the 2 Moon Bridge, Big Sky, Montana.
Figure 3. ISCO 6712 sampling site at the Little Coyote Bridge, Big Sky, Montana.

Upper West Fork Gallatin River – Nitrate Monitoring Project - Summer 2009
5
Station Description: Each sampling system is composed of:
• the data-logger assembly • pump • 30’of 3/8” tubing • 120 amh deep cycle battery • 40W solar panel • voltage regulator with battery clips • 24 500ml bottles • bottle assembly tub • computer interface cable • rain gauge • rain gauge interface cable • battery storage box • solar panel mounts, post, and guy wires
Programming: The samplers are currently programmed to begin sampling after receiving 0.5” of rain (or greater) during a 3 hour period. When this threshold has been met, the data-logger will engage the pump, clear the line 2 times, and fill one bottle every 20 minutes until 5 bottles are filled. In addition, if an additional 0.5” of rain is received, samplers will be taken every 20 minutes until the remaining 19 bottles are filled. To change the program, I recommend that you call the tech support line at 402-464-0231. The Owners Manual is vague and very difficult to use. Technical support on the other hand was very helpful and will construct and walk you through a program that will meet your needs. Set-Up: The assembly is extremely tough and can be located just about anywhere. The largest constraint is that they need to be within 30’ of the center of the stream (may make high water a bit challenging). Other considerations include:
o Out of the way of foot traffic o Adequate sunlight for solar panel, rain gauge exposure o Potential deadfall / snags o Limit elevation gain/loss between the sample tube and the pump
To set up: 1) Pick location. Excavate 6-9” hole the diameter of the sampler housing. Level the bottom of
the hole. 2) Place housing in hole – level top lip of housing. 3) Place bottle assembly tub in housing
a) it only fits right one way – make sure it is snug in the grooves

Upper West Fork Gallatin River – Nitrate Monitoring Project - Summer 2009
6
b) Make sure bottles are lined up correctly 4) Place data-logger onto lower housing and secure 5) Install solar panel 6) Excavate a level area for the battery storage box
a) Place box, check level 7) Place battery 8) Run solar charge cable into box
a) Wire voltage regulator b) Attach regulator clips to battery terminals
9) Mount rain gauge to battery storage box a) Ensure the tipping bucket is free b) Ensure the funnel is clear of debris c) Ensure the device is level (there is a level on the device) d) Attach the interface cable to the gauge and run the cable into the battery box e) Attach leads to battery terminal
10) Run sample tube to stream bed a) Minimize elevation gain/loss b) Secure vortex end to rebar anchor c) Protect/anchor tube with rocks
11) Start program a) Turn logger on b) Select ‘Run Extended Program’
Maintenance: 1) The program will stop once it has run through.
a) To restart simply go to the menu and choose ‘Run Extended Program x’ 2) Check as needed, or in accordance with seasonal rainfall 3) Rinse bottles between samples 4) Keep vortex generator clean….~2weeks in areas with high algal growth 5) Check battery voltage 6) Check wiring 7) Clean solar panel 8) To view sample report / rainfall report
a) Use the logger interface i) Hit the menu button ii) Select view sampling report iii) Use the directional arrows to toggle through the report
b) Use Flowmate c) Connect to the logger using the interface cable d) Open Flowmate, works as Windows interface

Upper West Fork Gallatin River – Nitrate Monitoring Project - Summer 2009
7
3.3 Algal Growth – Photo Documentation Photographs of the Upper West Fork streambed were taken on July 17, 2009 and on September 1, 2009 at WF-1, WF-2, WF-9, and WF-10. Transects were split into four equal sections, and photographs taken at the three intersecting points along each adjacent section. Pictures were taken below the water surface, approximately 10-15cm from the streambed. A measuring rod was included in order to give a sense of scale. The camera used is a Pentax Optio W60. 3.4 Shallow Groundwater Monitoring Wells Two shallow monitoring wells (MW-1, MW-2) were placed along the north side of the golf course reach (Figure 1). These wells were placed down slope from highly irrigated areas on the golf course, in locations assumed to have a high water table (Figure 4). The wells are 4-5 feet deep, and terminate 1 foot below the September 2009 water table. The wells were flushed with 50 gallons of water after placement. A typical construction drawing is included in Figure 5.
Figure 4. Monitoring well 2, located adjacent to Fairway 2, along the north bank of the Upper West Fork of the Gallatin River.

Upper West Fork Gallatin River – Nitrate Monitoring Project - Summer 2009
8
Figure 5. Typical construction of a shallow groundwater monitoring well.

Upper West Fork Gallatin River – Nitrate Monitoring Project - Summer 2009
9
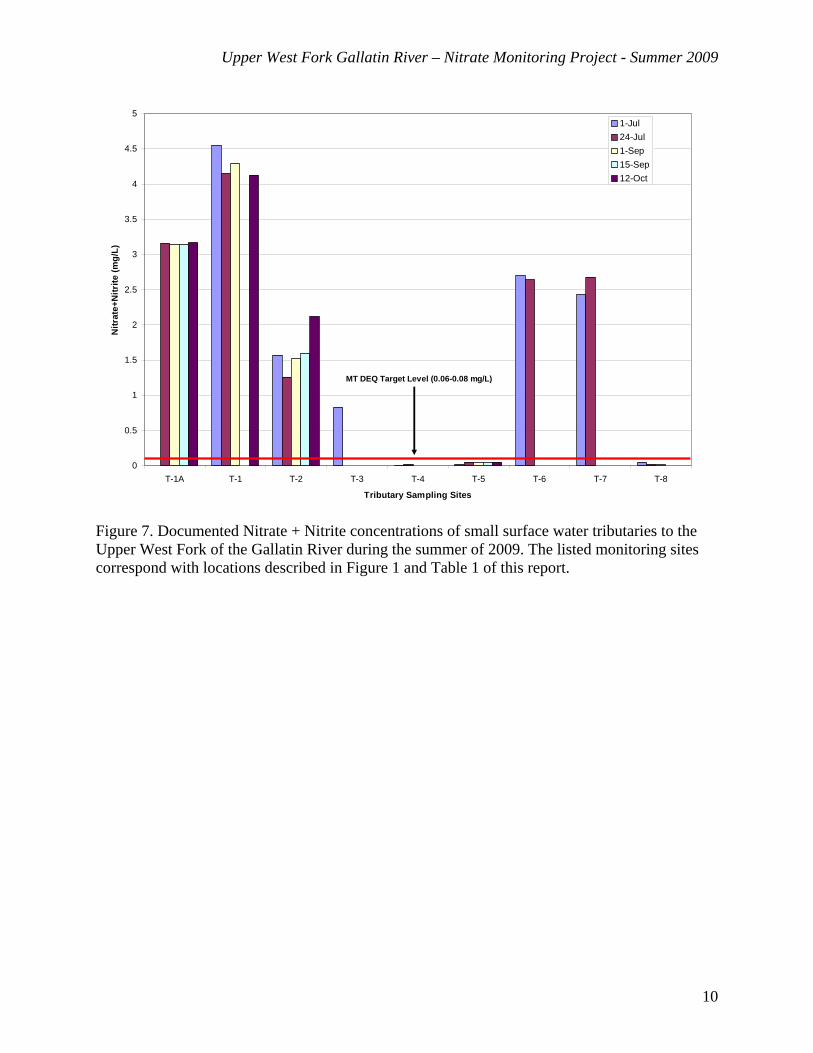
4.0 Results 4.1 Grab Sample Results Nitrate+Nitrite grab samples were taken on May 15 (12 samples), July 1 (18 samples), July 24 (18 samples), September 1 (17 samples), September 15 (17 samples), and October 12 (17 samples) of 2009 for a total of six sampling days. Detailed results can be seen in Appendix A. Figure 6 is a graphical comparison of in-stream Nitrate+Nitrite concentrations between each of the six independent data sets. Figure 7 is a graphical comparison between the Nitrate+Nitrite concentrations of the sampled surface water tributaries. The significant gaps in the data depicted in Figure 7 occurred as the summer progressed and tributaries dried dup due to the seasonal fluctuation of shallow groundwater systems.
0
0.1
0.2
0.3
0.4
0.5
0.6
WF-1 WF-2 WF-3 WF-4 WF-5 WF-6 WF-7 WF-8 WF-9 WF-10
West Fork Monitoring Site
Nitr
ate
+ N
itrite
(mg/
L)
15-May1-Jul24-Jul1-Sep15-Sep12-Oct
MT DEQ Target Level (0.06-0.08 mg/L)
Figure 6. Documented Nitrate + Nitrite concentrations in the Upper West Fork of the Gallatin River during the summer of 2009. The listed monitoring sites correspond with locations described in Figure 1 and Table 1 of this report.
Upper West Fork Gallatin River – Nitrate Monitoring Project - Summer 2009
10
0
0.5
1
1.5
2
2.5
3
3.5
4
4.5
5
T-1A T-1 T-2 T-3 T-4 T-5 T-6 T-7 T-8
Tributary Sampling Sites
Nitr
ate+
Nitr
ite (m
g/L)
1-Jul24-Jul1-Sep15-Sep12-Oct
MT DEQ Target Level (0.06-0.08 mg/L)
Figure 7. Documented Nitrate + Nitrite concentrations of small surface water tributaries to the Upper West Fork of the Gallatin River during the summer of 2009. The listed monitoring sites correspond with locations described in Figure 1 and Table 1 of this report.

Upper West Fork Gallatin River – Nitrate Monitoring Project - Summer 2009
11
4.2 Shallow Groundwater Monitoring Wells Three samples were taken from each of the shallow wells during the sample period (Figure 8). No nitrogen was detected in the sample from MW-2 on October 12, 2009.
0
0.05
0.1
0.15
0.2
0.25
0.3
0.35
MW-1 MW-2
Shallow Monitoring Well
Nitr
ate+
Nitr
ite (m
g/L)
1-Sep
15-Sep
12-Oct
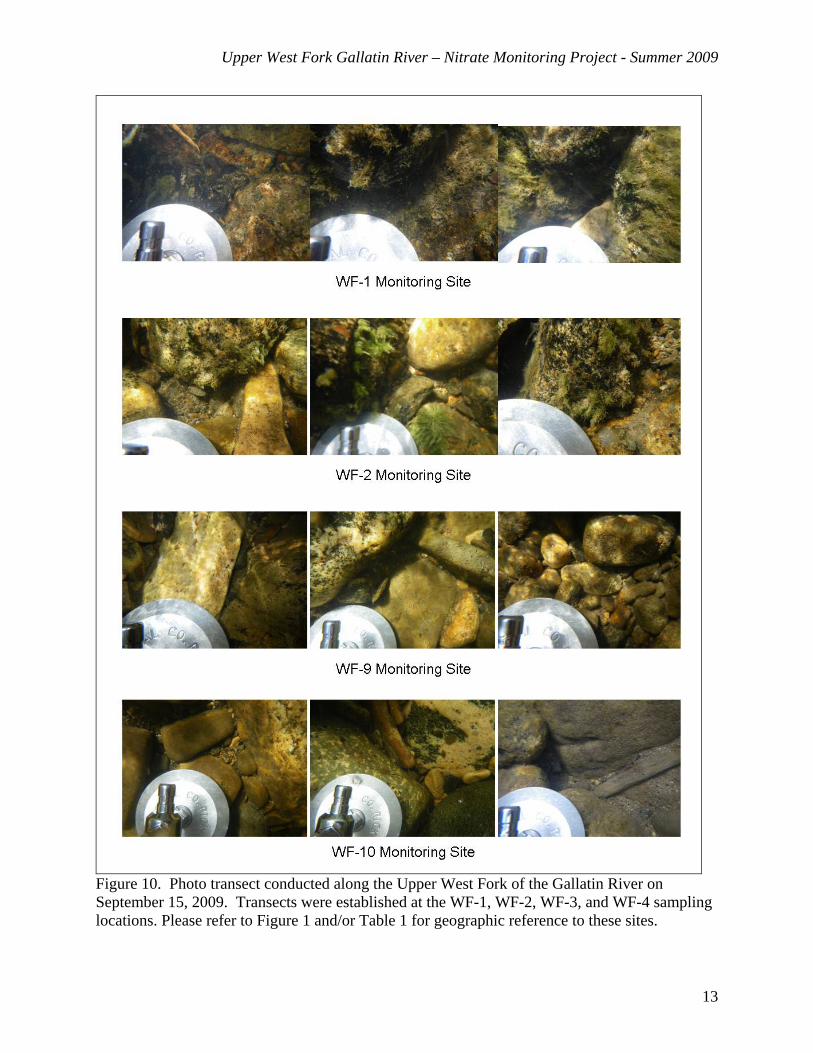
Figure 8. Documented Nitrate + Nitrite concentrations from shallow monitoring wells placed adjacent to the Upper West Fork of the Gallatin River during the summer of 2009. The listed monitoring sites correspond with locations described in Figure 1 and Table 1 of this report. 4.3 Algal Growth – Photo Documentation The photo transects depicted in Figures 9 and 10 were conducted on July 17 and September 15, 2009.

Upper West Fork Gallatin River – Nitrate Monitoring Project - Summer 2009
12
Figure 9. Photo transect conducted along the Upper West Fork of the Gallatin River on July 17, 2009. Transects were established at the WF-1, WF-2, WF-3, and WF-4 sampling locations. Please refer to Figure 1 and/or Table 1 for geographic reference to these sites.
Upper West Fork Gallatin River – Nitrate Monitoring Project - Summer 2009
13
Figure 10. Photo transect conducted along the Upper West Fork of the Gallatin River on September 15, 2009. Transects were established at the WF-1, WF-2, WF-3, and WF-4 sampling locations. Please refer to Figure 1 and/or Table 1 for geographic reference to these sites.

Upper West Fork Gallatin River – Nitrate Monitoring Project - Summer 2009
14
5.0 Discussion 5.1 In-stream Grab Sample During the summer months of 2009, the Nitrate+Nitrite concentration in the Upper West Fork of the Gallatin River consistently increased. The one exception to this observation is the May 15 data set, in which the highest concentrations were noted at the upper reaches of the sampling area. As much of the watershed above the golf course was still snow-covered at this time, the biotic demand for nutrients would have been low. The lower reaches were relatively snow free, and it is plausible that biotic demand was increasing and able to process much of the available nutrient at this time. As noted in previous reports, the minimum concentrations were noted early in the summer months (July 1 sample) and the maximum occurred later in the year after several hard freezes (October 12 sample). There is a consistent jump in the concentration downstream of WF-5 (Figure 6). This jump is accentuated in the October 12 dataset, and may be explained by the preceding freeze and decline of the terrestrial biotic uptake. The WF-5 sampling site is directly above the large pond / wetland complex downstream of the of the bunker area and adjacent to the Glacier Condominium complex (Figure 1). There is a smaller jump noted below WF-8 that appears to decrease in conjunction with the loss of input from T-6 and T-7 (as these tributaries cease to flow). Nitrogen target values of 0.06 – 0.08 mg/L were not exceeded above the Big Sky Golf Course, and were not exceeded in the lower reaches of the study area (below WF-5) until the September 1st sample (Figure 6, Appendix A). Due to a relatively wet and cool summer season, as per a conversation with Sam Woodger, it is my understanding that the golf course did not start a typical irrigation rotation until the 1st week of August. 5.2 Tributary Grab Sample Nitrogen concentrations in the tributary sampling sites were more consistent over time than those found in the main stream, and carried a substantially higher load. The maximum documented Nitrate+Nitrite concentration was 4.55 mg/L (Figure 7). Sites T-5 and T-8 are both true surface water tributaries (Crail Creek and a small oxbow/beaver channel on the West Fork) and exhibit very low concentrations more consistent with the samples taken from the upper reaches of the West Fork. The remainder of the monitored inputs are considered to have a primary groundwater component (either constructed drains, or lowland wetland drainage points), and as expected have a routinely higher concentration. Sites T-6 and T-7 are natural low points in wet areas on either side of the clubhouse parking area. Measureable surface flow ceased during the second week of August, but tested between 2.4 – 2.7 mg/L prior to that time. Sites T-1A, T-1, and T-2 were active during the duration of the monitoring period. T-2 is a topographic low that bisects fairways 2 and 3, and appears to have been purposefully entrenched in the past. Sites T-1A and T-1 are manually constructed drains, and carry a consistently higher load than the other measured inputs (~3.15 mg/L and ~4.3 respectively).
Upper West Fork Gallatin River – Nitrate Monitoring Project - Summer 2009
15
Rigorous discharge estimates were not conducted on the tributary sampling sites. In hindsight, it should have been done. I did conduct base flow estimates on T-1A (0.5 gal/min), T-1 (12 gal/min), and T-2 (2 gal/min). In comparison the estimated flow in the Upper West Fork at that time was ~10cfs. Although the measured Nitrate+Nitrite concentrations from groundwater sources are much higher than those found in the river, it is evident that they do not fully represent the increased downstream load measured in the stream. As discussed above, a consistent increase in nitrogen concentration is measured downstream from sample site W-5. Sites T-5, T-4, and T-3 do not contribute significant nutrients to the stream, and therefore cannot explain the measured increase seen at WF-2 and WF-1. In addition, sites T-1A, T-1, and T-2 are located downstream of the W-2 sampling site. Comparisons between the concentrations measured at W-1 and W-2 are remarkably similar, suggesting that the wetland/pond system upstream of the Little Coyote Bridge is handling much of the local nutrient input from the tributaries, and that the increased load can not be simply attributed to measured input from the identified tributaries. 5.3 Shallow Groundwater Monitoring Wells These wells were placed in an attempt to quantify the nitrogen concentration of shallow groundwater in those areas. Both wells are in topographic lows down-slope of irrigated regions of the golf course. MW-1 is downstream of WF-6 in a wetland area ~30 feet from the river. MW-2 is immediately upstream from WF-3 and ~10 feet from the river. Results from MW-1 ranged from 0.09 to 0.33 mg/L. Results from MW-1 ranged from 0 – 0.02 mg/L. Sample collection is most easily achieved with a bailer; attempts at using an automated pump resulted in unacceptable amounts of sediment in the samples. Results from this summer are scant, and disparate between sites. Additional analysis of ground water sampling conducted by the BWTF and the Montana Bureau of Mines and Geology during the field season may be more conclusive. 5.4 Algal Growth – Photo Documentation The photo transects depicted in Figures 9 and 10 depict a clear and marked difference between algal growth above and below the Big Sky Golf course, and are consistent with the measured downstream nutrient increase. New and residual growth is evident in the WF-1 and WF-2 on July 1, 2009, as compared to WF-9 and WF-10, where growth is limited. By September 15, the bed surface at WF-1 and WF-2 is almost entirely covered, while the substrate at WF-9 and WF-10 is distinct and predominantly devoid of growth. 5.5 ISCO 6712 Auto Sampler No relevant data was collected from the ISCO samplers during the period. The paucity of data is not a result of equipment failure, but a combination of poor timing and programming. The initial program relied on a 0.5 in/hour trigger to initiate sampling (based on the assumption that this type of event would result in significant overland flow from the golf course). In hindsight, this was an overly ambitious event, and in time was changed to 0.5 in/3hrs. Although it is not uncommon to receive a 1 in/hr in the Big Sky locale, storms generally have a strong orographic component and it is common for heavy rainfall to be constrained to small geographic regions

Upper West Fork Gallatin River – Nitrate Monitoring Project - Summer 2009
16
within the watershed. In short, we did not get any storms large enough to trigger the sampler rain gauge during period that they were installed. In order to effectively use the samplers in the future, combining the rain gauge trigger with a stream discharge component and/or manual component will be more effective. 5.6 Recommendations for Future Study
• Continue sampling during the 2010 season. Samples should begin while snow cover is present on the golf course, and continue into the fall until after the major freeze event.
• Retrieve and monitor the irrigation schedule and amount for both 2009 and 2010.
• Measure tributary discharge in addition to nitrogen concentrations. • Add more shallow monitoring wells as soon as the snow cover allows. The hypothesis to
be tested would be that irrigation increases the nitrate concentration in shallow groundwater that augments stream flow along the golf course reach. If money allows, it would be nice to have a well corresponding to each in-stream monitoring site. I believe that MW-2 may be within the stream side ‘mixing zone’…upon further reflection, it may be more effective to place shallow wells away from the stream and outside of this area.
• Calculate the irrigated land mass upstream and downstream of WF-6. • Use the ISCO samplers to look at prolonged irrigation events instead of storm events? To
do this we would need an estimate of travel time between wastewater application and arrival to the stream.
6.0 Summary
• During the summer months of 2009, Nitrate+Nitrite concentrations in the Upper West Fork consistently increase as the stream bisects the Big Sky Golf Course.
• From July to October 2009, the Nitrate+Nitrite concentration above the Big Sky Golf
Course was relatively static (except for a small jump after the 1st hard freeze), while the concentration below the course increased dramatically as the summer progressed.
• Although measured tributaries to the Upper West Fork have a consistently higher
concentration than the main-stem (groundwater sources), they do not account for the increased concentrations below WF-5. This observation suggests that the many gaining reaches in this area contribute a significant nutrient load to the stream.
• Qualitatively, algal growth patterns in the Upper West Fork are consistent with the
documented downstream increase in nutrients.

Upper West Fork Gallatin River – Nitrate Monitoring Project - Summer 2009
Appendix A
Nitrate + Nitrite Grab Sample Results, Upper West Fork of the Gallatin River Summer 2009

Date Time Sample ID Nitrate+Nitrite (mg/L) Notes5/15/2009 1248 4 0.11 Upstream of T-4 Drain5/15/2009 1150 8 0.36 Leak in Irrigation Pipe aupstream from WF-35/15/2009 1220 9 2.13 Trib from hole 3; T-1?5/15/2009 1226 11 1.9 Trib from development at NE end of course5/15/2009 1130 1 0.05 Corresponds to WF-15/15/2009 1210 2 0.05 Corresponds to WF-25/15/2009 1232 3 0.05 Corresponds to WF-35/15/2009 1250 5 0.1 Upstream of T-4 Drain, similar to WF-45/15/2009 1257 6 0.08 Corresponds to WF-55/15/2009 1307 7 0.29 Corresponds to WF-65/15/2009 no sample WF-75/15/2009 1315 10 0.14 Corresponds to WF-85/15/2009 no sample WF-95/15/2009 1330 12 0.15 Correspobnds to WF-10
Date Time Sample ID Nitrate+Nitrite (mg/L)7/1/2009 T-1A No Sample7/1/2009 1403 T-1 4.557/1/2009 1410 T-2 1.577/1/2009 1422 T-3 0.837/1/2009 1426 T-4 0.017/1/2009 1429 T-5 0.027/1/2009 1455 T-6 2.77/1/2009 1503 T-7 2.437/1/2009 1517 T-8 0.057/1/2009 1300 WF-1 0.067/1/2009 1415 WF-2 0.067/1/2009 1418 WF-3 0.047/1/2009 1436 WF-4 0.047/1/2009 1442 WF-5 0.047/1/2009 1448 WF-6 0.067/1/2009 1500 WF-7 0.047/1/2009 1513 WF-8 0.027/1/2009 1525 WF-9 0.027/1/2009 1540 WF-10 0.02
May 15, 2009 - Nitrate+Nitrite Grab Sample Results
July 1, 2009 - Nitrate+Nitrite Grab Sample Results

Date Time Sample ID Nitrate+Nitrite (mg/L)7/25/2009 1533 T-1A 3.167/25/2009 1540 T-1 4.157/25/2009 1543 T-2 1.267/25/2009 T-3 No Sample7/25/2009 1559 T-4 0.027/25/2009 1606 T-5 0.057/25/2009 1630 T-6 2.647/25/2009 1635 T-7 2.687/25/2009 1647 T-8 0.027/25/2009 1525 WF-1 0.087/25/2009 1545 WF-2 0.087/25/2009 1555 WF-3 0.077/25/2009 1611 WF-4 0.077/25/2009 1615 WF-5 0.067/25/2009 1622 WF-6 0.057/25/2009 1637 WF-7 0.047/25/2009 1645 WF-8 0.027/25/2009 1653 WF-9 0.027/25/2009 1700 WF-10 0.02
September 1, 2009 - Nitrate+Nitrite Grab Sample ResultsDate Time Sample ID Nitrate+Nitrite (mg/L)
9/1/2009 1422 T-1A 3.149/1/2009 1434 T-1 4.299/1/2009 1444 T-2 1.539/1/2009 T-3 No Sample9/1/2009 T-4 No Sample9/1/2009 1512 T-5 0.049/1/2009 T-6 No Sample9/1/2009 T-7 No Sample9/1/2009 1540 T-8 0.029/1/2009 1810 MW-1 0.099/1/2009 1800 MW-2 0.019/1/2009 1412 WF-1 0.169/1/2009 1451 WF-2 0.169/1/2009 1500 WF-3 0.119/1/2009 1515 WF-4 0.119/1/2009 1516 WF-5 0.079/1/2009 1523 WF-6 0.089/1/2009 1529 WF-7 0.059/1/2009 1538 WF-8 0.039/1/2009 1547 WF-9 0.029/1/2009 1600 WF-10 0.02
July 24, 2009 - Nitrate+Nitrite Grab Sample Results

Date Time Sample ID Nitrate+Nitrite (mg/L)9/15/2009 1448 T-1A 3.149/15/2009 1453 T-1 ND9/15/2009 1500 T-2 1.69/15/2009 T-3 No Sample9/16/2009 T-4 No Sample9/15/2009 1520 T-5 0.049/15/2009 T-6 No Sample9/15/2009 T-7 No Sample9/15/2009 1555 T-8 ND9/15/2009 1730 MW-1 0.159/15/2009 1630 MW-2 0.029/15/2009 1430 WF-1 0.189/15/2009 1505 WF-2 0.169/15/2009 1510 WF-3 0.129/15/2009 1525 WF-4 0.119/15/2009 1530 WF-5 0.079/15/2009 1539 WF-6 0.089/15/2009 1545 WF-7 0.059/15/2009 1552 WF-8 0.019/15/2009 1607 WF-9 0.019/15/2009 1617 WF-10 0.02
Date Time Sample ID Nitrate+Nitrite (mg/L)10/12/2009 1135 T-1A 3.1710/12/2009 1140 T-1 4.1310/12/2009 1145 T-2 2.1210/12/2009 T-3 No Sample10/12/2009 T-4 No Sample10/12/2009 1203 T-5 0.0510/12/2009 T-6 No Sample10/12/2009 T-7 No Sample10/12/2009 1235 T-8 ND10/12/2009 1215 MW-1 0.3310/12/2009 1158 MW-2 ND10/12/2009 1130 WF-1 0.510/12/2009 1150 WF-2 0.510/12/2009 1154 WF-3 0.3810/12/2009 1207 WF-4 0.3110/12/2009 1213 WF-5 0.1310/12/2009 1220 WF-6 0.0910/12/2009 1220 WF-7 0.0510/12/2009 1230 WF-8 0.0310/12/2009 1240 WF-9 0.0310/12/2009 1300 WF-10 0.03
October 12, 2009 - Nitrate+Nitrite Grab Sample Results
September 15, 2009 - Nitrate+Nitrite Grab Sample Results