Embed Size (px)
Citation preview
International Journal of Sustainable Built Environment (2015) 4, 136–144
HO ST E D BYGulf Organisation for Research and Development
International Journal of Sustainable Built Environment
ScienceDirectwww.sciencedirect.com
Original Article/Research
Urban agglomeration impact analysis using remote sensingand GIS techniques in Malegaon city, India
Rohith P. Poyil, Anil Kumar Misra ⇑
Department of Civil and Environmental Engineering, ITM University, Sector 23A, Palam Vihar, Gurgaon 122017, Haryana, India
Received 28 September 2014; accepted 13 February 2015
Abstract
Malegaon district has witnessed rapid urban growth over the past three decades, which has resulted in vast ecological and environ-mental issues, both in urban and peri-urban areas. This study proposes a quantitative method of land use change studies in Malegaondistrict, focusing on the changes in urban agglomeration, population, land use and land cover; and its correlation with the populationincrease, migration and urbanization led problems related with water and environmental degradation. Digital image processing of satel-lite images has been used as a main tool and the morphological growth was based on the analysis of satellite image series (3 differentdates, with time intervals between them). Images were preprocessed (atmospheric and geometric corrections) and classified accordingto the major land use like urban, agriculture, forest and water. The present study revealed an increase in settlement by 78% from1989 to 2006 and an increase by 26% from 2006 to 2008, along with the increase in population, migration from rural areas owing tothe economical growth and technological advantages associated with urbanization.� 2015 The Gulf Organisation for Research and Development. Production and hosting by Elsevier B.V. All rights reserved.
Keywords: Urban agglomeration; Digital image processing; Atmospheric and geometric corrections; Change detection analysis and GIS
1. Introduction
As per the statistics from the United Nations, the worldpopulation is expected to reach 8.3 and 9.1 billion by 2030and 2050 respectively, and around 4.9 billion people areexpected to settle down in urban areas in 2030 and 6.3billion in 2050. In 2010 alone, about 3.5 billion from 6.9billion or 71% of the world population live in urban areasin Asia (1.7 billion), Europe (0.5 billion), Latin America
http://dx.doi.org/10.1016/j.ijsbe.2015.02.006
2212-6090/� 2015 The Gulf Organisation for Research and Development. Pro
⇑ Corresponding author. Mobile: +91 9873122054.E-mail addresses: [email protected] (R.P. Poyil), anilgeology@
gmail.com (A.K. Misra).
Peer review under responsibility of The Gulf Organisation for Researchand Development.
and Caribbean (0.4 billion), Africa (0.4 billion), NorthernAmerica (0.3 billion) and Oceania (0.02 billion) (UnitedNation, 2007). Studies show that urbanization happensbecause people move into urban areas to seek economicopportunities and to improve their standard of living.People in rural area have to depend on changeable environ-mental conditions; and in times of drought, flood or pesti-lence, survival becomes extremely problematic. This is verydifferent in urban where all the facilities are well build tomake human life more comfortable and the main attractionof urban is easy access to wealth (Soh, 2012).
Urbanization has been an important social and eco-nomic phenomenon taking place at an unprecedented scaleand rate all over the world (Sun et al., 2013). Urban areas
duction and hosting by Elsevier B.V. All rights reserved.
R.P. Poyil, A.K. Misra / International Journal of Sustainable Built Environment 4 (2015) 136–144 137
are faced with distinctive, or ‘systemic’, issues arising fromtheir unique social, environmental and economic character-istics (Gill et al., 2008). Urban sprawl is defined as an inef-ficient urban development often linked to sparse buildingdensity over rural areas (Altieri et al., 2014). Informationabout unplanned settlements in developing cities is oftenunavailable, despite their extent, which at times can domi-nate residential land-use (Kuffer and Barrosb, 2011). It iscritically important to properly characterize urban expan-sion before developing a comprehensive understanding ofurbanization processes (Xinliang and Min, 2013). Theunplanned and uncontrolled rapid growth has resulted inserious negative effects on the urban dwellers and theirenvironment (Chadchan and Shankar, 2012). It is alsoassociated with health risks including air pollution, occupa-tional hazards and traffic injury, and risks caused by diet-ary and social changes (Li et al., 2012). The availabilityof satellite remote sensing data has increased significantlyin the last two decades, and this data constitute a usefuldata source for mapping the composition of urban settingsand analyzing changes over time (Patino and Duque,2013).
Remote Sensing (RS) techniques are extremely useful tomap and monitor urban sprawl in urbanizing regions forrecent years (Imhoff et al., 1997). Results obtained fromRS can be imported to Geographical Information Systems(GIS) and generate multi-temporal built-up layers, whichprovide precise urban agglomeration. In this study, theremote sensing technique has been used to analyze process-es and characteristics of urbanization in Malegaon district,and its correlation with the population increase, migrationand urbanization led problems. This paper also proposesa quantitative method of land use change studies, i.e. thesuccession among different land use types across time; toexamine the effects of urbanization and agglomeration onwater resources and overall land use and land cover.Urban agglomeration studies done at Atlanta metropolitanarea has demonstrated the usefulness of integrating remotesensing with GIS and landscape metrics in land change ana-lysis that allows the characterization of spatial patterns andhelps reveal the underlying processes of urban land changes(Liu and Yang, 2015). The population settlements in thefast-growing urban world need to be monitored in orderto design a sustainable urban habitat (Deep and Saklani,2014). CA-Markov model which effectively studies theurban dynamics in rapidly growing cities was used to mea-sure the urban sprawl in Dehradun city, India. The spatialpattern of land cover change in the area was analyzed usingLISS IV temporal images and future growth predicted usingCA-Markov model. The study concluded that RS and GIScan be effective decision support tools for policy makers todesign sustainable urban habitats.
1.1. Study area
Malegaon city, which has experienced rapid urbaniza-tion in the past three decades is selected as the study area
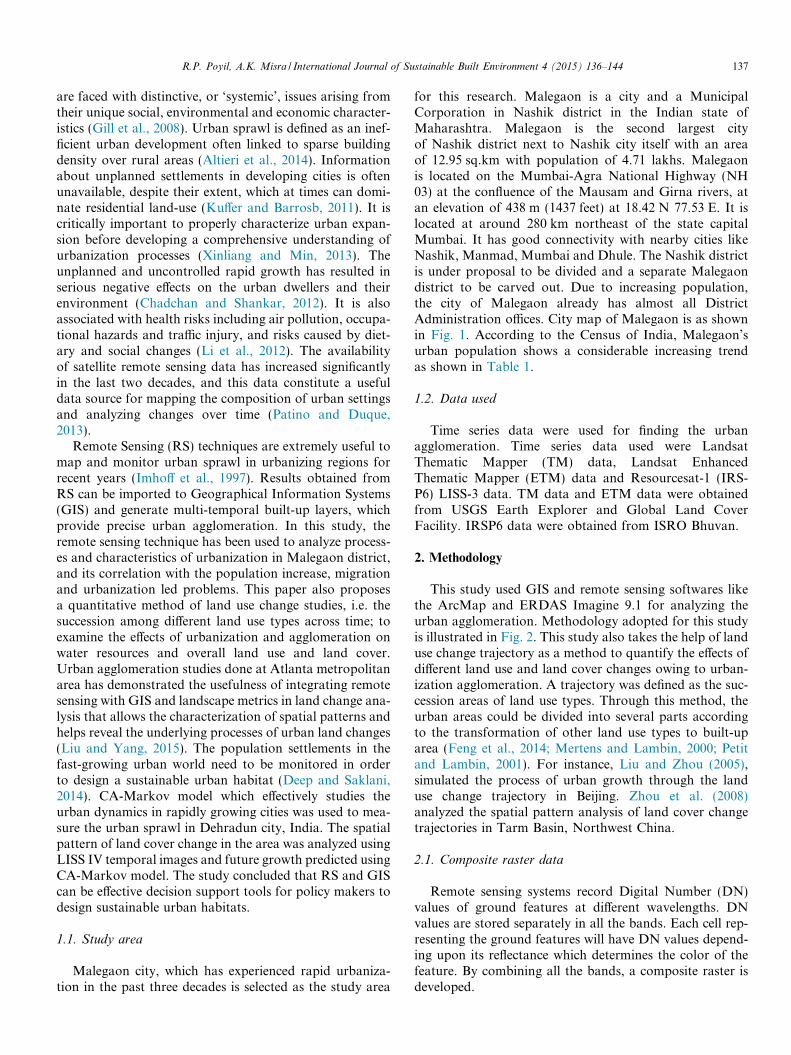
for this research. Malegaon is a city and a MunicipalCorporation in Nashik district in the Indian state ofMaharashtra. Malegaon is the second largest cityof Nashik district next to Nashik city itself with an areaof 12.95 sq.km with population of 4.71 lakhs. Malegaonis located on the Mumbai-Agra National Highway (NH03) at the confluence of the Mausam and Girna rivers, atan elevation of 438 m (1437 feet) at 18.42 N 77.53 E. It islocated at around 280 km northeast of the state capitalMumbai. It has good connectivity with nearby cities likeNashik, Manmad, Mumbai and Dhule. The Nashik districtis under proposal to be divided and a separate Malegaondistrict to be carved out. Due to increasing population,the city of Malegaon already has almost all DistrictAdministration offices. City map of Malegaon is as shownin Fig. 1. According to the Census of India, Malegaon’surban population shows a considerable increasing trendas shown in Table 1.
1.2. Data used
Time series data were used for finding the urbanagglomeration. Time series data used were LandsatThematic Mapper (TM) data, Landsat EnhancedThematic Mapper (ETM) data and Resourcesat-1 (IRS-P6) LISS-3 data. TM data and ETM data were obtainedfrom USGS Earth Explorer and Global Land CoverFacility. IRSP6 data were obtained from ISRO Bhuvan.
2. Methodology
This study used GIS and remote sensing softwares likethe ArcMap and ERDAS Imagine 9.1 for analyzing theurban agglomeration. Methodology adopted for this studyis illustrated in Fig. 2. This study also takes the help of landuse change trajectory as a method to quantify the effects ofdifferent land use and land cover changes owing to urban-ization agglomeration. A trajectory was defined as the suc-cession areas of land use types. Through this method, theurban areas could be divided into several parts accordingto the transformation of other land use types to built-uparea (Feng et al., 2014; Mertens and Lambin, 2000; Petitand Lambin, 2001). For instance, Liu and Zhou (2005),simulated the process of urban growth through the landuse change trajectory in Beijing. Zhou et al. (2008)analyzed the spatial pattern analysis of land cover changetrajectories in Tarm Basin, Northwest China.
2.1. Composite raster data
Remote sensing systems record Digital Number (DN)values of ground features at different wavelengths. DNvalues are stored separately in all the bands. Each cell rep-resenting the ground features will have DN values depend-ing upon its reflectance which determines the color of thefeature. By combining all the bands, a composite raster isdeveloped.
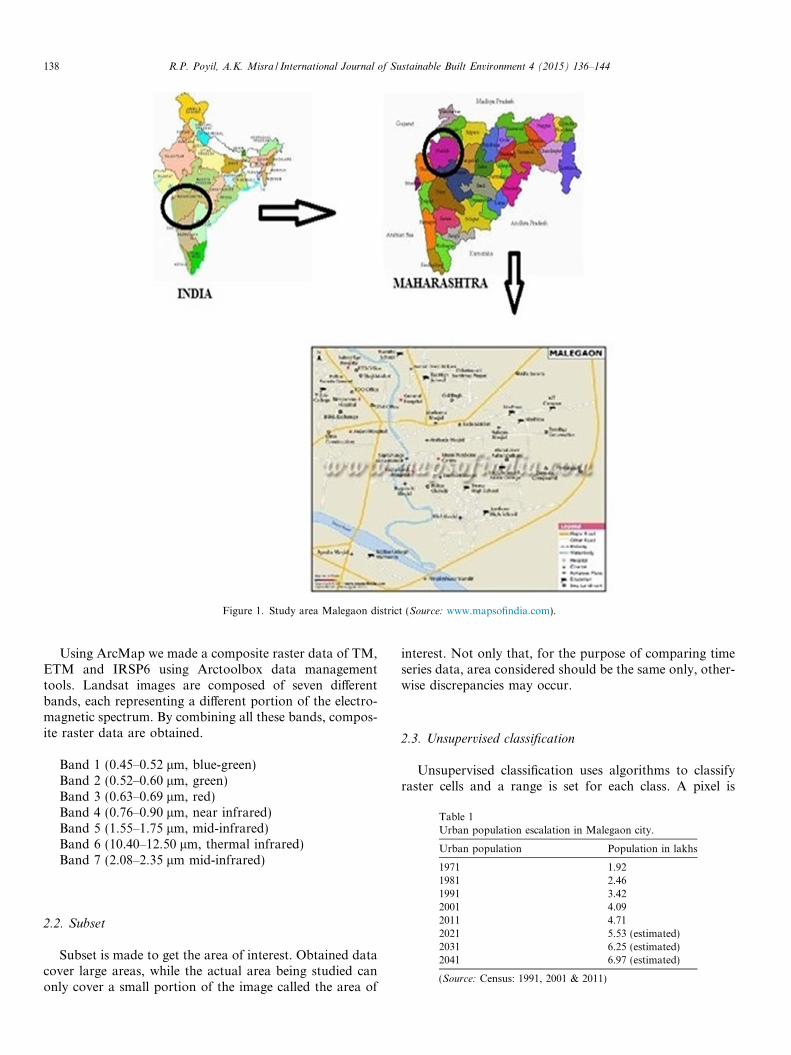
Figure 1. Study area Malegaon district (Source: www.mapsofindia.com).
Table 1Urban population escalation in Malegaon city.
Urban population Population in lakhs
1971 1.921981 2.46
138 R.P. Poyil, A.K. Misra / International Journal of Sustainable Built Environment 4 (2015) 136–144
Using ArcMap we made a composite raster data of TM,ETM and IRSP6 using Arctoolbox data managementtools. Landsat images are composed of seven differentbands, each representing a different portion of the electro-magnetic spectrum. By combining all these bands, compos-ite raster data are obtained.
Band 1 (0.45–0.52 lm, blue-green)Band 2 (0.52–0.60 lm, green)Band 3 (0.63–0.69 lm, red)Band 4 (0.76–0.90 lm, near infrared)Band 5 (1.55–1.75 lm, mid-infrared)Band 6 (10.40–12.50 lm, thermal infrared)Band 7 (2.08–2.35 lm mid-infrared)
1991 3.422001 4.092011 4.712021 5.53 (estimated)2031 6.25 (estimated)2041 6.97 (estimated)
(Source: Census: 1991, 2001 & 2011)
2.2. Subset
Subset is made to get the area of interest. Obtained datacover large areas, while the actual area being studied canonly cover a small portion of the image called the area of
interest. Not only that, for the purpose of comparing timeseries data, area considered should be the same only, other-wise discrepancies may occur.
2.3. Unsupervised classification
Unsupervised classification uses algorithms to classifyraster cells and a range is set for each class. A pixel is
Composite Raster Data
Subset
Unsupervised Classification
Figure 2. Illustrating methodology used for the study.
R.P. Poyil, A.K. Misra / International Journal of Sustainable Built Environment 4 (2015) 136–144 139
assigned to a particular class based on which class range itsDN value falls.
The unsupervised classification (ERDAS IMAGINE 13tutorial) methods are:
1. Simple One-Pass Clustering2. K Means3. Fuzzy C Means
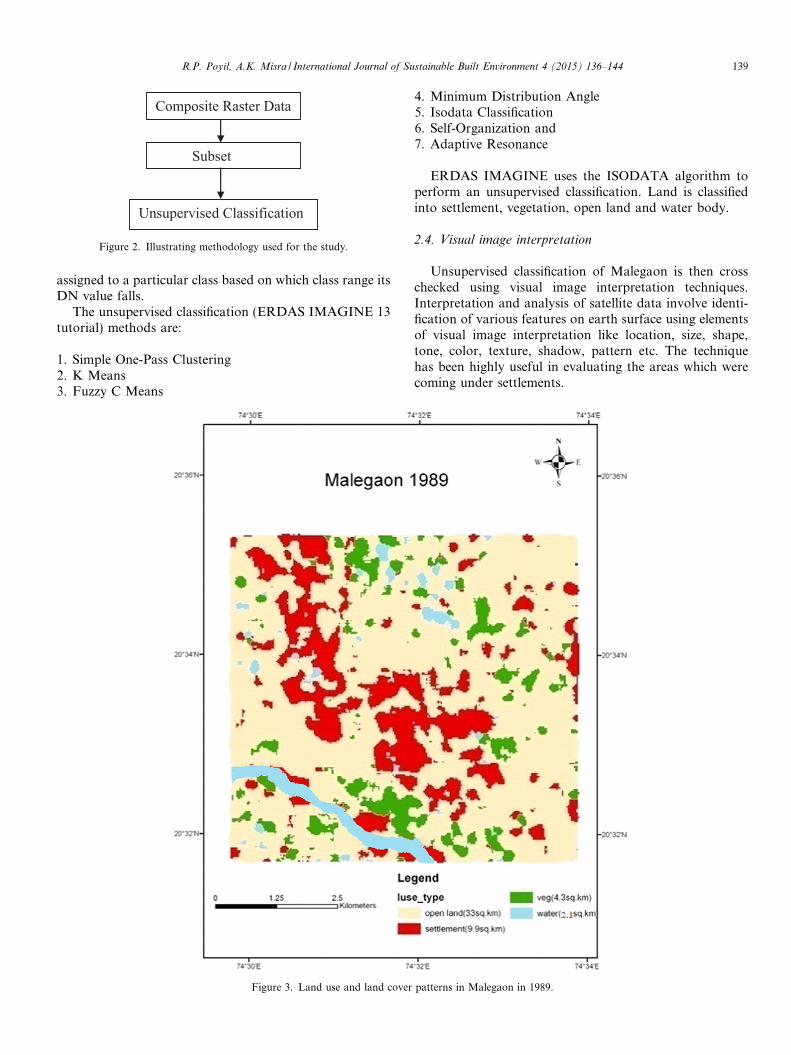
Figure 3. Land use and land cover
4. Minimum Distribution Angle5. Isodata Classification6. Self-Organization and7. Adaptive Resonance
ERDAS IMAGINE uses the ISODATA algorithm toperform an unsupervised classification. Land is classifiedinto settlement, vegetation, open land and water body.
2.4. Visual image interpretation
Unsupervised classification of Malegaon is then crosschecked using visual image interpretation techniques.Interpretation and analysis of satellite data involve identi-fication of various features on earth surface using elementsof visual image interpretation like location, size, shape,tone, color, texture, shadow, pattern etc. The techniquehas been highly useful in evaluating the areas which werecoming under settlements.
patterns in Malegaon in 1989.
140 R.P. Poyil, A.K. Misra / International Journal of Sustainable Built Environment 4 (2015) 136–144
3. Results and discussions
This work provides a methodological framework byintegrating RS, GIS, metric analysis and spatial analysisto facilitate the assessment of impacts from urbanizationon water resources and changing land use patterns.Remote sensing and GIS helped monitor urbanizationprocess and assess the status of urban agglomeration.The temporal changes facilitate the investigation and char-acterization of impacts on water resources and surroundingenvironment from settlement sprawl associated with accel-erating urbanization.
In this study, time series data used are LandsatThematic Mapper (TM) data (1989), Landsat EnhancedThematic Mapper (ETM) data (2006) and Resourcesat-1(IRS-P6) LISS-3 data (2008). Unsupervised classificationis done on satellite image series to analyze morphologicalgrowth. By comparing the area in square kilometer, the
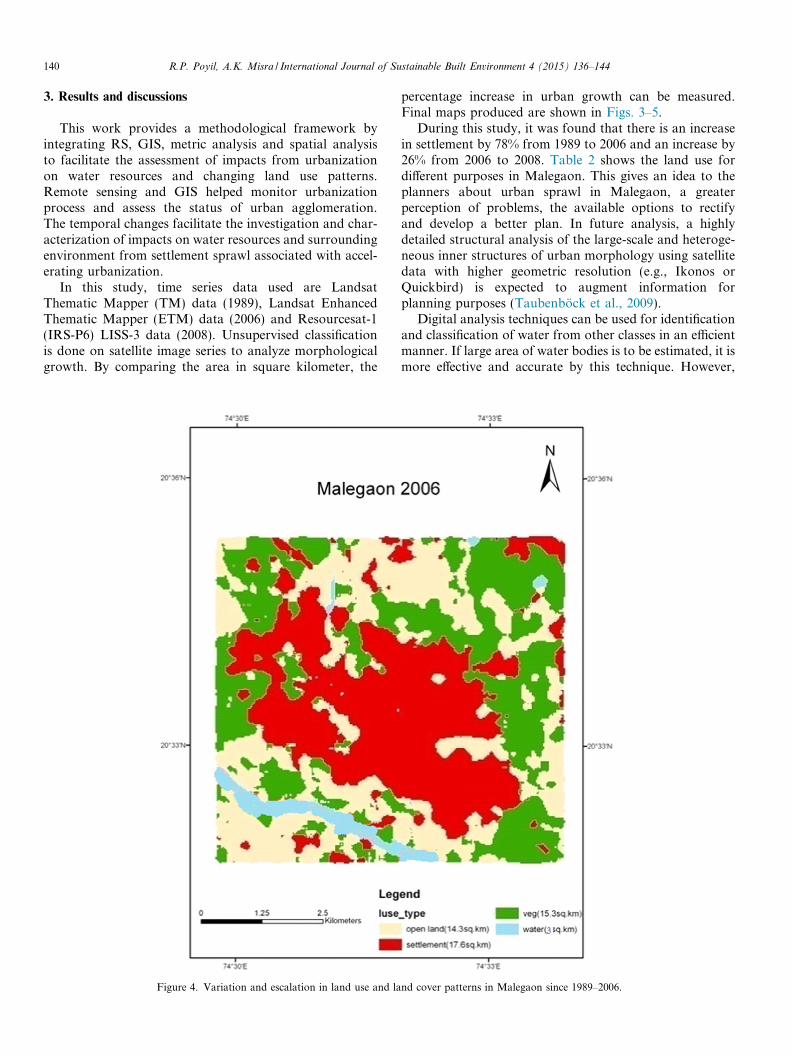
Figure 4. Variation and escalation in land use and la
percentage increase in urban growth can be measured.Final maps produced are shown in Figs. 3–5.
During this study, it was found that there is an increasein settlement by 78% from 1989 to 2006 and an increase by26% from 2006 to 2008. Table 2 shows the land use fordifferent purposes in Malegaon. This gives an idea to theplanners about urban sprawl in Malegaon, a greaterperception of problems, the available options to rectifyand develop a better plan. In future analysis, a highlydetailed structural analysis of the large-scale and heteroge-neous inner structures of urban morphology using satellitedata with higher geometric resolution (e.g., Ikonos orQuickbird) is expected to augment information forplanning purposes (Taubenbock et al., 2009).
Digital analysis techniques can be used for identificationand classification of water from other classes in an efficientmanner. If large area of water bodies is to be estimated, it ismore effective and accurate by this technique. However,
nd cover patterns in Malegaon since 1989–2006.
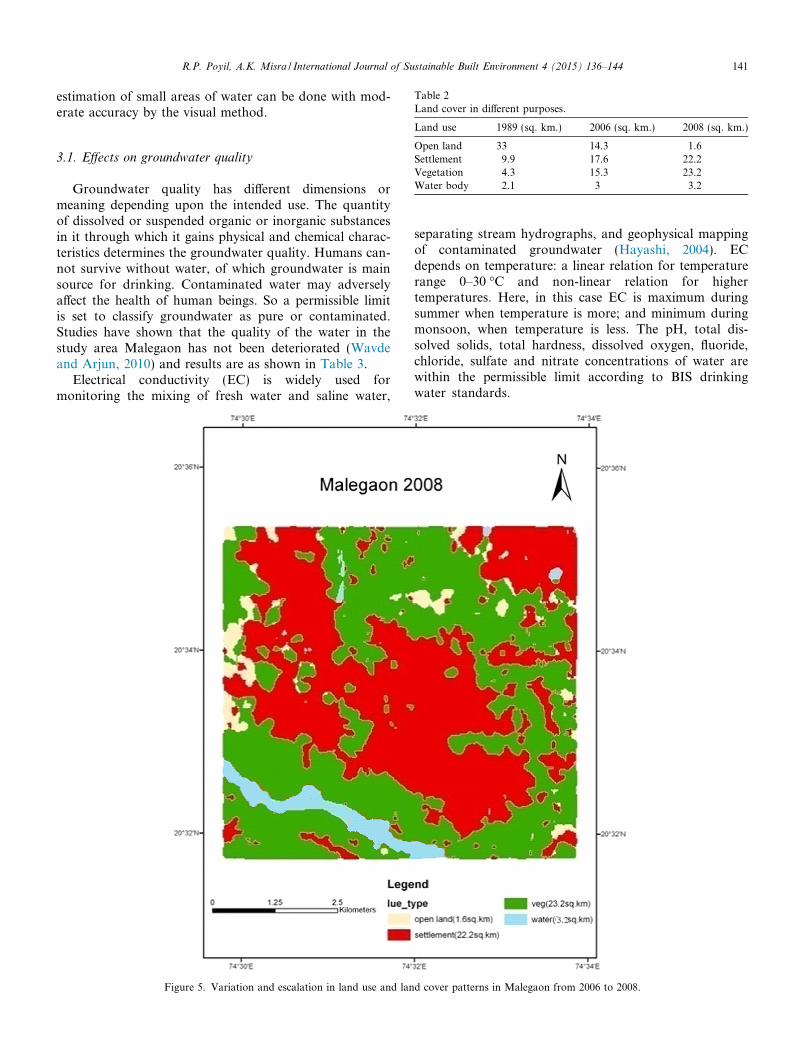
Table 2Land cover in different purposes.
R.P. Poyil, A.K. Misra / International Journal of Sustainable Built Environment 4 (2015) 136–144 141
estimation of small areas of water can be done with mod-erate accuracy by the visual method.
Land use 1989 (sq. km.) 2006 (sq. km.) 2008 (sq. km.)
Open land 33 14.3 1.6Settlement 9.9 17.6 22.2Vegetation 4.3 15.3 23.2Water body 2.1 3 3.2
3.1. Effects on groundwater quality
Groundwater quality has different dimensions ormeaning depending upon the intended use. The quantityof dissolved or suspended organic or inorganic substancesin it through which it gains physical and chemical charac-teristics determines the groundwater quality. Humans can-not survive without water, of which groundwater is mainsource for drinking. Contaminated water may adverselyaffect the health of human beings. So a permissible limitis set to classify groundwater as pure or contaminated.Studies have shown that the quality of the water in thestudy area Malegaon has not been deteriorated (Wavdeand Arjun, 2010) and results are as shown in Table 3.
Electrical conductivity (EC) is widely used formonitoring the mixing of fresh water and saline water,
Figure 5. Variation and escalation in land use and lan
separating stream hydrographs, and geophysical mappingof contaminated groundwater (Hayashi, 2004). ECdepends on temperature: a linear relation for temperaturerange 0–30 �C and non-linear relation for highertemperatures. Here, in this case EC is maximum duringsummer when temperature is more; and minimum duringmonsoon, when temperature is less. The pH, total dis-solved solids, total hardness, dissolved oxygen, fluoride,chloride, sulfate and nitrate concentrations of water arewithin the permissible limit according to BIS drinkingwater standards.
d cover patterns in Malegaon from 2006 to 2008.
Table 3Factors considered on groundwater quality (Wavde and Arjun, 2010).
Sl. No. Factors considered Results
1 Water temperature 18–29.9 �C2 Electrical
conductivity (EC)2.3–9.6 lmhos/cm
3 pH 6.4–8.14 Total dissolved
solids244–475 mg/L
5 Total hardness 197–483 mg/L6 Dissolved oxygen 2.12–4.92 mg/L7 Fluoride 0.36 mg/L8 Chloride 64–215 mg/L9 Sulfate Maximum in monsoon and
minimum in summer10 Nitrate 0.08–0.58 mg/l
142 R.P. Poyil, A.K. Misra / International Journal of Su
3.2. Effects on air quality
Industries are a part of urbanization. Industries inMalegaon include plastic industries, powerloom factoriesand sizing units. It provides employment to the peopleand as a result people migrate to urban areas. It has beenestimated that Malegaon is having a population of 60,000people per sq.km against the normal, which is 20,000. Theair is polluted with poisonous gases emitted from plasticindustries which consume huge quantity of plastic wastes.
3.3. Effects on Mausam river
Based on field investigations, following points arearrived:
� Plastic garbage, domestic and hospital wastes aredeposited on the banks of river.� Large scale reduction in the cross sectional area.� Reduction in flow velocity due to deposition in the mid-
dle of the channel.� Big industries are developed along the river channel.
Table 4Total slums in Malegaon municipal area.
Sl. No. Location of Slum Population
1 Government land 35872 Municipal land 39,2003 Private land 39,200
Total 81,987
Source: Malegaon Municipal Council, Shamnama Daily Malegaon & http://s
Table 5Population details.
Name District City of outgrowth Population Cens
Malegaon Nashik Malegaon 342,595
Source: Office of the Registrar General and Census Commissioner, DelimitatiSchool of Planning & Architecture (web).
3.4. Effects on housing
With the growth of industries new housing units whichcomprise mostly of huts come up every day in Malegaon,excluding the area beyond Mausam river on western side.Obviously, the new settlements belong to the poor labour-ers working in the industries. Quality of life in this area isvery poor. These poor workers are deprived of water sup-ply, road, power and drainage facilities. There is a seriousissue of water, air and sound pollution as a result of whichliving conditions in this area have become worse. Table 4depicts the fact sheet on slums in Malegaon.
Urbanization agglomeration is happening worldwide,but its ramifications are more pronounced in developingcountries like India. In India, high rate of populationgrowth, declining opportunities in rural areas and shiftfrom stagnant and low paying agriculture sector to morepaying urban areas, are contributing to urbanization andproportion of population living in urban areas hasincreased from 17.35% in 1951 to 31.2% in 2011(Census,2011a,b). Overall, the results of this study show thatMalegaon district is holding population size more thanits capacity to fulfill the demand of water, housing andhealthy environment. Table 5 shows the escalation inpopulation in Malegaon city in the last three decades.This study also provides policy makers with insightfulinformation on the link between urbanization and eco-nomic opportunities. Urbanization not only increasesmovements of passengers, but also contributes to increaseurban densities and more exploitation of natural resources.
4. Conclusions
This study examines systematically the influence ofurbanization on land-use and land cover patterns during1989–2008 in Malegaon district. This research also provesthat by studying quantitatively the effects of urbanizationon the land use change trajectory, precise data can be
stainable Built Environment 4 (2015) 136–144
Facilities Available
Latrines Water supply Gutters
42 14 –355 125 2076 sq.m.355 125 2076 sq.m.
752 264 4152 sq. m.
hodhganga.inflibnet.ac.in/bitstream/10603/8596/4/13%20chapter_7.pdf.
us 1991 Population Census 2001 Population Census 2011
409,403 471,312
on Commission of India (web), Rand McNally International Atlas 1994,
R.P. Poyil, A.K. Misra / International Journal of Sustainable Built Environment 4 (2015) 136–144 143
obtained relating with urban agglomeration. The presentstudy demonstrates the following conclusions.
� In Malegaon city both surface and groundwater qualityis deteriorating and in few areas different water qualityparameters like chloride, sulfate and nitrate concentra-tions are above the permissible limits.� The air quality is polluted with poisonous gases emitted
from plastic industries which consume huge quantity ofplastic wastes.� Plastic garbage, domestic and hospital wastes are
deposited on the banks of river that is hazardous to localand surrounding environmental conditions.� The results of this study show that Malegaon district is
holding population size more than its capacity to fulfillthe demand of water, housing and healthy environment.� Now it is essential for local government to play a pivotal
role in planning Malegaon city with the healthy urbanenvironment and sustenance of natural resources(vegetation, water bodies and open spaces). The resultsof the current analyses highlight the significant changesin land cover with the decline in vegetation, water bod-ies, crop and fallow land.
Based on the study, following recommendations areproposed to be undertaken as a part of reducing the impactof urbanization on Malegaon.
4.1. Water quality management plans
A scientific plan to improve water quality and its man-agement should be implemented by reducing the dischargeof pollutants into Mausam river. This can be achievedthrough following measures: (a) The understanding ofwater quality goals and environmental benefits, (b)Keeping track of water quality, (c) Forecasting futurebehavior through predictive modeling, (d) DecisionSupport Systems, (e) Urban design giving stress to watersensitive issues, (f) Agricultural management methods, (g)Mapping of acid sulfate soils.
4.2. Plastic waste management
Advantages of using plastic cannot be neglected but dis-advantages can be lessened by the following certain tips.
� Recycling of plastic: Plastic can be separated fromwastes and it can be recycled to minimize the impactof environmental pollution. Recycled plastic can be usedfor road construction, clothing, bottles, automobilespare parts etc. Purchasing recycled plastic assists inplastic waste management.� Burning in incinerator: Burning of plastic waste in incin-
erator removes large volumes of plastic waste, but thereare issues with air pollution due to incinerating whichcan be reduced by improving the technology.
� Policies prohibiting manufacturing/selling of certain plas-
tic: Framing of policies prescribing standard microns ofplastic used for manufacture and selling. Using thesepolicies, over reliance of plastic can be restrained tosome extent.� Using eco-friendly bags: Using paper and cloth stuffs as
bags can serve the purpose of eco- friendly bags. By thisway, dependence on plastic bags for shopping orpurchasing household items can be reduced.
4.3. Urban planning
The biggest challenge for Malegaon is its unplannedurban growth and land use patterns. Remote sensing andGeographic Information System (GIS) can be used todesign urban environment giving emphasis to sustainabledevelopment. Following points should be considered whileplanning: (a) Efficient land use, (b) Better accessibilityusing public transport, (c) Areas with natural vegetation,(d) Good housing and living environment, (e) Formationof water recharge structures, (f) Improving sewerage anddrainage network, (g) Afforestation of open and aban-doned areas.
4.4. Check rural to urban movement
Due to lack of employment opportunities, educationand health facilities, people are migrating from villages totowns and cities. So in order to prevent this rural to urbanmovement, Government should create opportunities inrural areas. If employment opportunities and moreeducational facilities are created within rural areas; massmigration can be checked.
Acknowledgment
I thank my parents, sister, teachers, friends and relativesfor supporting and encouraging me throughout my work. Ialso thank Dr. Payal Khurana for proofreading.
References
Altieri, Linda, Cocchi, Daniela, Giovanna Pezzi, E., Scott, Marian,Ventrucci, Massimo, 2014. Urban sprawl scatterplots for UrbanMorphological Zones data. Ecol. Indic. 36, 315–323.
Census 2011, Provisional Population Totals, India.Census 2011, Registrar general of India.Chadchan, J., Shankar, R., 2012. An analysis of urban growth trends in
the post-economic reforms period in India. Int. J. Sustainable BuiltEnviron. 1, 36–49.
Deep, Shikhar, Saklani, Akansha, 2014. Urban sprawl modeling usingcellular automata. Egypt. J. Remote Sens. Space. Sci. 17 (2), 179–187.
Feng, Huihui, Zhao, Xiaofeng, Chen, Feng, Lichun, Wu, 2014. Using landuse change trajectories to quantify the effects of urbanization on urbanheat island. Adv. Space Res. 53, 463–473.
Gill, Susannah E., Handley, John F., Roland Ennos, A., Pauleit, Stephan,Theuray, Nicolas, Lindley, Sarah J., 2008. Characterizing the urban
144 R.P. Poyil, A.K. Misra / International Journal of Sustainable Built Environment 4 (2015) 136–144
environment of UK cities and towns: a template for landscapeplanning. Landscape Urban Plann. 87 (3), 210–222.
Hayashi, M., 2004. Temperature-electrical conductivity relation of waterfor environmental monitoring and geophysical data inversion.Environ. Monit. Assess. 96 (1–3), 119–128.
Imhoff, M.L., Lawrence, W.T., Elvidge, C.D., Paul, T., Levine, E.,Prevalsky, M., Brown, V., 1997. Using night time DMSP/OLS imagesof city lights to estimate the impact of urban land use on soil resourcesin the U.S. Remote Sens. Environ. 59, 105–117.
Kuffer, Monika, Barrosb, Joana, 2011. Urban morphology of unplannedsettlements: the use of spatial metrics in VHR remotely sensed images.Procedia Environ. Sci. 7, 152–157.
Li, Xin-Hu, Liu, Ji-Lai, Gibson, Valerie, Zhu, Yong-Guan, 2012. Urbansustainability and human health in China, East Asia and SoutheastAsia. Environ. Sustainability 4, 436–442.
Liu, Ting, Yang, Xiaojun, 2015. Monitoring land changes in an urbanarea using satellite imagery, GIS and landscape metrics. Appl. Geogr.56, 42–54.
Liu, H., Zhou, Q., 2005. Developing urban growth predictions fromspatial indicators based on multi-temporal images. Comput. Environ.Urban Syst. 29, 580–594.
Mertens, B., Lambin, E.F., 2000. Land-cover-change trajectories inSouthern Cameroon. Ann. Assoc. Am. Geogr. 90 (3), 467–494.
Patino, Jorge E., Duque, Juan C., 2013. A review of regional scienceapplications of satellite remote sensing in urban settings. Comput.Environ. Urban Syst. 37, 1–17.
Petit, C.C., Lambin, E.F., 2001. Integration of multi-source remotesensing data for land cover change detection. Int. J. Geog. Inf. Sci. 15(8), 785–803.
Soh, Mazlan Bin Che, 2012. Crime and urbanization: revisited Malaysiancase. Procedia Social Behav. Sci. 42, 291–299.
Sun, Cheng, Zhi-feng, Wu, Lv, Zhi-qiang, Yao, Na, Wei, Jian-bing, 2013.Quantifying different types of urban growth and the change dynamic inGuangzhou using multi-temporal remote sensing data. Int. J. Appl.Earth Obs. Geoinf. 21, 409–417.
Taubenbock, H., Wegmann, M., Roth, A., Mehl, H., Dech, S., 2009.Urbanization in India – Spatiotemporal analysis using remote sensingdata. Comput. Environ. Urban Syst. 33, 179–188.
Wavde, P.N., Arjun, B., 2010. Groundwater quality assessment atMalegaon region of Nanded in Maharashtra (India). J. Environ. Sci.Eng. 52 (1), 57–60.
Xinliang, Xu, Min, Xibi, 2013. Quantifying spatiotemporal patterns ofurban expansion in China using remote sensing data. Cities 35, 104–113.
Zhou, Q., Li, B., Kurban, A., 2008. Spatial pattern analysis of land coverchange trajectories in Tarm Basin, northwest China. Int. J. RemoteSens. 29 (19), 5495–5509.