Embed Size (px)
Citation preview
Urban and suburban transport in Mexico City:
Lessons learned implementing BRTs lines and suburban
railways for the first time.
Prepared for the Roundtable on
Integrated Transport Development Experiences Of Global City Clusters (originally prepared as Paper 2 in the NYU Marron Institute of Urban Management
Working Paper series)
(2-3 July 2015, Beijing China)
Sebastián VARELA
Cities and Transport Associate at WRI Ross Center for Sustainable Cities. World Resources Institute
June 2015
THE INTERNATIONAL TRANSPORT FORUM
The International Transport Forum at the OECD is an intergovernmental organisation with 57 member
countries. It acts as a strategic think-tank, with the objective of helping shape the transport policy agenda
on a global level and ensuring that it contributes to economic growth, environmental protection, social
inclusion and the preservation of human life and well-being. The International Transport Forum organises
an Annual Summit of ministers along with leading representatives from industry, civil society and
academia.
The International Transport Forum was created under a Declaration issued by the Council of Ministers of
the ECMT (European Conference of Ministers of Transport) at its Ministerial Session in May 2006 under
the legal authority of the Protocol of the ECMT, signed in Brussels on 17 October 1953, and legal
instruments of the OECD.
The Members of the Forum are: Albania, Armenia, Argentina, Australia, Austria, Azerbaijan, Belarus,
Belgium, Bosnia and Herzegovina, Bulgaria, Canada, Chile, China (People’s Republic of), Croatia, Czech
Republic, Denmark, Estonia, Finland, France, Former Yugoslav Republic of Macedonia, Georgia,
Germany, Greece, Hungary, Iceland, India, Ireland, Israel, Italy, Japan, Korea, Latvia, Liechtenstein,
Lithuania, Luxembourg, Malta, Mexico, Republic of Moldova, Montenegro, Morocco, the Netherlands,
New Zealand, Norway, Poland, Portugal, Romania, Russian Federation, Serbia, Slovak Republic, Slovenia,
Spain, Sweden, Switzerland, Turkey, Ukraine, United Kingdom and United States.
The International Transport Forum’s Research Centre gathers statistics and conducts co-operative research
programmes addressing all modes of transport. Its findings are widely disseminated and support policy
making in member countries as well as contributing to the Annual Summit.
Discussion Papers
The International Transport Forum’s Discussion Paper Series makes economic research, commissioned or
carried out at its Research Centre, available to researchers and practitioners. The aim is to contribute to the
understanding of the transport sector and to provide inputs to transport policy design.
ITF Discussion Papers should not be reported as representing the official views of the ITF or of its member
countries. The opinions expressed and arguments employed are those of the authors.
Discussion Papers describe preliminary results or research in progress by the author(s) and are published to
stimulate discussion on a broad range of issues on which the ITF works. Comments on Discussion Papers
are welcomed, and may be sent to: International Transport Forum/OECD, 2 rue André-Pascal, 75775 Paris
Cedex 16, France.
For further information on the Discussion Papers and other JTRC activities, please email:
The Discussion Papers can be downloaded from:
www.internationaltransportforum.org/jtrc/DiscussionPapers/jtrcpapers.html
The International Transport Forum’s website is at: www.internationaltransportforum.org
This document and any map included herein are without prejudice to the status of or sovereignty over any territory, to the
delimitation of international frontiers and boundaries and to the name of any territory, city or area.
3
EXECUTIVE SUMMARY
This document aims to identify lessons drawn from the implementation of Bus Rapid Transit (BRT) and Suburban railways to improve connectivity and access in Mexico City. The study covers four main sections: Section one describes the international and national context focusing on main trends around urbanization and the role urban transportation plays in promoting economic competitiveness and social equity. Section two provides a synopsis of Mexico City emphasizing on mobility and governance around public transportation. Section three analyses lessons learned implementing the first BRT line for the city focusing on barriers and success factors related to governance, financing, infrastructure and the provision of transportation service. Section four introduces Mexico´s national transport policy inspired by Mexico City´s first BRT line and international good practices. It also discusses constrains and opportunities after seven years of operations. Finally, section five describes key facts and lesson learned implementing the first suburban railway line linking State of Mexico and Federal District. The section also analyses the implementation of the railway line based on a proposed framework for government managers specially adapted for this case.
1. INTERNATIONAL AND NATIONAL CONTEXT
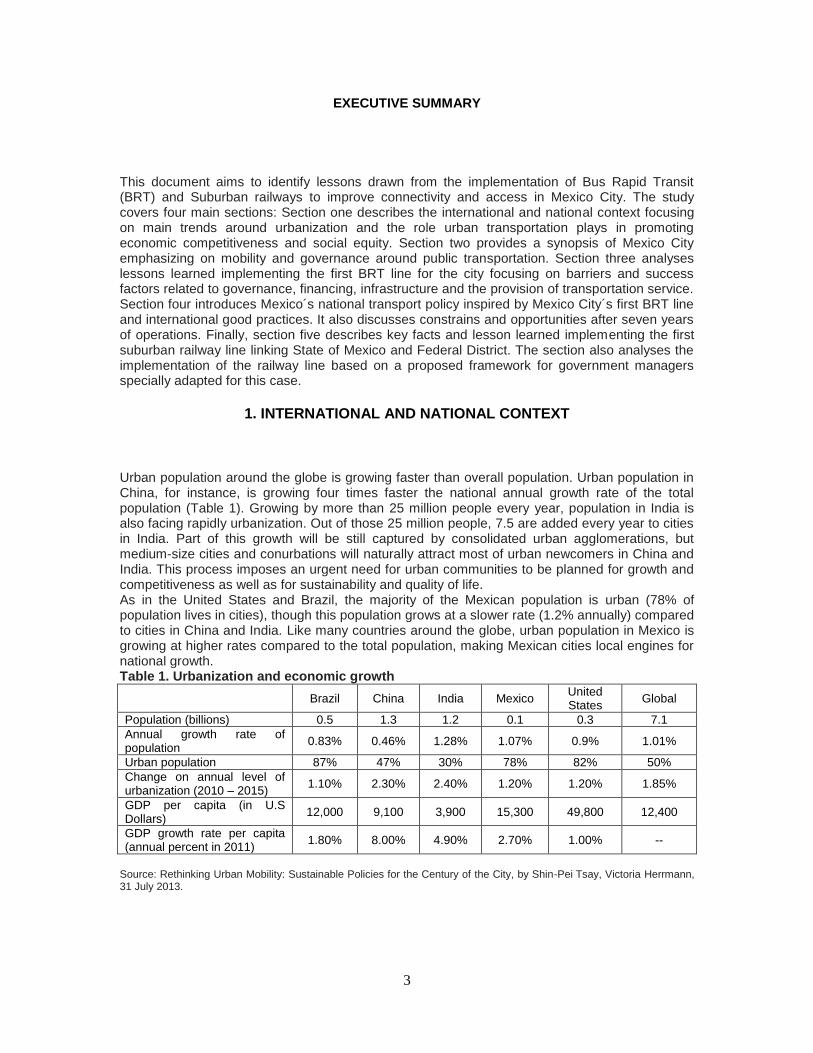
Urban population around the globe is growing faster than overall population. Urban population in China, for instance, is growing four times faster the national annual growth rate of the total population (Table 1). Growing by more than 25 million people every year, population in India is also facing rapidly urbanization. Out of those 25 million people, 7.5 are added every year to cities in India. Part of this growth will be still captured by consolidated urban agglomerations, but medium-size cities and conurbations will naturally attract most of urban newcomers in China and India. This process imposes an urgent need for urban communities to be planned for growth and competitiveness as well as for sustainability and quality of life. As in the United States and Brazil, the majority of the Mexican population is urban (78% of population lives in cities), though this population grows at a slower rate (1.2% annually) compared to cities in China and India. Like many countries around the globe, urban population in Mexico is growing at higher rates compared to the total population, making Mexican cities local engines for national growth. Table 1. Urbanization and economic growth
Brazil China India Mexico United States
Global
Population (billions) 0.5 1.3 1.2 0.1 0.3 7.1
Annual growth rate of population
0.83% 0.46% 1.28% 1.07% 0.9% 1.01%
Urban population 87% 47% 30% 78% 82% 50%
Change on annual level of urbanization (2010 – 2015)
1.10% 2.30% 2.40% 1.20% 1.20% 1.85%
GDP per capita (in U.S Dollars)
12,000 9,100 3,900 15,300 49,800 12,400
GDP growth rate per capita (annual percent in 2011)
1.80% 8.00% 4.90% 2.70% 1.00% --
Source: Rethinking Urban Mobility: Sustainable Policies for the Century of the City, by Shin-Pei Tsay, Victoria Herrmann, 31 July 2013.
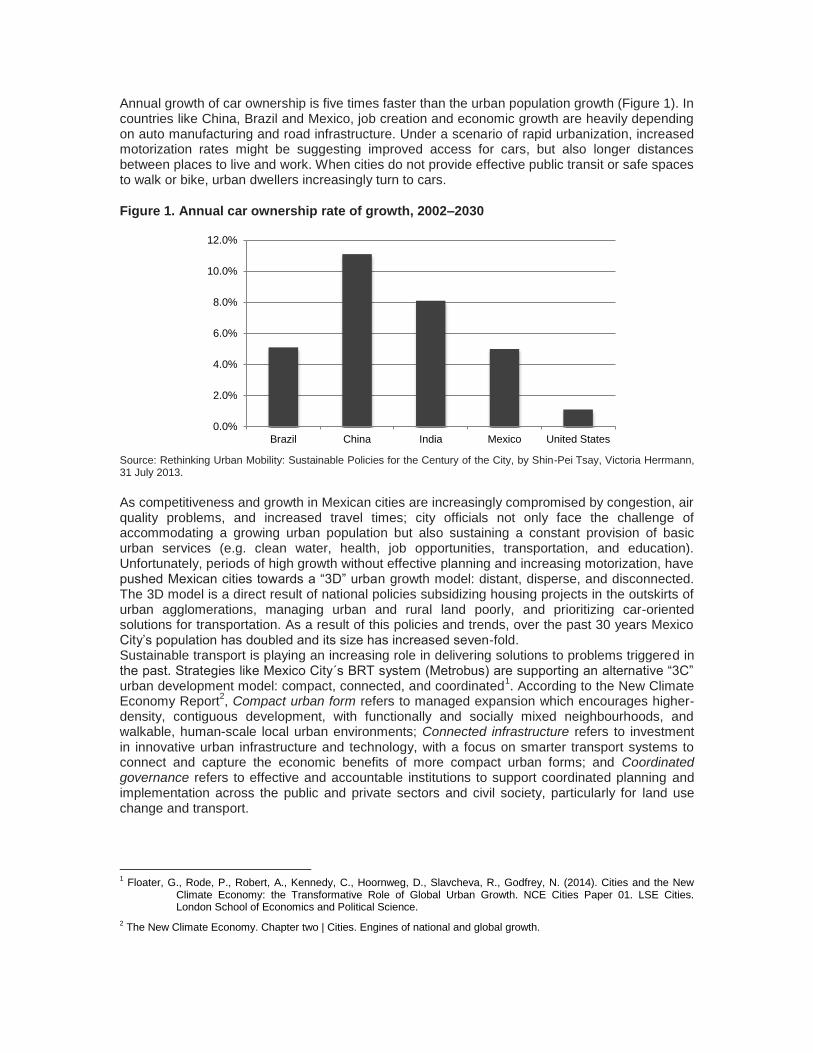
Annual growth of car ownership is five times faster than the urban population growth (Figure 1). In countries like China, Brazil and Mexico, job creation and economic growth are heavily depending on auto manufacturing and road infrastructure. Under a scenario of rapid urbanization, increased motorization rates might be suggesting improved access for cars, but also longer distances between places to live and work. When cities do not provide effective public transit or safe spaces to walk or bike, urban dwellers increasingly turn to cars.
Figure 1. Annual car ownership rate of growth, 2002–2030
Source: Rethinking Urban Mobility: Sustainable Policies for the Century of the City, by Shin-Pei Tsay, Victoria Herrmann, 31 July 2013.
As competitiveness and growth in Mexican cities are increasingly compromised by congestion, air quality problems, and increased travel times; city officials not only face the challenge of accommodating a growing urban population but also sustaining a constant provision of basic urban services (e.g. clean water, health, job opportunities, transportation, and education). Unfortunately, periods of high growth without effective planning and increasing motorization, have pushed Mexican cities towards a “3D” urban growth model: distant, disperse, and disconnected. The 3D model is a direct result of national policies subsidizing housing projects in the outskirts of urban agglomerations, managing urban and rural land poorly, and prioritizing car-oriented solutions for transportation. As a result of this policies and trends, over the past 30 years Mexico City’s population has doubled and its size has increased seven-fold. Sustainable transport is playing an increasing role in delivering solutions to problems triggered in the past. Strategies like Mexico City´s BRT system (Metrobus) are supporting an alternative “3C” urban development model: compact, connected, and coordinated
1. According to the New Climate
Economy Report2, Compact urban form refers to managed expansion which encourages higher-
density, contiguous development, with functionally and socially mixed neighbourhoods, and walkable, human-scale local urban environments; Connected infrastructure refers to investment in innovative urban infrastructure and technology, with a focus on smarter transport systems to connect and capture the economic benefits of more compact urban forms; and Coordinated governance refers to effective and accountable institutions to support coordinated planning and implementation across the public and private sectors and civil society, particularly for land use change and transport.
1 Floater, G., Rode, P., Robert, A., Kennedy, C., Hoornweg, D., Slavcheva, R., Godfrey, N. (2014). Cities and the New
Climate Economy: the Transformative Role of Global Urban Growth. NCE Cities Paper 01. LSE Cities. London School of Economics and Political Science.
2 The New Climate Economy. Chapter two | Cities. Engines of national and global growth.
0.0%
2.0%
4.0%
6.0%
8.0%
10.0%
12.0%
Brazil China India Mexico United States
5
This document provides an overview of the public transport sector in Mexico by focusing in strategic projects implemented in Mexico City. Special attention is paid to Mexico City´s first suburban railway line. “Line 1” is the first, mass transport system connecting the Metropolitan area of Mexico City.
2. MEXICO CITY
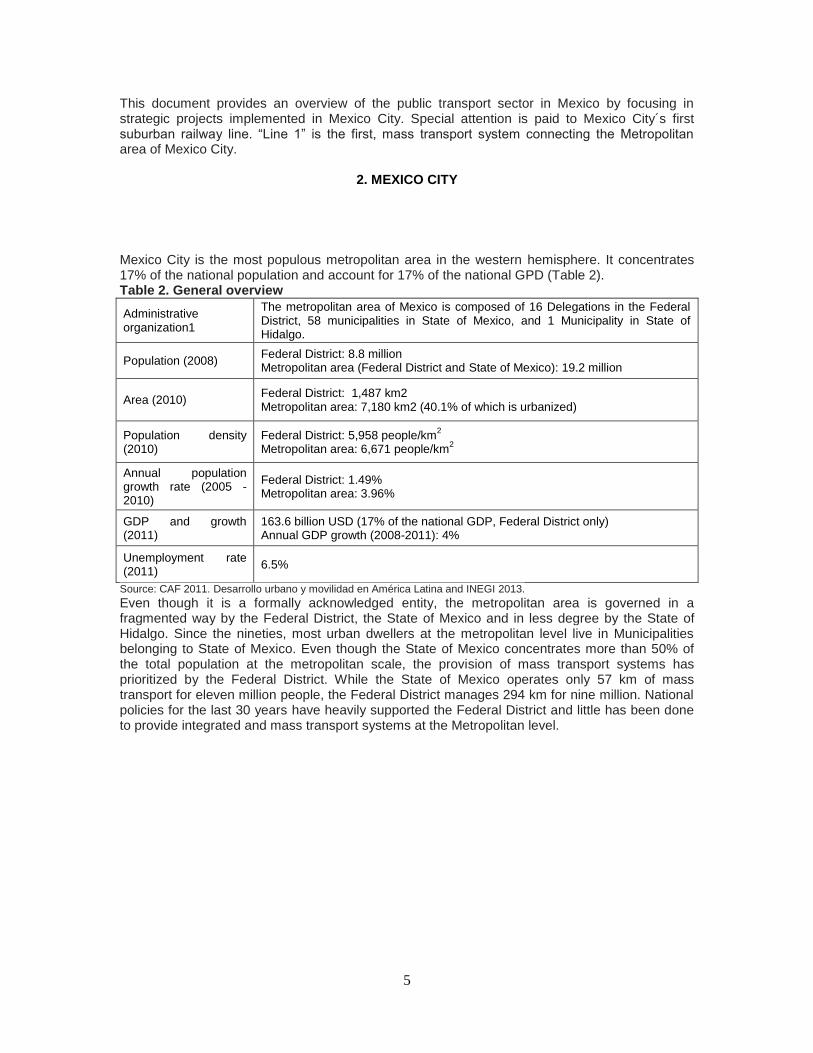
Mexico City is the most populous metropolitan area in the western hemisphere. It concentrates 17% of the national population and account for 17% of the national GPD (Table 2). Table 2. General overview
Administrative organization1
The metropolitan area of Mexico is composed of 16 Delegations in the Federal District, 58 municipalities in State of Mexico, and 1 Municipality in State of Hidalgo.
Population (2008) Federal District: 8.8 million Metropolitan area (Federal District and State of Mexico): 19.2 million
Area (2010) Federal District: 1,487 km2 Metropolitan area: 7,180 km2 (40.1% of which is urbanized)
Population density (2010)
Federal District: 5,958 people/km2
Metropolitan area: 6,671 people/km2
Annual population growth rate (2005 - 2010)
Federal District: 1.49% Metropolitan area: 3.96%
GDP and growth (2011)
163.6 billion USD (17% of the national GDP, Federal District only) Annual GDP growth (2008-2011): 4%
Unemployment rate (2011)
6.5%
Source: CAF 2011. Desarrollo urbano y movilidad en América Latina and INEGI 2013.
Even though it is a formally acknowledged entity, the metropolitan area is governed in a fragmented way by the Federal District, the State of Mexico and in less degree by the State of Hidalgo. Since the nineties, most urban dwellers at the metropolitan level live in Municipalities belonging to State of Mexico. Even though the State of Mexico concentrates more than 50% of the total population at the metropolitan scale, the provision of mass transport systems has prioritized by the Federal District. While the State of Mexico operates only 57 km of mass transport for eleven million people, the Federal District manages 294 km for nine million. National policies for the last 30 years have heavily supported the Federal District and little has been done to provide integrated and mass transport systems at the Metropolitan level.
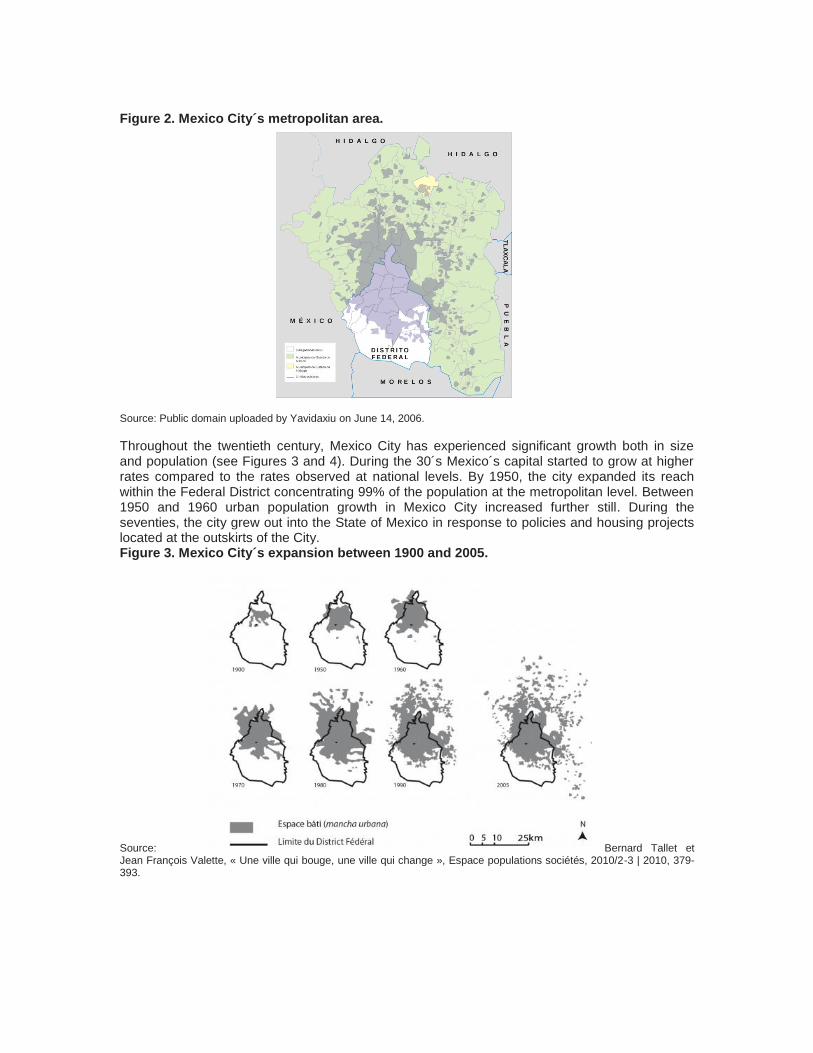
Figure 2. Mexico City´s metropolitan area. Source: Public domain uploaded by Yavidaxiu on June 14, 2006.
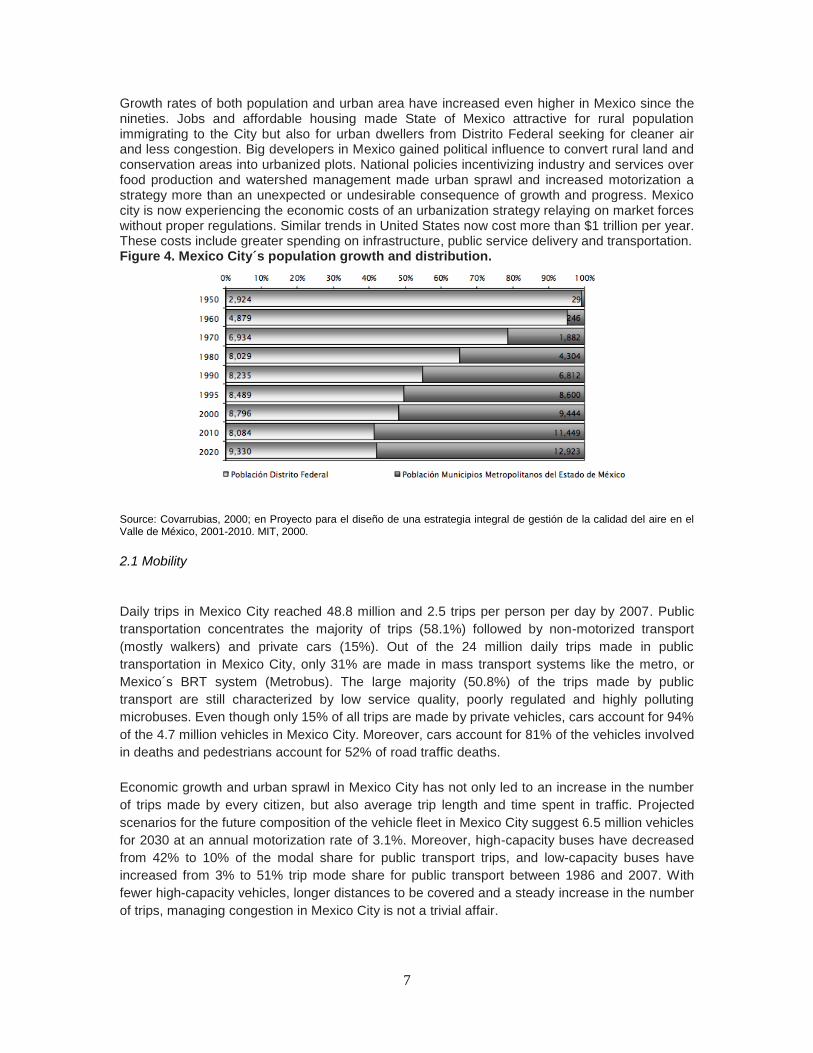
Throughout the twentieth century, Mexico City has experienced significant growth both in size and population (see Figures 3 and 4). During the 30´s Mexico´s capital started to grow at higher rates compared to the rates observed at national levels. By 1950, the city expanded its reach within the Federal District concentrating 99% of the population at the metropolitan level. Between 1950 and 1960 urban population growth in Mexico City increased further still. During the seventies, the city grew out into the State of Mexico in response to policies and housing projects located at the outskirts of the City. Figure 3. Mexico City´s expansion between 1900 and 2005.
Source: Bernard Tallet et Jean François Valette, « Une ville qui bouge, une ville qui change », Espace populations sociétés, 2010/2-3 | 2010, 379-393.
7
Growth rates of both population and urban area have increased even higher in Mexico since the nineties. Jobs and affordable housing made State of Mexico attractive for rural population immigrating to the City but also for urban dwellers from Distrito Federal seeking for cleaner air and less congestion. Big developers in Mexico gained political influence to convert rural land and conservation areas into urbanized plots. National policies incentivizing industry and services over food production and watershed management made urban sprawl and increased motorization a strategy more than an unexpected or undesirable consequence of growth and progress. Mexico city is now experiencing the economic costs of an urbanization strategy relaying on market forces without proper regulations. Similar trends in United States now cost more than $1 trillion per year. These costs include greater spending on infrastructure, public service delivery and transportation. Figure 4. Mexico City´s population growth and distribution.
Source: Covarrubias, 2000; en Proyecto para el diseño de una estrategia integral de gestión de la calidad del aire en el Valle de México, 2001-2010. MIT, 2000.
2.1 Mobility
Daily trips in Mexico City reached 48.8 million and 2.5 trips per person per day by 2007. Public
transportation concentrates the majority of trips (58.1%) followed by non-motorized transport
(mostly walkers) and private cars (15%). Out of the 24 million daily trips made in public
transportation in Mexico City, only 31% are made in mass transport systems like the metro, or
Mexico´s BRT system (Metrobus). The large majority (50.8%) of the trips made by public
transport are still characterized by low service quality, poorly regulated and highly polluting
microbuses. Even though only 15% of all trips are made by private vehicles, cars account for 94%
of the 4.7 million vehicles in Mexico City. Moreover, cars account for 81% of the vehicles involved
in deaths and pedestrians account for 52% of road traffic deaths.
Economic growth and urban sprawl in Mexico City has not only led to an increase in the number
of trips made by every citizen, but also average trip length and time spent in traffic. Projected
scenarios for the future composition of the vehicle fleet in Mexico City suggest 6.5 million vehicles
for 2030 at an annual motorization rate of 3.1%. Moreover, high-capacity buses have decreased
from 42% to 10% of the modal share for public transport trips, and low-capacity buses have
increased from 3% to 51% trip mode share for public transport between 1986 and 2007. With
fewer high-capacity vehicles, longer distances to be covered and a steady increase in the number
of trips, managing congestion in Mexico City is not a trivial affair.
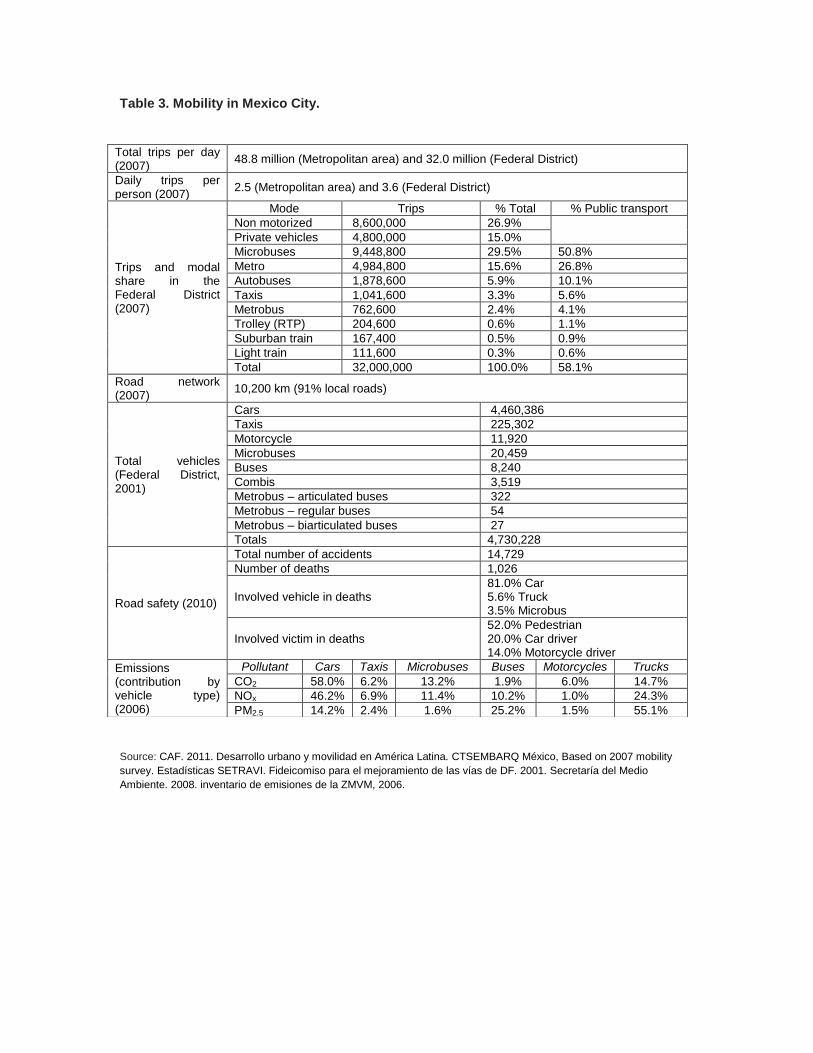
Table 3. Mobility in Mexico City.
Source: CAF. 2011. Desarrollo urbano y movilidad en América Latina. CTSEMBARQ México, Based on 2007 mobility
survey. Estadísticas SETRAVI. Fideicomiso para el mejoramiento de las vías de DF. 2001. Secretaría del Medio
Ambiente. 2008. inventario de emisiones de la ZMVM, 2006.
Total trips per day (2007)
48.8 million (Metropolitan area) and 32.0 million (Federal District)
Daily trips per person (2007)
2.5 (Metropolitan area) and 3.6 (Federal District)
Trips and modal share in the Federal District (2007)
Mode Trips % Total % Public transport
Non motorized 8,600,000 26.9%
Private vehicles 4,800,000 15.0%
Microbuses 9,448,800 29.5% 50.8%
Metro 4,984,800 15.6% 26.8%
Autobuses 1,878,600 5.9% 10.1%
Taxis 1,041,600 3.3% 5.6%
Metrobus 762,600 2.4% 4.1%
Trolley (RTP) 204,600 0.6% 1.1%
Suburban train 167,400 0.5% 0.9%
Light train 111,600 0.3% 0.6%
Total 32,000,000 100.0% 58.1%
Road network (2007)
10,200 km (91% local roads)
Total vehicles (Federal District, 2001)
Cars 4,460,386
Taxis 225,302
Motorcycle 11,920
Microbuses 20,459
Buses 8,240
Combis 3,519
Metrobus – articulated buses 322
Metrobus – regular buses 54
Metrobus – biarticulated buses 27
Totals 4,730,228
Road safety (2010)
Total number of accidents 14,729
Number of deaths 1,026
Involved vehicle in deaths 81.0% Car 5.6% Truck 3.5% Microbus
Involved victim in deaths 52.0% Pedestrian 20.0% Car driver 14.0% Motorcycle driver
Emissions (contribution by vehicle type) (2006)
Pollutant Cars Taxis Microbuses Buses Motorcycles Trucks
CO2 58.0% 6.2% 13.2% 1.9% 6.0% 14.7%
NOx 46.2% 6.9% 11.4% 10.2% 1.0% 24.3%
PM2.5 14.2% 2.4% 1.6% 25.2% 1.5% 55.1%
9
2.2. Governance around public transportation
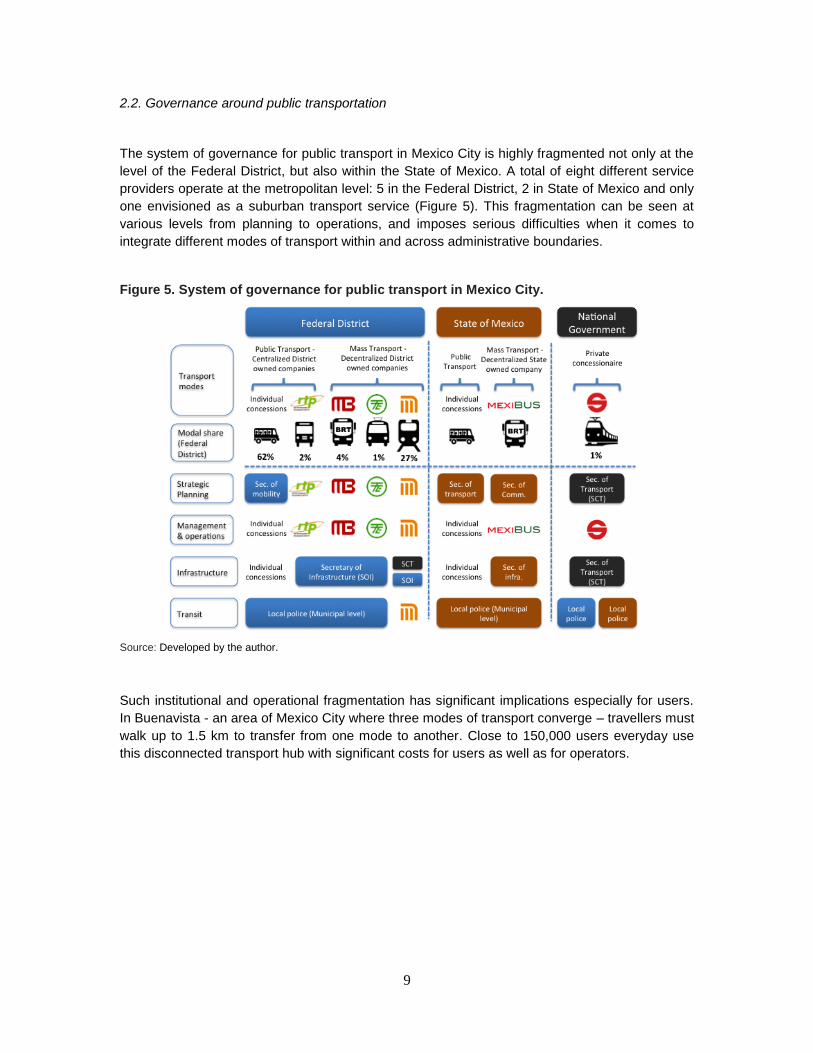
The system of governance for public transport in Mexico City is highly fragmented not only at the
level of the Federal District, but also within the State of Mexico. A total of eight different service
providers operate at the metropolitan level: 5 in the Federal District, 2 in State of Mexico and only
one envisioned as a suburban transport service (Figure 5). This fragmentation can be seen at
various levels from planning to operations, and imposes serious difficulties when it comes to
integrate different modes of transport within and across administrative boundaries.
Figure 5. System of governance for public transport in Mexico City.
Source: Developed by the author.
Such institutional and operational fragmentation has significant implications especially for users.
In Buenavista - an area of Mexico City where three modes of transport converge – travellers must
walk up to 1.5 km to transfer from one mode to another. Close to 150,000 users everyday use
this disconnected transport hub with significant costs for users as well as for operators.
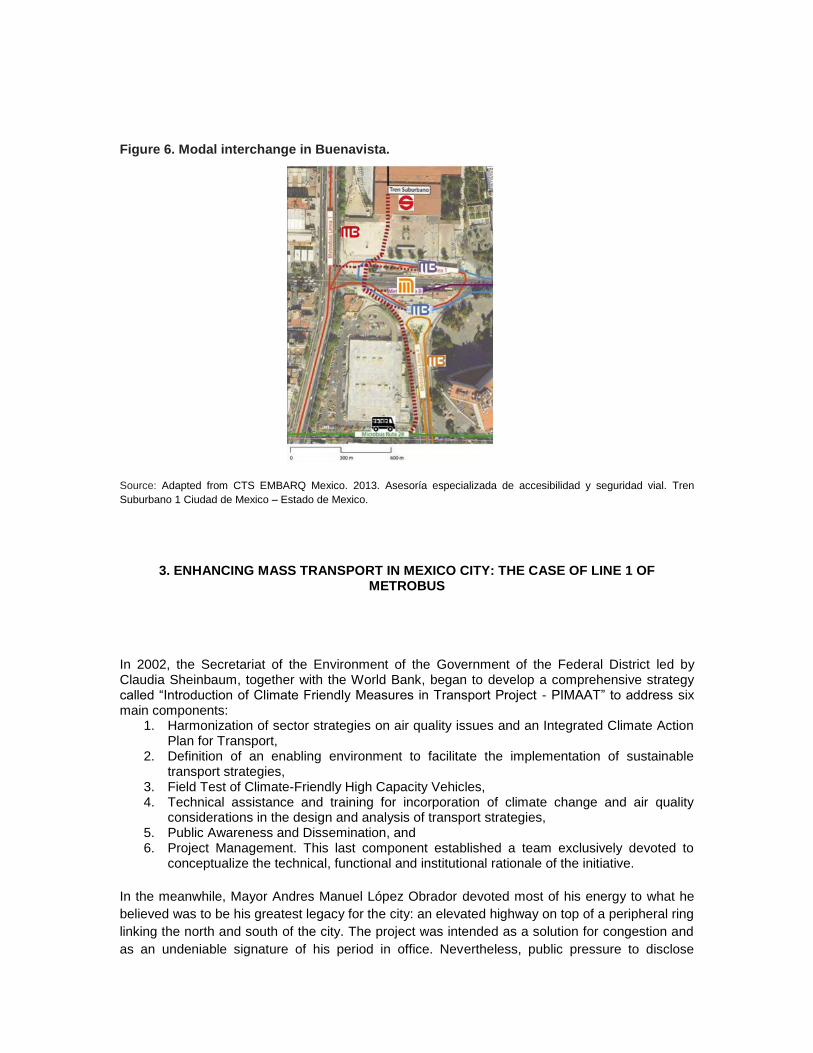
Figure 6. Modal interchange in Buenavista.
Source: Adapted from CTS EMBARQ Mexico. 2013. Asesoría especializada de accesibilidad y seguridad vial. Tren
Suburbano 1 Ciudad de Mexico – Estado de Mexico.
3. ENHANCING MASS TRANSPORT IN MEXICO CITY: THE CASE OF LINE 1 OF METROBUS
In 2002, the Secretariat of the Environment of the Government of the Federal District led by Claudia Sheinbaum, together with the World Bank, began to develop a comprehensive strategy called “Introduction of Climate Friendly Measures in Transport Project - PIMAAT” to address six main components:
1. Harmonization of sector strategies on air quality issues and an Integrated Climate Action Plan for Transport,
2. Definition of an enabling environment to facilitate the implementation of sustainable transport strategies,
3. Field Test of Climate-Friendly High Capacity Vehicles, 4. Technical assistance and training for incorporation of climate change and air quality
considerations in the design and analysis of transport strategies, 5. Public Awareness and Dissemination, and 6. Project Management. This last component established a team exclusively devoted to
conceptualize the technical, functional and institutional rationale of the initiative.
In the meanwhile, Mayor Andres Manuel López Obrador devoted most of his energy to what he
believed was to be his greatest legacy for the city: an elevated highway on top of a peripheral ring
linking the north and south of the city. The project was intended as a solution for congestion and
as an undeniable signature of his period in office. Nevertheless, public pressure to disclose
11
expenditures associated with the construction and concerns - publicly expressed by the Mexican
Nobel Price Mario Molina - about the effectiveness of urban highways in reducing (as opposed to
inducing) congestion in the long term led the Federal Government to evaluate complementary
measures to tackle congestion in Mexico City. The elevated urban highway – aiming to improve
conditions for those driving private cars – found its logical counterpart in this review in an upgrade
of public transport services for the majority of citizens using these modes. Close to the end of his
administration, López Obrador suddenly found in Sheinbaum and PIMAAT a solution not only
ready to be implemented, but also widely supported by both national and international
organizations waiting to see changes in the way public transport was delivered. His administration
officially committed to the project on the 2nd of August 2004, nearly four years after the
conception of the project, and one year before operations started. The first BRT project for
Mexico City was called Metrobus and started to operate on the 15th of June 2005. The project
was also possible thanks to a windfall in oil revenues that filled public coffers right on time3.
3.1 Barriers and success factors implementing Line 1 of Metrobus.
The Secretariat of Environment for the Federal District and the Federal Government faced various barriers to the successful implementation of the first line of Metrobus. The political power of concessionaires was strong and broadly supported by weak regulations. The lack of a public-private partnership laws also made this negotiation difficult. Finally, the lack of knowledge, capacity and experience with similar projects imposed additional challenges were worsened by the fact that SETRAVI - the transport authorities of Mexico City - were not initially involved. Metrobus was in fact not the result of a strategic transport plan envisioned by Mayor López Obrador and led by SETRAVI, but rather was the outcome a strategy targeting air pollution undertraken by the Secretariat of the Environment. Leadership undertaken by Secretariat of the Environment’s Chair, Claudia Sheinbaum was one of the key success factors implementing Line 1of Metrobus. Although Mayor López Obrador did not commit to the project until the very end, Sheinbaum kept on promoting and negotiating with stakeholders the new conditions under which Metrobus would operate. Her office secured funds for feasibility studies and created a planning and implementation team responsible for overseeing the project’s development. She was also a key negotiator with concessionaires despite of the lack of a regulatory framework to guide this process. Moreover, Mexico City´s Secretary of Environment appealed to international organizations for supplementary investment, ultimately gaining support from the World Bank, the Japan Human Resources Development Program, the World Resources Institute/Shell Foundation, and the Hewlett Foundation. Another ingredient for success was the creation of the Metrobus concession as a decentralized state-owned company reporting directly to the Mayor of Mexico City. From the implementation process through the operational phase, well-qualified professionals were appointed to plan, control and manage the new system. Metrobus serves as the main articulator between the service operators, the fare collector, and the trust fund responsible for gathering and disbursing all revenues to operators in accordance to the number of passenger kilometres travelled. Metrobus’ pivotal role leverages information technology, well-defined rules and clear contracts which has promoted trust among stockholders and, crucially, delivered a better service for users. Finally, well-crafted incentives, financial policies and instruments to attract private sector participation were key to procure the funds needed for capital investment. The scrapping program is just one example of a mechanism designed to renovate an old transport fleet as well as to
3 OCDE. 2012. Mobilizing private investment for Rapid Bus Transit Systems: The case of Mexico City. Towards a green
investment policy framework – case study series. Prepared by CTS EMBARQ Mexico.
facilitate the participation of current operators in the project. Existing operators received around $6,500 for each vehicle gave away for destruction. The program destroyed 647 minibuses and 31 buses for Line 1 and 2; and some 430 vehicles for Line 3. Therefore, for Lines 1, 2 and 3 the scrapping program supported to acquisition of 365 new, high capacity and cleaner units replacing an existing fleet of 1108 low capacity and polluting vehicles.
3.2 Sustaining the paradigm
After the success of the first line, Mayor Marcelo Ebrard (2007-2012) consolidated a Metrobus
network composed by four lines (95 km and 800,000 passengers served per day), including a
lighter version of the conventional BRT corridor implemented in the Mexico City´s downtown area.
Ebrard´s determination to relocate informal commerce and parking space, proved not only his
commitment towards his mobility agenda, but also his ability to integrate transport, transit and
urban development. Line 4 of Metrobus broke the Mexican paradigm of mass transport systems
based on articulated buses and sprawled-out stations. Inspired in international practices, Marcelo
Ebrard also implemented the very first bike sharing system called “Ecobici”. In addition to his
program of pocket parks and renovated public space, his administration also delivered an
additional Metro line (line 12). At the end of Ebrard´s administration, Mexico City received the
“Sustainable Transport Award” granted at the annual Transportation Research Board meeting
held in Washington D.C.
Although the mobility model provided by Metrobus in Mexico City seems to be well-accepted at
present, the service is running at a loss -- in 2010 Metrobus had losses of just over half a million
dollars. These losses are linked to the Federal District government’s exposure to unrecovered
infrastructure investment expenditures. In effect, the initial feasibility studies, planning and
operational implementation of Line 1 were largely funded through international grants, sought
mainly by the Secretariat of the Environment. Capital investments in rolling stock (buses) were, in
turn, largely financed by the private sector, except for contributions by the government in the first
two lines. However, the debt exposure of the Federal District government has largely stemmed
from non-recoverable infrastructure investments for lines 1 and 2 that resulted from an
international public bidding process and ensuing debt exposure for lines 3 and 4. The Federal
District’s financial situation was relatively healthy during the construction of lines 1 and 2 but this
changed for the construction of lines 3 and 4. Limited own funds available to the Federal District
for the construction of these lines meant that greater debt exposure was necessary to complete
lines 3 and 4. Servicing this debt has been challenging and Metrobus’ financial outlook has been
eroded.
The new administration headed by Miguel Mancera committed to deliver 5 additional Metrobus
lines by the end of 2018. However, in order to deliver on this commitment and to ensure proper
maintenance on the 95 km BRT network, the City will have to address perverse incentives
leading to annual negotiations with operators and re-visit a business model that strongly focuses
on farebox revenues for operating revenue.
13
3.3 Key lessons from Metrobus
- BRT systems require a high level of institutional development to work properly. By the time
Line 1 of Metrobus was implemented, Mexico City benefited from a profound political reform complemented with the participation of several international organizations and donors.
- Metrobus also greatly benefited from an inspired leader and an institutional champion (Mexico City´s Secretary of the Environment and her agency). Nevertheless, political contingencies could have easily led to situations where Metrobus would have not been worthy of the political risk. High-level political support is key and should be encouraged at the very beginning of the project to facilitate negotiations with stakeholders.
- Metrobus acts as an independent and qualified body and this underscores the need for a group of competent and qualified professionals to deliver on public transport investments in connectivity.
- The Metrobus model has leveraged information technology, well defined rules and clear contracts to promote trust among stakeholders and, crucially, a better service for users.
- Metrobus faced serious objections from concessionaires, which had to be overcome4. This
however, led to an innovative transport operation scheme which involved both public and private sectors which is one of the greatest accomplishments of the system.
4. NATIONAL TRANSPORT POLICY TRIGGERED BY METROBUS.
The success of Metrobus and the international trend supporting mass transport system based on high capacity buses, specifically BRTs, motivated the creation of national program to support the modernization of transport service in Mexican cities. In 2009 the Mexican government created PROTRAM (a Federal Support Program for Mass Transit) to address the challenges around economic and social costs associated with urban sprawl and high motorization rates. PROTRAM finances planning studies and infrastructure investments for mass transit through grants, loans and guarantees. To be eligible, a city must have carried out a comprehensive planning exercise, known locally as an Integral Sustainable Mobility Master Plan to frame the overall transport policy. The program requires private sector participation (usually in the form of rolling stock and infrastructure for operations and maintenance), as well as funding from local entities (State or Municipal level). PROTRAM finances up to 50% of the total infrastructure cost, which includes exclusive lanes, stations, terminals, and some technology investments (e.g. fare collection system, fleet control systems). PROTRAM’s technical unit analyses funding requests for urban transport projects on the basis of technical, social, environmental, and financial criteria to determine eligibility and potential support levels. The final decision on funding rests with FONADIN (National Fund for Infrastructure) and its Technical Committee, headed by the Secretary of Finance and participation of Secretaries of Transportation, Environment and Tourism, and the National Bank for Infrastructure
4 Concerns from existing operators mainly focused on revenue distribution, fare collection, assignation of kilometers to be
covered by each operator, and access to affordable credits. The local government stablished working sessions to get operators in compliance with technical specifications and standards defined for the project. This model differs from what is done in other cities in Latinoamerican where private operators are selected through a public tendering process.
(BANOBRAS). Currently, there are over 40 projects in PROTRAM’s pipeline worth over 10 billion dollars
5. PROTRAM has signed financing agreements with five cities.
After close to seven years of operations PROTRAM has supported the implementation of only three projects. The reasons for the national program not delivering a larger number of projects are still under debate. The primary cause usually identified is the lack of institutional capacity at the Federal level. More specifically, the slow pace of project development is attributed to time taken for review and approval of project proposals. Moreover, national priorities and presidential commitments imposed further negotiations beyond the formal assessment process. Therefore, even though available capacity for project preparation, assessment and approval needs to be strengthened, allocated funds also need to be sustained and isolated from political contingencies. Finally, sustainable transport does not rely on infrastructure alone. Successful cases, like Line 1, have improved transport services and streamlined the relationship between providers and the government agencies overseeing transport services. Technologies can be an effective mean for these relations to be more transparent. Fare collection and fleet control systems provide reliable information for stakeholders to agree on regulations and commitments aiming for a better quality of service. Additional programs addressing the need for enhanced transport governance in coordination with infrastructure projects would ensure proper implementation and also sustain healthy operations.
5. THE CASE OF THE FIRST SUBURBAN RAILWAY IN MEXICO CITY.
More than half (56%) of the total of 48.8 million trips made in Mexico City every day are between the Federal District and the State of Mexico. Projections for 2020 suggest that 60% of the population at the Metropolitan level will live in the outskirts of the city. Daily travel time for those living in the State of Mexico and commuting every day into the Federal District can be as high as 5 hours. Moreover, users can spend as high as one third of their total income in transport. Finally, transport services connecting the two jurisdictions are weakly regulated by the local authority and it is usually provided by low-capacity, inefficient, unsafe and high pollution minibuses. Only 15% of the routes in the greater Metropolitan area provide opportunities to connect with mass transport systems (like Metro or Metrobus) within the Federal District. The lack of a centralized authority governing urban transport at the metropolitan level complicates the task of providing efficient and affordable transport services within and between the Federal District and the State of Mexico. The following sections describe how a first line of suburban railway network was planned, built and finally inaugurated and operated. The section also provides some lessons learned throughout this process. 5.1 Planning
5.1.1. Early attempts
One of the first attempts implementing a suburban train for Mexico City was the proposal of a line connecting Mexico – Queretaro in 1978. After several difficulties dealing with construction and land acquisition, the project was finally implemented in 1994. Nevertheless the line operated only for two years. In 1996 the Mexican government privatized its railway network and Kansas City Southern de México – the new owner of the line connecting Mexico and Queretaro - sold its entire rolling stock to a company in the United States. All that remained for future railway projects on this line was the track and the overhead catenary system that allowed for electric operation.
5 World Bank and Asian Development Bank. 2012. Cities at a crossroads: Unlocking the potential for green urban
transport.
15
In 1990 an ambitious proposal for a suburban train network took place in Mexico. It was called the 1998´s Strategic land use plan for the Metropolitan Area signed by governors Cuauhtémoc Cárdenas (Federal District), César Camacho (State of Mexico), and Secretary Carlos Rojas (Social Development). The plan considered at least 6 lines of massive transport systems connecting the Metropolitan area by a network of suburban railways. Although the project was publicly supported by key political figures, the lack of management and budget revealed that no formal commitment was yet in place. Between 1994 and 2000, a 20 km suburban train line to be located at the Northwest section of the city was assessed and proposed by the Federal District. In 1992 the Federal District announced an invitation to tender for the construction and operations of what was called at the time the Ecotren. The project was in complete alignment with a “Special Development Zone” aiming to regulate rapid development causing congestion problems in the area. The project envisaged an elevated railway avoiding more than 158,000 car trips per day. Nevertheless, the project experienced strong opposition from organized groups from Polanco, one of the richest neighbourhoods in the city. Arguing lack of transparency and social communication, protesters gained support from political figures and authorities decided to abandon the initiative.
5.1.2. 245 km of suburban railway network for Mexico City
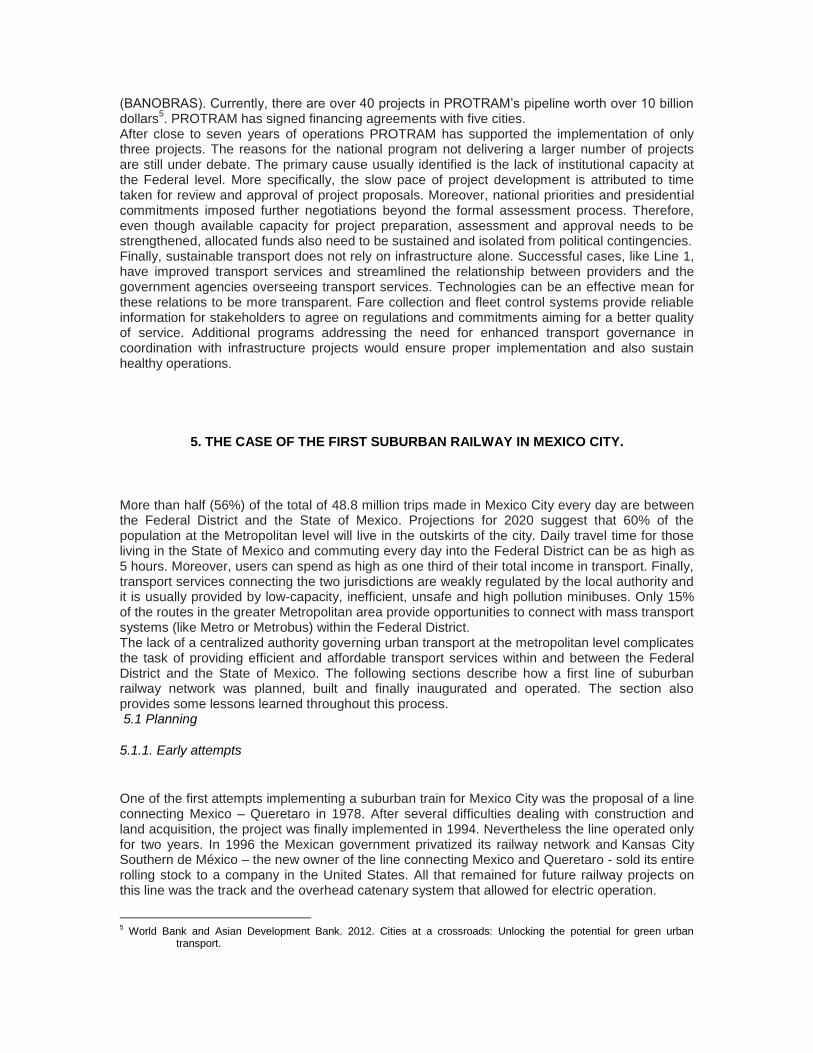
After additional attempts to implement a suburban train replacing Ecotren - including a proposal for Metro Line 11 - in June 2001 the Secretary of Transport at the Federal level proposed a network of 246 km of suburban railways to be constructed in three phases: Phase I: 79 km (redline), Phase II: 90 km (blue line), and Phase III: 77 km (green line). The network would encompass 5 terminals, 7 transfer hubs, 10 inter-modal hubs (coordinated with metro), and 42 stations. Compared to Ecotren, this network would have a major comparative advantage: it would use state-owned right-of-ways and therefore, would not require negotiations (or compensations) with organized groups eventually opposing the project. Figure 7. Phase I, II, and III encompassing 243 km of a railways network for Mexico City Metropolitan area and Phase I (red line).
Source: Adapted from Secretaría de Comunicaciones y Transportes. 2012. Libro Blanco Sistema 1 del Tren Suburbano
ruta Buenavista-Cuautitlán. Zona Metropolitana del Valle de México.

5.1.3 Suburban railway network - Line 1
Both the National and State governments committed to Line 1 in June 2003 and it was opened for service in May 2008. The original plans for the 27 km long line encompassed 6 stations (1 located in the Federal District and 5 in State of Mexico), 1 terminal (Buenavista in Federal District), 20 vehicular overpasses, and 17 pedestrian bridges. The project was to be built and operated by a 30 year concession with the support of complementary infrastructure facilitated by the national government. Initial estimates were for Line 1 to carry 298,000 passengers a day. Line 1 (or Red line) was prioritized over phases 2 and 3 (blue and green) mainly because it involved fewer conflicts around land acquisition at the railway itself, and building new stations and terminals. By using state-owned right of ways (ROW) and pre-existing terminals (Buenavista), the project minimized potential conflicts like the ones experienced while planning Ecotren. Nevertheless, such lack of conflicts had a major drawback: main access to the system would be embedded in industrial zones only accessible by car-oriented infrastructure. As the existing railway was designed to connect cities but not suburbs – where railways are isolated from residential land uses for safety reason – accessing the new system by foot proved to be a major challenge. To tackle this, the Secretary of Transport decided that a fleet of minibuses would directly feed the new system. A series of complementary infrastructure projects – including overpasses and the overall improvement of roads connecting terminals and stations with the road network – were incorporated in the tendering process to ensure proper access to the system. The project also encompassed pedestrian crossways to facilitate pedestrian access from residential areas in close proximity to stations and terminals.
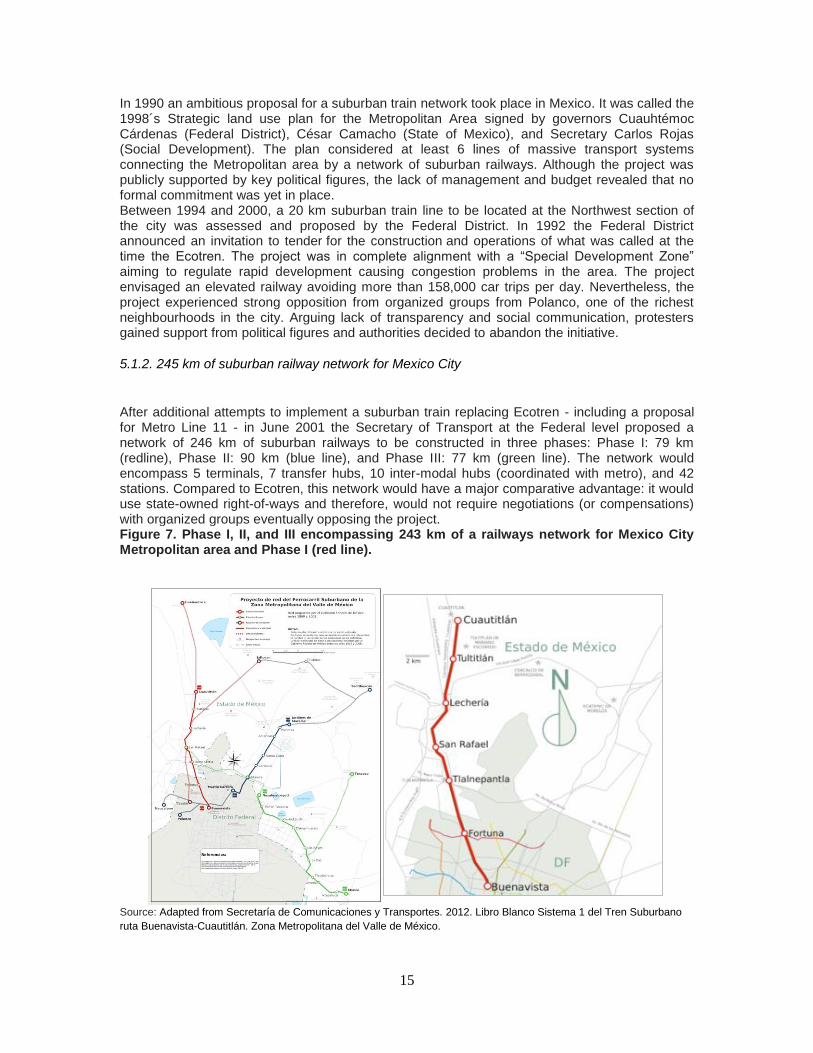
Lead by the Federal transport authority (Secretary of Transport and Communications – SCT in Spanish), the project assumed that 65% of the daily demand (around 187 thousand passengers) would access the system by a feeder system based on minibuses mainly regulated by State of Mexico. The rest 35% would have directly access by foot or less frequently by taxi or car. Figure 8 summarizes commitments and responsibilities between the SCT, the financial entity (National Bank of Infrastructure – BANOBRAS), the concessionary in charge of building and operating the system, and the local transport authorities regulating the feeder system. While operational components securing 65% of the projected demand were based on simple agreements between SCT and local transport agencies (without penalties or financial consequences involved); railway operations responsible for only 35% of the projected demand were regulated by contracts.
17
Figure 8. Main responsibilities as stayed in the contract between the private concessionaire and the Secretary of Transport.
Source: The author.
5.2 CONSTRUCTION
An initial work plan presented by the concessionary in September 2005 committed to deliver the major infrastructure components by December 2007 and to start operations by January 2008. Several issues delayed these commitments and started to reveal serious risks that were not well assessed beforehand:
- Agreements between local authorities and SCT proved to be very difficult to enforce due to lack of local capacity and procedures ensuring coordination among stakeholders. Such difficulties had a detrimental impact on delivering the key infrastructure components that enhanced motorized and non-motorized access to stations and terminals.
- Hundreds of families informally occupying the ROW for decades fiercely opposed the project and local authorities struggled to enforce re-location procedures. This also negatively impacted delivery of some infrastructure components and jeopardized future operations.
- Reclaiming the state-owned ROW was not as simple as projected. Unpredicted negotiations with industries and private users also delayed plans.
A series of activities around optimizing and redesigning transport routes feeding the railway system were contemplated. These activities were to be undertaken by local transport authorities from within the State of Mexico and the Federal District in active coordination with private concessionaires. Minibuses were to determine operational schemes so that users minimized waiting time when changing from one mode of transportation to another. For an operator to take or leave passengers within stations and terminals, an additional 3 pesos fee (0.2 US dollars) was to be charged. No integrated fare scheme between the train and its feeder system was planned nor implemented.
5.3 OPERATION
Line 1 was finally inaugurated in May 2008, 4 months after originally planned. Unfortunately, several components of the project were still missing on first day of operations. Some vehicular overpasses and pedestrian bridges were not finished or, in some cases, not even started. Most importantly, only few operators modified their itineraries and routes to connect residential zones with the railway system. After the first year of operations, Mexico´s first suburban railway attracted just half of the projected demand (148,000 daily passengers), 78% of which access the system by foot, taxi or car. This situation greatly differs from the original plan which foresaw most users accessing the stations by minibuses (65% of the projected demand). Several factors can help understand the system´s failure to attract the projected demand. From the feeder system side, the following issues seemed to have played a role:
- Operators of minibuses looked at the train as a competitor and had no clear incentive to reorganize their routes.
- Regulatory attributions, agreements, and incentives were not aligned to provide a reliable feeder system.
- The integration of fares between minibuses and the suburban train was simply not considered.
The overall lack of integration between the train and its feeder system at many levels (infrastructure, operations, and fare) was also difficult to reverse due to unregulated competition. Even though competitors operating minibuses are slower (Line 1 is up to 40 min faster), total fares are less expensive (almost a dollar cheaper) and therefore more attractive for low-income users. Moreover, frequent criminal activity around stations and pedestrian bridges, fuelled by the lack of streetlights and poor public safety, discourages current riders and diminishes the attractiveness of the suburban train option for potential travellers. Regarding difficulties around complementary infrastructure projects, some key issues compromising projected levels of passengers include the following:
- Several components that would have improved accessibility were delayed or simply not delivered.
- Residential areas were difficult to connect without major urban renovation projects which were not considered.
- Accessibility proved to be a significant challenge in the context of preexisting industrial use.
After three years of operations, the concessionaire sued SCT for 1,166 million pesos (around 74.2 million dollars) arguing that actions by SCT led to under-delivery of the projected 298,000 passengers per day to be served by the new system. According to SCT, the main reasons behind the system´s failure in attracting the projected demand are:
- The inefficiencies around the mobility plan regulating and implementing effective incentives for feeder routes to attract passengers to the system. Deficiencies of both physical and operational integration were identified as main weaknesses of a plan whose implementation was mainly under the responsibility of the State of Mexico.
- Delays in complementary infrastructure projects and making the ROW available for operations.
- The lack of an integrated fare system promoting a coordinated and affordable service based on minibuses and the railway.
- The absence of a communication program able to attract and maintain users.
19
By December 2011, SCT, the concessionaire, BANOBRAS and its national infrastructure fund (FONADIN), agreed on a complete financial restructuration around the project including an extended 45 year concession period, additional funds for future contingencies and the acquisition of the total private debt by the government. According to SCT, by 2012 the Federal government has invested $621 million in the project, a budget 40% over what was originally planned
6.
Currently, SCT, local transport authorities, and BANOBRAS are still designing alternatives to enhance the feeder system based on buses. Additional efforts also aim to connect Line 1 with mass transit systems such Mexibus (the State of Mexico´s BRT system) and deliver unfinished accessibility infrastructure for cars as well as pedestrians. By 2015, the highest demand the system has ever reached is 178,000 passengers per day. 6. Lesson learned around Line 1 and suburban transport governance To deliver the kind of urban transport services that can shift paradigms and set precedents for better practices, government officials need to focus beyond the provision of infrastructure. Professor Mark Moore
7 from John F. Kennedy School of Government at Harvard University
proposes a “strategic triangle” for government managers to consider when committing to transformative urban projects. The framework proposes: First, define the important “public value” the agency should produce. Second, strengthen the sources of “legitimacy and support” by which the agency would streamline and regulate participation of all stakeholders and allocate the necessary financial and human resources sustaining the efforts to create that value. Third, streamline key “operational capabilities” necessary to deliver both the hardware (infrastructure and information technologies) and software (enhanced and integrated transport services) associated to sustainable transport projects. Under Moore´s framework, Line 1 performs fairly well in some aspects but poorly in others. Along the process of project planning and implementation, officials strongly focused on delivering what was thought to be the most important component of the project: the rolling stock and infrastructure. Public value envisioned for the project clearly relied on the provision of stations, ROW, railways, and the electrification system. Qualitative aspects around operations and quality of service, however, did not play a prominent role in defining what was the public value SCT sought to deliver. Similarly, the focus on operational delivery of the service focused almost exclusively on the rail component at the expense of the bus connectors. Rail operations supported by fleet control systems and signage provide a reliable transport service for users once they accessed the system. Nevertheless, the leading agency completely relied on local transport agencies to organize minibuses operators feeding Line 1 without assigning responsibility for delivering, overseeing the process or assuring compliance with predefined agreements. In other words, neither local agencies nor the Federal Government secured built capacity able to deliver such a complex initiative. Finally, legitimacy and support pursued by the leading agency has also focused on the railway system completely overlooking the need to organize a feeder system. As discussed before, while rail operations are strongly regulated and clearly defined through PPPs, minibuses (responsible for feeding 65% of the projected demand) remained poorly regulated and faced no incentives for rearranging routes to feed Line 1. Even though finance has been decisively secured for the project; the lack of passengers (less than half of projected) keeps the system under serious financial pressure. Figure 9 summarizes this analysis and assigns a score to Line 1 at each component of Moore’s strategic triangle.
Figure 9. Components of Line 1 following the strategic triangle for government managers. Scores represent performance of each component based on a qualitative assessment (0 represents the lowest performance and 10 the highest).
6 Secretaria de Comunicaciones y Transportes. 2012. Libro Blanco - Sistema 1 del Tren Suburbano Ruta Buenavista-
Cuautitlán. Zona Metropolitana del Valle de México. 7 Mark H. Moore and Sajeev Khagram. 2004. On creating Public Value: What business might learn from government
about strategic management. Working paper of the Corporate Social Responsibility Initiative. Hardvard University.
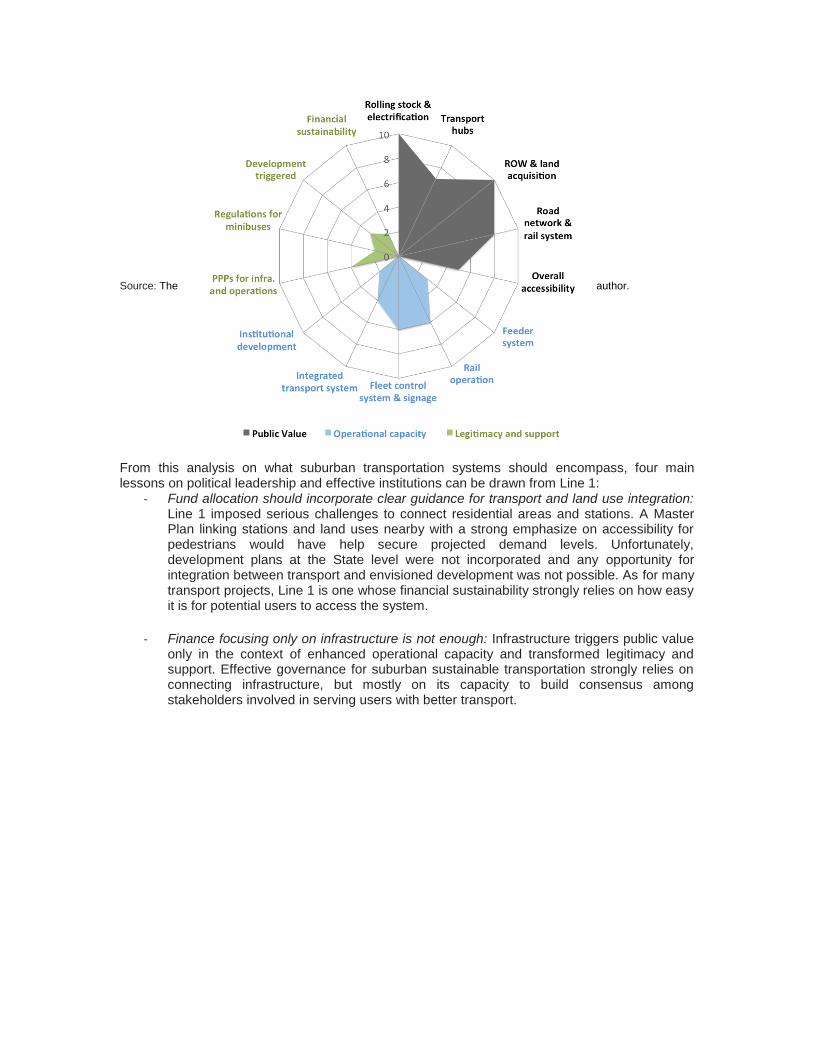
Source: The author.
From this analysis on what suburban transportation systems should encompass, four main lessons on political leadership and effective institutions can be drawn from Line 1:
- Fund allocation should incorporate clear guidance for transport and land use integration: Line 1 imposed serious challenges to connect residential areas and stations. A Master Plan linking stations and land uses nearby with a strong emphasize on accessibility for pedestrians would have help secure projected demand levels. Unfortunately, development plans at the State level were not incorporated and any opportunity for integration between transport and envisioned development was not possible. As for many transport projects, Line 1 is one whose financial sustainability strongly relies on how easy it is for potential users to access the system.
- Finance focusing only on infrastructure is not enough: Infrastructure triggers public value only in the context of enhanced operational capacity and transformed legitimacy and support. Effective governance for suburban sustainable transportation strongly relies on connecting infrastructure, but mostly on its capacity to build consensus among stakeholders involved in serving users with better transport.
21
- Key stakeholder, responsibilities and cooperation procedures need to be identified early in the planning process: Whatever the extent of the initiative, suburban transport will always impose challenges around administrative boundaries, fragmented institutions and attributions, and diversity of transport modes and related infrastructure. The strategic triangle for government managers should be reflected in early phases of project conceptualization and planning. Federal agencies should define accountability over key tasks and streamline cooperation procedures among stakeholders to ensure project delivery and quality standards. Defining workflow for project design, implementation and oversight is also essential.
- Funds from Federal sources to local beneficiaries should be allocated in compliance with standards of accessibility and integration: Public value is also incomplete without meeting clear standards for accessibility and integration. By the time Line 1 was committed by the Presidency, Mexico had no national policy guiding mobility projects of this nature. Moreover, existing guidelines aims for projects linking cities but not suburban areas. Thus, leading agencies had no incentives nor previous experiences or guidance to ensure accessibility and integration standards. National efforts supporting suburban transport systems urgently need such guidelines to be developed and discussed. Guidelines like these should be then be linked to rules and incentives for fund allocation.
- Institutional strengthening and project management overseeing projects from planning to implementation would avoid negative outcomes under PPPs or agreements: State of Mexico and Federal District were provided the financial means to deliver complementary infrastructure projects but Federal support did not take into account the need for legitimate and supported local institutions. These agencies simply don´t have qualified personal and, most importantly, the political support to undertake the regulatory reforms needed for an effective integration between minibuses and Line 1. Transport policies or strategic projects like Line 1 should place a big emphasis on strengthening institutions and building capacity around project management. Such efforts should not only focus on technical skills, but even more importantly, on managerial capabilities for local agencies to shape consensus among stakeholders and enforce accountability.
Main facts where collected from: Centro Nacional para la preservación del patrimonio cultural ferroviario. Mirada Ferroviaria. 2011. Ferrocarril Suburbano de la Zona Metropolitana del Valle de México. Revista Digital, mayo-agosto de 2011, número 14. Secretaria de Comunicaciones y Transportes. 2012. Libro Blanco - Sistema 1 del Tren Suburbano Ruta Buenavista-Cuautitlán. Zona Metropolitana del Valle de México. World Bank. 2009. Implementation completion and results reports. Sustainable development department. Report No: ICR00001206. OCDE. 2012. Mobilizing private investment for Rapid Bus Transit Systems: The case of Mexico City. Towards a green investment policy framework – case study series. Prepared by CTS EMBARQ Mexico. Encinas, A. 2007. La gestión de la izquierda en el Gobierno de la Ciudad de México. Departamento de sociología rural. Universidad Autónoma de Chihuahua. Portal automotriz. 2013. Reconoce el Banco Mundial labor del GDF por el Metrobús.