Embed Size (px)
Citation preview
Atualidades Ornitológicas, 205, setembro e outubro de 2018 - www.ao.com.br 49
Urban birds related to habitat, population density, and socioeconomics in Cambridge, Massachusetts, USA: Scaling biodiversity immersion in cities
David C. Morimoto*,1, MacKenzie Schoenthaler1 & Nathan Coney1
Abstract. Analyses of breeding birds at 31 locations in Cam-bridge MA revealed significant associations between the numbers of resident and migrant species and individuals and tree canopy cover, impervious surface cover, the ratio of canopy to impervious surface, and human population density. No significant correlations occurred between income or poverty and bird diversity, likely due to the compact, densified nature of Cambridge. Five wooded areas in the western part of the city had the majority of bird species. Most sites were dominated by a few common species, especially House Sparrows (Passer domesticus, >50% individuals). Mature residential areas and forested urban areas are of great importance to urban bird diversity, and continuous monitoring is necessary to mitigate the negative impacts of lot and block scale urban de-velopment on birds. Despite high bird diversity in key areas and well-distributed recreational open space in Cambridge, the poten-tial daily exposure of the bulk of Cambridge’s human residents to bird diversity is generally limited, leading to “green inequity”. Given the benefits of nature, urban planning and design should strive to scale regional bird diversity as a basic need of citizens, just as all of our body cells need oxygen.
Resumo. Análises de aves em reprodução em 31 localidades em Cambridge, MA, revelaram associações significativas entre o número de espécies residentes e migrantes e indivíduos e cobe-rtura de copa das árvores, cobertura de superfície impermeável, a proporção de copa para superfície impermeável e densidade populacional humana. Nenhuma correlação significativa ocor-reu entre renda ou pobreza e diversidade de aves, provavelmente devido à natureza compacta e densificada de Cambridge. Cinco áreas arborizadas na parte ocidental da cidade tinham a maioria das espécies de aves. A maioria dos locais era dominada por al-gumas espécies comuns, especialmente os pardais domésticos (Passer domesticus,> 50% de indivíduos). Áreas residenciais maduras e áreas urbanas florestadas são de grande importância para a diversidade urbana de aves, e o monitoramento contínuo é necessário para mitigar os impactos negativos do lote e bloquear o desenvolvimento urbano em aves. Apesar da alta diversidade de aves em áreas-chave e espaço aberto de recreação bem dis-tribuída em Cambridge, a potencial exposição diária da maioria dos habitantes humanos de Cambridge à diversidade de aves é geralmente limitada, levando à “desigualdade verde”. Conside-rando os benefícios da natureza, o planejamento urbano e o de-sign devem se esforçar para escalar a diversidade regional de
aves como uma necessidade básica dos cidadãos, assim como todas as células do nosso corpo precisam de oxigênio.
IntroductionBirds are some of the most ubiquitous and commonplace ani-
mals that people living in urban areas encounter on a daily basis, but their diversity varies widely even across a city as compact as Cambridge, Massachusetts. In other urban areas, bird diversity and abundance have been associated with socioeconomic status and human population density (Melles 2005, Lerman and War-ren 2011, Strohbach et al., 2009, Cox et al., 2018), in part due to the trend for lower-income areas to be more densely popu-lated and have less green space. We studied the distribution and abundance of breeding birds in Cambridge Massachusetts to see if there were similar patterns of association in this highly popu-lated (105,740 people) and compact (~18 km2) city.
Increased levels of exposure to nature and biodiversity have a beneficial effect on physical and mental health (Keniger et al., 2013, Tsao et al., 2014). Bird song can help with perceived atten-tion restoration and stress recovery (Ratcliffe et al., 2013), and increased diversity of bird song leads to higher appreciation of the urban areas we inhabit (Hedblom et al., 2014). The abundance and diversity of birds, as well as the overall biodiversity of an urban area and the percentage of vegetation cover or green space, are highly important for the mental and physical health of the hu-mans who inhabit cities (Cox et al., 2017, Nowak et al., 2006, Fuller et al., 2007). In addition, nature visits, even to small urban green areas, have been associated with feelings of restoration and relaxation, as well as increased self-esteem and improved overall mood (White et al., 2013, Barton and Pretty 2010).
Taken together, these findings imply that people living in lower-income areas have less exposure to nature, especially to birds and vegetation, and therefore less exposure to the beneficial effects of such, leading to a disadvantage of environment, “green ineq-uity” or “the luxury effect” (Danford et al., 2014, Leong et al., 2018). We examined the results of our Cambridge bird study in light of these findings to determine the extent to which there exist socioeconomic inequalities in potential local daily exposure rate of people to green space and biodiversity, in particular birds. So-cial inequalities in exposure to biodiversity and green space could have significant consequences for human health and wellness in urban populations (Keniger et al., 2013, Cox et al., 2017).
Urbanization is a global trend, with over 50% of the global hu-man population living in cities today, and over 80% of Americans living in cities (Grimm et al., 2008, US Census 2010). By the middle of this century, nearly two-thirds of the global population
Atualidades Ornitológicas, 205, setembro e outubro de 2018 - www.ao.com.br50
is expected to live in cities (United Na-tions Department of Economic and Social Affairs 2014). Cities are in the process of continuous development, whether that be at block scale or lot-scale, such as in the case of highly urbanized Cambridge, which in the past had significantly more open, green space and is now undergoing another surge of development and densification (Strobach et al., 2014). This pattern of urbanization at any scale usually has deleterious effects on most bird populations (Chace and Walsh 2006, Rodewald and Bakermans 2006, Hedblom and Söderström 2010, Aaronson et al., 2014, Strobach et al., 2014, Batáry et al., 2018, LaSorte et al., 2018) with the exception of urban adapters such as House Sparrows (Passer domesticus), Rock Pi-geons (Columba livia), European Star-lings (Sturnus vulgaris), Mourning Doves (Zenaida macroura), Common Grackles (Quiscalis quiscula), American Robins (Turdus migratorius), and Northern Car-dinals (Cardinalis cardinalis). Therefore, urban dwellers tend to experience less bird biodiversity, if not less biodiversity overall.
Given the beneficial effects of biodi-versity exposure, the alarming increase in nature deficit among humans today (Louv 2005, Turner et al., 2004, Tewksbury et al., 2014), and the global trend of urban-ization with its negative impacts on bio-diversity and its resultant green inequities, we need to pay significantly more atten-tion to the deliberate planning of cities to include a minimal ac-ceptable level of daily biodiversity and green space exposure for every citizen. We conducted our investigation of Cambridge birds to assess the extent to which bird diversity is linked to so-cioeconomics, habitat, population, and population density, and we discuss our results in the context of designing cities to scale
biodiversity immersion, thus mitigating these disparities and en-hancing overall biodiversity exposure.
Study AreaCambridge, MA (Middlesex County) is a compact city (18km2,
with 17 km2 of land). With a population of 105,740 people, it is
Figure 1. Cambridge, MA, Middlesex County, highlighted within the densely populated Boston Basin ecoregion. <https://goo.gl/gcrxKM>.
Atualidades Ornitológicas, 205, setembro e outubro de 2018 - www.ao.com.br 51
the second most densely populated city in New England (~6220 people/km2 ), with a density similar to that of Tokyo (https://goo.gl/7r7Xjr). Cambridge is the 12th most heavily populated city in New England and the fifth most populous city in the state of Massachusetts (https://goo.gl/u6SxJx).
Its neighboring city of Somerville is the most densely populated city in New England, and together they are situ-ated in the heavily urbanized Boston Basin Ecosystem, which is about 80% developed (Figure 1).
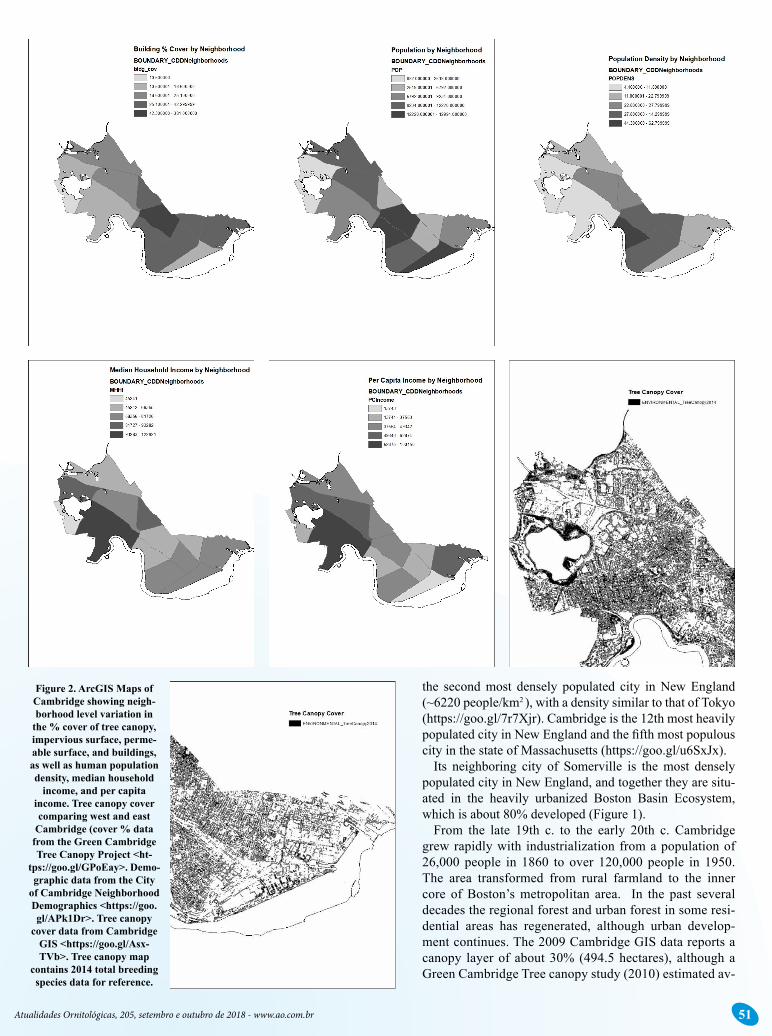
From the late 19th c. to the early 20th c. Cambridge grew rapidly with industrialization from a population of 26,000 people in 1860 to over 120,000 people in 1950. The area transformed from rural farmland to the inner core of Boston’s metropolitan area. In the past several decades the regional forest and urban forest in some resi-dential areas has regenerated, although urban develop-ment continues. The 2009 Cambridge GIS data reports a canopy layer of about 30% (494.5 hectares), although a Green Cambridge Tree canopy study (2010) estimated av-
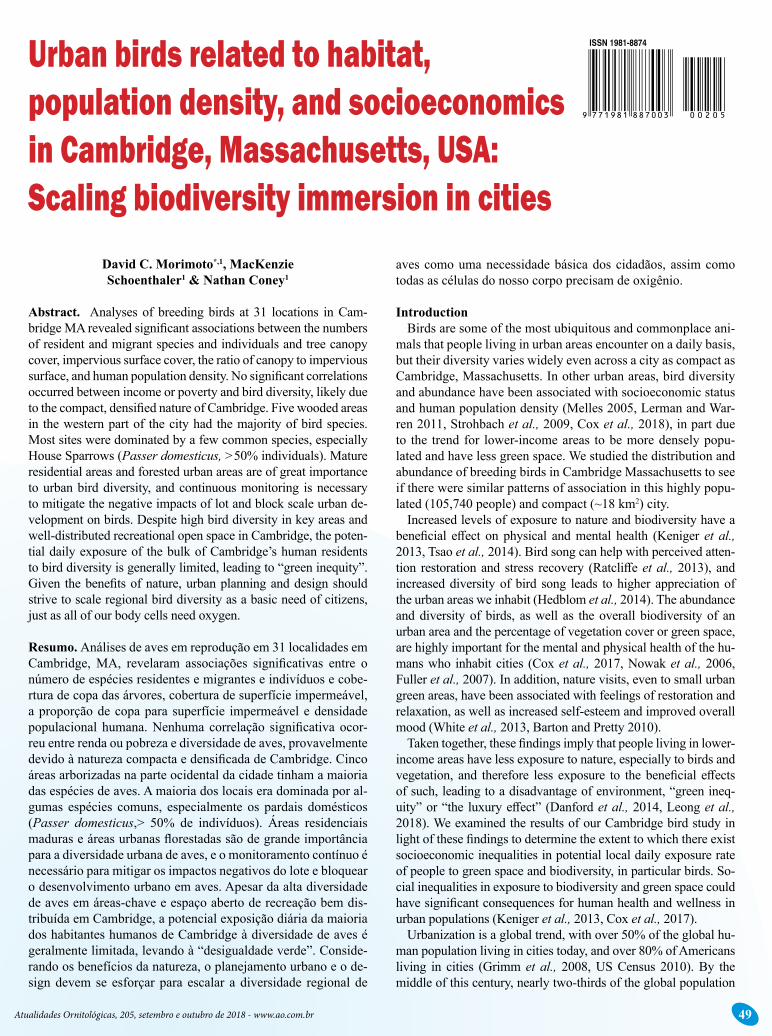
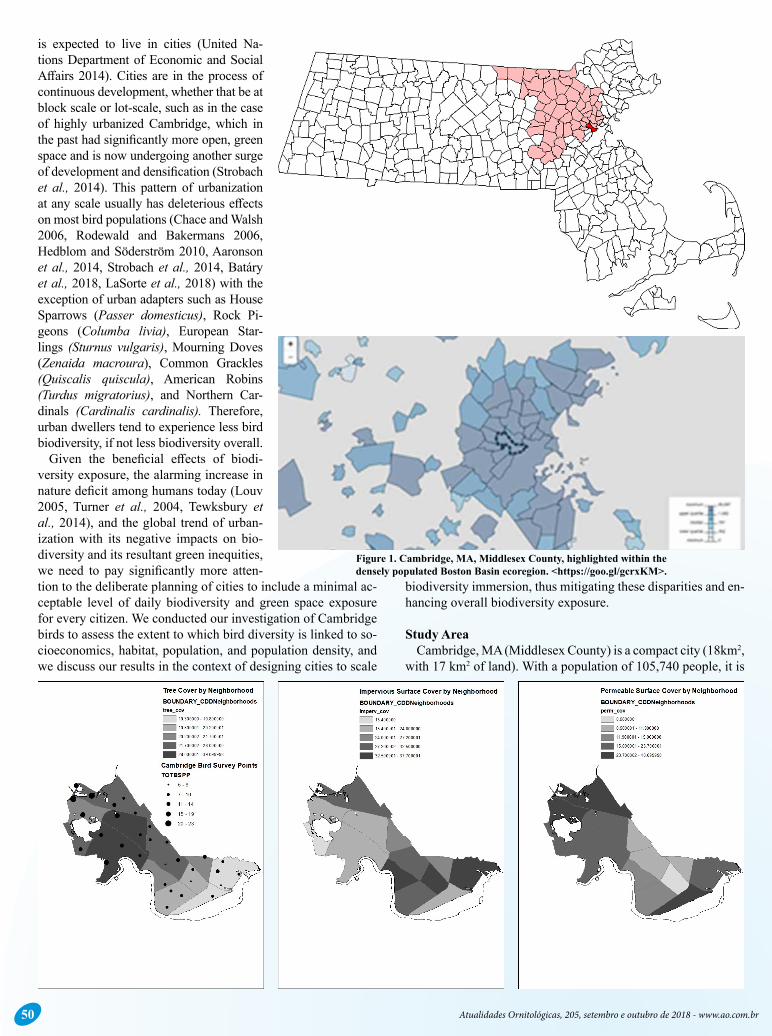
Figure 2. ArcGIS Maps of Cambridge showing neigh-borhood level variation in
the % cover of tree canopy, impervious surface, perme-able surface, and buildings, as well as human population density, median household
income, and per capita income. Tree canopy cover comparing west and east
Cambridge (cover % data from the Green Cambridge Tree Canopy Project <ht-
tps://goo.gl/GPoEay>. Demo-graphic data from the City
of Cambridge Neighborhood Demographics <https://goo.gl/APk1Dr>. Tree canopy
cover data from Cambridge GIS <https://goo.gl/Asx-TVb>. Tree canopy map
contains 2014 total breeding species data for reference.
Atualidades Ornitológicas, 205, setembro e outubro de 2018 - www.ao.com.br52
erage canopy coverage to be 23.7%. Approximately 200 hect-ares (~11%) of Cambridge is open space for the public.
Cambridge’s 13 neighborhoods vary considerably with re-spect to both habitat (% buildings, impervious surface, perme-able surface, tree canopy) and demographics (population, popu-lation density, median, household income, economic inequity, racial composition, Figure 1 and 2). In general, the more densely populated locations with lower income tend to be in the eastern part of the city, where more minorities also reside, although this is a gross oversimplification of the complex geography of this culturally diverse city. A large and more heavily built and paved commercial zone occurs in the easternmost reaches of the city, up to the banks of the Charles River, where MIT also occurs. Maps of the Gini Coefficient of economic inequity show that income inequities occur in both the western and eastern parts of the city (https://goo.gl/aJV5r8).
The western half of the city contains the five most forested sites in the city in nature preserves, parkland, and around a com-mercial industrial/residential park and water resources (reser-voir, ponds, streams and marshes). It also has a more wealthy human population in general (Figure 1) with larger lot sizes and more and older yard trees. Harvard University, Lesley Univer-sity, and Harvard Square occupy much of the constricted middle part of Cambridge.
Given this considerable variation within the city, one would expect bird diversity to correlate with both habitat and socio-economic variables. However, Cambridge is rather unique, being very dense and compact with a good deal of develop-ment involving the conversion of houses and apartments into condominiums, thus increasing human population density in even the wealthiest neighborhoods. Many small recreational parks are scattered throughout all of Cambridge, and municipal street trees are managed and occur across the city (https://www.mapsonline.net/cambridgema/trees.html). The gentrification of neighborhoods is also occurring, and the city is a desirable liv-ing place, a global innovation hub (with Boston), and a world famous zip code (02138). Populations are increasing in some of the less densely populated neighborhoods, with the most densely populated neighborhoods being near or at peak density with the current housing infrastructure (http://www.cambridgema.gov/CDD/planud/neighplan). Diverse people live in close proximity to one another, with apartment complexes in every neighbor-hood and with substantial economic inequities at the grain and scale of census blocks, block-groups, and tracts and neighbor-hoods.
Therefore, patterns of association between bird diversity and socioeconomic variation may not be as apparent in Cambridge as they may be in other cities with more well-defined socio-economic zones. In addition, the overall developed nature of the city suggests that bird diversity may be low as a whole in Cambridge. Thus, relatively low and avian biodiversity may be experienced by the bulk of the city’s residents regardless of income.
Cambridge also has a long ornithological history, with data going back over 150 years (Strobach et al., 2014), so it is an ide-al city in which to study patterns of bird diversity with urbaniza-tion over time. We sought to continue Cambridge’s ornithologi-cal database and determine whether the same patterns of habitat associations and socioeconomic correlates of bird biodiversity found in other cities (e.g., Strobach et al., 2009) also occur in
Cambridge, with its compactness with respect to population and habitat variation and complex patterns of socioeconomic varia-tion.
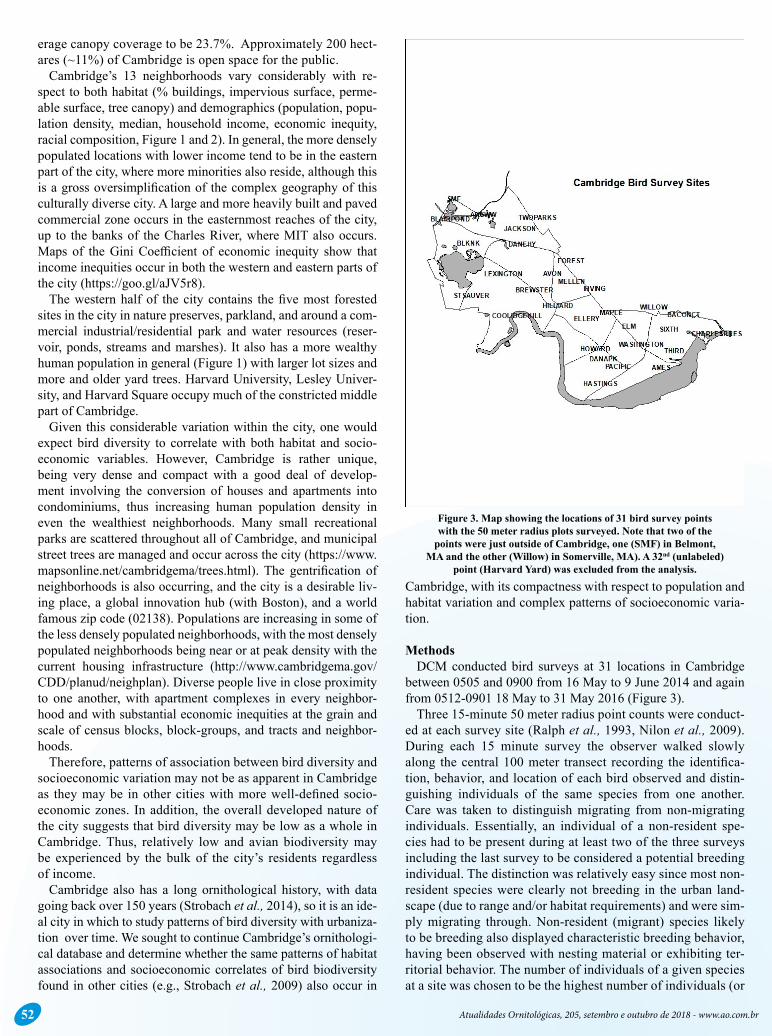
MethodsDCM conducted bird surveys at 31 locations in Cambridge
between 0505 and 0900 from 16 May to 9 June 2014 and again from 0512-0901 18 May to 31 May 2016 (Figure 3).
Three 15-minute 50 meter radius point counts were conduct-ed at each survey site (Ralph et al., 1993, Nilon et al., 2009). During each 15 minute survey the observer walked slowly along the central 100 meter transect recording the identifica-tion, behavior, and location of each bird observed and distin-guishing individuals of the same species from one another. Care was taken to distinguish migrating from non-migrating individuals. Essentially, an individual of a non-resident spe-cies had to be present during at least two of the three surveys including the last survey to be considered a potential breeding individual. The distinction was relatively easy since most non-resident species were clearly not breeding in the urban land-scape (due to range and/or habitat requirements) and were sim-ply migrating through. Non-resident (migrant) species likely to be breeding also displayed characteristic breeding behavior, having been observed with nesting material or exhibiting ter-ritorial behavior. The number of individuals of a given species at a site was chosen to be the highest number of individuals (or
Figure 3. Map showing the locations of 31 bird survey points with the 50 meter radius plots surveyed. Note that two of the
points were just outside of Cambridge, one (SMF) in Belmont, MA and the other (Willow) in Somerville, MA). A 32nd (unlabeled)
point (Harvard Yard) was excluded from the analysis.
Atualidades Ornitológicas, 205, setembro e outubro de 2018 - www.ao.com.br 53
pairs) recorded for that species at the site among the three sur-veys. House Sparrow numbers were the most difficult to deter-mine due to their high mobility, group nature, and ventriloqual sounds reflecting off structures. The surveys do not represent cases of confirmed breeding within a given 100 meter diam-eter survey circle, although we are confident that this is indeed the case, except for species such as Chimney Swifts (Chaetura pelagica) which occurred at virtually every survey point but were not counted, American Crows (Corvus brachyrhynchos), and Blue Jays (Cyanocitta cristata) which range more widely. Over-flying species such as sea gulls, cormorants, herons, and hawks were not included in the analyses unless breeding in a particular location was confirmed.
For each survey location we calculated the total number of species and individuals, the total number of breeding species and individuals, and the total number of migrating birds. We further broke down the breeding birds into the total number of breeding resident and breeding migrant spe-cies and individuals, as well as the total number of House Sparrows.
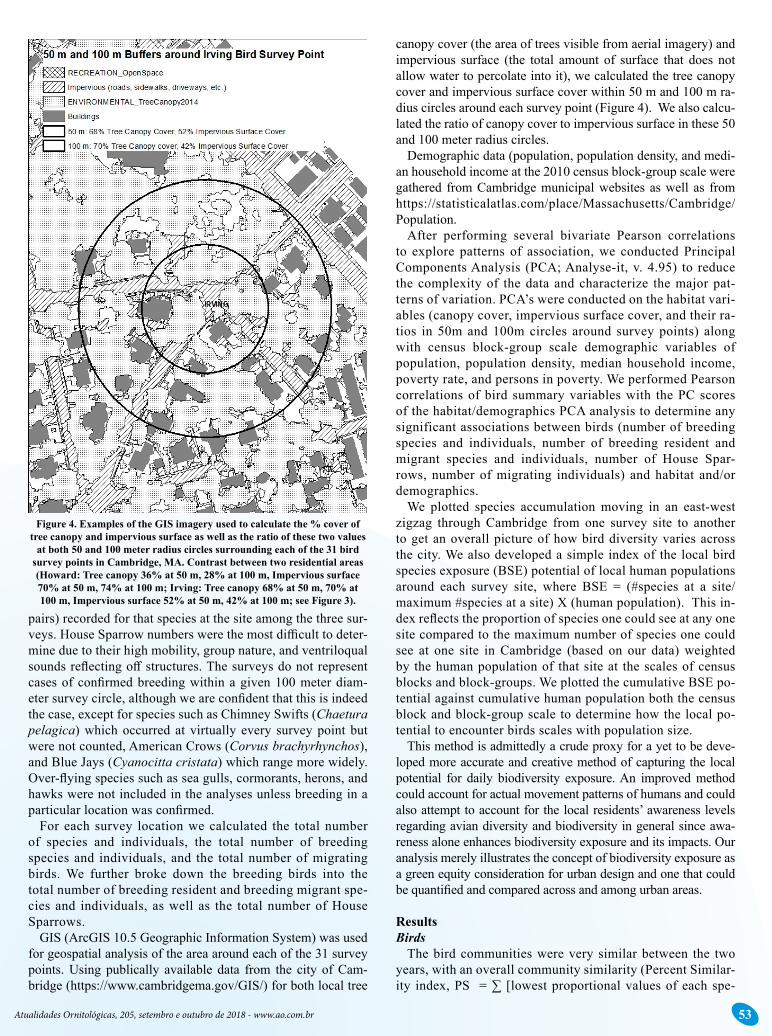
GIS (ArcGIS 10.5 Geographic Information System) was used for geospatial analysis of the area around each of the 31 survey points. Using publically available data from the city of Cam-bridge (https://www.cambridgema.gov/GIS/) for both local tree
canopy cover (the area of trees visible from aerial imagery) and impervious surface (the total amount of surface that does not allow water to percolate into it), we calculated the tree canopy cover and impervious surface cover within 50 m and 100 m ra-dius circles around each survey point (Figure 4). We also calcu-lated the ratio of canopy cover to impervious surface in these 50 and 100 meter radius circles.
Demographic data (population, population density, and medi-an household income at the 2010 census block-group scale were gathered from Cambridge municipal websites as well as from https://statisticalatlas.com/place/Massachusetts/Cambridge/Population.
After performing several bivariate Pearson correlations to explore patterns of association, we conducted Principal Components Analysis (PCA; Analyse-it, v. 4.95) to reduce the complexity of the data and characterize the major pat-terns of variation. PCA’s were conducted on the habitat vari-ables (canopy cover, impervious surface cover, and their ra-tios in 50m and 100m circles around survey points) along with census block-group scale demographic variables of population, population density, median household income, poverty rate, and persons in poverty. We performed Pearson correlations of bird summary variables with the PC scores of the habitat/demographics PCA analysis to determine any significant associations between birds (number of breeding species and individuals, number of breeding resident and migrant species and individuals, number of House Spar-rows, number of migrating individuals) and habitat and/or demographics.
We plotted species accumulation moving in an east-west zigzag through Cambridge from one survey site to another to get an overall picture of how bird diversity varies across the city. We also developed a simple index of the local bird species exposure (BSE) potential of local human populations around each survey site, where BSE = (#species at a site/maximum #species at a site) X (human population). This in-dex reflects the proportion of species one could see at any one site compared to the maximum number of species one could see at one site in Cambridge (based on our data) weighted by the human population of that site at the scales of census blocks and block-groups. We plotted the cumulative BSE po-tential against cumulative human population both the census block and block-group scale to determine how the local po-tential to encounter birds scales with population size.
This method is admittedly a crude proxy for a yet to be deve-loped more accurate and creative method of capturing the local potential for daily biodiversity exposure. An improved method could account for actual movement patterns of humans and could also attempt to account for the local residents’ awareness levels regarding avian diversity and biodiversity in general since awa-reness alone enhances biodiversity exposure and its impacts. Our analysis merely illustrates the concept of biodiversity exposure as a green equity consideration for urban design and one that could be quantified and compared across and among urban areas.
ResultsBirds
The bird communities were very similar between the two years, with an overall community similarity (Percent Similar-ity index, PS = ∑ [lowest proportional values of each spe-
Figure 4. Examples of the GIS imagery used to calculate the % cover of tree canopy and impervious surface as well as the ratio of these two values
at both 50 and 100 meter radius circles surrounding each of the 31 bird survey points in Cambridge, MA. Contrast between two residential areas (Howard: Tree canopy 36% at 50 m, 28% at 100 m, Impervious surface 70% at 50 m, 74% at 100 m; Irving: Tree canopy 68% at 50 m, 70% at 100 m, Impervious surface 52% at 50 m, 42% at 100 m; see Figure 3).
Atualidades Ornitológicas, 205, setembro e outubro de 2018 - www.ao.com.br54
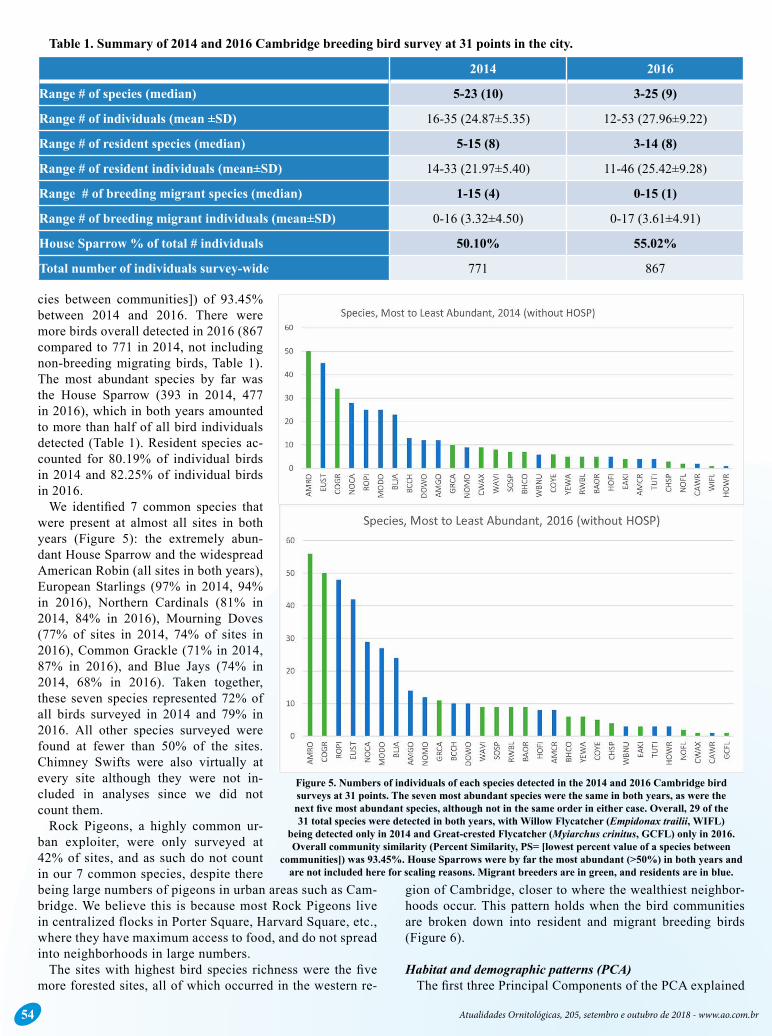
cies between communities]) of 93.45% between 2014 and 2016. There were more birds overall detected in 2016 (867 compared to 771 in 2014, not including non-breeding migrating birds, Table 1). The most abundant species by far was the House Sparrow (393 in 2014, 477 in 2016), which in both years amounted to more than half of all bird individuals detected (Table 1). Resident species ac-counted for 80.19% of individual birds in 2014 and 82.25% of individual birds in 2016.
We identified 7 common species that were present at almost all sites in both years (Figure 5): the extremely abun-dant House Sparrow and the widespread American Robin (all sites in both years), European Starlings (97% in 2014, 94% in 2016), Northern Cardinals (81% in 2014, 84% in 2016), Mourning Doves (77% of sites in 2014, 74% of sites in 2016), Common Grackle (71% in 2014, 87% in 2016), and Blue Jays (74% in 2014, 68% in 2016). Taken together, these seven species represented 72% of all birds surveyed in 2014 and 79% in 2016. All other species surveyed were found at fewer than 50% of the sites. Chimney Swifts were also virtually at every site although they were not in-cluded in analyses since we did not count them.
Rock Pigeons, a highly common ur-ban exploiter, were only surveyed at 42% of sites, and as such do not count in our 7 common species, despite there being large numbers of pigeons in urban areas such as Cam-bridge. We believe this is because most Rock Pigeons live in centralized flocks in Porter Square, Harvard Square, etc., where they have maximum access to food, and do not spread into neighborhoods in large numbers.
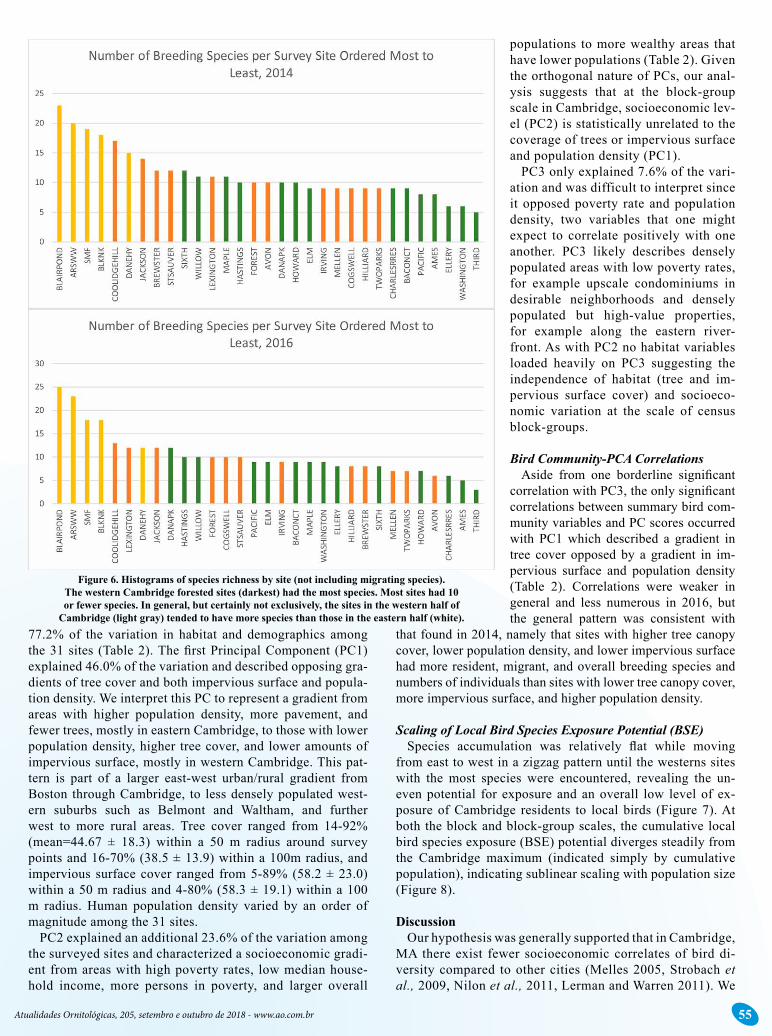
The sites with highest bird species richness were the five more forested sites, all of which occurred in the western re-
gion of Cambridge, closer to where the wealthiest neighbor-hoods occur. This pattern holds when the bird communities are broken down into resident and migrant breeding birds (Figure 6).
Habitat and demographic patterns (PCA)The first three Principal Components of the PCA explained
Table 1. Summary of 2014 and 2016 Cambridge breeding bird survey at 31 points in the city.
2014 2016
Range # of species (median) 5-23 (10) 3-25 (9)
Range # of individuals (mean ±SD) 16-35 (24.87±5.35) 12-53 (27.96±9.22)
Range # of resident species (median) 5-15 (8) 3-14 (8)
Range # of resident individuals (mean±SD) 14-33 (21.97±5.40) 11-46 (25.42±9.28)
Range # of breeding migrant species (median) 1-15 (4) 0-15 (1)
Range # of breeding migrant individuals (mean±SD) 0-16 (3.32±4.50) 0-17 (3.61±4.91)
House Sparrow % of total # individuals 50.10% 55.02%
Total number of individuals survey-wide 771 867
Figure 5. Numbers of individuals of each species detected in the 2014 and 2016 Cambridge bird surveys at 31 points. The seven most abundant species were the same in both years, as were the next five most abundant species, although not in the same order in either case. Overall, 29 of the 31 total species were detected in both years, with Willow Flycatcher (Empidonax trailii, WIFL)
being detected only in 2014 and Great-crested Flycatcher (Myiarchus crinitus, GCFL) only in 2016. Overall community similarity (Percent Similarity, PS= [lowest percent value of a species between
communities]) was 93.45%. House Sparrows were by far the most abundant (>50%) in both years and are not included here for scaling reasons. Migrant breeders are in green, and residents are in blue.
Atualidades Ornitológicas, 205, setembro e outubro de 2018 - www.ao.com.br 55
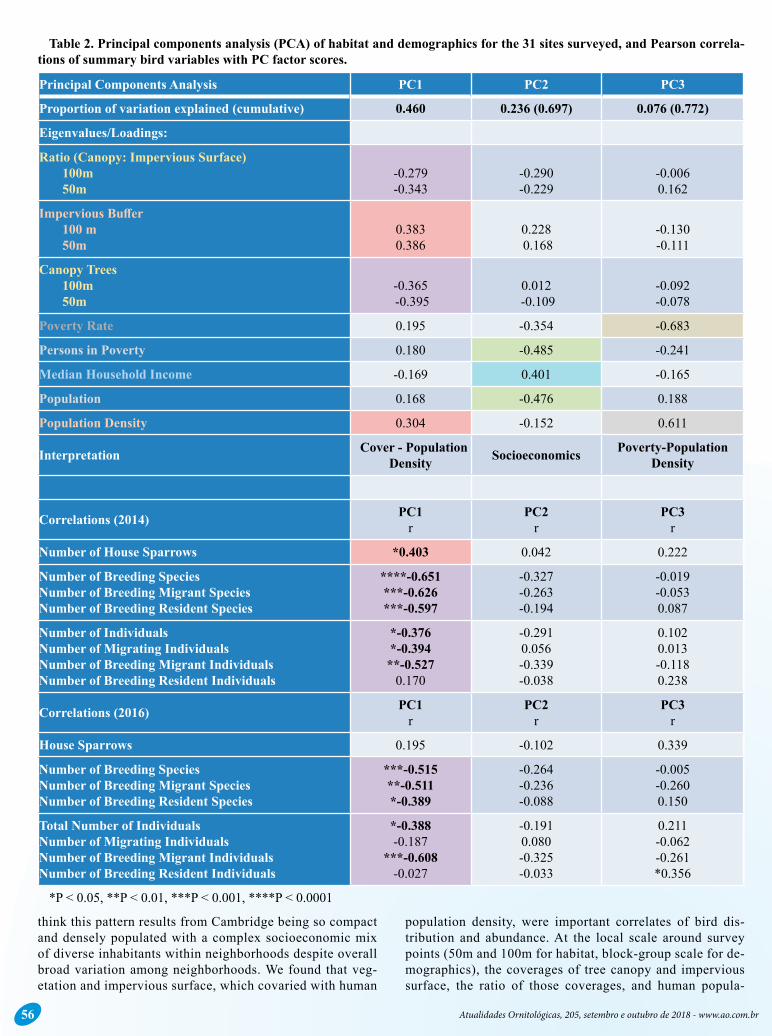
77.2% of the variation in habitat and demographics among the 31 sites (Table 2). The first Principal Component (PC1) explained 46.0% of the variation and described opposing gra-dients of tree cover and both impervious surface and popula-tion density. We interpret this PC to represent a gradient from areas with higher population density, more pavement, and fewer trees, mostly in eastern Cambridge, to those with lower population density, higher tree cover, and lower amounts of impervious surface, mostly in western Cambridge. This pat-tern is part of a larger east-west urban/rural gradient from Boston through Cambridge, to less densely populated west-ern suburbs such as Belmont and Waltham, and further west to more rural areas. Tree cover ranged from 14-92% (mean=44.67 ± 18.3) within a 50 m radius around survey points and 16-70% (38.5 ± 13.9) within a 100m radius, and impervious surface cover ranged from 5-89% (58.2 ± 23.0) within a 50 m radius and 4-80% (58.3 ± 19.1) within a 100 m radius. Human population density varied by an order of magnitude among the 31 sites.
PC2 explained an additional 23.6% of the variation among the surveyed sites and characterized a socioeconomic gradi-ent from areas with high poverty rates, low median house-hold income, more persons in poverty, and larger overall
populations to more wealthy areas that have lower populations (Table 2). Given the orthogonal nature of PCs, our anal-ysis suggests that at the block-group scale in Cambridge, socioeconomic lev-el (PC2) is statistically unrelated to the coverage of trees or impervious surface and population density (PC1).
PC3 only explained 7.6% of the vari-ation and was difficult to interpret since it opposed poverty rate and population density, two variables that one might expect to correlate positively with one another. PC3 likely describes densely populated areas with low poverty rates, for example upscale condominiums in desirable neighborhoods and densely populated but high-value properties, for example along the eastern river-front. As with PC2 no habitat variables loaded heavily on PC3 suggesting the independence of habitat (tree and im-pervious surface cover) and socioeco-nomic variation at the scale of census block-groups.
Bird Community-PCA CorrelationsAside from one borderline significant
correlation with PC3, the only significant correlations between summary bird com-munity variables and PC scores occurred with PC1 which described a gradient in tree cover opposed by a gradient in im-pervious surface and population density (Table 2). Correlations were weaker in general and less numerous in 2016, but the general pattern was consistent with
that found in 2014, namely that sites with higher tree canopy cover, lower population density, and lower impervious surface had more resident, migrant, and overall breeding species and numbers of individuals than sites with lower tree canopy cover, more impervious surface, and higher population density.
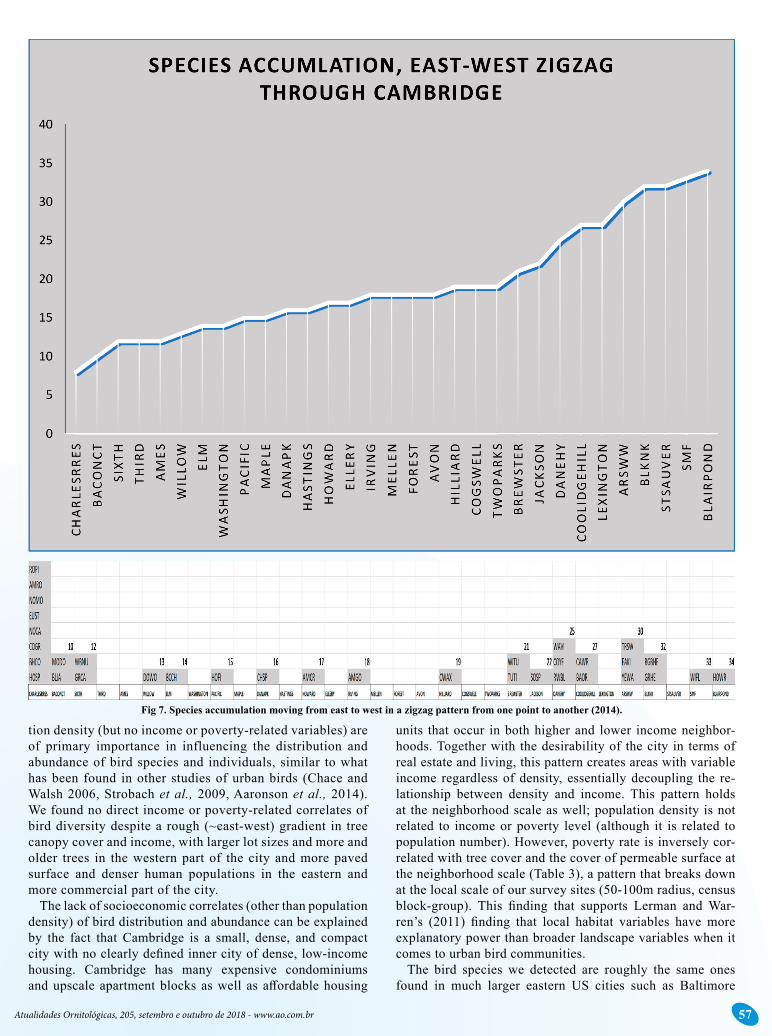
Scaling of Local Bird Species Exposure Potential (BSE)Species accumulation was relatively flat while moving
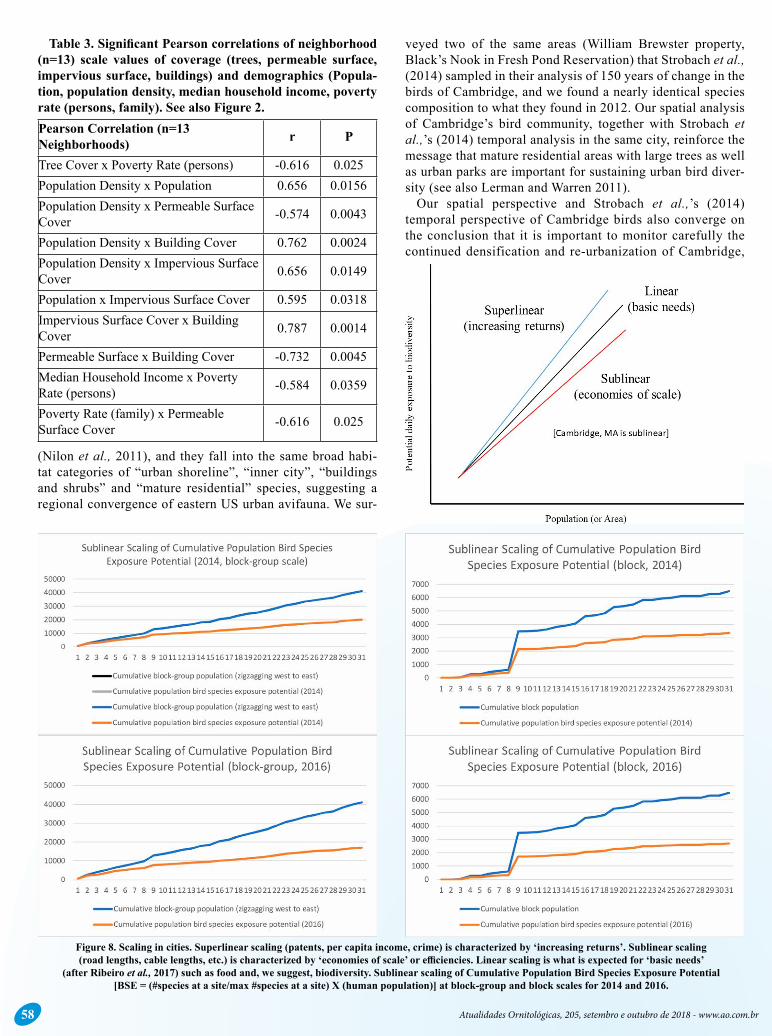
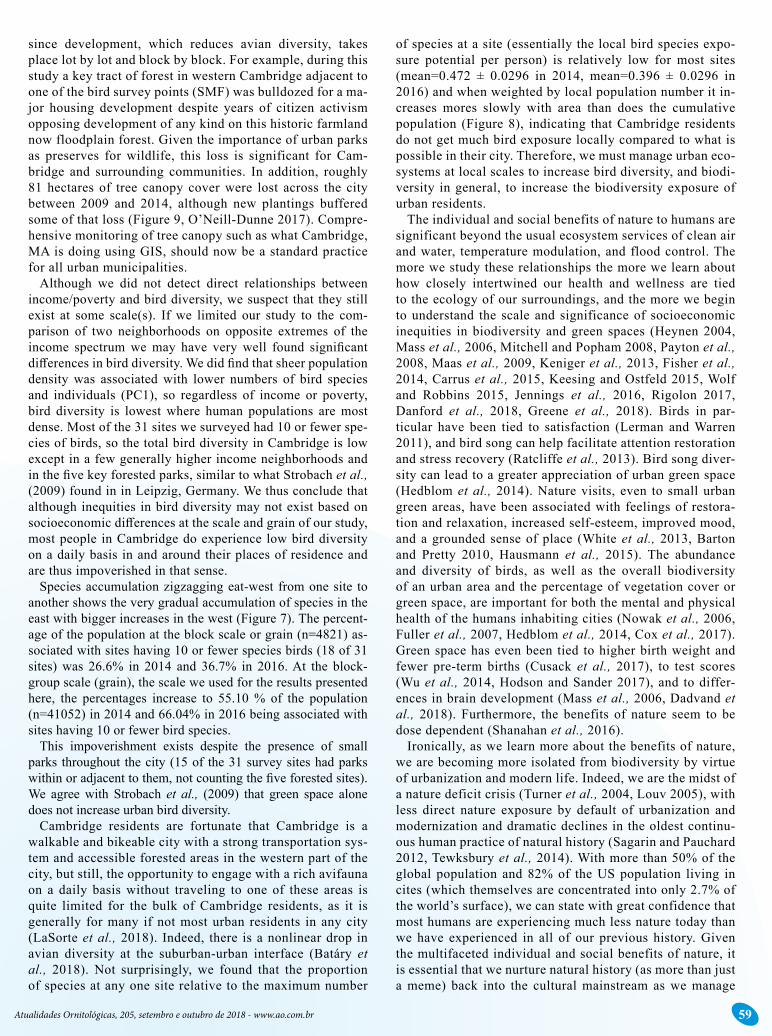
from east to west in a zigzag pattern until the westerns sites with the most species were encountered, revealing the un-even potential for exposure and an overall low level of ex-posure of Cambridge residents to local birds (Figure 7). At both the block and block-group scales, the cumulative local bird species exposure (BSE) potential diverges steadily from the Cambridge maximum (indicated simply by cumulative population), indicating sublinear scaling with population size (Figure 8).
DiscussionOur hypothesis was generally supported that in Cambridge,
MA there exist fewer socioeconomic correlates of bird di-versity compared to other cities (Melles 2005, Strobach et al., 2009, Nilon et al., 2011, Lerman and Warren 2011). We
Figure 6. Histograms of species richness by site (not including migrating species). The western Cambridge forested sites (darkest) had the most species. Most sites had 10 or fewer species. In general, but certainly not exclusively, the sites in the western half of
Cambridge (light gray) tended to have more species than those in the eastern half (white).
Atualidades Ornitológicas, 205, setembro e outubro de 2018 - www.ao.com.br56
think this pattern results from Cambridge being so compact and densely populated with a complex socioeconomic mix of diverse inhabitants within neighborhoods despite overall broad variation among neighborhoods. We found that veg-etation and impervious surface, which covaried with human
population density, were important correlates of bird dis-tribution and abundance. At the local scale around survey points (50m and 100m for habitat, block-group scale for de-mographics), the coverages of tree canopy and impervious surface, the ratio of those coverages, and human popula-
Table 2. Principal components analysis (PCA) of habitat and demographics for the 31 sites surveyed, and Pearson correla-tions of summary bird variables with PC factor scores.
*P < 0.05, **P < 0.01, ***P < 0.001, ****P < 0.0001
Principal Components Analysis PC1 PC2 PC3
Proportion of variation explained (cumulative) 0.460 0.236 (0.697) 0.076 (0.772)
Eigenvalues/Loadings:
Ratio (Canopy: Impervious Surface) 100m 50m
-0.279 -0.343
-0.290-0.229
-0.0060.162
Impervious Buffer 100 m 50m
0.3830.386
0.228 0.168
-0.130-0.111
Canopy Trees 100m 50m
-0.365 -0.395
0.012
-0.109
-0.092-0.078
Poverty Rate 0.195 -0.354 -0.683
Persons in Poverty 0.180 -0.485 -0.241
Median Household Income -0.169 0.401 -0.165
Population 0.168 -0.476 0.188
Population Density 0.304 -0.152 0.611
Interpretation Cover - Population Density Socioeconomics Poverty-Population
Density
Correlations (2014) PC1r
PC2r
PC3r
Number of House Sparrows *0.403 0.042 0.222
Number of Breeding SpeciesNumber of Breeding Migrant SpeciesNumber of Breeding Resident Species
****-0.651***-0.626***-0.597
-0.327-0.263-0.194
-0.019-0.0530.087
Number of IndividualsNumber of Migrating IndividualsNumber of Breeding Migrant IndividualsNumber of Breeding Resident Individuals
*-0.376*-0.394**-0.527
0.170
-0.2910.056-0.339-0.038
0.1020.013-0.1180.238
Correlations (2016) PC1r
PC2r
PC3r
House Sparrows 0.195 -0.102 0.339
Number of Breeding SpeciesNumber of Breeding Migrant SpeciesNumber of Breeding Resident Species
***-0.515**-0.511*-0.389
-0.264-0.236-0.088
-0.005-0.2600.150
Total Number of IndividualsNumber of Migrating IndividualsNumber of Breeding Migrant IndividualsNumber of Breeding Resident Individuals
*-0.388-0.187
***-0.608-0.027
-0.1910.080-0.325-0.033
0.211-0.062-0.261*0.356
Atualidades Ornitológicas, 205, setembro e outubro de 2018 - www.ao.com.br 57
tion density (but no income or poverty-related variables) are of primary importance in influencing the distribution and abundance of bird species and individuals, similar to what has been found in other studies of urban birds (Chace and Walsh 2006, Strobach et al., 2009, Aaronson et al., 2014). We found no direct income or poverty-related correlates of bird diversity despite a rough (~east-west) gradient in tree canopy cover and income, with larger lot sizes and more and older trees in the western part of the city and more paved surface and denser human populations in the eastern and more commercial part of the city.
The lack of socioeconomic correlates (other than population density) of bird distribution and abundance can be explained by the fact that Cambridge is a small, dense, and compact city with no clearly defined inner city of dense, low-income housing. Cambridge has many expensive condominiums and upscale apartment blocks as well as affordable housing
units that occur in both higher and lower income neighbor-hoods. Together with the desirability of the city in terms of real estate and living, this pattern creates areas with variable income regardless of density, essentially decoupling the re-lationship between density and income. This pattern holds at the neighborhood scale as well; population density is not related to income or poverty level (although it is related to population number). However, poverty rate is inversely cor-related with tree cover and the cover of permeable surface at the neighborhood scale (Table 3), a pattern that breaks down at the local scale of our survey sites (50-100m radius, census block-group). This finding that supports Lerman and War-ren’s (2011) finding that local habitat variables have more explanatory power than broader landscape variables when it comes to urban bird communities.
The bird species we detected are roughly the same ones found in much larger eastern US cities such as Baltimore
Fig 7. Species accumulation moving from east to west in a zigzag pattern from one point to another (2014).
Atualidades Ornitológicas, 205, setembro e outubro de 2018 - www.ao.com.br58
(Nilon et al., 2011), and they fall into the same broad habi-tat categories of “urban shoreline”, “inner city”, “buildings and shrubs” and “mature residential” species, suggesting a regional convergence of eastern US urban avifauna. We sur-
veyed two of the same areas (William Brewster property, Black’s Nook in Fresh Pond Reservation) that Strobach et al., (2014) sampled in their analysis of 150 years of change in the birds of Cambridge, and we found a nearly identical species composition to what they found in 2012. Our spatial analysis of Cambridge’s bird community, together with Strobach et al.,’s (2014) temporal analysis in the same city, reinforce the message that mature residential areas with large trees as well as urban parks are important for sustaining urban bird diver-sity (see also Lerman and Warren 2011).
Our spatial perspective and Strobach et al.,’s (2014) temporal perspective of Cambridge birds also converge on the conclusion that it is important to monitor carefully the continued densification and re-urbanization of Cambridge,
Table 3. Significant Pearson correlations of neighborhood (n=13) scale values of coverage (trees, permeable surface, impervious surface, buildings) and demographics (Popula-tion, population density, median household income, poverty rate (persons, family). See also Figure 2.Pearson Correlation (n=13 Neighborhoods) r P
Tree Cover x Poverty Rate (persons) -0.616 0.025Population Density x Population 0.656 0.0156Population Density x Permeable Surface Cover -0.574 0.0043
Population Density x Building Cover 0.762 0.0024Population Density x Impervious Surface Cover 0.656 0.0149
Population x Impervious Surface Cover 0.595 0.0318Impervious Surface Cover x Building Cover 0.787 0.0014
Permeable Surface x Building Cover -0.732 0.0045Median Household Income x Poverty Rate (persons) -0.584 0.0359
Poverty Rate (family) x Permeable Surface Cover -0.616 0.025
Figure 8. Scaling in cities. Superlinear scaling (patents, per capita income, crime) is characterized by ‘increasing returns’. Sublinear scaling (road lengths, cable lengths, etc.) is characterized by ‘economies of scale’ or efficiencies. Linear scaling is what is expected for ‘basic needs’
(after Ribeiro et al., 2017) such as food and, we suggest, biodiversity. Sublinear scaling of Cumulative Population Bird Species Exposure Potential [BSE = (#species at a site/max #species at a site) X (human population)] at block-group and block scales for 2014 and 2016.
Atualidades Ornitológicas, 205, setembro e outubro de 2018 - www.ao.com.br 59
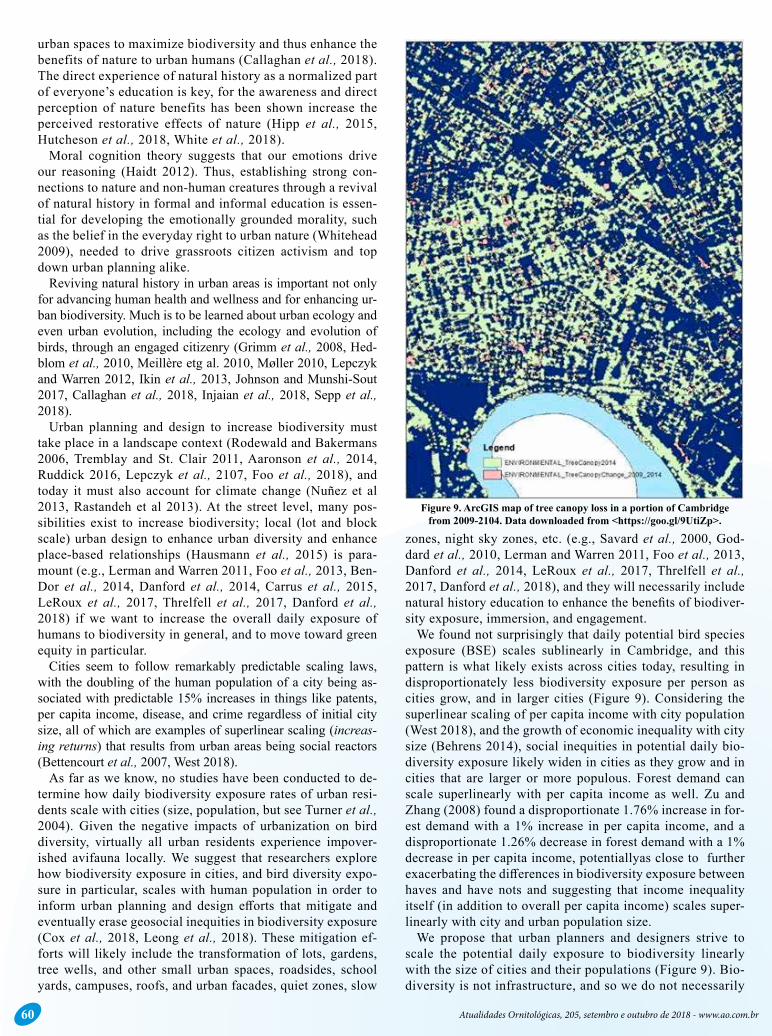
since development, which reduces avian diversity, takes place lot by lot and block by block. For example, during this study a key tract of forest in western Cambridge adjacent to one of the bird survey points (SMF) was bulldozed for a ma-jor housing development despite years of citizen activism opposing development of any kind on this historic farmland now floodplain forest. Given the importance of urban parks as preserves for wildlife, this loss is significant for Cam-bridge and surrounding communities. In addition, roughly 81 hectares of tree canopy cover were lost across the city between 2009 and 2014, although new plantings buffered some of that loss (Figure 9, O’Neill-Dunne 2017). Compre-hensive monitoring of tree canopy such as what Cambridge, MA is doing using GIS, should now be a standard practice for all urban municipalities.
Although we did not detect direct relationships between income/poverty and bird diversity, we suspect that they still exist at some scale(s). If we limited our study to the com-parison of two neighborhoods on opposite extremes of the income spectrum we may have very well found significant differences in bird diversity. We did find that sheer population density was associated with lower numbers of bird species and individuals (PC1), so regardless of income or poverty, bird diversity is lowest where human populations are most dense. Most of the 31 sites we surveyed had 10 or fewer spe-cies of birds, so the total bird diversity in Cambridge is low except in a few generally higher income neighborhoods and in the five key forested parks, similar to what Strobach et al., (2009) found in in Leipzig, Germany. We thus conclude that although inequities in bird diversity may not exist based on socioeconomic differences at the scale and grain of our study, most people in Cambridge do experience low bird diversity on a daily basis in and around their places of residence and are thus impoverished in that sense.
Species accumulation zigzagging eat-west from one site to another shows the very gradual accumulation of species in the east with bigger increases in the west (Figure 7). The percent-age of the population at the block scale or grain (n=4821) as-sociated with sites having 10 or fewer species birds (18 of 31 sites) was 26.6% in 2014 and 36.7% in 2016. At the block-group scale (grain), the scale we used for the results presented here, the percentages increase to 55.10 % of the population (n=41052) in 2014 and 66.04% in 2016 being associated with sites having 10 or fewer bird species.
This impoverishment exists despite the presence of small parks throughout the city (15 of the 31 survey sites had parks within or adjacent to them, not counting the five forested sites). We agree with Strobach et al., (2009) that green space alone does not increase urban bird diversity.
Cambridge residents are fortunate that Cambridge is a walkable and bikeable city with a strong transportation sys-tem and accessible forested areas in the western part of the city, but still, the opportunity to engage with a rich avifauna on a daily basis without traveling to one of these areas is quite limited for the bulk of Cambridge residents, as it is generally for many if not most urban residents in any city (LaSorte et al., 2018). Indeed, there is a nonlinear drop in avian diversity at the suburban-urban interface (Batáry et al., 2018). Not surprisingly, we found that the proportion of species at any one site relative to the maximum number
of species at a site (essentially the local bird species expo-sure potential per person) is relatively low for most sites (mean=0.472 ± 0.0296 in 2014, mean=0.396 ± 0.0296 in 2016) and when weighted by local population number it in-creases mores slowly with area than does the cumulative population (Figure 8), indicating that Cambridge residents do not get much bird exposure locally compared to what is possible in their city. Therefore, we must manage urban eco-systems at local scales to increase bird diversity, and biodi-versity in general, to increase the biodiversity exposure of urban residents.
The individual and social benefits of nature to humans are significant beyond the usual ecosystem services of clean air and water, temperature modulation, and flood control. The more we study these relationships the more we learn about how closely intertwined our health and wellness are tied to the ecology of our surroundings, and the more we begin to understand the scale and significance of socioeconomic inequities in biodiversity and green spaces (Heynen 2004, Mass et al., 2006, Mitchell and Popham 2008, Payton et al., 2008, Maas et al., 2009, Keniger et al., 2013, Fisher et al., 2014, Carrus et al., 2015, Keesing and Ostfeld 2015, Wolf and Robbins 2015, Jennings et al., 2016, Rigolon 2017, Danford et al., 2018, Greene et al., 2018). Birds in par-ticular have been tied to satisfaction (Lerman and Warren 2011), and bird song can help facilitate attention restoration and stress recovery (Ratcliffe et al., 2013). Bird song diver-sity can lead to a greater appreciation of urban green space (Hedblom et al., 2014). Nature visits, even to small urban green areas, have been associated with feelings of restora-tion and relaxation, increased self-esteem, improved mood, and a grounded sense of place (White et al., 2013, Barton and Pretty 2010, Hausmann et al., 2015). The abundance and diversity of birds, as well as the overall biodiversity of an urban area and the percentage of vegetation cover or green space, are important for both the mental and physical health of the humans inhabiting cities (Nowak et al., 2006, Fuller et al., 2007, Hedblom et al., 2014, Cox et al., 2017). Green space has even been tied to higher birth weight and fewer pre-term births (Cusack et al., 2017), to test scores (Wu et al., 2014, Hodson and Sander 2017), and to differ-ences in brain development (Mass et al., 2006, Dadvand et al., 2018). Furthermore, the benefits of nature seem to be dose dependent (Shanahan et al., 2016).
Ironically, as we learn more about the benefits of nature, we are becoming more isolated from biodiversity by virtue of urbanization and modern life. Indeed, we are the midst of a nature deficit crisis (Turner et al., 2004, Louv 2005), with less direct nature exposure by default of urbanization and modernization and dramatic declines in the oldest continu-ous human practice of natural history (Sagarin and Pauchard 2012, Tewksbury et al., 2014). With more than 50% of the global population and 82% of the US population living in cites (which themselves are concentrated into only 2.7% of the world’s surface), we can state with great confidence that most humans are experiencing much less nature today than we have experienced in all of our previous history. Given the multifaceted individual and social benefits of nature, it is essential that we nurture natural history (as more than just a meme) back into the cultural mainstream as we manage
Atualidades Ornitológicas, 205, setembro e outubro de 2018 - www.ao.com.br60
urban spaces to maximize biodiversity and thus enhance the benefits of nature to urban humans (Callaghan et al., 2018). The direct experience of natural history as a normalized part of everyone’s education is key, for the awareness and direct perception of nature benefits has been shown increase the perceived restorative effects of nature (Hipp et al., 2015, Hutcheson et al., 2018, White et al., 2018).
Moral cognition theory suggests that our emotions drive our reasoning (Haidt 2012). Thus, establishing strong con-nections to nature and non-human creatures through a revival of natural history in formal and informal education is essen-tial for developing the emotionally grounded morality, such as the belief in the everyday right to urban nature (Whitehead 2009), needed to drive grassroots citizen activism and top down urban planning alike.
Reviving natural history in urban areas is important not only for advancing human health and wellness and for enhancing ur-ban biodiversity. Much is to be learned about urban ecology and even urban evolution, including the ecology and evolution of birds, through an engaged citizenry (Grimm et al., 2008, Hed-blom et al., 2010, Meillère etg al. 2010, Møller 2010, Lepczyk and Warren 2012, Ikin et al., 2013, Johnson and Munshi-Sout 2017, Callaghan et al., 2018, Injaian et al., 2018, Sepp et al., 2018).
Urban planning and design to increase biodiversity must take place in a landscape context (Rodewald and Bakermans 2006, Tremblay and St. Clair 2011, Aaronson et al., 2014, Ruddick 2016, Lepczyk et al., 2107, Foo et al., 2018), and today it must also account for climate change (Nuñez et al 2013, Rastandeh et al 2013). At the street level, many pos-sibilities exist to increase biodiversity; local (lot and block scale) urban design to enhance urban diversity and enhance place-based relationships (Hausmann et al., 2015) is para-mount (e.g., Lerman and Warren 2011, Foo et al., 2013, Ben-Dor et al., 2014, Danford et al., 2014, Carrus et al., 2015, LeRoux et al., 2017, Threlfell et al., 2017, Danford et al., 2018) if we want to increase the overall daily exposure of humans to biodiversity in general, and to move toward green equity in particular.
Cities seem to follow remarkably predictable scaling laws, with the doubling of the human population of a city being as-sociated with predictable 15% increases in things like patents, per capita income, disease, and crime regardless of initial city size, all of which are examples of superlinear scaling (increas-ing returns) that results from urban areas being social reactors (Bettencourt et al., 2007, West 2018).
As far as we know, no studies have been conducted to de-termine how daily biodiversity exposure rates of urban resi-dents scale with cities (size, population, but see Turner et al., 2004). Given the negative impacts of urbanization on bird diversity, virtually all urban residents experience impover-ished avifauna locally. We suggest that researchers explore how biodiversity exposure in cities, and bird diversity expo-sure in particular, scales with human population in order to inform urban planning and design efforts that mitigate and eventually erase geosocial inequities in biodiversity exposure (Cox et al., 2018, Leong et al., 2018). These mitigation ef-forts will likely include the transformation of lots, gardens, tree wells, and other small urban spaces, roadsides, school yards, campuses, roofs, and urban facades, quiet zones, slow
zones, night sky zones, etc. (e.g., Savard et al., 2000, God-dard et al., 2010, Lerman and Warren 2011, Foo et al., 2013, Danford et al., 2014, LeRoux et al., 2017, Threlfell et al., 2017, Danford et al., 2018), and they will necessarily include natural history education to enhance the benefits of biodiver-sity exposure, immersion, and engagement.
We found not surprisingly that daily potential bird species exposure (BSE) scales sublinearly in Cambridge, and this pattern is what likely exists across cities today, resulting in disproportionately less biodiversity exposure per person as cities grow, and in larger cities (Figure 9). Considering the superlinear scaling of per capita income with city population (West 2018), and the growth of economic inequality with city size (Behrens 2014), social inequities in potential daily bio-diversity exposure likely widen in cities as they grow and in cities that are larger or more populous. Forest demand can scale superlinearly with per capita income as well. Zu and Zhang (2008) found a disproportionate 1.76% increase in for-est demand with a 1% increase in per capita income, and a disproportionate 1.26% decrease in forest demand with a 1% decrease in per capita income, potentiallyas close to further exacerbating the differences in biodiversity exposure between haves and have nots and suggesting that income inequality itself (in addition to overall per capita income) scales super-linearly with city and urban population size.
We propose that urban planners and designers strive to scale the potential daily exposure to biodiversity linearly with the size of cities and their populations (Figure 9). Bio-diversity is not infrastructure, and so we do not necessarily
Figure 9. ArcGIS map of tree canopy loss in a portion of Cambridge from 2009-2104. Data downloaded from <https://goo.gl/9UtiZp>.
Atualidades Ornitológicas, 205, setembro e outubro de 2018 - www.ao.com.br 61
want it to scale sublinearly as do things like the lengths of roads and cables, similar to the allometric scaling of body mass with economies of scale. Rather, biodiversity is a basic need of every citizen and so must scale at least linearly if not superlinearly with city and population size. The situa-tion is rather analogous to preventing unsustainable over-fishing (analogous to the loss of biodiversity exposure) by decreasing the efficiency of catch methods (e.g., using hand lines instead of nets, analogous to increasing potential daily biodiversity exposure rate per person) so that there is more of a 1:1 ratio of angler to fish caught (and more people get a direct and higher dose of biodiversity). We must no longer be so efficient in transforming the natural landscape as we urbanize.
Cities grow, expand, and even merge into megacities. They are growing faster than human population growth, and most people in the world now live in them (Seto et al., 2012). If we strive for linear scaling of daily biodiversity exposure combined with natural history based education and citizen science programs, we can redesign our cities so that they enhance biodiversity, improve overall population health and wellness, and approach environmental justice around daily urban biodiversity exposure (see Goddard et al., 2010), simi-lar to how our fractal anatomy and physiology allow each of our cells to get enough oxygen to thrive. Given that cities are by nature social reactors and that nature is healthy for people and indeed a basic need and right, a linear scaling of biodiversity immersion could enhance social interactivity and the resultant superlinear scaling of creative output. We can recreate our cities around nature recreation and immer-sion and make biodiversity enhancement and natural history revival the next great accelerated cycles of urban innovation (Bettencourt et al., 2007) that truly sustain growth and help to make cities resilient to collapse.
AcknowledgementsWe would like to thank the City of Cambridge GIS for provid-
ing basemap information, Natalie Susmann for GIS advice, and the Dean’s Office of the College of Liberal Arts and Sciences at Lesley University for student funding.
Literature CitedAronson, M.F.J, F.A. La Sorte, C.H. Nilon, M. Katti, M.A. Goddard, C.A.
Lepczyk, P.S. Warren, N.S.G. Williams, S. Cilliers, B. Clarkson, C. Dobbs, R. Dolan, M. Hedblom, S. Klotz, J. L. Kooijmans, I. Kühn, I. MacGregor-Fors, M. McDonnell, U. Mörtberg, P. Pyšek, S. Siebert, J. Sushinsky, P. Werner & M. Winter (2014) A global analysis of the impacts of urbanization on bird and plant diversity reveals key anthro-pogenic drivers. Proc. Biol. Sci. 281(1780): 20133330. DOI: 10.1098/rspb.2013.3330
Barton, J. & J. Pretty (2010) What is the best dose of nature and green exer-cise for improving mental health? A multi-study analysis. Environmen-tal Science & Technology 44(10): 3947-3955. https://doi.org/10.1021/es903183r
Batáry, P., K. Kurucz, M. Suarez-Rubio & D.E. Chamberlain (2018) Non-linearities in bird responses across urbanization gradients: a meta-anal-ysis. Global Change Biology 24(3): 1046-1054. https://doi.org/10.1111/gcb.13964
Behrens, K. (2014). Do cities widen the gap between rich and poor? World Economic Forum. Available at: <https://www.weforum.org/agen-da/2014/07/cities-urbanization-rich-poor-inequality/>. Accessed on May 21, 2018.
BenDor, T., D.A. Shoemaker, J.C. Thill, M.A. Dorning & R.K. Meentemeyer (2014) A mixed-methods analysis of social-ecological feedbacks between
urbanization and forest persistence. Ecology and Society 19(3): 3. http://dx.doi.org/10.5751/ ES-06508-190303
Bettencourt, L.M.A., J. Lobo, D. Helbing, C. Kühnert & G.B. West (2007) Growth, innovation, scaling, and the pace of life in cities. PNAS 104(17): 7301-7306. https://doi.org/10.1073/pnas.0610172104
Callaghan, C.T., J.M. Martini, R.T. Kingsford & D.M. Brooks (2018) Un-natural history: is a paradigm shift of natural history in 21st century or-nithology needed? Ibis 160: 475-490. https://doi.org/10.1111/ibi.12555
Carrus, G., M. Scopelliti, R. Lafortezza, G. Colangelo, F. Ferrini, F. Sal-bitano, M. Agrimi, L. Portoghesi, P. Semenzato & G. Sanesi (2015) Go greener, feel better? The positive effects of biodiversity on the well-being of individuals visiting urban and peri-urban green ar-eas. Landscape and Urban Planning 134: 221-228. http://dx.doi.org/10.1016/j.landurbplan.2014.10.022
The City of Cambridge (2011) The trees of the city of Cambridge: an analysis of the city’s street and park trees. Available at: <https://www.cambridgema.gov/~/media/Files/publicworksdepartment/For-estry/treeinventoryreport/FinalReport-Cor_02242011.pdf?la=en>. Accessed on: 21 May 2018.
Chace, J.F. & J.J. Walsh (2006) Urban effects on native avifauna: a re-view. Landscape Urban Plan. 74: 46–69. doi:10.1016/j.landurb-plan.2004.08.007
Cox, D.T.C., H.L. Hannah, K.E. Plummer, G.M. Siriwardena, K. Anderson, S. Hancock, P. Devine-Wright & K.J. Gaston (2018) Covariation in urban birds providing cultural services or disservices and people. Ap-plied Ecology 1-12. DOI:10.1111/1365-2664.13146
Cox, D.T.C., D.F. Shanahan, H.L. Hudson, K.E. Plummer, G.M. Siriwarde-na, R.A. Fuller, K. Anderson, S. Hancock & K.J. Gaston (2017) Doses of neighborhood nature: the benefits for mental health of living with na-ture. BioScience 67(2): 147-155. https://doi.org/10.1093/biosci/biw173
Cusack, L., A. Larkin, S.E. Carozza & P. Hysted (2017) Associations be-tween multiple green space measures and birth weight across two US cities. Health & Place 47: 36-43. https://doi.org/10.1016/j.health-place.2017.07.002
Dadvand, P., J. Pujol, D. Macia, G. Martínez-Vilavella, L. Blanco-Hinojo, M. Mortamais, M. Álvarez-Pedrerol, R. Fenoll, M. Esnaola, A. Dal-mau-Bueno, M. López-Vicente, X. Basagaña, M. Jerrett, M. Nieuwen-huijsen & J. Sunyer (2018) The association between lifelong greens-pace exposure and 3-dimensional brain magnetic resonance imaging in Barcelona schoolchildren. Environmental Health Perspectives 126(2): 027012. http://dx.doi.org/10.1289/EHP1876
Danford, R.S., C. Cheng, M.W. Strohbach, R. Ryan, C. Nicolson & P.S. Warren (2014) What does it take to achieve equitable urban tree canopy distribution? A Boston case study. City and the Environ-ment 7(1): 1-20. http://digitalcommons.lmu.edu/cgi/viewcontent.cgi?article=1123&context=cate
Danford, R.S., M.W. Strohbach, P.S. Warren & R. Ryan (2018) Active Greening or Rewilding the city: how does the intention behind small pockets of urban green affect use? Urban Forestry & Urban Green-ing 29:m377-383. DOI10.1016/j.ufug.2017.11.014
Fisher, J.A., G. Patenaude, K. Giri, K. Lewis, P. Meira, P. Pinho, M.D.A. Rounsevell & M. Williams (2014) Understanding the relationships between ecosystem services and poverty alleviation: a conceptual framework. Ecosystem Services 7: 34-45. https://doi.org/10.1016/j.ecoser.2013.08.002
Foo, K., D. Martin, C. Wool & C. Polsky (2013) The production of urban vacant land: relational place-making in Boston, MA neighborhoods. Cities 35: 156-163. https://doi.org/10.1016/j.cities.2013.06.012
Foo, K., J. McCarthy & A. Bebbington (2018) Activating landscape ecolo-gy: a governance framework for design-in-science. Landscape Ecol-ogy 1-15. https://doi.org/10.1007/s10980-018-0630-3
Fuller, R.A., K.N. Irvine, P. Devine-Wright, P.H. Warren & K.J. Gaston (2007) Psychological benefits of greenspace increase with biodiver-sity. Biology Letters 3: 390-394. DOI: 10.1098/rsbl.2007.0149
Goddard, M.A., A.J. Dougill & T.G. Benton (2010) Scaling up from gar-dens: biodiversity conservation in urban environments. Trends in Ecology and Evolution 25(2): 90-8. DOI: 10.1016/j.tree.2009.07.016. Epub 2009 Sep 14.
Greene, C.S., P.J. Robinson & A.A. Millward (2018) Canopy of advantage: who benefits most from city trees? J. Environmental Management 208: 24-35. <https://doi.org/10.1016/j.jenvman.2017.12.015>.
Green Cambridge Tree Canopy Project (2010) Available at: <https://www.greencambridge.org/the-tree-canopy-project.html>. Accessed on 21 May, 2018.
Atualidades Ornitológicas, 205, setembro e outubro de 2018 - www.ao.com.br62
Grimm, N.B., S.H. Faeth, N.E. Golubiewski, C.L. Redman, J. Wu, X Bai & J.M. Briggs (2008) Global change and the ecology of cities. Science 319 (5864): 756-760. doi: 10.1126/science.1150195
Haidt, J. (2012) The Righteous Mind: Why Good People are Divided by Politics and Religion. New York: Pantheon Books.
Hausmann, A., R. Slotow, J.K. Burns & E. Di Minin (2015) The ecosystem service of sense of place: benefits for human well-being and biodi-versity conservation. Environmental Conservation 43 (2): 117-127. <https://doi.org/10.1017/S0376892915000314>.
Hedblom, M., E. Heyman, H. Antonsson & B. Gunnarsson (2014) Bird song diversity influences young people’s appreciation of urban land-scapes. Urban Forestry & Urban Greening 13(3): 469-474. <https://doi.org/10.1016/j.ufug.2014.04.002>.
Hedblom, M. & B. Söderström (2010) Landscape effects on birds in urban woodlands: an analysis of 34 Swedish cities. Journal of Biogeogra-phy 37: 1302-1316. doi:10.1111/j.1365-2699.2010.02299.x
Heynen, N.C. (2003) The scalar production of injustice within the ur-ban forest. Antipode 35 (5): 980-998. <https://doi.org/10.1111/j.1467-8330.2003.00367.x>.
Hipp, J.A., G.B. Gulwadi, S. Alves & S. Sequeira (2015) The relation-ship between perceived greenness and perceived restorative-ness of university campuses and student-reported quality of life. Environment and Behavior 48(10): 1292-1308. <https://doi.org/10.1177/0013916515598>.
Hodson, C.B. & H.A. Sander (2017) Green urban landscapes and school-level academic performance. Landscape and Urban Planning 160: 16-27. <http://dx.doi.org/10.1016/j.landurbplan.2016.11.011>.
Hutcheson, W., P. Hoagland & D. Jin (2018) Valuing environmental education as a cultural ecosystem service at Hudson River Park. Ecosystem Services. Available at: <https://doi.org/10.1016/j.eco-ser.2018.03.005>. Accessed on: 21 May, 2018.
Ikin, K., E. Knight, D.B. Lindenmayer, J. Fischer & A.D. Manning (2013) The influence of native versus exotic streetscape vegetation on the spatial distribution of birds in suburbs and reserves. Diversity and Distributions 19: 294–306. DOI: 10.1111/j.1472-4642.2012.00937.x
Injaian, A.S., C.C. Taff & G.L. Patricelli (2018) Experimental anthropo-genic noise impacts avian parental behaviour, nestling growth and nestling oxidative stress. Animal Behaviour 136: 31-39. https://doi.org/10.1016/j.anbehav.2017.12.003
Jennings, V., L. Larson & J. Yun (2016) Advancing sustainability through urban green space: cultural ecosystem services, equity, and social de-terminants of health. International Journal of Environmental Re-search and Public Health 13: 196-210. doi:10.3390/ijerph13020196
Johnson, M.T.J. & J. Munshi-Sout (2017) Evolution of life in urban en-vironments. Science 358(6363). eaam8327 DOI: 10.1126/science.aam8327
Keesing, F. & R.S. Ostfeld (2015) Is biodiversity good for your health? Science 349 (6245): 235-236. DOI: 10.1126/science.aac7892
Keniger, L.E., K.J. Gaston, K.N. Irvine & R.A. Fuller (2013) What are the benefits of interacting with nature? International Journal of Envi-ronmental Research and Public Health 10: 913-935. doi:10.3390/ijerph1003091
Kühn, S., S. Düzel, P. Eibich, C. Krekel, H. Wüstemann, J. Kolbe, J. Mar-tensson, J. Goebel, J. Gallinat, G.G. Wagner & U. Lindenberger (2017) In search of features that constitute an “enriched environment” in humans: associations between geographical properties and brain structure. Scientific Reports 7: 11920. DOI:10.1038/s41598-017-12046-7
La Sorte, F.A., C.A. Lepczyk, M.F.J. Aronson, M.A. Goddard, M. Hedb-lom, M. Katti, I. MacGregor-Fors, U. Mörtberg, C.H. Nilon, P.S. War-ren, N.S.G. Williams & J. Yang (2018) The phylogenetic and func-tional diversity of regional breeding bird assemblages is reduced and constricted through urbanization. Diversity and Distributions 1-11. DOI: 10.1111/ddi.12738
Leong, M., R.R. Dunn & M.D. Trautwein (2018) Biodiversity and socio-economics in the city: a review of the luxury effect. Biology Letters 14: 20180082. DOI: 10.1098/rsbl.2018.0082
Lepcyzk, C.A., M.F.J. Aronson, K.L. Evans, M.A. Goddard, S.B. Lerman & J.S. MacIvor (2017) Biodiversity in the city: fundamental questions for understanding the ecology of urban green spaces for biodiversity conservation. BioScience 67(9): 799-807. https://doi.org/10.1093/biosci/bix079
Lepczyk, C.A. & P.S. Warren (2012) Urban Bird Ecology and Conserva-tion. Oakland, CA; University of California Press.
Lerman, S.B. & P.S. Warren (2011) The conservation value of residential yards: linking birds and people. Ecological Applications 21(4): 327–1339.
Le Roux, D.S., K. Ikin, D.B. Lindenmayer, A.D. Manning & P. Gibbons (2018) The value of scattered trees for wildlife: contrasting effects of landscape context and tree size. Diversity and Distributions 24: 69–81. DOI: 10.1111/ddi.12658
Louv, R. (2005) Last Child in the Woods: Saving our Children from Na-ture-Deficit Disorder. Chapel Hill, NC: Algonquin Books of Chapel Hill.
Maas, J., S.M. van Dillen, R.A. Verheij & P.P. Groenewegen (2009) So-cial contacts as a possible mechanism behind the relation between green space and health. Health Place 15 (2): 586-95. DOI: 10.1016/j.healthplace.2008.09.006. Epub 2008 Oct 15. DOI:10.1016/j.health-place.2008.09.006
Maas, J., R.A. Verheij, P.P. Groenewegen, S. de Vries & P. Spreeuwen-ber (2006) Green space, urbanity, and health: how strong is the rela-tion? J. Epidemiol. Community Health 60: 587–592. DOI: 10.1136/jech.2005.043125
Meillère, A., F. Brischoux & F. Angelier (2010) Impact of chronic noise exposure on antipredator behavior: an experiment in breeding house sparrows. Behavioral Ecology 26(2): 569-577. DOI: 10.1093/beheco/aru232
Melles, S.J. (2005) Urban bird diversity as an indicator of human social di-versity and economic inequality in Vancouver, British Columbia. Ur-ban Habitats 3(1): 25-48.
Mitchell, R. & F. Popham (2008) Effect of exposure to natural environ-ment on health inequalities: an observational population study. The Lancet 372(9650): 1655 – 1660. <https://doi.org/10.1016/S0140-6736(08)61689-X>.
Møller, A.P. (2010) Interspecific variation in fear responses predicts urban-ization in birds. Behavioral Ecology 21 (2): 365–371. <https://doi.org/10.1093/beheco/arp199>.
Nilon, C.H., P.S. Warren & J. Wolf (2011) Baltimore birdscape study: iden-tifying habitat and land-cover variables for an urban bird-monitoring project. Urban Habitats July 2011. Available at <http://www.urban-habitats.org/v06n01/baltimore_full.html>. Accessed on June 5, 2018.
Nowak, D.J., D.E. Crane & J.C. Stevens (2006) Air pollution removal by urban trees and shrubs in the United States. Urban Forestry & Urban Greening 4(3-4): 115-123. doi:10.1016/j.ufug.2006.01.007
Nuñez, T.A., J.J. Lawler, B.H. McRae, D.J. Pierce, M.B. Krosby, D.M. Ka-vanagh, P.H. Singleton & J.J. Tewksbury (2013) Connectivity planning to address climate change. Conservation Biology 27(2): 407-416. DOI: 10.1111/cobi.12014. Epub 2013 Feb 14.
O’Neill-Dunne, J. (2017) Tree canopy in Cambridge, MA: 2009-2014. Avail-able at: <https://www.cambridgema.gov/~/media/Files/CDD/Climate/treecanopystudy/treecanopychangereportcambridge20092014lowres_processed.pdf?la=en>. Accessed on: June 5, 2018.
Payton, S., G. Lindsey, J. Wilson, J.R. Ottensmann & J. Man (2008) Valuing the benefits of the urban forest: a spatial hedonic approach. Journal of Environmental Planning and Management 51(6): 717–736. DOI: 10.1080/09640560802423509
Ralph, J.C., G.R. Geupel, P. Pyle, T.E. Martin & D.F. DeSante (1993) Hand-book of field methods for monitoring landbirds. Gen. Tech. Rep. PSW-GTR-144-www. Albany, CA: Pacific Southwest Research Station, Forest Service, U.S. Department of Agriculture; 41 pp.
Rastandeh, A. & M. Pedersen Zari (2018) A spatial analysis of land cov-er patterns and its implications for urban avifauna persistence under climate change. Landscape Ecology 33(3): 455–474. <https://doi.org/10.1007/s10980-018-0613-4>.
Ratcliffe, E., B. Gatersleben & P.T. Sowden (2013) Bird sounds and their contributions to perceived attention restoration and stress recovery. Journal of Environmental Psychology 36: 221-228. <https://doi.org/10.1016/j.jenvp.2013.08.004>.
Ribeiro, F.L., J. Meirelles, F.F. Ferreira & C.R. Neto (2017) A model of urban scaling laws based on distance dependent interactions. R. Soc. opensci. 4: 160926. DOI: 10.1098/rsos.160926
Rigolon, A. (2017) Parks and young people: an environmental justice study of park proximity, acreage, and quality in Denver, Colorado. Land-scape and Urban Planning 165: 73-83. DOI10.1016/j.landurb-plan.2017.05.007
Ruddick, M. (2016) Wild by Design: Strategies for Creating Life-Enhanc-ing Landscapes. Washington, DC: Island Press.
Sagarin, R.S. & A. Pauchard (2012) Observation and Ecology: Broadening the Scope of Science to Understand a Complex World. Washington, DC: Island Press.
Atualidades Ornitológicas, 205, setembro e outubro de 2018 - www.ao.com.br 63
Savard, J.-P.L., P. Clergeau & G. Mennechez (2000) Biodiversity concepts and urban ecosystems. Landscape and Urban Planning 48: 131-142.
Sepp, T., K.J. McGraw, A. Kaasik & M. Giraudeau (2018) A review of urban impacts on avian life‐history evolution: does city living lead to slower pace of life? Global Change Biology 24(4): 1452-1469. <https://doi.org/10.1111/gcb.13969>.
Seto, K.C., B. Guneralp & L.R. Hutyra (2012) Global forecasts of urban expansion to 2030 and direct impacts on biodiversity and carbon pools. Proc. Natl. Acad. Sci. USA 109: 16083–16088. DOI:10.1073/pnas.1211658109
Shanahan, D.F., R.A. Bush, K. Gaston & R.A. Fuller (2016) Health ben-efits from nature experiences depend on dose. Scientific Reports 6: 28551. 10.1038/srep28551.
Strohbach, M.W., D. Haase & N. Kabisch (2009) Birds and the city: ur-ban biodiversity, land use, and socioeconomics. Ecology and Society 14(2): 31. <http://www.ecologyandsociety.org/vol14/ iss2/art31/>.
Strohbach, M.W., A. Hrycyna & P.S. Warren (2014) 150 years of changes in bird life in Cambridge, Massachusetts from 1860 to 2012. The Wilson Journal of Ornithology 126(2): 192-206. https://doi.org/10.1676/13-127.1
Tewksbury, J.J., J.G.T. Anderson, J.D. Bakker, T.J. Billo, P.W. Dunwiddie, M.J. Groom, S.E. Hampton, S.G. Herman, D.J. Levey, N.J. Mach-nicki, C. Martínez del Rio, M.E. Power, K. Rowell, A.K. Salomon, L. Stacey, S.C. Trombulak & T.A. Wheeler (2014) Natural history’s place in science and society. BioScience 64: 300-310. https://doi.org/10.1093/biosci/biu032
Threlfall, C.G., L. Mata, J.A. Mackie, A.K. Hahs, N.E. Stork, N.S.G. Williams & S.J. Livesley (2017) Increasing biodiversity in urban green spaces through simple vegetation interventions. Journal of Applied Ecology 54(6): 1874-1883. <https://doi.org/10.1111/1365-2664.12876>.
Tremblay, M.A. & C.C. St. Clair (2011) Permeability of a heterogeneous urban landscape to the movements of forest songbirds. Journal of Ap-plied Ecology 48: 679–688. doi: 10.1111/j.1365-2664.2011.01978.x
Tsao, T.-M., M.–J. Tsai, Y.–N. Wang, H.–L. Lin, C.–F. Wu, J.–S. Whang, S.–H.J. Hsu, H. Chao, K.-J. Chuang, C.–C.K. Chou & T.–C. Su (2014) The health effects of a forest environment on subclinical car-diovascular disease and health-related quality of life. PLOS ONE 9 (7): e103231. https://doi.org/10.1371/journal.pone.0103231
Turner, W.R., T. Nakamura & M. Dinetti (2004) Global urbanization and the separation of humans from nature. BioScience 54: 585-590. <https://doi.org/10.1641/0006-3568(2004)054[0585:GUATSO]2.0.CO;2>.
United Nations Department of Economic and Social Affairs (2014) World Urbanization Prospects - Population Division. (n.d.). Available at: <https://esa.un.org/unpd/wup/>. Accessd on: June 5, 2018.
2010 United States Census Urban and Rural Classification and Urban Area Criteria. (2012 September 01). Available at: <https://www.cen-sus.gov/geo/reference/ua/urban-rural-2010.html>. Accessed on: June 5, 2018.
West, G. (2018) Scale: The Universal Laws of Growth, Innovation, Sus-tainability, and the Pace of Life in Organisms, Cities, Economies, and Companies. New York, NY: Penguin Press.
White, M.P., S. Pahl, K. Ashbullby, S. Herbert & M.H. Depledge (2013) Feelings of restoration from recent nature visits. Journal of Envi-ronmental Psychology 35: 40-51. <https://doi.org/10.1016/j.jen-vp.2013.04.002>.
White, R.L., K. Eberstein & D.M. Scott (2018) Birds in the playground: evaluating the effects of an urban environmental education project in enhancing school children’s awareness, knowledge and attitudes towards local wildlife. PLoSONE 123(3): e0193993. <https://doi.org/10.1371/journal.pone.0193993>.
Whitehead, M. (2009) The wood for trees: ordinary environmental injus-tice and the everyday right to urban nature. International Journal of Urban and Regional Research 33(3): 662-681. DOI:10.1111/j.1468-2427.2009.00862.x
Wolf, K.L. & A.S. Robbins (2015 Metro nature, environmental health, and economic value. Environ. Health Perspect. 123: 390–398. <http://dx.doi.org/10.1289/ehp.1408216>
Wu, C.D., E. McNeely, J.G. Cedeño-Laurent, W.–C. Pan, G. Adamkiewicz, F. Dominici, S.–C.C. Lang, H.–J. Su & J.D. Spengler (2014) Linking student performance in Massachusetts elementary schools with the “greenness” of school surroundings using remote sensing. PLoS ONE 9(10): e108548. <https://doi.org/10.1371/journal.pone.0108548>.
Zhu, P. & Y. Zhang (2008) Demand for urban forests in United States cit-ies. Landscape and Urban Planning 84(3-4): 293-300. <https://doi.org/10.1016/j.landurbplan.2007.09.005>.
1 Natural Science and Mathematics, Lesley University, 1815 Massachusetts Avenue, Cambridge, MA 02138.
*Corresponding author: [email protected]
Appendix. Bird name codes
WITU Wild Turkey
GRHE Green Heron
GBHE Great Blue Heron
ROPI Rock Pigeon
MODO Mourning Dove
DOWO Downy Woodpecker
WIFL Willow Flycatcher
GCFL Great-crested Flycatcher
EAKI Eastern Kingbird
WAVI Warbling Vireo
BLJA Blue Jay
AMCR American Crow
TRSW Tree Swallow
BCCH Black-capped Chickadee
TUTI Tufted Titmouse
WBNU White-breasted Nuthatch
HOWR House Wren
CAWR Carolina Wren
AMRO American Robin
GRCA Gray Catbird
NOMO Northern Mockingbird
EUST European Starling
CWAX Cedar Waxwing
COYE Common Yellowthroat
YEWA Yellow Warbler
CHSP Chipping Sparrow
SOSP Song Sparrow
NOCA Northern Cardinal
RWBL Red-winged Blackbird
COGR Common Grackle
BHCO Brown-headed Cowbird
BAOR Baltimore Oriole
HOFI House Finch
AMGO American Goldfinch
HOSP House Sparrow