Embed Size (px)
Citation preview
Urban Energy Systems Project
Urban Energy Systems – January 20081
Urban Energy Systems Project
The University of Tokyo – Imperial College Joint
Symposium on Innovation in Energy Systems
20 November 2007
Project Objectives
“By 2030 it is estimated that over half the world’s population will be living in cities. So reducing the amount of urban energy wasted is critical in tackling diminishing natural resources and climate change. Our Urban Energy Project at Imperial College London is exploring how cities could be more efficient with their use of power, heating and transport – for example harnessing previously wasted heat from power stations to
Urban Energy Systems – January 20082
transport – for example harnessing previously wasted heat from power stations to heat offices and homes”
bp advertisement, The Times, 8 June 2006
The BP Urban Energy Systems project at Imperial will identify the benefits of a systematic, integrated approach to the design and operation of urban energy systems, in the context of the dynamic evolution of cities.
Project Hypotheses
• Cities are not fully optimised for energy efficiency
• They are suboptimal in primary (conversion) and secondary (end-use service) aspects– Other energy-intensive process systems (e.g. pulp and paper, refineries) have been successively
optimised and integrated with substantial reductions in energy
• Data streams, data mining and optimisation algorithms and computing power are increasingly becoming available to tackle complex problems
• New “hard” and “soft” technologies exist or are emerging that might be relevant to urban
Urban Energy Systems – January 20083
• New “hard” and “soft” technologies exist or are emerging that might be relevant to urban energy systems– The engineering, computing and business skills available at Imperial are ideal to study these
• An integrated, multidisciplinary team will generate new insights• Cities will be amenable to this analytical and business-oriented approach
– They are increasingly believed to have some self-organising characteristics
• But– Cities are evolving, dynamic systems whose behaviour and evolution depend on millions of
autonomous agents; their causalities and links are unclear.
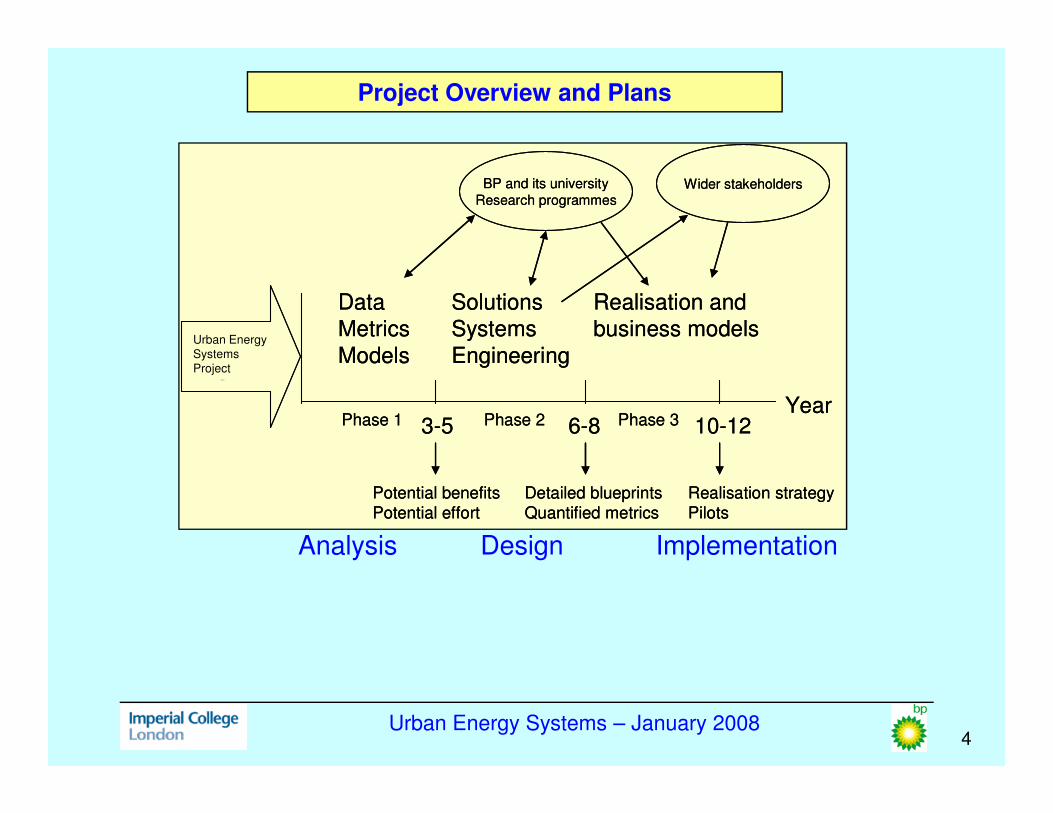
Project Overview and Plans
Data
Metrics
Models
Solutions
Systems
Engineering
Year
Realisation and
business models
BP and its university
Research programmesWider stakeholders
Imperial
Energy
Programme
Data
Metrics
Models
Solutions
Systems
Engineering
Year
Realisation and
business models
BP and its university
Research programmesWider stakeholders
Imperial
Energy
Programme
Urban Energy
Systems
Project
Urban Energy Systems – January 20084
Year3-5 6-8 10-12
Potential benefitsPotential effort
Detailed blueprintsQuantified metrics
Realisation strategyPilots
Phase 1 Phase 2 Phase 3Year
3-5 6-8 10-12
Potential benefitsPotential effort
Detailed blueprintsQuantified metrics
Realisation strategyPilots
Phase 1 Phase 2 Phase 3
Analysis Design Implementation
Phase 1
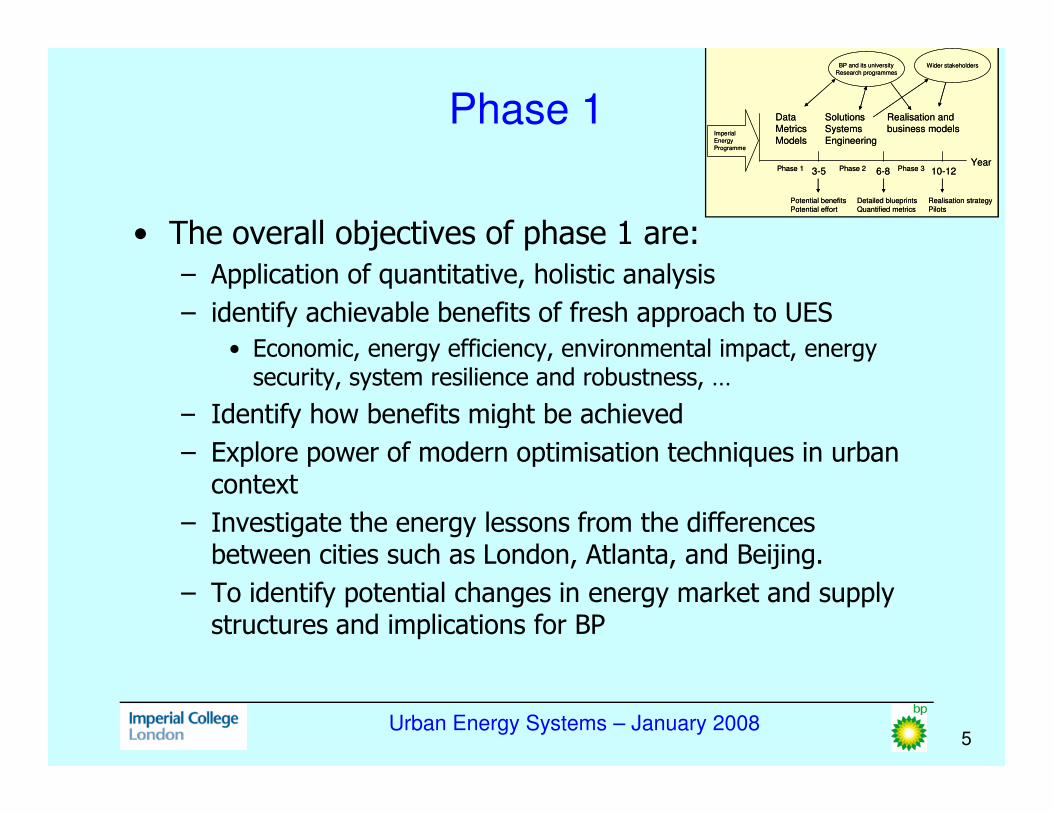
• The overall objectives of phase 1 are:
– Application of quantitative, holistic analysis
– identify achievable benefits of fresh approach to UES
• Economic, energy efficiency, environmental impact, energy security, system resilience and robustness, …
– Identify how benefits might be achieved
Data
Metrics
Models
Solutions
Systems
Engineering
Year3-5 6-8 10-12
Realisation and
business models
BP and its university
Research programmesWider stakeholders
Potential benefits
Potential effort
Detailed blueprints
Quantified metrics
Realisation strategy
Pilots
Imperial
Energy
Programme
Phase 1 Phase 2 Phase 3
Urban Energy Systems – January 20085
– Identify how benefits might be achieved
– Explore power of modern optimisation techniques in urban context
– Investigate the energy lessons from the differences between cities such as London, Atlanta, and Beijing.
– To identify potential changes in energy market and supply structures and implications for BP
Outcomes
• Scenarios and validated models for energy demand evolution and supply innovation for developed and developing cities– Potential solutions – supply innovation and demand management strategies– Early sight of the local and global benefits of novel approaches– Impacts for BP and the energy supply industry
• Quantitative assessment of current and future alternative technology options in an urban context
Urban Energy Systems – January 20086
• New approaches to optimisation in large self-organising systems
• Innovative engineering possibilities for energy conversion, storage and transport
• Blueprints for new approaches to expanding urban energy systems– New business models– Methodologies and tools– Trained personnel
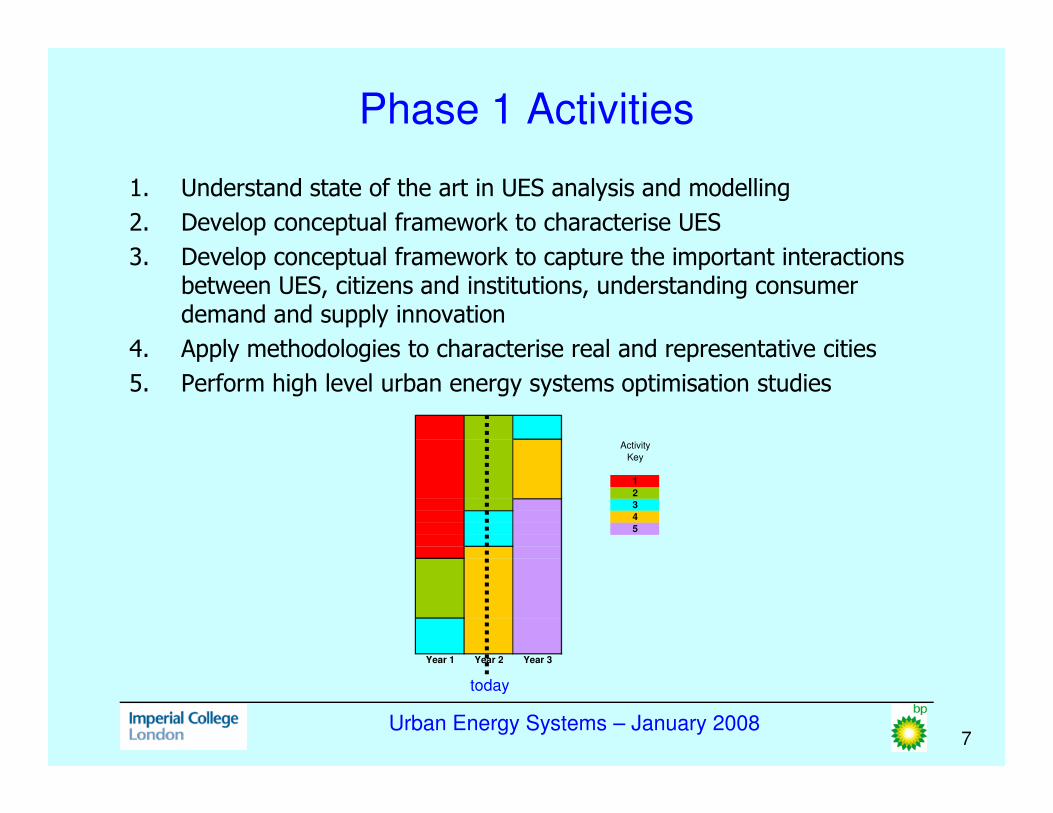
Phase 1 Activities
1. Understand state of the art in UES analysis and modelling
2. Develop conceptual framework to characterise UES
3. Develop conceptual framework to capture the important interactions between UES, citizens and institutions, understanding consumer demand and supply innovation
4. Apply methodologies to characterise real and representative cities
5. Perform high level urban energy systems optimisation studies
Urban Energy Systems – January 20087
Activity
Key
1
2
3
4
5
Year 1 Year 2 Year 3
today
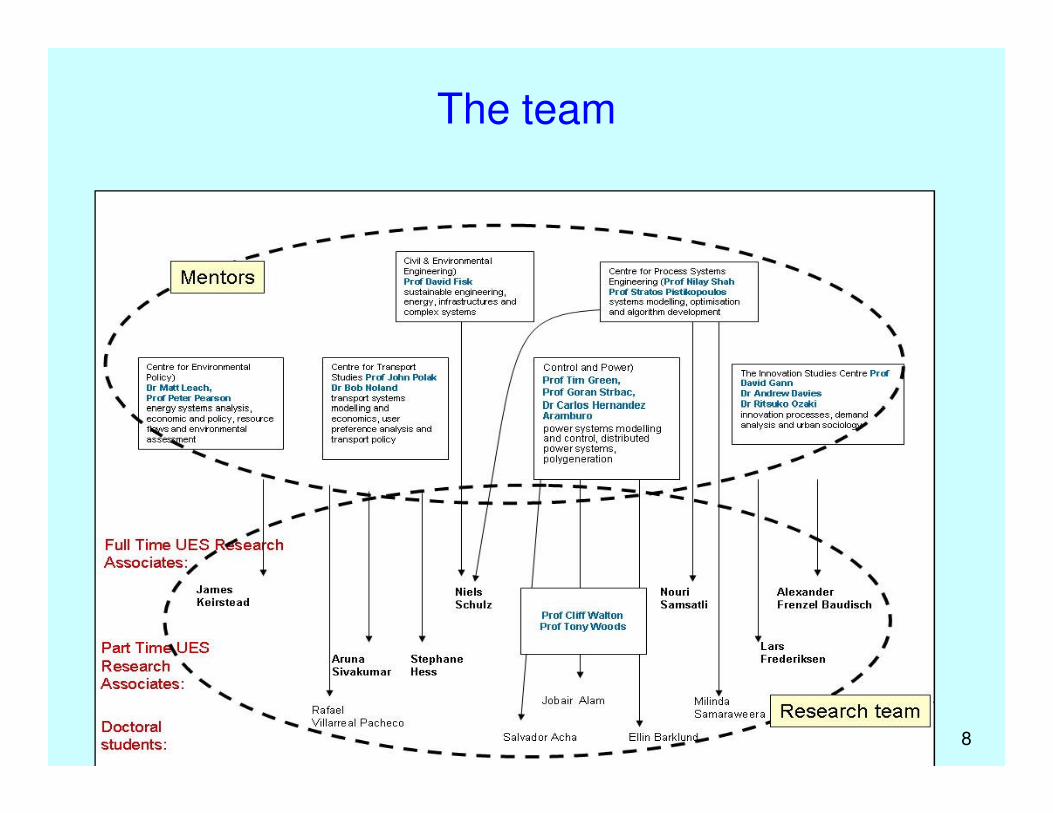
The team
Urban Energy Systems – January 20088
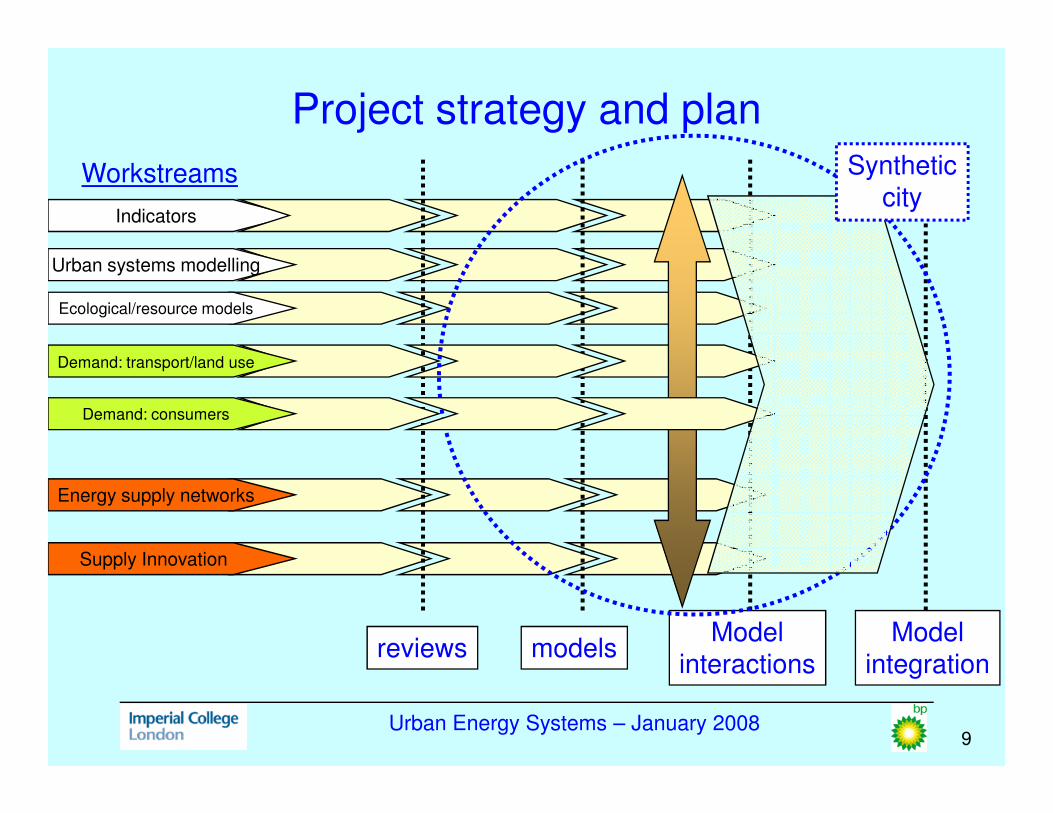
Project strategy and plan
Indicators
Workstreams
Urban systems modelling
Demand: transport/land use
Ecological/resource models
Demand: consumers
Syntheticcity
Urban Energy Systems – January 20089
Energy supply networks
Supply Innovation
reviews modelsModel
interactionsModel
integration
Demand: consumers
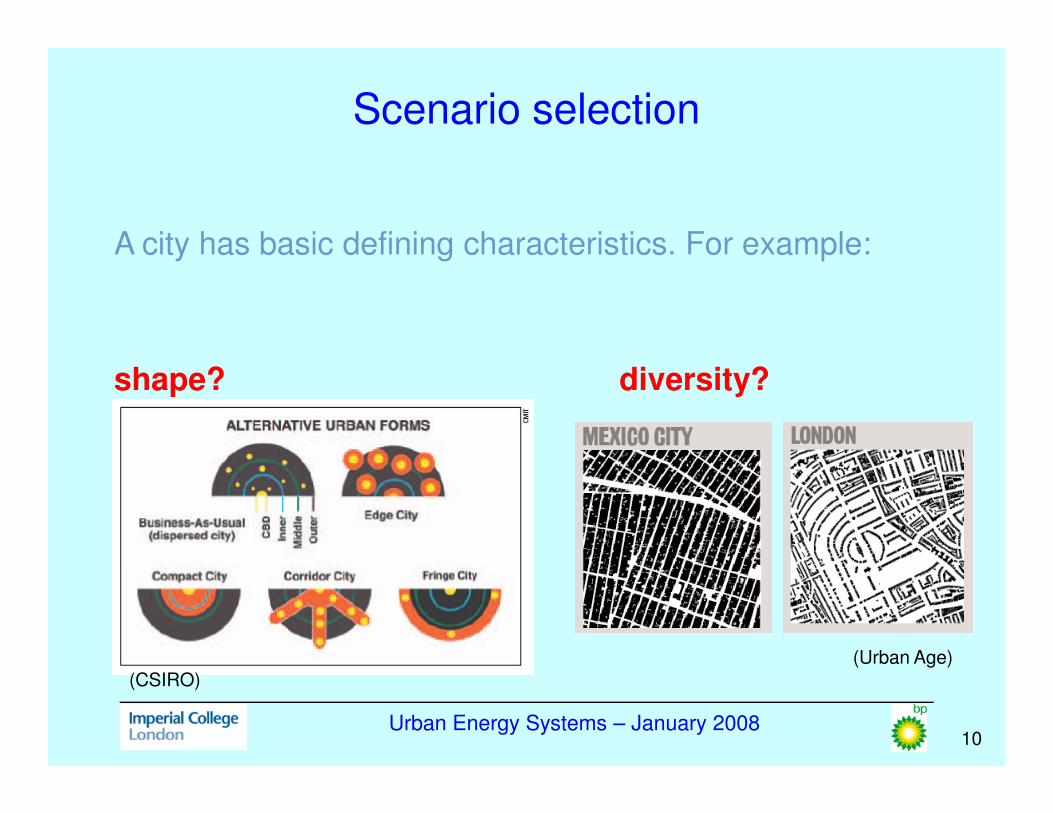
Scenario selection
A city has basic defining characteristics. For example:
shape? diversity?
Urban Energy Systems – January 200810
(CSIRO)
(Urban Age)
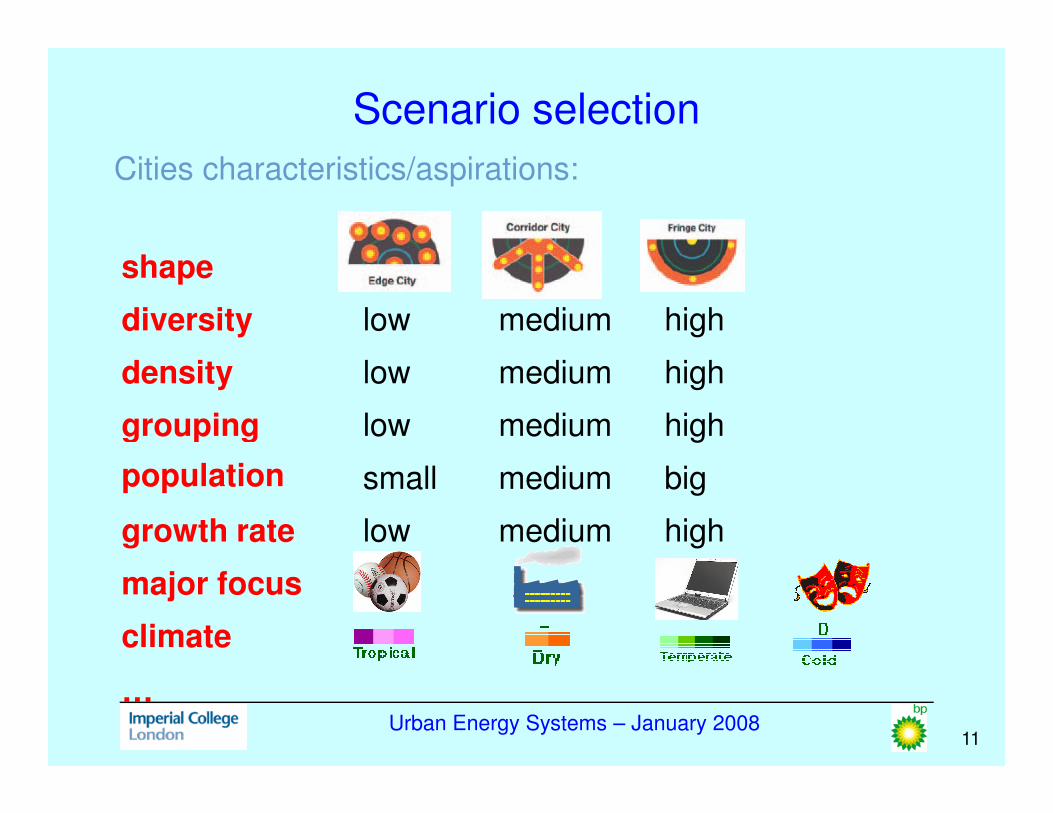
Scenario selection
Cities characteristics/aspirations:
shape
diversity
density
grouping
low medium high
low medium high
Urban Energy Systems – January 200811
grouping
population
growth rate
major focus
climate
…
low medium high
small medium big
low medium high

Hinterland
Linking the city to the hinterland?
Urban Energy Systems – January 200812
City scenario – boundary conditions
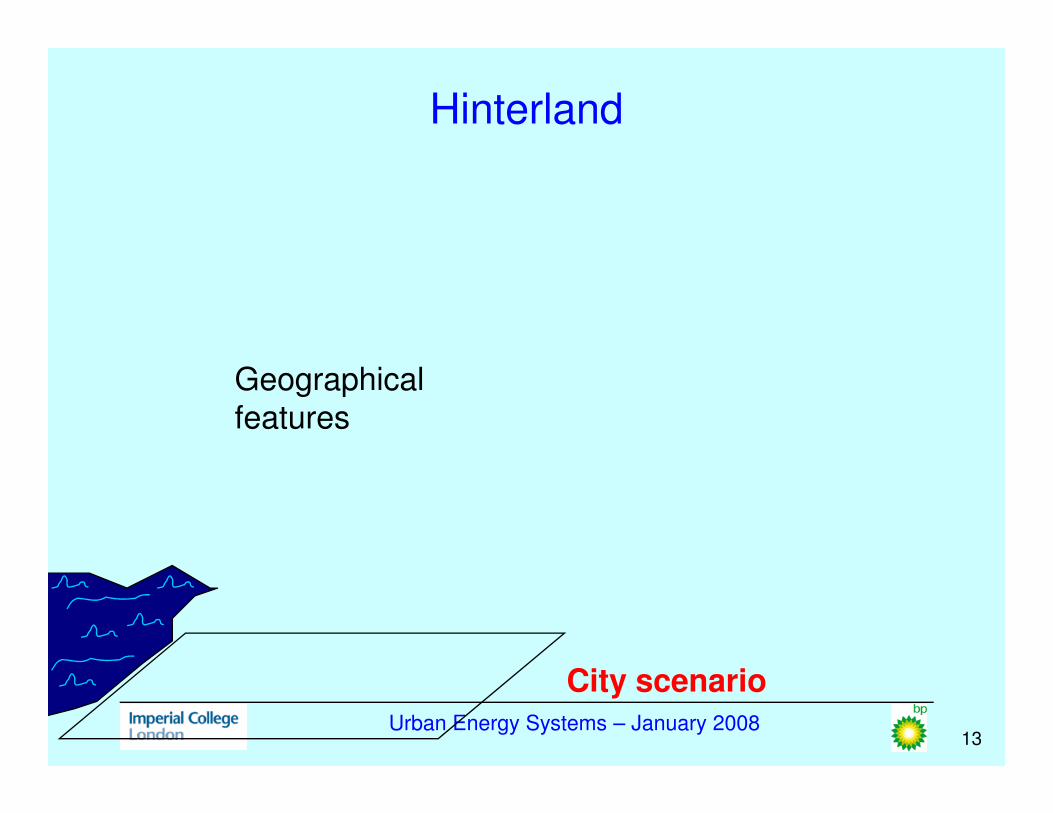
Hinterland
Geographical
features
Urban Energy Systems – January 200813
City scenario
features
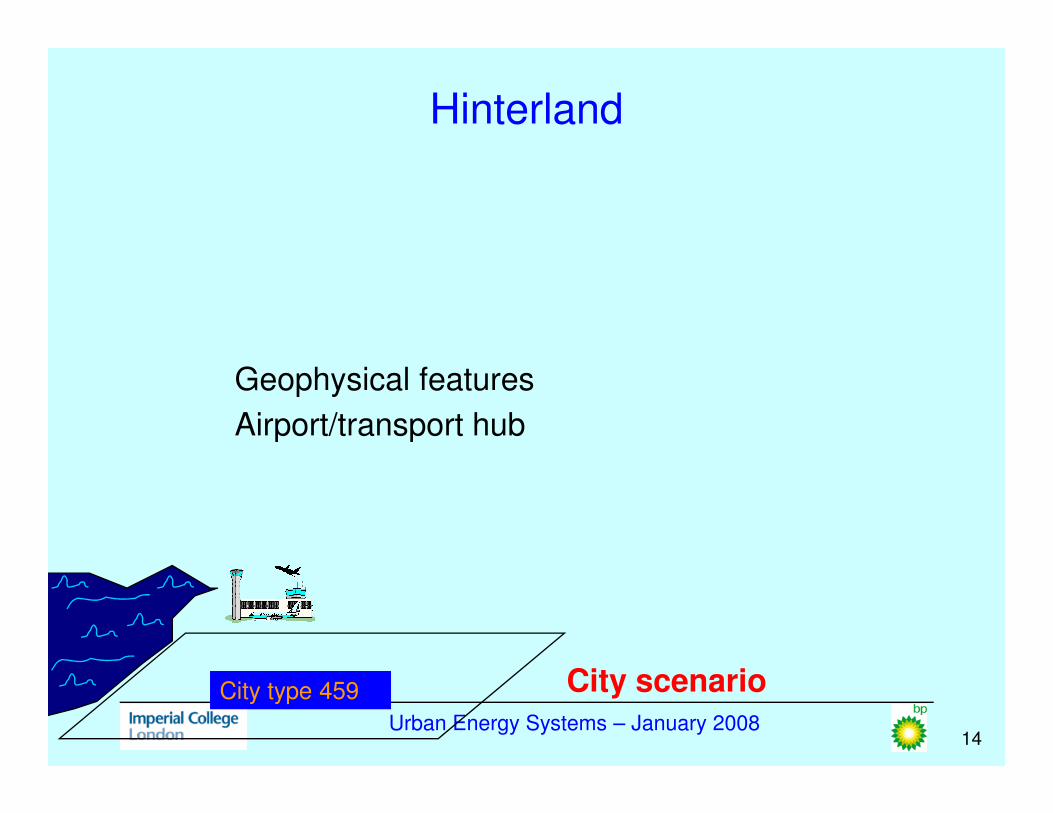
Hinterland
Airport/transport hub
Geophysical features
Urban Energy Systems – January 200814
City type 459 City scenario
Airport/transport hub
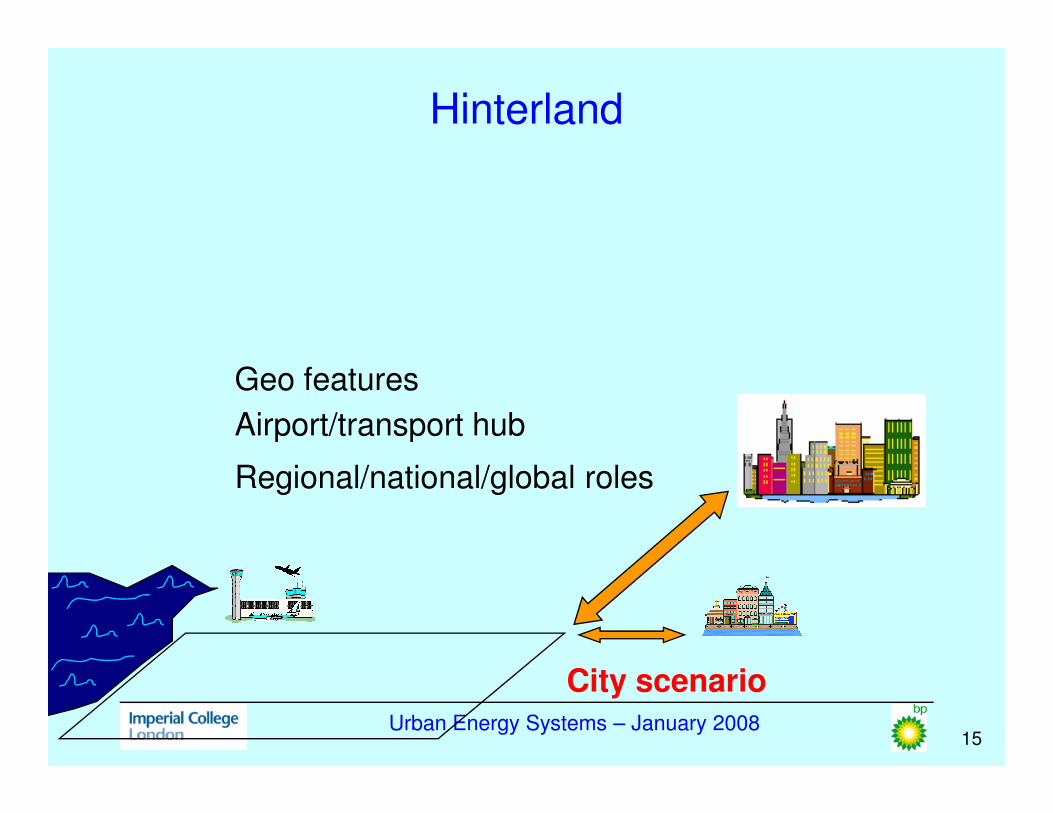
Hinterland
Airport/transport hub
Geo features
Urban Energy Systems – January 200815
City scenario
Airport/transport hub
Regional/national/global roles
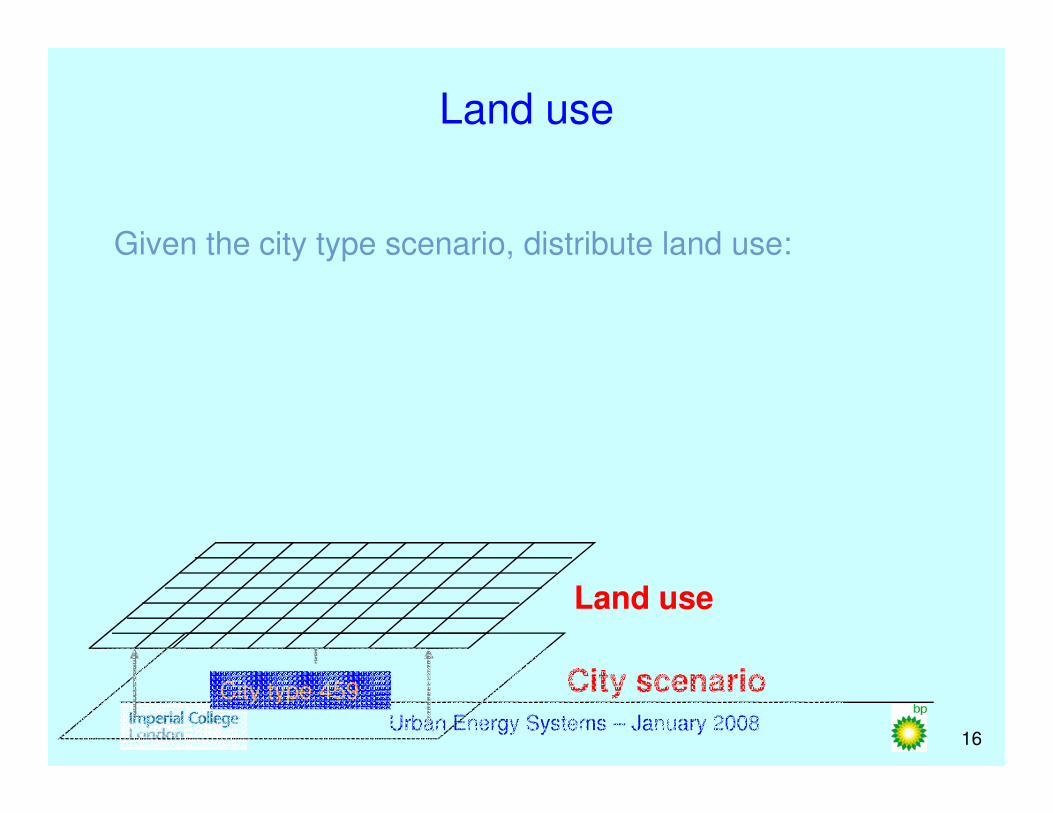
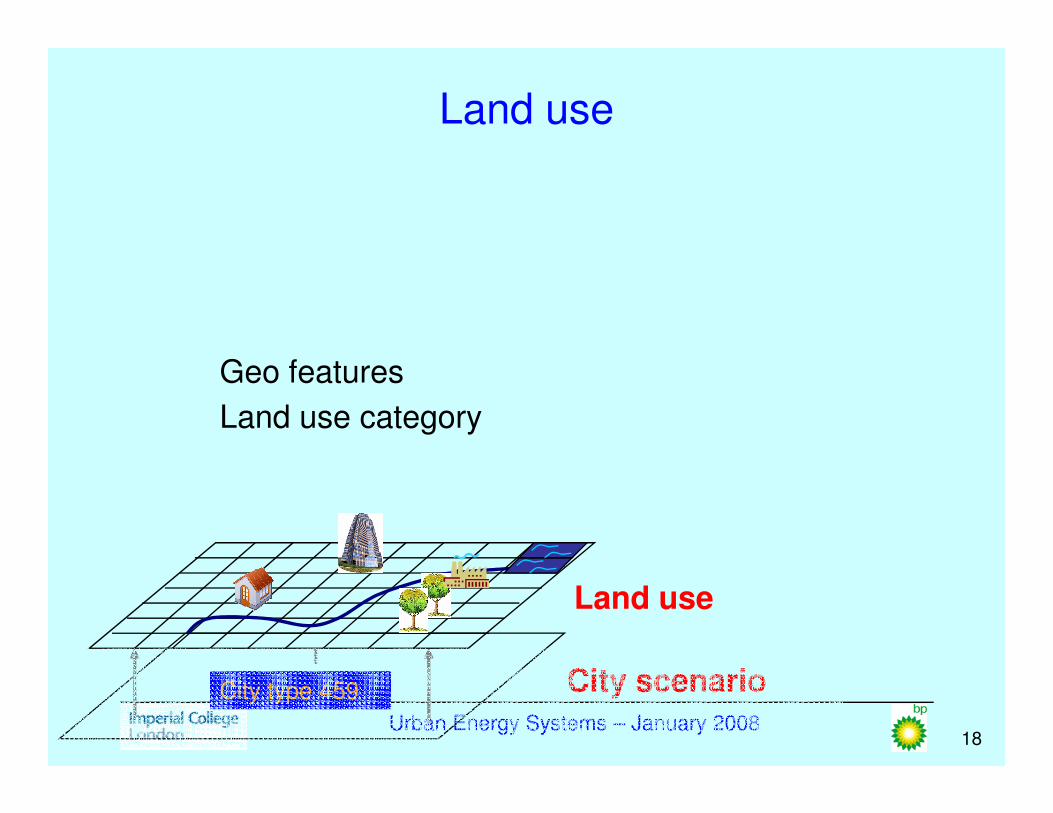
Land use
Given the city type scenario, distribute land use:
Urban Energy Systems – January 200816
City type 459 City scenario
Land use
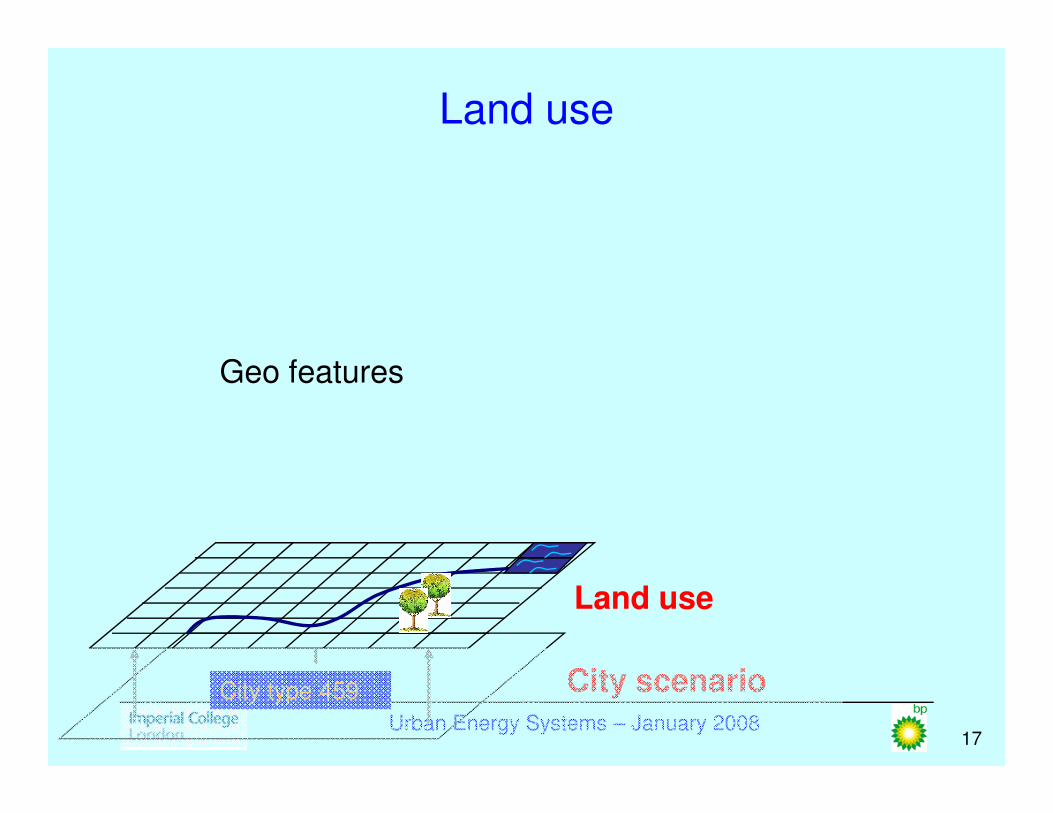
Land use
Geo features
Urban Energy Systems – January 200817
City type 459 City scenario
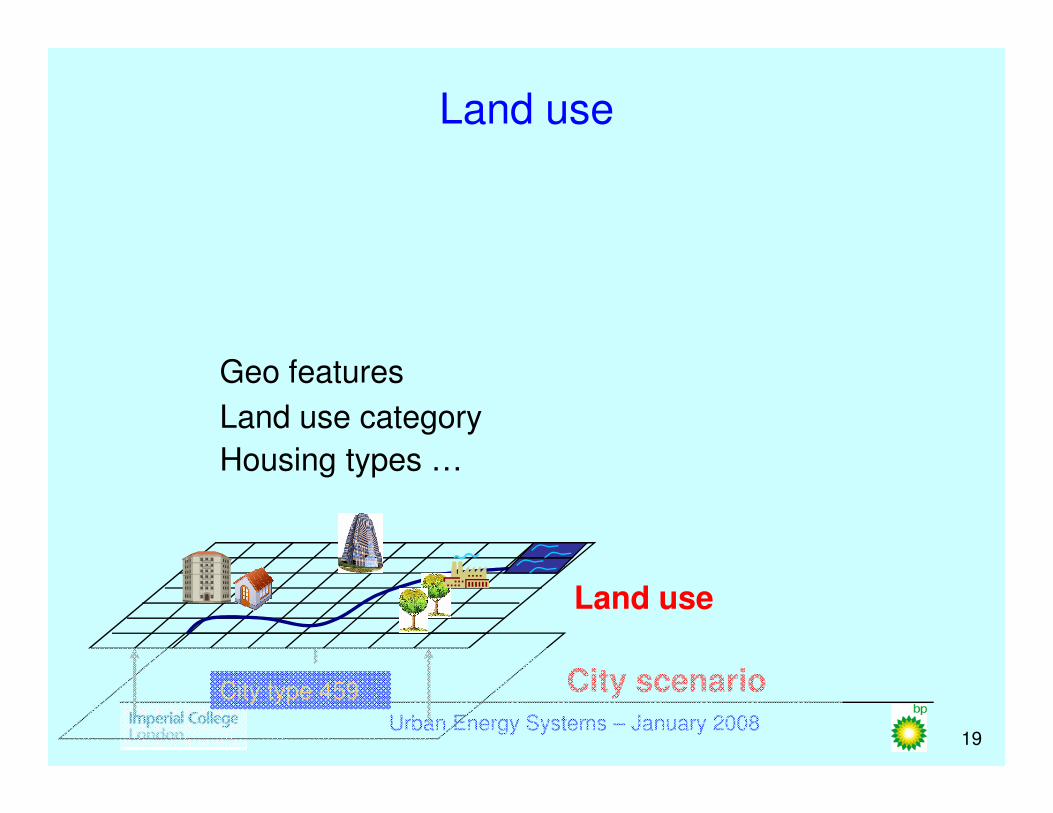
Land use
Land use
Land use category
Geo features
Urban Energy Systems – January 200818
Land use category
City type 459 City scenario
Land use
Land use
Land use category
Geo features
Urban Energy Systems – January 200819
Land use category
City type 459 City scenario
Land use
Housing types …

Agent activities
Given land-use, model agent activities:
Urban Energy Systems – January 200820
City type 459 City scenario
Land use
Agent activities
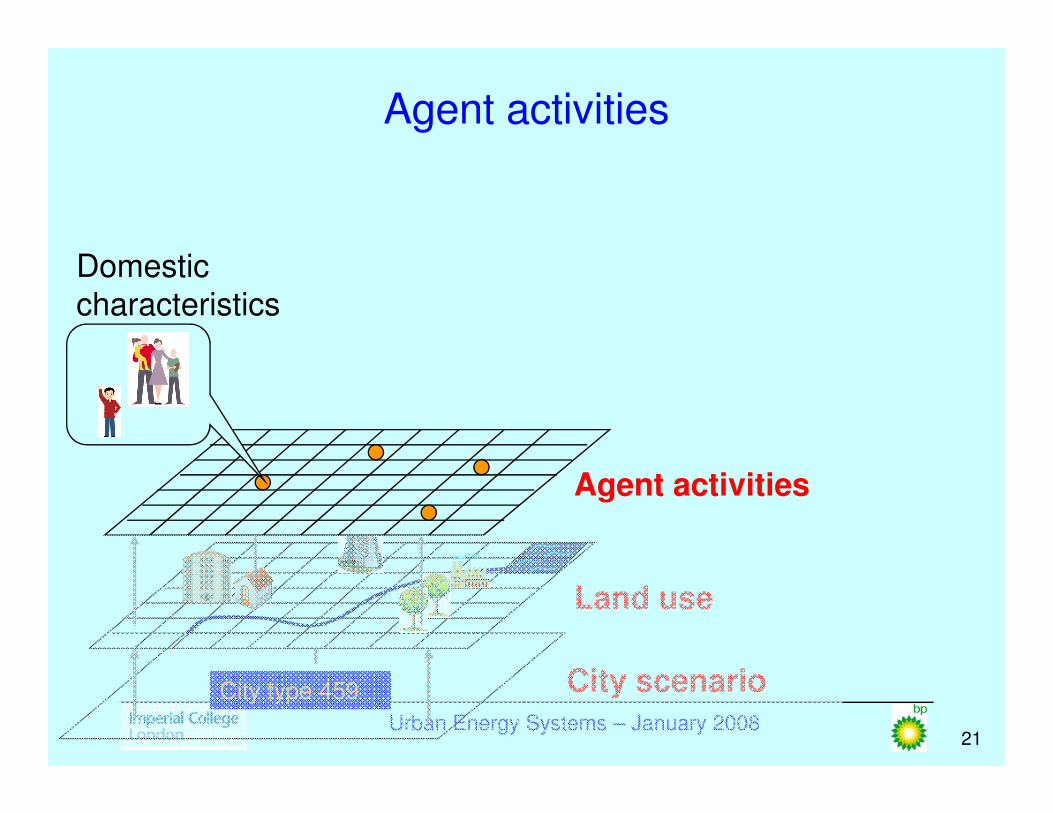
Agent activities
Domestic
characteristics
Urban Energy Systems – January 200821
City type 459 City scenario
Land use
Agent activities
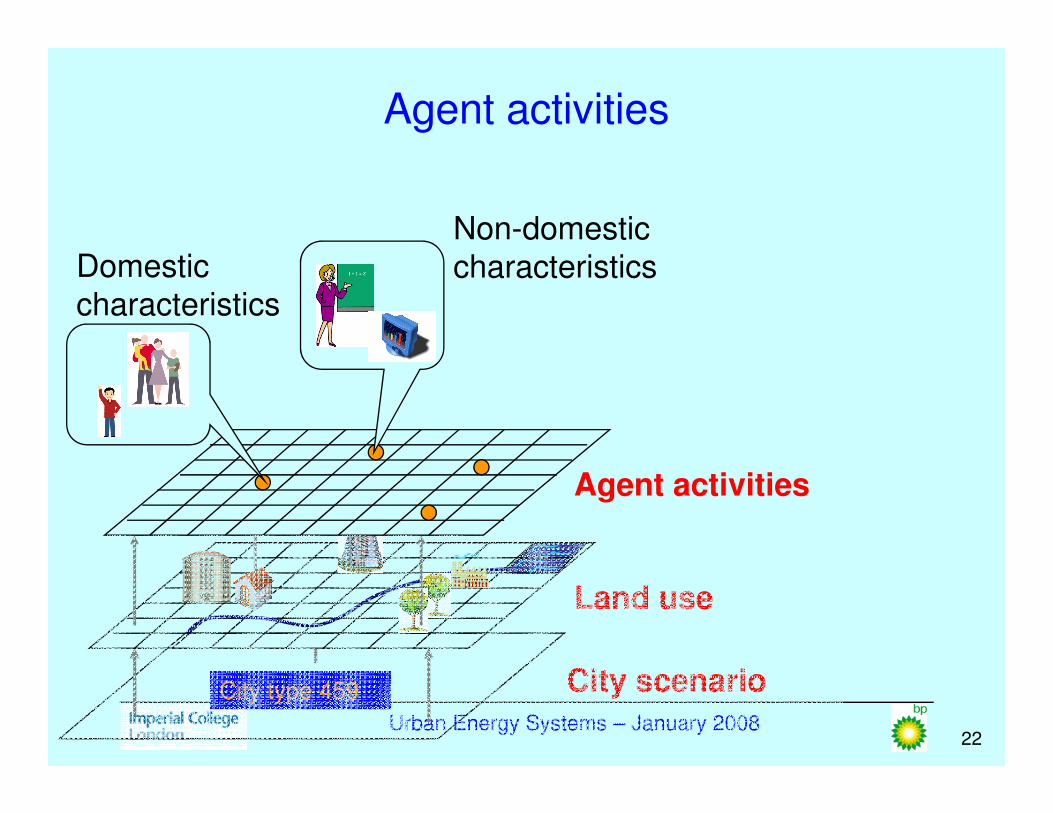
Agent activities
Domestic
characteristics
Non-domestic
characteristics
Urban Energy Systems – January 200822
City type 459 City scenario
Land use
Agent activities
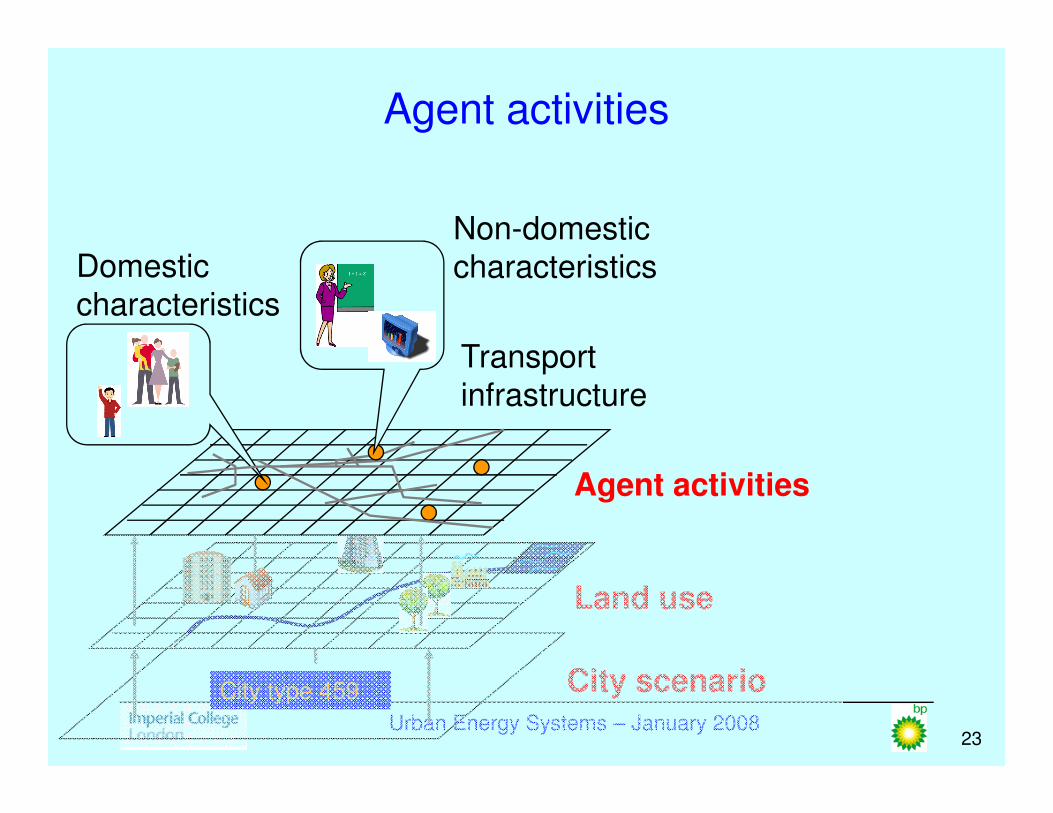
Agent activities
Non-domestic
characteristics Domestic
characteristics
Transport
infrastructure
Urban Energy Systems – January 200823
City type 459 City scenario
Land use
Agent activities
infrastructure
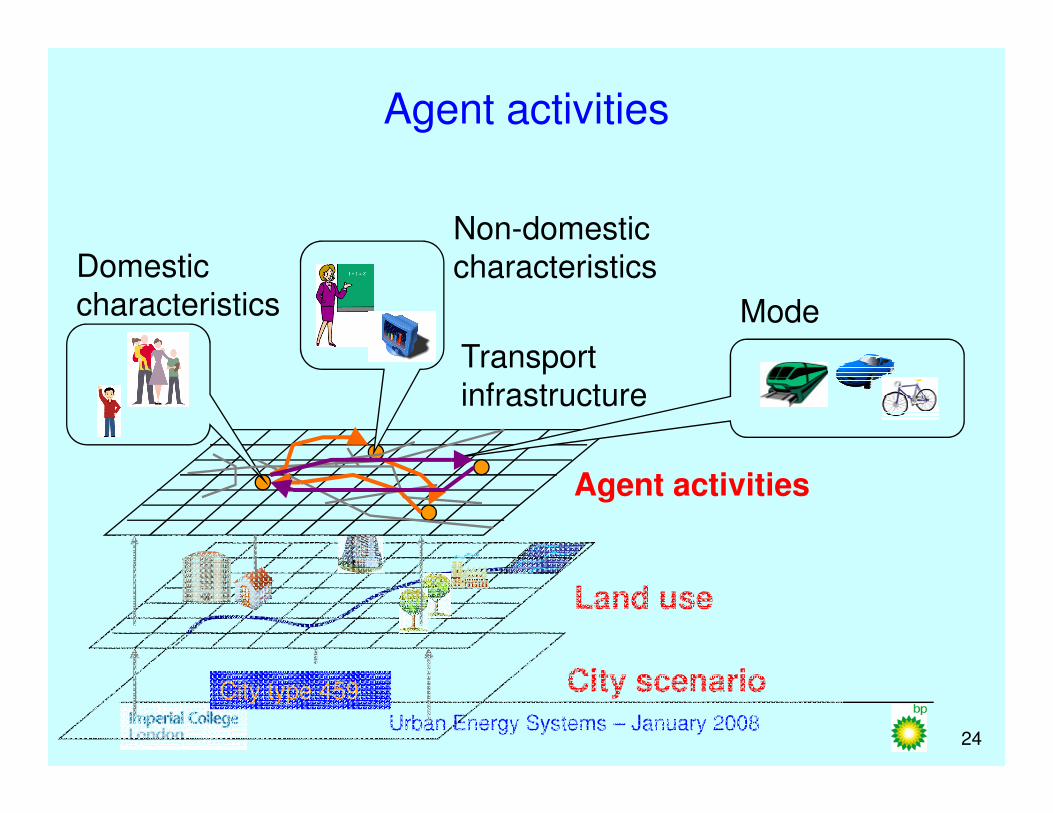
Domestic
characteristics Mode
Agent activities
Non-domestic
characteristics
Transport
infrastructure
Urban Energy Systems – January 200824
City type 459 City scenario
Land use
Agent activities
infrastructure
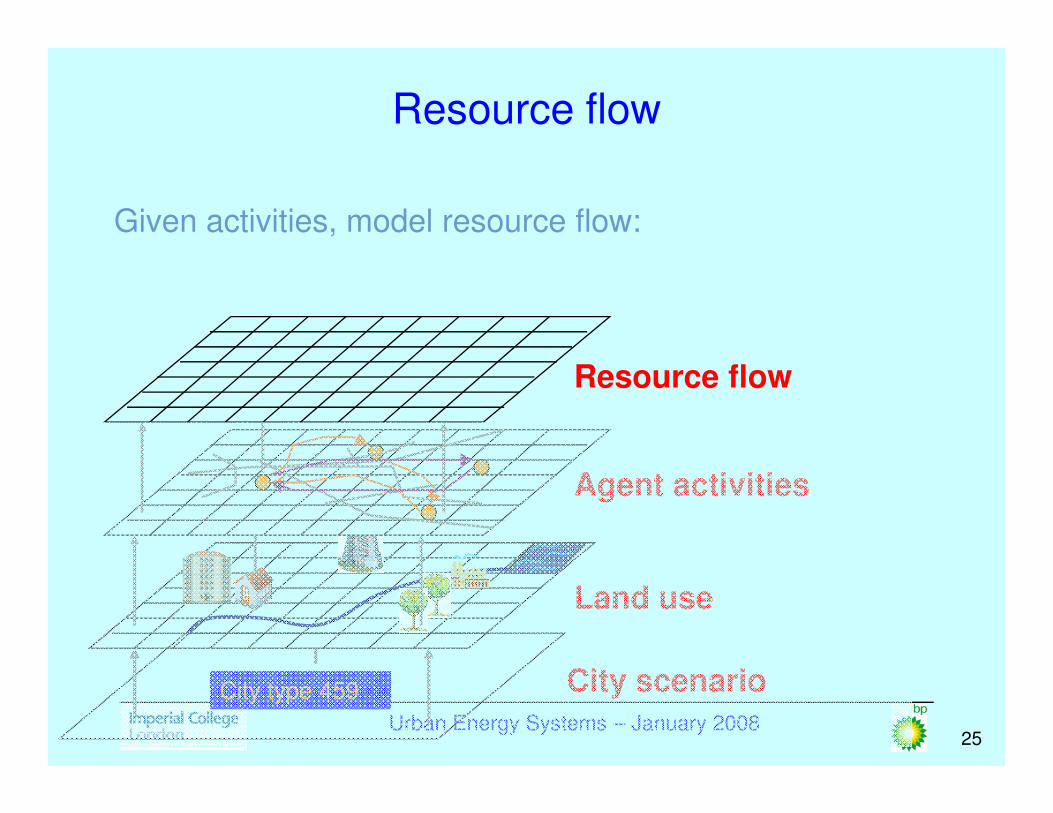
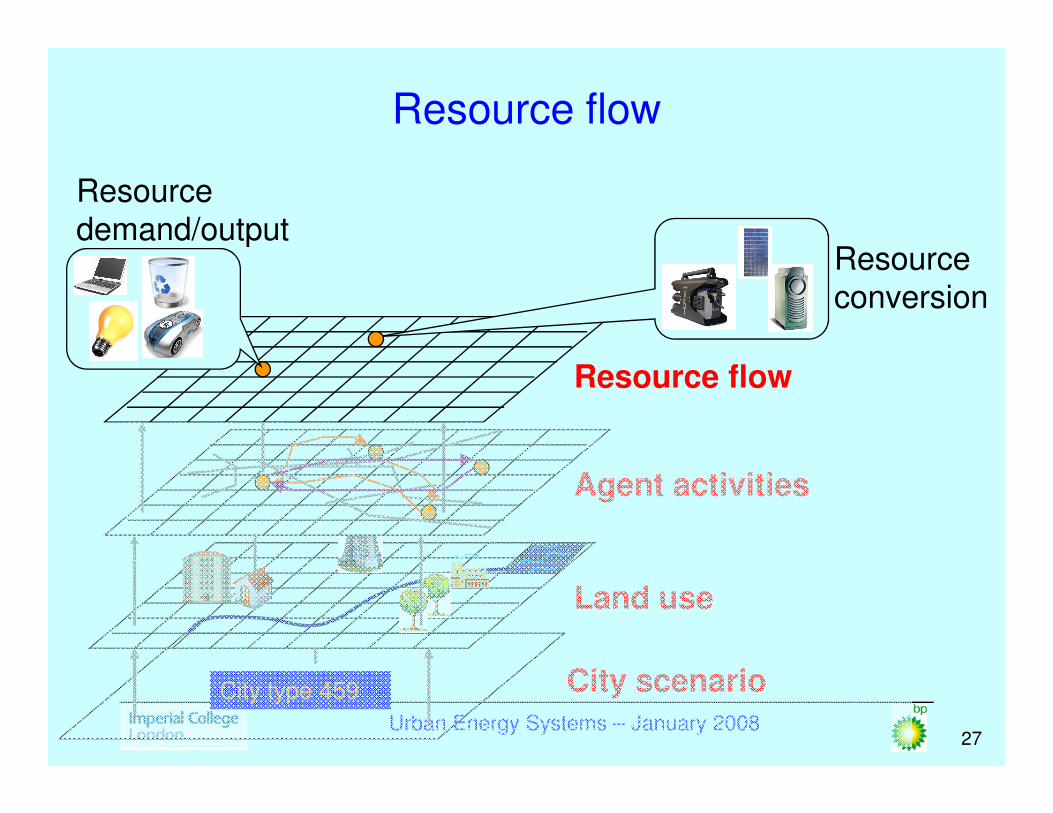
Resource flow
Given activities, model resource flow:
Resource flow
Urban Energy Systems – January 200825
City type 459 City scenario
Land use
Agent activities
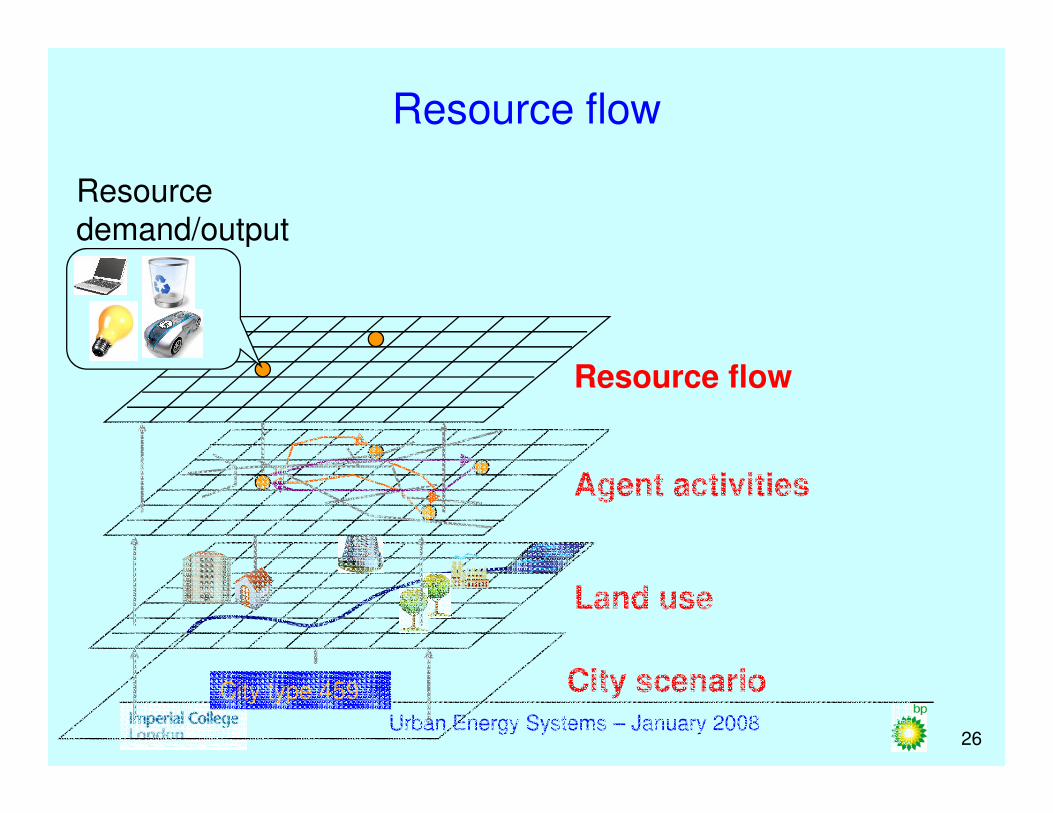
Resource flow
Resource flow
Resource
demand/output
Urban Energy Systems – January 200826
City type 459 City scenario
Land use
Agent activities
Resource flow
Resource flow
Resource
conversion
Resource
demand/output
Urban Energy Systems – January 200827
City type 459 City scenario
Land use
Agent activities
Resource flow
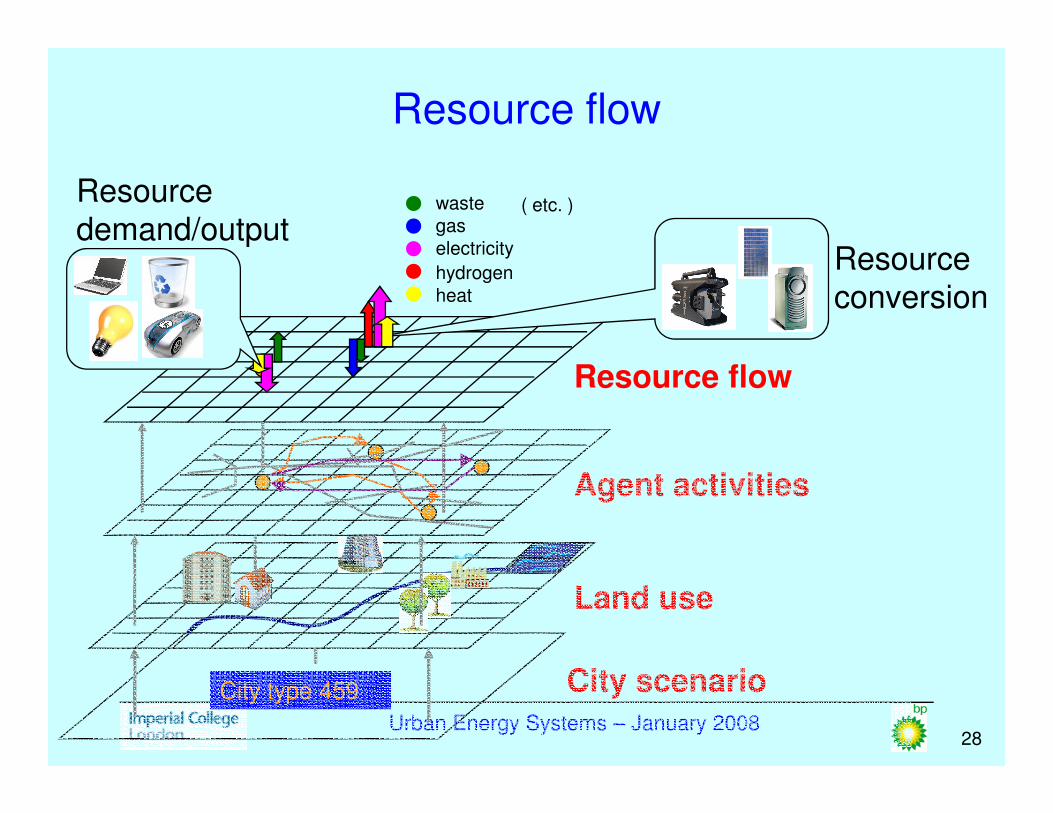
Resource flow
Resource
conversion
Resource
demand/outputelectricity
hydrogen
gas
waste
heat
( etc. )
Urban Energy Systems – January 200828
City type 459 City scenario
Land use
Agent activities
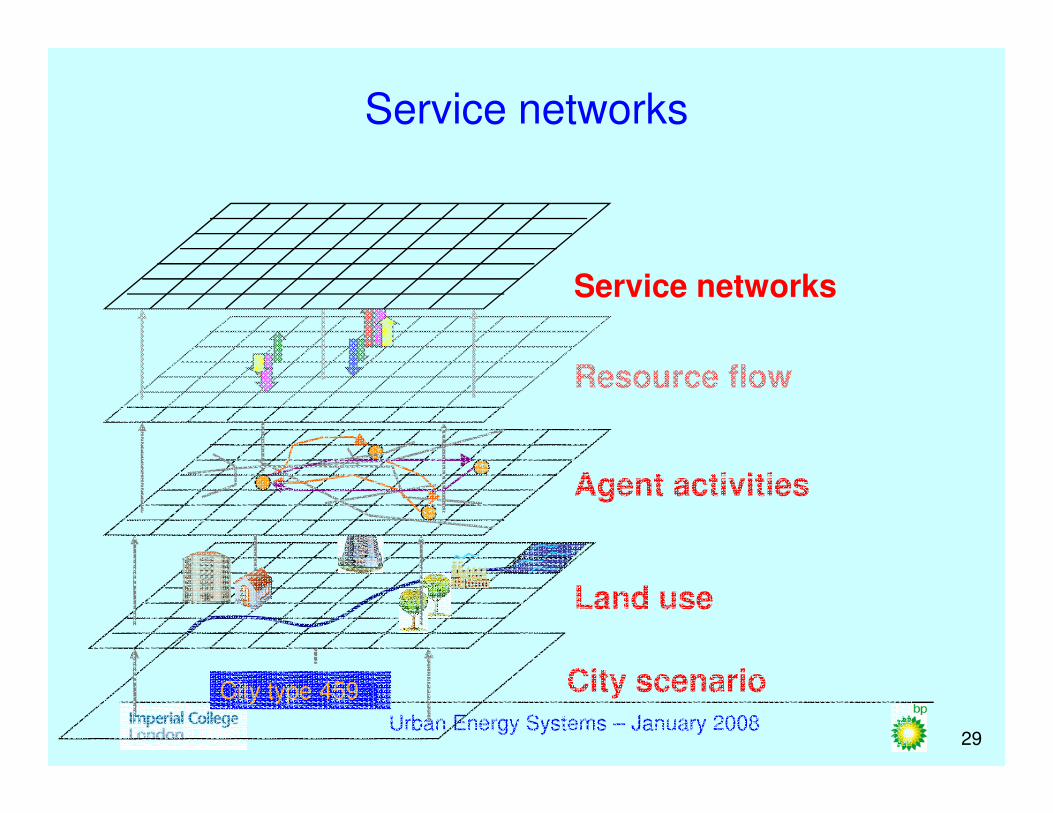
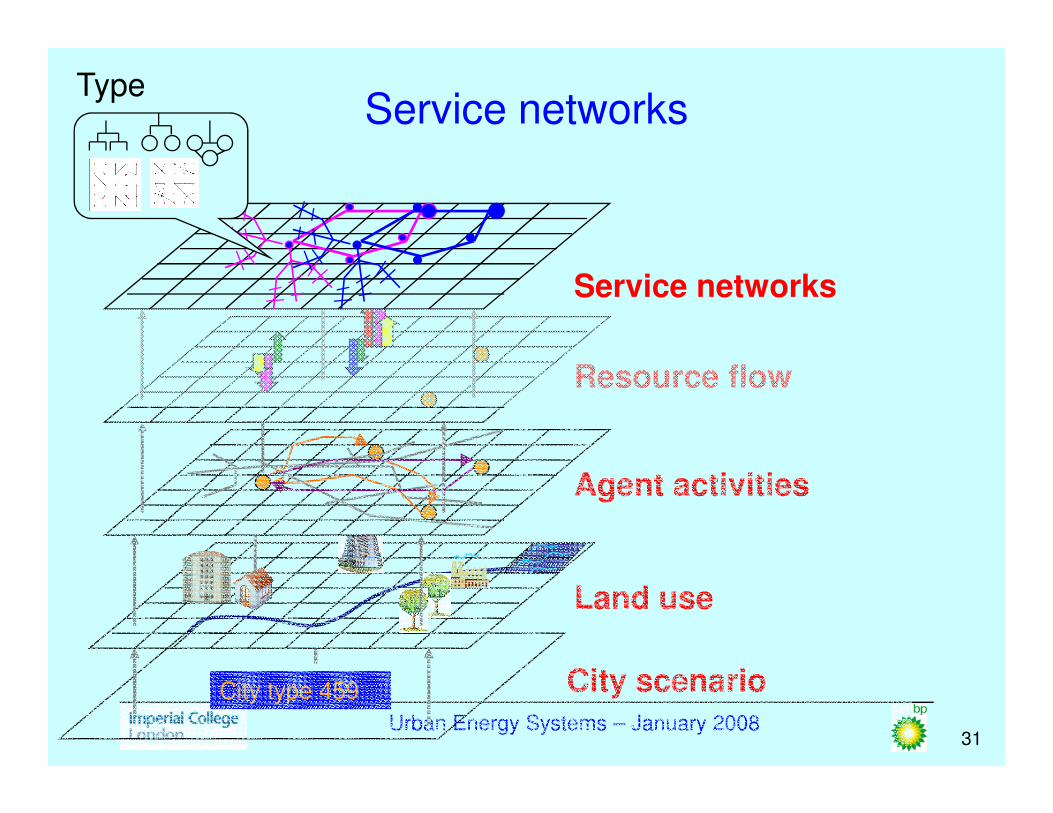
Service networks
Resource flow
Service networks
Urban Energy Systems – January 200829
City type 459 City scenario
Land use
Agent activities
Service networks
Resource flow
Service networks
Type
Urban Energy Systems – January 200830
City type 459 City scenario
Land use
Agent activities
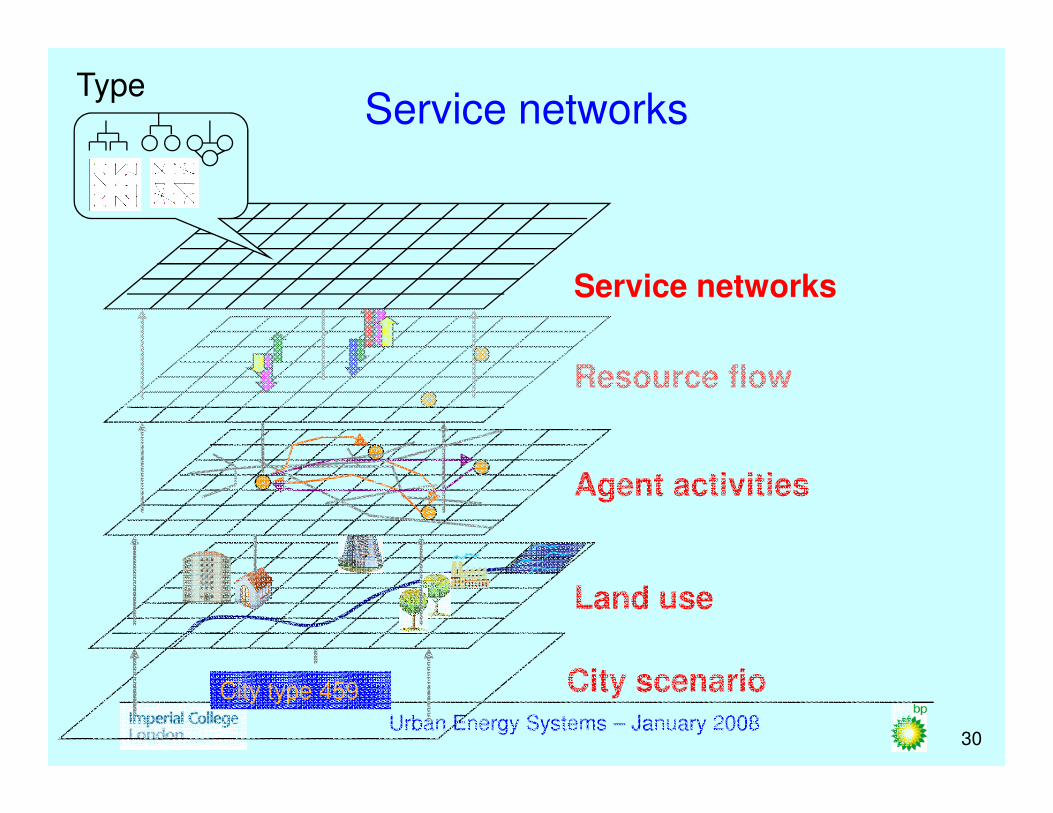
Service networks
Resource flow
Service networks
Type
Urban Energy Systems – January 200831
City type 459 City scenario
Land use
Agent activities
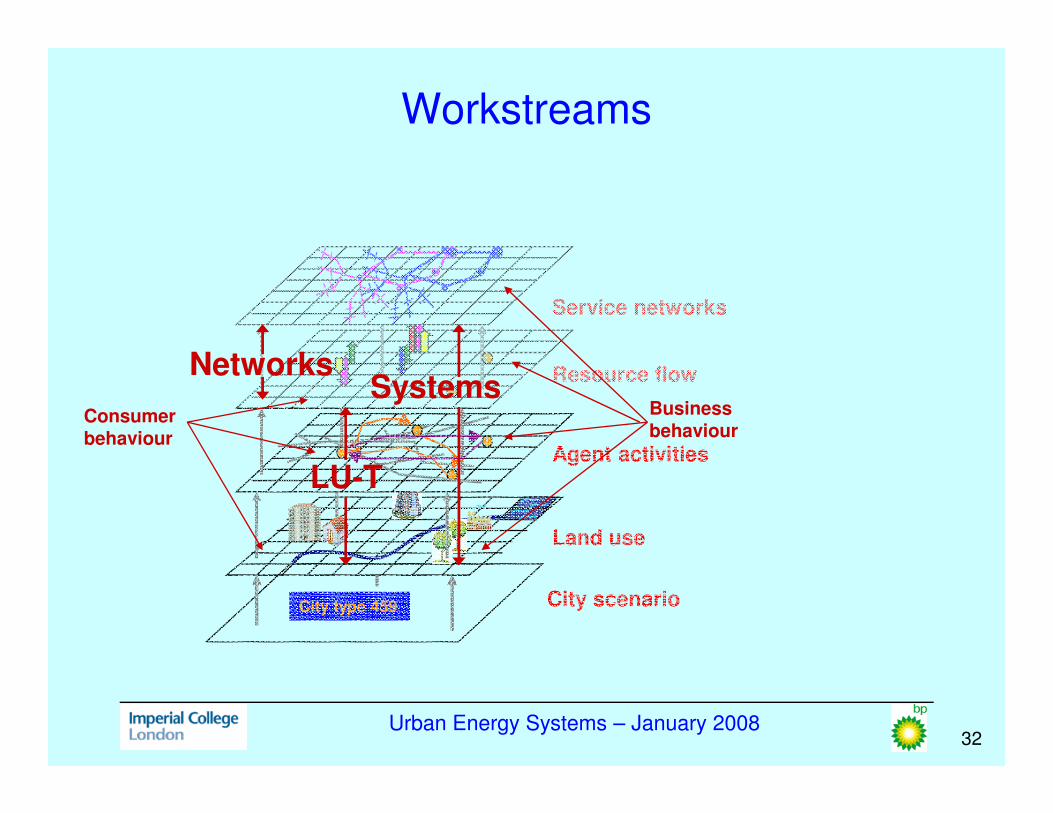
Workstreams
Resource flow
Service networks
NetworksSystems
Consumer Business
Urban Energy Systems – January 200832
City type 459 City scenario
Land use
Agent activities
Consumer behaviour
Business behaviour
LU-T

Workstreams
Resource flow
Service networks
Resource flow
Urban Energy Systems – January 200833
City type 459 City scenario
Land use
Agent activities
Resource flow
Ecology

Workstreams
Indicators
Resource flow
Resource flow
Service networks
Urban Energy Systems – January 200834
Indicators
Resource flow
Drivers
Activities
Flows/Stocks
Pressures
City type 459 City scenario
Land use
Agent activities

Indicators – our framework
Drivers + headline metrics
Activities + headline metrics
Flows & stocks + headline metrics
Domestic � Total demand � Intensity
System level � Emergy, exergy and thermodynamic metrics (e.g. emergy yield, 1
st & 2
nd order efficiencies)
� Ecological resilience, Fisher index or Shannon entropy measures of system sustainability � Policy oriented (policy-target, trend-target)
Demographics � Population � Education
Energy � Primary demand
(electricity, heat) � Sources
(renewable and
Pressures + headline metrics
Social � Road safety � Fuel poverty
Urban Energy Systems – January 200835
Economy � Employment � Sectoral mix
Local environment & infrastructure � Climate & air
quality � Energy
infrastructure (transport, gas
Transport � Total demand � Intensity
Industrial � Total demand � Intensity
(renewable and non-renewable)
Land � Ecological and
urban demand � Waste
management
Water � Total demand � Waste flows
Economic � Congestion � Economic
sustainability (e.g. ISEW)
Environmental � Air quality � Climate impact � Water quality � Noise pollution
Commercial � Total demand � Intensity

Ecological models: Singapore – London comparison
Singapore Greater London
Population 4,240,000 7,517,700
Area km2 704 1,579
Density hab/km2 6,023 4,761
GDP per capita $ 32,866 53,000
Water use per capita (m3 per year) 125 117
Urban Energy Systems – January 200836
Electricity consumption in 2003 in TWh 35.3 39.4
Electricity consumption in 2003 in MWh per capita
8.3 5.2
CO2 emissions per capita due to electricity production (t/capita)
6.3 2.9
Ecoindicator 99 impacts Gpt per capita for electricity generation ‘2003
0.3 0.1

Activity-based models – complete activity-travel pattern
of a worker
Home-Stay Duration
Work-Stay Duration
Home-Stay Duration
Home-Work
Commute
...
3 a.m. onday d
Leave home for non-work activities
Arrive back home
Leave for work
Arrive at work
Leave work
Before-Work Tour
Temporalfixity
S1 S2
Urban Energy Systems – January 200837
Leave homefor non-work activities
...
Work-Based Tour
After Work Tour
Arrive back at work
Leave work Arrive back home
Arrive back home
Temporalfixity
Home-Stay Duration
Home-Stay Duration
Work-Stay Duration
Work-Home
Commute
S3 S4 S5 S6
3 a.m. onday d+1

Typically operational land use-transport interaction
models
Demographic &
Economic Changes
Firms & Families by Indust.
Sector/Household Group
Residential &
Employment Locations
LocationalAccessibilities
Travel
Demands
Traffic Volumes & Speeds
Network
Vehicle
Ownership
TransportDemographic &
Economic Changes
Firms & Families by Indust.
Sector/Household Group
Residential &
Employment Locations
LocationalAccessibilities
Travel
Demands
Traffic Volumes & Speeds
Network
Vehicle
Ownership
Transport
Urban Energy Systems – January 200838
Floor-space
Demands
Available Land
Floors-pace supply
Building Allocation
& Change
Housing & Business Rents
Travel Costs
Network
Capacities
Land Use
Links to
capture land
use transport interactions
Floor-space
Demands
Available Land
Floors-pace supply
Building Allocation
& Change
Housing & Business Rents
Travel Costs
Network
Capacities
Land Use
Links to
capture land
use transport interactions

Innovation studies: understanding eco-city design
and operation
• Stage 1: DESIGN (master plan: eco-city system design)
– examines how Arup’s design and management approach was developed and how lessons learnt can be applied to other projects
– studies the innovation and decision-making processes used in the development of the design, including the technical tools employed and why certain options were ruled out
– explores the capabilities needed for this kind of design process
Urban Energy Systems – January 200839
– explores the capabilities needed for this kind of design process
• Stage 2: BUILD & INTEGRATION
– examines how construction and systems integration phase is organised
• Stage 3: OPERATION
– examines performance of the Dongtan as urban operating system

Hierarchical modelling strategy
Urban Energy Systems – January 200840
Synthetic city

Usefulness of synthetic city
• Can look like real cities without being data hungry
• Study extreme cases
• Avoid boundary condition issues
• Can isolate factors
• Can draw insights
Urban Energy Systems – January 200841
• Can draw insights
• Helps to develop algorithms:
– City layout
– LU-T / ABMS models
– Resource flow models
– Service network design models

Model city aspects
• Resource flows to and from hinterland
• Spatially disaggregated (regions – engineering based, administratively/politically based, ….)
Urban Energy Systems – January 200842
• Boundary conditions: where does the city end?
• Discretisation to describe space
– Polygons
– Functional network characteristics
– Admin/political (e.g. wards)

Model city – discretised into “cells”
Urban Energy Systems – January 200843
Primary
Resource flows
Internal resource flows, mobility
Waste
flows

What is to be determined/described?
• Land use plan:
– Where to place housing, and what type
– Where to place other facilities: PE, SE, H, LI, C, L,…
– What transport infrastructure (if any) connects each pair of
Urban Energy Systems – January 200844
– What transport infrastructure (if any) connects each pair of cells?
• What modes of transport are possible?
• What capacities?
Layout model: transport flows a simple function of
layout and infrastructure

What is to be determined?
• Activitities and transport demand
• Flows of people moving from A to B using mode m in season s, day d, hour t to participate in activity f
Urban Energy Systems – January 200845
[introduces stochastic elements: agent based LU-T framework]
ABMS model

What is to be determined
• Resource flows, conversion and integration:
• Resource demands
– Drstg = demand for resource r, season s, hour t, block g
• For all activities other than transport
Urban Energy Systems – January 200846
• For all activities other than transport
– DTrst = transport related demand for r, season s, hour t
– Implied by layout + LU-T model
• Technologies installed
• Resource flow
[so far, can be approximated as deterministic…]
RTN model

What is to be determined?
• Detailed service networks
– Possibly integrated
– Next generation: bidirectional flow, active control, …
Urban Energy Systems – January 200847

Some objective functions
• Minimise total capital cost to establish city
• Minimise lifecycle cost
• Minimise lifecycle fossil energy
• Minimise lifecycle environmental impact (e.g. eco-99)
• Maximise global “utility” (take account of aspirations/preferences, e.g. housing type, car ownership and
Urban Energy Systems – January 200848
aspirations/preferences, e.g. housing type, car ownership and use…)
– May need lower bound on worst case utility
• Design will be re-visited in iterative approach
– First layout is tentative to kick off the iterative algorithm

Themed cities
• Use model to study “themed” cities
– Electric city
– Hydrogen city
– Solar city
– Bioenergy city
Urban Energy Systems – January 200849
• What
– Do they look like
– Is the effect on the hinterland
– Are the technical issues
– Are the key indicators/metrics: cost, efficiency, GHG, other environmental impacts, …

MDH
PE LI C
L
PE L PE
LI HDH SE H
Layouts
Urban Energy Systems – January 200850
L PE SE
H MDH C
Balanced/leisure
city
C LI L
Light industrial
city

Resource technology network
• All resources identified and pooled in aggregate model; disaggregated in spatially disaggregated model– Some resources have external sources (e.g. natural gas, grid electricity)
– Some resources have external sinks (e.g. surplus electricity to grid, waste heat)
– Some resources have demands
Urban Energy Systems – January 200851
– Some resources have demands• Differ by season of year and time of day
– Some resources may be stored• Storage technology and capacity may have significant costs
– Heat qualities discretised in version 1.0
• All technologies identified by capacity(ies) and interactions with resources – Interactions captured by energy balance coefficients (essentially efficiencies, CoP etc)
– Technologies may be “renewable”

Resource technology network: example
gas Gas turbine
electricity
High grade
heat
LP waterpump
Heat exch. Heat pump.
2.5
1.5
1.0
demandCO2
Urban Energy Systems – January 200852
Low grade
heat
Medium grade
heatPRV
turbine
HP water
LP water
Polygen:Variable coefficients

Resource technology network:optimisation
• Given– Spatially and temporally explicity resource demands– Coefficents and metrics (cost, GHG etc) data, economies of scale
• Determine– Network construction
• What technologies?
Urban Energy Systems – January 200853
• What technologies?• What scales?• What interactions?• Which resources are stored
– Network operation• Over seasons• Daily cycle
– Different technologies may be used at different times/seasons
• To optimise some metric of the network– May need multicriteria analysis

Urban Energy Systems – January 200854

Storage
Resource
Store
Stored
Resource
Retrieve
Urban Energy Systems – January 200855
Low-grade
Heat
Electricity
Hold

Example Problem
• City divided into 16 cells • Four resources
– Gas– Electricity– Transport fuel– Waste heat
• Import of gas and transport fuel only• Two types of distributed electricity generation process
Urban Energy Systems – January 200856
• Two types of distributed electricity generation process– Available at 3 scales– Converts gas to electricity– Byproduct: waste heat

Example Problem
• Demands for gas and electricity– Max 3500 each in centre cells
– Max 3000 each in edge cells
– Max 2500 each in corner cells
• Multiplied by dynamic profiles, weighted by season
Urban Energy Systems – January 200857
Electricity
Gas Sp Su Au Wi

Example Results — Gas
Demand
Imports
Nett production
Total in
Total out
Total stored
-6000
-4000
-2000
0
2000
4000
6000
8000
1 11 21 31
-8000
-6000
-4000
-2000
0
2000
4000
6000
8000
1 11 21 31
-6000
-4000
-2000
0
2000
4000
6000
8000
1 11 21 31
-6000
-4000
-2000
0
2000
4000
6000
8000
1 11 21 31
-6000
-4000
-2000
0
2000
4000
6000
8000
1 11 21 31
-6000
-4000
-2000
0
2000
4000
6000
8000
10000
12000
1 11 21 31
-5000
0
5000
10000
15000
20000
25000
1 11 21 31 -5000
0
5000
10000
15000
1 11 21 31
Urban Energy Systems – January 200858
time
quantity
-8000 -8000
-6000
-10000 -10000
-6000
-4000
-2000
0
2000
4000
6000
8000
1 11 21 31
-5000
0
5000
10000
15000
20000
1 11 21 31
-60000
-40000
-20000
0
20000
40000
60000
80000
100000
120000
140000
1 11 21 31
-8000
-6000
-4000
-2000
0
2000
4000
6000
8000
10000
1 11 21 31
-6000
-4000
-2000
0
2000
4000
6000
8000
1 11 21 31
-10000
-5000
0
5000
10000
15000
1 11 21 31
-8000
-6000
-4000
-2000
0
2000
4000
6000
8000
10000
1 11 21 31
-8000
-6000
-4000
-2000
0
2000
4000
6000
8000
1 11 21 31

Example Results — Electricity
Demand
Imports
Nett production
Total in
Total out
Total stored
-500
0
500
1000
1500
2000
2500
3000
1 11 21 31-1000
-500
0
500
1000
1500
2000
2500
3000
3500
1 11 21 310
500
1000
1500
2000
2500
3000
3500
1 11 21 31 -500
0
500
1000
1500
2000
2500
3000
1 11 21 31
-500
0
500
1000
1500
2000
2500
3000
3500
1 11 21 31-500
0
500
1000
1500
2000
2500
3000
3500
4000
1 11 21 310
1000
2000
3000
4000
5000
1 11 21 31 -500
0
500
1000
1500
2000
2500
3000
3500
4000
4500
1 11 21 31
Urban Energy Systems – January 200859
time
quantity
-1000
-500
-1000
-500 1 11 21 31
-1000
1 11 21 31
-1000
-500 1 11 21 31
0
500
1000
1500
2000
2500
3000
3500
1 11 21 31 -1000
0
1000
2000
3000
4000
5000
1 11 21 31 0
5000
10000
15000
20000
25000
1 11 21 31 -500
0
500
1000
1500
2000
2500
3000
3500
1 11 21 31
-500
0
500
1000
1500
2000
2500
3000
1 11 21 31-1000
-500
0
500
1000
1500
2000
2500
3000
3500
4000
4500
1 11 21 31
-500
0
500
1000
1500
2000
2500
3000
3500
1 11 21 31-1000
-500
0
500
1000
1500
2000
2500
3000
3500
1 11 21 31

Example Results — Waste Heat
Demand
Imports
Nett production
Total in
Total out
Total stored
0
5000
10000
15000
20000
25000
30000
1 2 3 4 5 6 7 8 9 10 -5000
0
5000
10000
15000
20000
25000
30000
35000
40000
45000
1 2 3 4 5 6 7 8 9 10 -5000
0
5000
10000
15000
20000
25000
30000
35000
40000
45000
1 2 3 4 5 6 7 8 9 10
0
5000
10000
15000
20000
25000
30000
35000
40000
1 2 3 4 5 6 7 8 9 10
5000
10000
15000
20000
25000
30000
4000
6000
8000
10000
12000
14000
16000
50000
100000
150000
200000
250000
300000
10000
15000
20000
25000
30000
35000
40000
45000
Urban Energy Systems – January 200860
time
quantity
0
5000
1 2 3 4 5 6 7 8 9 10 -2000
0
2000
1 2 3 4 5 6 7 8 9 10 -50000
0
50000
1 2 3 4 5 6 7 8 9 10-5000
0
5000
1 2 3 4 5 6 7 8 9 10
0
5000
10000
15000
20000
25000
30000
35000
1 2 3 4 5 6 7 8 9 10 -5000
0
5000
10000
15000
20000
25000
30000
35000
40000
1 2 3 4 5 6 7 8 9 10 -5000
0
5000
10000
15000
20000
25000
1 2 3 4 5 6 7 8 9 10
-5000
0
5000
10000
15000
20000
25000
30000
35000
40000
45000
1 2 3 4 5 6 7 8 9 10
0
5000
10000
15000
20000
25000
30000
1 2 3 4 5 6 7 8 9 10
0
5000
10000
15000
20000
25000
30000
35000
1 2 3 4 5 6 7 8 9 10
0
5000
10000
15000
20000
25000
30000
1 2 3 4 5 6 7 8 9 10
0
5000
10000
15000
20000
25000
30000
1 2 3 4 5 6 7 8 9 10

Example Results — Gas Transport
Transport network Max rate = 10000t = 14690 172
4970
10000 4401
10000 4763
t = 26181 3483
3100
10000 5905
10000 9932
t = 35691 2394
3160
10000 5410
10000 8231
t = 44454
5345
9646 4163
10000 4305
t = 53218
3862
6877 2916
7456 2822
t = 61734
2072
3545 1412
7790 1032
t = 71962
2355
8778 1650
10000 1315
t = 84219
5063
10000 3926
10000 4023
t = 95220
6264
10000 4935
10000 5224
t = 106221
7465
10000 5944
10000 6425
Urban Energy Systems – January 200861
5280 10000 10000
392
4730 2644
6450 10000 10000
1023
6234 6890
6390 10000 10000
493
5739 5680
4555 10000 9646
829
4492 3785
3895 10000 6877
3246 1498
2090 10000 3545
1768
2375 10000 8778
1979 1438
5106 10000 10000
4255 5106
6317 10000 10000
5264 6317
7528 10000 10000
6274 7528

Example Results — Electricity Network
Infrastructure network Max rate = 10000
Urban Energy Systems – January 200862

Example Results — Electricity Network Utilisation
t = 1t = 2t = 3t = 4t = 5t = 6156
t = 7t = 8t = 9t = 10t = 11t = 12t = 13t = 14t = 1550
t = 16t = 17125
t = 18t = 19t = 20t = 21t = 22t = 23t = 24t = 25t = 26156
t = 27t = 28t = 29t = 30t = 31t = 32
697 131
t = 33
349
t = 34t = 35t = 36t = 37t = 38t = 39t = 40
SpringSummerAutumnWinter
Urban Energy Systems – January 200863
351125 11411885227486
4
286125 30602569195451500
3300
40821250
131
1876
6077
508
875
4256
4886
312
125
2437
30312012122418642901125
1043
3479500
3290
4293

Some case study cities
• London, New York, Shanghai
– The “world cities energy partnership”
• Atlanta
– Low density US city; the AtlantIC Alliance
• Dongtan and Chula Vista
Urban Energy Systems – January 200864
• Dongtan and Chula Vista
– Greenfield “eco-cities”
• A Chinese city to be decided
– Collaboration with the BP-Tsinghua clean energy centre
• Singapore
• …

Conclusions
• A high level study of what is possible in cities
– Not diving into too much detail
– Not constrained by implementation issues
– Holistic – looking for integration opportunities
• Based on interlinked models
Urban Energy Systems – January 200865
• Based on interlinked models
– Conceptual and mathematical
• Combines technologies, infrastructure, communities, governance, business, …
• Assess options against a variety of indicators