Embed Size (px)
Citation preview

Urban Expansion and Sensitive Environments
Assessing the role of agri-industries as landscape buffers to the neighbouring Greater Blue Mountains World Heritage Area
RIRDC Publication No. 09/025
RIRDCInnovation for rural Australia


Urban Expansion and Sensitive Environments
Assessing the role of agri-industries as landscape buffers to the neighbouring Greater Blue Mountains World Heritage Area
by J Merson, R Attwater, S Booth, R Mulley, P Ampt, H Wildman, M Nugent, S Hooper, M Campbell and R Chapple
March 2009
RIRDC Publication No 09/025 RIRDC Project No UNS-18A

© 2009 Rural Industries Research and Development Corporation. All rights reserved.
ISBN 1 74151 829 6 ISSN 1440-6845
Urban Expansion and Sensitive Environments – Assessing the role of agri-industries as landscape buffers to the neighbouring Greater Blue Mountains World Heritage Area Publication No. 09/025 Project No. UNS-18A
The information contained in this publication is intended for general use to assist public knowledge and discussion and to help improve the development of sustainable regions. You must not rely on any information contained in this publication without taking specialist advice relevant to your particular circumstances.
While reasonable care has been taken in preparing this publication to ensure that information is true and correct, the Commonwealth of Australia gives no assurance as to the accuracy of any information in this publication.
The Commonwealth of Australia, the Rural Industries Research and Development Corporation (RIRDC), the authors or contributors expressly disclaim, to the maximum extent permitted by law, all responsibility and liability to any person, arising directly or indirectly from any act or omission, or for any consequences of any such act or omission, made in reliance on the contents of this publication, whether or not caused by any negligence on the part of the Commonwealth of Australia, RIRDC, the authors or contributors.
The Commonwealth of Australia does not necessarily endorse the views in this publication.
This publication is copyright. Apart from any use as permitted under the Copyright Act 1968, all other rights are reserved. However, wide dissemination is encouraged. Requests and inquiries concerning reproduction and rights should be addressed to the RIRDC Publications Manager on phone 02 6271 4165.
Researcher Contact Details
A/Prof John Merson Blue Mountains World Heritage Institute Vallentine Annex University of NSW Sydney NSW
Phone: 02 9385 2966 Mobile: 0412 290 840 Email: [email protected]
In submitting this report, the researcher has agreed to RIRDC publishing this material in its edited form.
RIRDC Contact Details
Rural Industries Research and Development Corporation Level 2, 15 National Circuit BARTON ACT 2600
PO Box 4776 KINGSTON ACT 2604
Phone: 02 6271 4100 Fax: 02 6271 4199 Email: [email protected]. Web: http://www.rirdc.gov.au
Printing by Union Offset Printing, Canberra Electronically published by RIRDC in March 2009
ii

Foreword The Greater Blue Mountains World Heritage Area (GBMWHA) in the Hawkesbury-Nepean region to the west Sydney is a sensitive environment under threat from the impacts of land use change and requiring careful management. The issues are common to many landscapes managed for a balance between urban expansion, the agricultural lands providing services and amenity, and the conservation of nearby areas of natural and cultural significance. This need is recognised internationally and has led to the mandating of buffer zones between urban settlements and forested or protected areas in both Europe and the USA.
The agri-industrial buffer zone plays a critical role in protecting neighbouring urban areas from bushfires and in maintaining critical catchment functions. However, small farms are under considerable pressures with the rise of land value in relation to the demand for more urban housing developments. While regional councils have attempted to provide support for their dwindling rural communities, they have often ended up producing contradictory land use regulations in an effort to address the conflicting interests of different constituencies.
This project assessed the complex social, economic and environmental factors impacting on the small-scale rural communities GBMWHA. It assessed the role of agri-industries as landscape buffers to the neighbouring World Heritage Area. The project explored how local government planning might be improved to help this vulnerable but essential peri-urban farming community. In conjunction with targeted representative landholders, tools were developed to assist in enhancing the economic and environmental resilience of agri-industries involved in diverse modes of production.
This project was funded by two R&D Corporations - RIRDC, funded by the Australian Government, and HAL (Horticulture Australia Limited). The project was also supported by the contribution of the four farming families who provide the focus of the case studies, and in-kind contributions from research partners including the Future of Australia’s Threatened Ecosystems (FATE) program at the University of NSW and Total Catchment Management Services Pty Ltd.
This report, an addition to RIRDC’s diverse range of over 1800 research publications, forms part of our Environment and Farm Management R&D program, which aims to foster agri-industry systems that have sufficient diversity, flexibility and robustness to be resilient and respond to challenges and opportunities.
Most of our publications are available for viewing, downloading or purchasing online through our website: www.rirdc.gov.au.
Peter O’Brien Managing Director Rural Industries Research and Development Corporation
iii

About the author Peter Ampt undertook the Landscape Function Analysis component of the project. He is the Manager of the FATE Program at the Institute of Environmental Studies (IES), University of NSW (UNSW).
Dr Roger Attwater was the main staff member on the project and is a Research Associate of the Blue Mountains World Heritage Institute (BMWHI).
Sandy Booth was a principal investigator on the project and is a Research Associate of BMWHI and Director of Total Catchment Services Pty Ltd. He is also an Adjunct A/Professor at IES, UNSW.
Dr Rosalie Chapple is Director of Research at BMWHI, and a Visiting Fellow at the IES.
Marnie Campbell is a social science researcher at University of Western Sydney, and is a Research Associate at BMWHI.
Shaun Hooper undertook the GIS work for the project and is a Research Associate at BMWHI.
Associate Professor John Merson was a principal investigator on the project. He is Executive Director of BMWHI, and Director of IES at UNSW.
Associate Professor Robert Mulley was a principal investigator on the project. He is Associate Professor of Animal Science and Head of School of Natural Sciences at the Hawkesbury Campus of the University of Western Sydney.
Dr Monica Nugent undertook land use planning work and is a Research Associate at BMWHI.
Dr Howard Wildman was involved in the organic waste conversion component of the project. He is Chief Scientist at Microbial Management Systems, an environmental microbiology consultancy.
Acknowledgments In terms of intellectual and technical advice at workshops and field days held over the duration of this project, we are grateful for the support provided by David Mason from the NSW Dept of Primary Industries (DPI). We are also grateful to Peter Malcolm (District Horticulturalist, DPI) and Gerry Gillespie (NSW Department of Environment and Climate Change) for their participation in a workshop at the University of Western Sydney.
iv

Abbreviations ACRIS Australian Collaborative Rangeland Information System AGREE GIS software tool BE Biological Efficiency BM Blue Mountains BMCC Blue Mountains City Council BMWHI Blue Mountains World Heritage Institute CSIRO Commonwealth Scientific and Industrial Research Organisation DCP Development Control Plan DECC Department of Environment and Climate Change DEM Digital Elevation Model DMR Department of Mineral Resources DPI Department of Primary industries EFA Ecosystem function analysis EOSCLIM Estimate Mean Monthly Climate EP Environmental Protection (Zone) EPI Environmental Planning Instruments ESD Environmentally Sustainable Development FATE Future of Australia’s Threatened Ecosystems GBMWHA Greater Blue Mountains World Heritage Area GIS Geographical Information System HAL Horticulture Australia HARtDaC Hawkesbury Agricultural Retention through Diversification and Clustering project HCC Hawkesbury City Council HELP Hawkesbury Local Environment Plan IBS Integrated Bio-System IES Institute of Environmental Studies LEP Local Environment Plan LFA Landscape Function Analysis LGA Local Government Area LS Landscape Slope Factor = length and steepness of a slope (GIS variable) PDA Potato Dextrose Agar PI Principal Investigator RC Rural Conservation SMS Soil Microbial Systems SMS Spent Mushroom Substrate SSI Soil Surface Indicator UNSW University of New South Wales UWS University of Western Sydney WARMS Western Australian Rangeland Monitoring System WHA World Heritage Area
v

Contents
Foreword ............................................................................................................................................... iii About the Author.................................................................................................................................. iv Acknowledgments................................................................................................................................. iv Abbreviations......................................................................................................................................... v Executive Summary.............................................................................................................................. ix Introduction ........................................................................................................................................... 1
1.1 Threats and opportunities for agri-industries in the study area.............................................. 1
2. Objectives ......................................................................................................................................... 16 3. Methodology..................................................................................................................................... 18 4. Detailed Results ............................................................................................................................... 20
4.1 Preliminary analysis.................................................................................................................. 20 4.2 Case studies – representative landholders................................................................................. 25 4.3 Potential Tools and Economic Opportunities ........................................................................... 38
5. Discussion of Results ....................................................................................................................... 75 5.1 Organic waste conversion ......................................................................................................... 75 5.2 LFA outcomes........................................................................................................................... 76 5.3 GIS outcomes............................................................................................................................ 77 5.4 Overview of outcomes and lessons learnt ................................................................................. 77
6. Implications...................................................................................................................................... 79 7. Recommendations............................................................................................................................ 81 8. Appendices ....................................................................................................................................... 84
1. Land Use Planning...................................................................................................................... 84 2. World Heritage Buffer Zones ..................................................................................................... 93
9. References ........................................................................................................................................ 94
vi
Tables
Table 1.1 Summary of the economic, socio-cultural, environmental and politico-administrative issues identified for agriculture in the Hawkesbury Region ............................................... 4 Table 1.2 Relationship between decision-making fields and strategic directions............................... 4 Table 1.3 National, state, regional and local policy context for land use planning ............................ 6 Table 1.4 Assessment of outlook and threats to agri-industries in Hawkesbury 1997 ....................... 9 Table 1.5 Key issues in the Goulburn Broken Catchment ................................................................ 10 Table 1.6 Ecosystem services and functions in agricultural landscapes ........................................... 11 Table 1.7 Attributes of individuals and social systems that contribute to resilience ........................ 12 Table 1.8 Examples of key variables and speeds for a range of systems.......................................... 13 Table 4.1 Drivers of change in agro-ecosystems .............................................................................. 21 Table 4.2 Issues, opportunities, clusters and phases of the adaptive cycle for farmers who participated in focus groups .............................................................................................. 24 Table 4.3 Slower and faster variables for project clusters ................................................................ 24 Table 4.4 Potential supporting strategies at a range of temporal and spatial scales.......................... 25 Table 4.5 Horticultural producers involved in the project ................................................................ 26 Table 4.6 List of fungi isolated into pure culture for this project and their source........................... 45 Table 4.7 Viability of fungal isolates after long-term preservation in water .................................... 46 Table 4.8 A cost-benefit analysis of the microbial bioremediation of 1000 kg of
apple tree wood and assuming that all work is done on-farm by the end-user. ............... 48 Table 4.9 Summary of LFA Data Entry Software ............................................................................ 56 Table 4.10. Attribution of LFA values to house .................................................................................. 64 Table 4.11 A typical suburban house and garden ............................................................................... 65 Table 4.12 GIS Tools and Data Sets used in modeling....................................................................... 67
vii
Figures
Figure 1.1 A continuum of urban agriculture in the Sydney Region and associated values/benefits .. 8 Figure 1.2 Phases in the adaptive cycle.............................................................................................. 13 Figure 1.3 Interactions of dynamics at different scales ...................................................................... 14 Figure 3.1 Overall methodological approach of the project............................................................... 19 Figure 4.1 Rural residential land uses near Enniskillen Orchard, Grose Wold.................................. 20 Figure 4.2 Produce at a local growers market .................................................................................... 21 Figure 4.3 Example of mapping issues described by ‘local focus’ orchardists.................................. 22 Figure 4.4 Example of mapping issues described by ‘market oriented’ orchardists .......................... 23 Figure 4.5 General structure used to inform lifecycle assessments.................................................... 27 Figure 4.6 Adrian Maguire and one of the researchers on Enniskillen Orchard ................................ 27 Figure 4.7 Location of Enniskillen Orchard (HCC 1989).................................................................. 29 Figure 4.8 Bill Shields at his roadside stall ........................................................................................ 30 Figure 4.9 Location of Shields Orchard (HCC 1989) ........................................................................ 31 Figure 4.10 Location of Saliba Fruits................................................................................................... 33 Figure 4.11 Joe Saliba and researcher at Saliba’s orchard ................................................................... 34 Figure 4.12 The Chorleys and researcher at their permaculture garden............................................... 35 Figure 4.13 Location of Northgate ....................................................................................................... 36 Figure 4.14 Shredded apple material (scale = 6” or 15cm) .................................................................. 40 Figure 4.15 Apple tree layout in Shields Orchard (trees planted at rate 100 trees/acre)...................... 42 Figure 4.16 A pile of apple trees that have been removed prior to burning......................................... 43 Figure 4.17 Chipped apple wood (8 – 10 m3) produced from 22 large trees ....................................... 43 Figures 4.18 and 4.19 Run-off areas from dams at Saliba Fruits ......................................................................... 44 Figure 4.20 F3 Pleurotus ostreatus in a garden bed............................................................................. 45 Figure 4.21 F5 Pleurotus sp. fruiting bodies growing on a tree stump ................................................ 46 Figure 4.22 Close-up photograph of a pile of apple tree material stacked prior to burning................. 47 Figures 4.23 and 4.24 Howard Wildman explains the processes of inoculating the chips with mushroom spore to a group of farmers............................................................................................... 49 Figure 4.25 A conceptual framework summarising landscape function .............................................. 51 Figure 4.26 The relationship between landscape function and landscape condition............................ 52 Figure 4.27 Relationship between LFA index and disturbance ........................................................... 53 Figure 4.28 Landscape organisation (showing key features involved in carrying out LFA) ............... 54 Figure 4.29 Soil Surface Indicators and their contribution to LFA Indices ......................................... 55 Figure 4.30 LFA - Shields Orchard...................................................................................................... 58 Figure 4.31 LFA Saliba Orchard.......................................................................................................... 59 Figure 4.32 LFA Enniskillen Orchard.................................................................................................. 60 Figure 4.33 Sean’s orchard................................................................................................................... 61 Figure 4.34 LFA Permaculture garden................................................................................................. 62 Figure 4.35a LFA garden in Katoomba ................................................................................................. 63 Figure 4.35b LFA of garden including house and driveway.................................................................. 64 Figure 4.35c LFA of house block more typical of urban landscapes..................................................... 65 Figure 4.36 Peter Ampt demonstrates the laying out of an LFA transect to a group of interested farmers at a meeting of research participants March 2008 ............................................... 65 Figure 4.37 Topographical features of the study area .......................................................................... 68 Figure 4.38 K Factor grid indicating vulnerability to erosion in the study area .................................. 69 Figure 4.39 Example of catchments for two of the study properties (Saliba and Shields)................... 71 Figure 4.40 The specific catchments area and flow paths from Saliba and Shields properties............ 71 Figure 4.41 Current average rainfall pattern in study area................................................................... 72 Figure 4.42 Current average temperatures for the study area............................................................... 73 Figure 4.43 Potential change to rainfall and temperature..................................................................... 74
viii

Executive Summary What the report is about
This project assessed the complex social, economic and environmental factors impacting on the small-scale rural communities in the eastern edges of the Greater Blue Mountains World Heritage Area (GBMWHA). It assessed the role of agri-industries as landscape buffers to the neighbouring World Heritage Area. The project explored how local government planning might be improved to help this vulnerable but essential peri-urban farming community. In conjunction with targeted representative landholders, tools were developed to assist in enhancing the economic and environmental resilience of agri-industries involved in diverse modes of production.
Who is the report targeted at?
The report is targeted at the individuals and families undertaking a range of agribusinesses in the Hawkesbury-Nepean region, and aspects of the complex challenges faced by these farming communities. This report will also be of interest to regional and local government, environmental advocates, natural resource managers and others interested in the critical buffer zones between encroaching urban sprawls and naturally significant areas.
Background
This project builds upon a number of previous studies that have addressed the viability and long-term sustainability of small-scale agri-industries that constitute the buffer zone between the westward urban sprawl of Sydney and the GBMWHA. The significance of the buffer zone was fully appreciated after establishment of the World Heritage Area in 2000, which brought international attention to the environmental management of the region. The agri-industrial buffer zone plays a critical role in protecting neighbouring urban areas from bushfires and in maintaining critical catchment functions. This need is recognised internationally and has led to the mandating of buffer zones between urban settlements and forested or protected areas in both Europe and the USA. Small scale agri-industries of the region provide crucial ecosystem services to the Sydney basin region, both in supporting the hydrological functions of the catchment and as a buffer against fire spreading from either the WHA into the urban areas or vice versa.
However, as recognised in previous studies, the small farms of the region are under considerable pressures with the rise of land value in relation to the demand for more urban housing developments. While regional councils have attempted to provide support for their dwindling rural communities, they have often ended up producing contradictory land use regulations in an effort to address the conflicting interests of different constituencies.
Aims/objectives
The overall objective was to seek conceptual, practical and policy leverage in relation to the role of agri-industries as a recognised and valued landscape buffer between protected conservation areas and encroaching land use change.
Particular objectives were:
• To document the economic, social and environmental impacts of agri-industries located along the north-eastern boundary of the Greater Blue Mountains World Heritage Area (GBMWHA);
• To facilitate improved agricultural productivity in ways that complement the values of the neighbouring World Heritage Area and the Hawkesbury-Nepean River System, in partnership with industry, government and communities in the region;
ix

• To advocate the use of regional and local economic, social, and environmental values and objectives as driving forces in developing economically viable and ecologically sustainable agri-industries.
Methods used
Due to its complexity and the need to initially identify appropriate case studies, the early methodological approach taken in this study was an adaptive one. A broad qualitative approach was taken to assessing the factors impacting on the farming community in the study area, and then identifying particular methodological approaches that were appropriate for the key areas as they emerged in the later phase of the study.
The role of agri-industries as landscape buffers to the neighbouring World Heritage Area was investigated in relation to resilience, communities of practice, and ecosystem services. The case study was the ridgeline of Hawkesbury–Mount Tomah, which abuts and bisects the GBMWHA. It involved the following approaches:
1. Interviews. A series of semi-structured interviews provided an initial basis for evaluating the issues faced by local producers.
2. Representative case studies. Four farms representing diverse production and marketing strategies were identified as detailed case studies, reflecting the diversity of viable production and livelihood strategies found in the area.
3. Tools. Three key areas of investigation emerged, based upon a critical review of local literature and the needs of farmers identified through semi-structured interviews:
a. Organic Waste Conversion. Participatory testing and development in relation to the recycling of organic waste and low maintenance production of saleable fungal produce. Methodological steps involved the identification and assessment of waste streams, fungal isolation and storage, development of waste remediation and mushroom production conditions, spawn production and growth trials, and field trials and demonstration for growers.
b. Landscape Function Analysis (LFA). LFA, a methodology to assess the crucial environmental functions of rural lands, was used here to make comparisons between different land use practices. LFA provides a means for assessing functional aspects of the ecosystem, in terms of loss of nutrients and productivity, and was adapted and tested as an indicator-based approach that both supports policy regarding the role of these agricultural systems as landscape buffers, and provides a potential means for simple ongoing monitoring.
c. Geographical Information Systems (GIS). LFA also has potential application at a regional level through its use in conjunction with information generated by GIS. GIS tools with the capacity to operate at both the farm and regional level also allow for the monitoring of the results from changes in farm and land management practices. These might include such environmental goals as maximum water retention and minimal erosion and leakiness. It would also allow for the evaluation at a regional level of soil microbial testing and LFA.
Results/key findings
In the process of identifying agri-industries existing among the diverse landholdings, and documenting their economic, social and environmental impacts, this project has confirmed that despite the tacit support of local government, farmers in this region are under considerable pressure. The establishment of Hawkesbury Harvest has been significant for providing support for marketing and branding of regional products, but more initiatives are needed. Despite the recommendations of the Hawkesbury
x

City Council’s HARtDaC report (2005), local government planning remains confused and contradictory in terms of the support for and retention of agri-industries in the region. Nonetheless the very diverse modes of production as exemplified in the four different farming operations discussed in the report suggest that there is considerable resilience in the production systems.
A significant innovation arising from the project has been the application of organic waste conversion and the technique of using waste wood as the substrate for mushroom production which in turn leads to valuable mulch with anti-nematode properties. The enthusiasm at field trials for adopting the approach reflects both its commercial potential and the demands for more sustainable land management strategies. It is encouraging in terms of producers taking a high level of ownership of this new initiative. It also reflects the potential of integrated biosystems to not only provide new product ranges to existing farm operations, but also to enhance environmental management at the farm level.
Landscape Function Analysis provides a tool for farm-based monitoring of key environmental indicators, and is an easily applied methodology. Erosion, loss of nutrients, and inefficient water management, are all aspects of the ‘leakiness’ of a farm system. However this project has demonstrated that most of the farming systems are performing reasonably well when measured against the optimal ecosystem services provided by the surrounding natural environmental. This ecosystem service is an important role that agri-industries can play in the critical buffer zones between urban development and the GBMWHA. Linked, as we have argued, to the capability of Geographic Information System, both farmers and regional land managers should also be able to monitor the impacts of both climatic change and the effectiveness of adaptive or remedial actions.
Implications for relevant stakeholders
Overall, the results of this project will be important in guiding new activities and approaches which improve agricultural productivity and also complement and enhance the values of the neighbouring World Heritage areas and the Hawkesbury-Nepean River System. Agri-industries and regional land management agencies need innovative tools and strategies to address the challenges of not only urban development, but also changing climatic conditions and environmental need for low emission production systems. In this respect the three tool sets developed as part of this project provide a starting point, including the development of innovative enterprises compatible with environmental sustainability and existing industries.
Opportunities for producers include mushroom products in mixed horticulture systems as a means of converting organic wastes into products, while contributing to overall resilience. Also, the simplicity of Landscape Function Analysis means that producers have a new means of monitoring the environmental impacts of their production systems which complements established methods for nutrient management. The implications for policy makers include being able to quantify the contribution that these production systems make in terms of ecosystem services, and therefore help the development of regional planning processes that can assist in targeted policies that retain these agricultural systems and at the same time enhance landscape function.
xi

Recommendations
There is a need for:
1. Ecosystem services of agriculture and the impacts of urban development
1.1 Collection of comparative data on the ecosystem services of agriculture, in particular on:
• Impacts of the various types of existing agricultural uses and their relative values as providers of ecosystem services to the World Heritage Area and the Sydney Basin as a whole;
• Environmental impacts of urban development and subdivision such as urban run-off, protection of riparian vegetation and aquatic communities, and habitat loss.
1.2 State and local government to have greater appreciation of the diversity of farming modes in the region and of their contribution to regional ecosystem services. The benefits are demonstrated by the maintenance of values measured by LFA and monitored by GIS.
1.3 NSW DPI to use the project outcomes to help develop a regional identity and marketing strategy, and to serve a direct promotional function that also supports continuing agricultural production in the Hawkesbury-Nepean catchment. The project results can provide leverage for new and revised government policies that enable emergence and appropriate continuing operation of new and more sustainable agri-industries.
2. Development of a World Heritage buffer zone
2.1 Environmental advocates to consult with natural resource management personnel from agencies to facilitate desirable changes to land management practices surrounding the World Heritage Area and the development of a buffer zone.
2.2 Researchers to obtain more comprehensive land use data from a wider sample of landholders and agricultural practices, including a comparative analysis of:
• Their relative functioning as an effective buffer for the World Heritage Area.
• The minimum size of buffer areas required for adequate protection of World Heritage Area values.
3. Future land use changes
3.1 Local natural resource management agencies to provide input to reviews of Local Environment Plans (LEPs) regarding the protection of the natural values of the WHA.
3.2 Hawkesbury City Council to build understanding of potential future changes to land use in the region (including urban development), involving a large-scale survey with in-depth interviews with landholders.
4. Tools for landscape-level environmental management
4.1 Development of the three tools (organic waste conversion, landscape function analysis, geographic information systems) into an integrated package for use by landholders to address farm and rural landscape-level environmental management. This development was requested by landholders involved in the project but was not possible within the timeframe of this project.
xii

4.2 Organic waste conversion
4.2a DPI to explore as a suitable model the establishment of a local co-operative or technical support service charging a fee-for-service to end-users, for identification of appropriate bioremediation agents for horticultural wastes, such as mushroom cultivation – where spawn are provided (under sterile conditions) to businesses along with methodologies for use.
4.2b As an alternative to 4.2a, to explore a more communal system of non-sterile spawn production and provision for growers (in view of the non-competitive nature of the fruit growers’ different production and marketing strategies and because mushroom production would be a minor activity of the growers). This would reduce costs to growers and encourage co-operation between participants in the scheme. In the longer term a new enterprise development in the form of nodal networks of participants or a potential commercial investor might also be explored.
4.2c Further research into simplifying spawn production methods and the outdoor cultivation of specialty mushrooms.
4.2d Further work on strain selection and optimisation, together with research into the suitability of other specialty mushrooms that might be appropriate for the woody wastes of the Hawkesbury region.
4.2e Local grower associations (eg Hawkesbury Harvest) to disseminate information concerning the economic and environmental benefits demonstrated in this project, to encourage adoption by other growers and inviting participation in the development of broader strategies covering more growers and waste streams.
4.3 Landscape function analysis (LFA)
4.3a LFA specialist to promote LFA as a useful methodology for orchardists and other agri-industry landholders in the region. A program could be coordinated (with Hawkesbury Harvest as an umbrella organisation) in which participants use LFA to:
• Inform management decisions of the environmental benefits or weaknesses of production systems;
• Embark on a documented program of continuous improvement to reduce the leakiness of land use;
• Provide evidence for their environmental stewardship that can then be used as a contrast to alternative land uses.
In particular:
4.3b Conduct LFA training with participating landholders and land management agencies in the area.
4.3c Devise a group monitoring and continuous improvement program that might involve regular LFA measurements of different orchard systems that already exist, and possibly a program of experimentation with innovations that might reduce leakiness as measured by LFA.
4.3d Conduct field days or information sessions on progress, and encourage other groups to join.
4.3e Develop a GIS layer that shows LFA values across the region, allowing comparisons between alternative land uses.
4.3f Generate a time series that shows changes in LFA values.
4.3g Develop ways of forecasting likely effects of new developments on the region’s landscape function as a predictive tool to identify potential problems.
xiii

4.3h Incorporate LFA into LEPs to manage impacts/risks of changes in planning regulations and to inform the planning process.
4.4 GIS Applications
4.4a DPI and Hawkesbury City Council (in conjunction with farming groups) to support the development of assessable GIS applications (ARCVIEW) for monitoring environmental change across the region.
4.4b GIS and LFA specialists to explore the potential links of GIS to LFA data, for both bush and rural landscapes, in relation to ecosystems services and catchment functions.
4.4c Researchers to incorporate climate change assessment into monitoring, and establish bio-monitoring regimes to help the farming and agri-industry groups better adapt to changing environmental conditions.
xiv
Introduction The one million hectare Greater Blue Mountains World Heritage Area (GBMWHA) lies to the west of Sydney, Newcastle and Wollongong. In 2000, the area was added to the World Heritage list on the basis of the global significance of its endemic eucalypt ecosystems. The Blue Mountains World Heritage Institute was established in 2004 as a non-profit organisation to support and promote the conservation of the cultural and natural heritage of the World Heritage Area through research, community engagement and advocacy. Recognition of the pressures of urbanisation and land use change around the boundary of the World Heritage Area prompted the Institute to initiate this project in conjunction with its partners, the Universities of New South Wales and Western Sydney.
This study investigated the proposition that there is an important landscape niche and role for agri-industries as a buffer between the encroaching urban sprawl of Sydney and the GBMWHA. A range of previous studies have addressed the complex range of pressures on agriculture in the Sydney Basin, with implications developed in relation to planning and policy needs, opportunities for alternative marketing strategies, and potential new products. This study took a systemic and adaptive methodological approach to address the complex range of drivers of change such as socio-economic and urban development pressures and the need for ecological sustainability, to build upon the identified diversity and range of production and marketing strategies that characterise the Hawkesbury Nepean region.
Recent debates on the role of agriculture in the landscape have increasingly reflected relationships between the products and services generated. As well as production and marketing strategies for agricultural products, the relationship of agriculture to ‘ecosystem services’ has become a critical area of interest. The methodology developed here has drawn upon newly emerging analytical tools relating to ecosystem services in agricultural landscapes.
1.1 Threats and opportunities for agri-industries in the study area
Australia has not developed a deeply embedded tradition of retaining rural lands beyond its cities as valued economic, ecological and social resources. They have not been accorded the same status (in legislation, in planning, and in collective community consciousness) as lands within National Parks, World Heritage Areas or even urban open spaces and parklands within our cities. They have generally been regarded as ‘lands in waiting’ for some other higher or more pressing purpose, including in particular urban and peri-urban development. As a consequence ‘agriculture’ undertaken on these lands has been historically regarded as a ‘transient land use’. This is at the heart of the challenge faced by agriculture in and around the Sydney Basin, along with the reality faced by this project, that sustaining agricultural lands is more a political process than a research process.
Over the past decades, a number of studies and workshops have discussed the challenges faced by agriculture in and around the Sydney Basin (eg Hawkesbury City Council 1997, Kelleher et al. 1998, Sinclair et al. 2001, Mason and Docking 2005, Hawkesbury City Council 2005; Docking et al. 2006). This section introduces the key challenges identified in these studies, along with the emerging adaptive strategies.
The need for a strategic approach to planning for agriculture as a critical component of the expansion of our cities is clearly recognised in recent literature. Although the general attitude has been of traditional agriculture as a transient land use, there is now a growing call to better understand the multiple benefits of agriculture in the Sydney Basin and the complex issues regarding the retention of agriculture, and the need for more creative, adaptive planning. In the Sydney region there has been an almost unstoppable trend towards alienation of prime agricultural land from mainstream agriculture as a result of urban encroachment and rural residential development. According to Kelleher et al. (1998),
1

this trend is adversely affecting the state agricultural resource base, and that “agricultural land use studies by local government typically take an urban planning perspective, with an apparent tacit acceptance that rural residential subdivision will eventually occur” (p4).
There are a considerable number of people choosing to reside in the Hawkesbury area because of the ‘rural atmosphere’. The results of surveys by Hawkesbury City Council (HCC 1997) indicate that maintaining the rural character and the country atmosphere of the region are of primary concern and considered to be very highly valued aspects of life in the area. Although the rural character of the area is highly valued, problems arise because there is little understanding of agriculture’s economic contribution and the activities necessarily associated with agriculture (Mason et al. 2006). One potential outcome of this “urbanite” attitude towards the rural landscape is that it could be used to support an argument for protection of the land in terms of its value as a community amenity and open space. Such an approach would mean the land would be “sterilised and quarantined from all productive uses” (Kelleher et al. 1998 p12). Kelleher et al. argue for the conservation of agriculture on the peri-urban fringe on the grounds that there is considerable evidence to support its importance economically as well as in terms of its protection of catchments and preservation of environmental and scenic amenity.
“Agriculture adjoining parkland, however, fills an important role in the Hawkesbury landscape by buffering parkland from the impact of urban development. It provides a transition zone in which the visual impact of urban development is reduced and it can provide important environmental services, such as water quality protection and air quality maintenance. Agricultural land also provides an ecological buffer and can act as a refuge and protective zone for wildlife” (Kelleher et al. 1998, p76).
The increasing recognition of agriculture is reflected in Sydney’s Metropolitan Strategy (DIPNR 2005) which states that “greater recognition will be given to non-urban land so that it is not treated as land ‘in waiting’ for urban development”. It is instructive to note however that the description of these lands as ‘non-urban’ tends to reinforce the assertion by Kelleher et al. (1998) that agricultural land use planning tends to be framed through an urban planning paradigm, which does not take into account the cultural and conservation imperatives associated with the GBMWHA.
Notwithstanding its reference to non-urban land, Sydney’s Metropolitan Strategy does reflect the significant emergence of ‘new recognitions’ regarding the economic, ecological and social importance of agriculture in the Sydney Basin, and a greater institutional preparedness to respond to the complex challenges facing agriculture in more adaptive and sophisticated ways.
The 1998 Strategic Plan for Sustainable Agriculture – Sydney Region (NSW Agriculture 1998) has also played an important role in the development of this new recognition and responses.
Of equal significance is the emergence of local advocacy initiatives that reflect the agricultural community’s recognition that a broader, more integrated community network approach is essential to promote agricultural products, influence policy and planning and improve consumer awareness of the multiple values and benefits of agriculture. According to Mason and Docking (2005), the overarching goal is to provide an economic, social and environmentally sustainable agricultural industry that has wide community and sectoral support. Significantly, this integrated community network approach has the potential to be far more significant if it catalyses more informed community discourse around (i) the value of local agriculture in a carbon constrained economy (including concepts such as ‘food miles’), and (ii) the strategic importance of local agriculture in terms of minimising disruption to food supply in the event of crop failures in other areas (through drought, hail, frost and other climatic events).
1.1.1 Farming diversification, clustering and network development
Hawkesbury City Council initiated the "Hawkesbury Agricultural Retention through Diversification and Clustering" (HARtDaC) project to address agricultural opportunities in the region that could assist
2

in the retention of agriculture (Hawkesbury City Council 2005). This project investigated options for farming diversification and clustering, and opportunities to enhance agricultural activity through farming networks. Changes facing agricultural industries were critically reviewed, broadly and locally, along with socio-cultural and economic analyses. The HARtDaC study identified the landscape diversity as a natural asset, while also further complicating management.
The area is rich in natural resources and scenic amenity. The potential impacts on these resources with the decline in agriculture and the expansion of urban areas is significant, with agriculture playing a valuable role in the preservation of environmental and scenic amenity” (Hawkesbury City Council 2005, p167).
Key issues impacting upon agricultural retention were identified by the project as including:
• The high comparative price for land with subdivision potential compared with land used for agriculture;
• Reducing terms of trade associated with increasing efficiencies in food production and decreasing average lot size;
• The potential for escalating conflicts within the community, particularly with respect to noise, dust, water and odours;
• The role of changes in density of occupation and subdivision and its influence on land use conflicts, rural amenity, regional tourism, and natural resources;
• Long-term land degradation caused by inappropriate land management practices.
The HARtDaC study undertook a thorough and systematic investigation of strategies for agricultural retention based upon a conceptual framework of critical ‘decision fields’ relating to socio-cultural, politico-administrative, and environmental dimensions (Tables 1.1 and 1.2). In terms of the socio-cultural context, the key problem was interpreted to be the lack of awareness of the contribution of agriculture, together with intensive subdivision characteristic of some parts of the Hawkesbury which could lead to increased land use conflicts and “…if reflected in the management of the region, may also result in inappropriate forms of governance” (Hawkesbury City Council 2005, p153). Regarding the politico-administrative dimension, the HARtDaC study reflected a very complex regulatory structure resulting from the multi-tiered political system. Local stakeholders highlighted three key concerns: “…unclear regulatory structure, regulations and processes not informed by agriculture; and the need for more support for agricultural innovation during the planning process” (Hawkesbury City Council 2005, p156). For the economic decision context, the primary issue was that while agriculture contributes considerably to the regional economy, peri-urban agriculture was characterised by reducing viability associated with increases in land values, ongoing reduction of farm sizes, and therefore an increased reliance by most farm families on off-farm income.
3

Table 1.1 Summary of the economic, socio-cultural, environmental and politico-administrative issues identified for agriculture in the Hawkesbury Region
Socio-cultural issues Politico-administrative issues
• Increasing potential for land use conflicts
• Limited public awareness of benefits of agriculture
• Changing demographics and skill sets of the community
• Demands of population growth
• Complex legal and regulatory structures.
• Perception that Council regulations and processes don’t support agriculture
• Perceived need for increased support for agricultural innovation in Council planning process
Economic issues Environmental issues
• Reducing economic viability of peri-urban agriculture
• Rising land values.
• Changes in key economic drivers associated with decreasing farm size
• Significant contribution of Agriculture to the local economy.
• Impact of land use change on the environment and scenic amenity
• Increasing climate variability
• High demand for water resources
• Highly variable landscapes resulting from human intervention
Source: Hawkesbury City Council 2005
Table 1.2 Relationship between decision-making fields and strategic directions
Decision-making fields Strategic directions Socio-cultural Increase awareness of the full contribution of agriculture to the community, and
interaction and understanding between urban and rural communities. Encourage the development of training and extension programs that identify and respond to the changing needs and resources of the agricultural communities.
Politico-administrative Develop a regular, positive, two-way communication with the agricultural community particularly in the development and communication of regulations, policies and opportunities. Provide increased support for innovation and collaboration in agriculture.
Economic Support diversification, collaborative marketing and production, and local food systems. Support the development of community groups and projects that encourage collaboration, innovation and education.
Environmental Encourage the efficient and sustainable use of water. Encourage farmers to take a risk management approach to the potential constraints and opportunities posed by climate variability and change.
Source: Hawkesbury City Council 2005
The report emphasised the need for the development of ‘soft’ infrastructures for research and development. “Face to face contact, however, remains an essential ingredient in the development of knowledge-based skills and enterprises. The heart and soul of the new economy is tied to place. The quality of life in our metropolises and access to lifestyle places in rural and regional Australia is critical to attracting and retaining knowledge workers” (Hawkesbury City Council 2005 p12).
4

A key action recommended in the HARtDaC report was:
“Establish a trial facilitation process for the development, approval, and promotion of farm scale projects/proposals for agricultural land that are considered innovative and collaborative; this process should: • Be developed in collaboration with the agricultural community to ensure barriers are
identified and addressed; • Include a review of current systems to ensure burdens on small area farmers is not
excessive; • Explore potential for developing a system of seed grants in collaboration with regional
research and funding bodies; • Incorporate a monitoring and evaluation system to ensure responsiveness to feedback
from participants and funding bodies.” (Key action 4.1)
1.1.2 Land use planning
Sinclair (2001a) divided rural residential development into two parts: the rural urban fringe, or development that is within the servicing catchments and located close to the urban centre, and rural living, or residential use of land within a rural environment. Both types use rural land for residential, as opposed to agricultural purposes, and can be distinguished from urban housing by the larger lot sizes and distance between dwellings. Rural residential development is increasingly common on the fringe of metropolitan areas and the Hawkesbury City Council is typical of many local councils in that it is required to find ways to deal with this very complex local planning issue. Sinclair (2001b) argued that rural residential development can have both positive and negative impacts on an area. Positive impacts include lifestyle choice, provision of land for businesses needing space for storage and potential contribution to the land economy. These are outweighed by such negative impacts, in Sinclair’s view, as: the increased financial costs of a scattered settlement pattern; community costs relating to provision of services and facilities located at a distance from town centres; and environmental costs connected to the initial development (for example, clearing of native vegetation, soil erosion and land degradation). In addition, problems associated with the ongoing use of the land include the impacts of onsite effluent disposal, soil and water management, weed invasion and domestic pets (Sinclair 2001 b).
Given the above experience of issues resulting from intensive agriculture meeting rural residential living head-on, it is clear that land use planning, particularly with reference to lot sizes, subdivision and zoning objectives, is of paramount importance to maintaining agricultural land on the urban fringe. There is an abundance of international, national, state and local land use regulations that have bearing on the land use planning process, especially in areas that presently act a as buffer to the GBMHWA (Table 1.3). Local government authorities are required to juggle the competing interests of those seeking a rural residential lifestyle and those attempting to maintain the agricultural productivity of the peri-urban fringes.
The local planning context in Sydney is complicated by two particular dimensions, these being local emerging land use planning within the local political context, and state wide pressures to standardise local governmental environmental planning instruments. A number of Councils are developing useful steps toward responding to their particular local situation, but this has occurred in the context of local polarities in perspectives towards development. Examples include the Gosford/Wyong 2001 Local Environment Plan, which aims to cluster rural agri-tourism to prevent land use conflicts and impacts on agricultural investment. The Hawkesbury 1989 Local Environment Plan has included modifications to advertising structures to accommodate farm gate sales (Mason and Docking 2005). The 1997 Hawkesbury Sustainable Agriculture Development Strategy provided a first stage of a Rural Lands study for Hawkesbury. It contributed to the recent amendment 108 of the Hawkesbury LEP to ensure that agriculture was preserved and encouraged in the Hawkesbury. Amendment 108 enables changes to the zone names, objectives and land uses in the rural and environmental protection zones, but does not change the minimum lot sizes for subdivision (Hawkesbury City Council 2005).
5

Table 1.3 National, state, regional and local policy context for land use planning
International and national context
• Treaties and agreements relating to environment, conservation and heritage (including that relating to World Heritage Areas);
• National Strategy for Ecologically Sustainable Development;
• National Strategy for the Conservation of Australia’s Biological Diversity;
• National Heritage Trust Act 1977;
• Environment Protection and Biodiversity Conservation Act 1999.
State legislative context
• Local Government Act 1993;
• Environmental Planning and Assessment Act 1979;
• Water Management Act 2004;
• Heritage Act 1977;
• Fisheries Management Act 1994;
• National Parks and Wildlife Act 1974;
• Rural Fires Act 2002;
• Threatened Species Conservation Act 1995;
• Ongoing NSW planning reforms – including standardisation of local environment plans.
Regional policy context
• Meeting the Challenges – securing Sydney’s water future: the Metropolitan Water Plan;
• Shaping our Cities – the Sydney Metropolitan Strategy;
• Shaping Western Sydney (regional planning strategy for Western Sydney);
• Strategic Plan for Sustainable Agriculture – Sydney Region (1998);
• Sydney Regional Environmental Plan No 20 – Hawkesbury Nepean River;
• Hawkesbury – Nepean Scenic Quality Study;
• Agricultural Study of the Greater Sydney Region (Dept. Agriculture 1980s);
• From the outside looking in: the future of Sydney’s Rural Land (Sinclair et al. 2004)
Local context in the Hawkesbury
• Hawkesbury Local Environment Plan 1989;
• Hawkesbury Development Control Plan 2002;
• Our City, Our Future Strategy (community consultation regarding vision for Hawkesbury);
• Hawkesbury Sustainable Agriculture Development Strategy 1997;
• Impact of Rural Subdivision on Agriculture Study (Kelleher et al. 1998). Source: Hawkesbury City Council 2005
1.1.3 Transforming urban agriculture
Development of a new urban agriculture is resulting from significant transformation in action and thinking. New product and marketing strategies are developing, along with recognition of the ecosystem services provided by agricultural landscapes. Concepts of agro-ecosystem resilience are emerging as useful tools to inform and guide transformational change in agricultural enterprises, industries and landscapes. These transforming processes have set the context for the development of this study and informed its methodology and implementation.
6
Emerging product and marketing strategies
Urban agriculture is an emerging theme that looks to the integration of agriculture into urban landscapes. Mason (2006) identified a number of key transforming themes emerging worldwide, including: local food; direct marketing; innovation and adaptability of urban agriculture; the urban agriculture / public health relationship; and agricultural land preservation. As shown in Figure 1.1, the diversified nature of differing forms of urban agriculture generate broad-ranging economic, environmental and social values. However, the classic problem is that many of these intrinsic social and environmental values are not adequately reflected and accounted for in formal institutional, market and decision-making arrangements.
This new urban agriculture is described by Butler and Maronek (2002) as leading to a range of other benefits and services including recreation and leisure, economic vitality and business entrepreneurship, individual health and well-being, community health and well-being, landscape beautification, and environmental restoration and remediation.
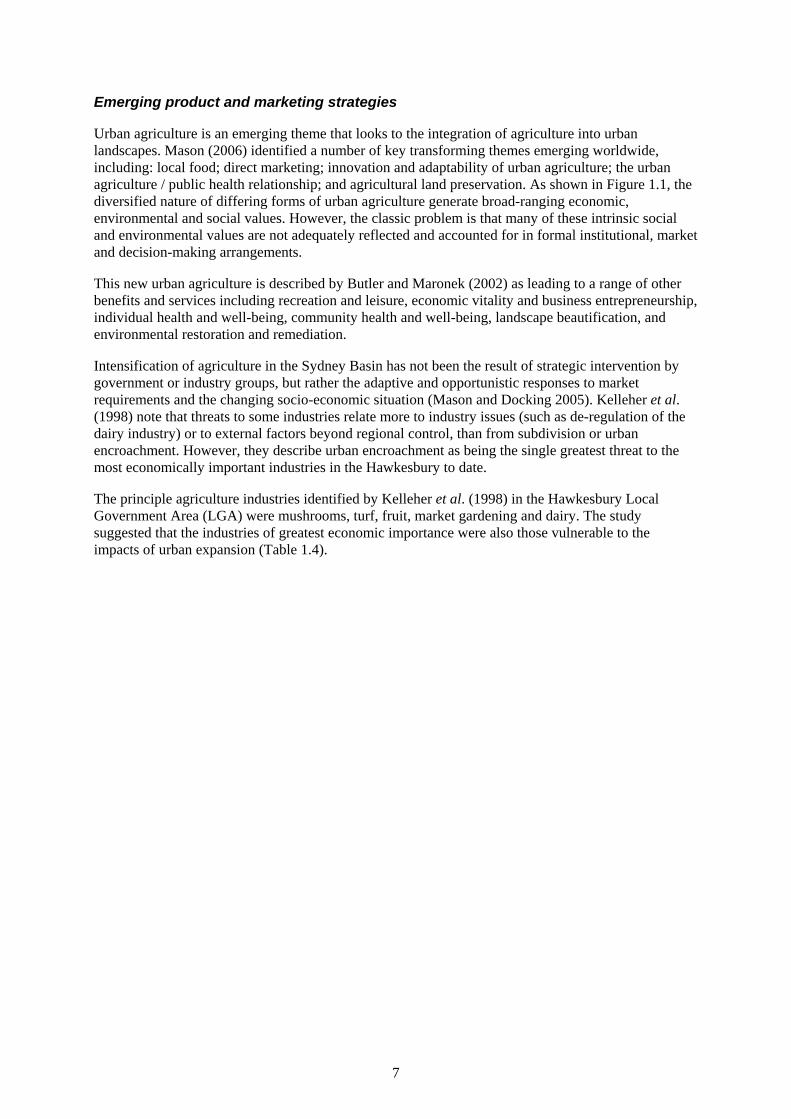
Intensification of agriculture in the Sydney Basin has not been the result of strategic intervention by government or industry groups, but rather the adaptive and opportunistic responses to market requirements and the changing socio-economic situation (Mason and Docking 2005). Kelleher et al. (1998) note that threats to some industries relate more to industry issues (such as de-regulation of the dairy industry) or to external factors beyond regional control, than from subdivision or urban encroachment. However, they describe urban encroachment as being the single greatest threat to the most economically important industries in the Hawkesbury to date.
The principle agriculture industries identified by Kelleher et al. (1998) in the Hawkesbury Local Government Area (LGA) were mushrooms, turf, fruit, market gardening and dairy. The study suggested that the industries of greatest economic importance were also those vulnerable to the impacts of urban expansion (Table 1.4).
7

Figure 1.1 A continuum of urban agriculture in the Sydney Region and associated values/benefits
Source: Mason and Docking 2005
8
Table 1.4 Assessment of outlook and threats to agri-industries in Hawkesbury 1997
Industry Outlook Threat Poultry Dairy
Piggeries Market gardens
Flowers Turf
Mushrooms Nurseries
Beef Orchards
Uncertain Intensification
Decline Stable
Intensification Stable
Uncertain Intensification
Stable Expansion
Urban encroachment Industry issues
Urban encroachment Extractive industries
Environmental Extractive industries / industry viability
Environmental Industry economics
Environmental
Source: Kelleher et al. 1998
Worldwide, small area farming and agri-industries continue to develop new means of diversification. These include niche markets and new agri-industrial configurations, and clusters of local produce sold directly to consumers are becoming more common. This provides a greater proportion of the consumer dollars to the producer, along with the social benefits of increased communication and understanding across the urban / rural divide. With consumer tastes and demands also driving larger agri-industries, these direct marketing options provide a means for greater expression of consumer preferences for production strategies that are environmentally and socially responsible. Alternative strategies mentioned in the HARtDaC study include: developing new skills to incorporate tourism, recreation and related value adding to produce; alternative systems such as permaculture and organic produce; cooperative marketing and supply chain management.
A local example is that of Hawkesbury Harvest (HH), which seeks to promote better community access to locally grown food, enabling opportunity for diversification of income. Mason and Docking (2005) describe the Hawkesbury Harvest model as encompassing industry clustering, industry development, small business development, income generation, community gardens, controlled environment intensive horticulture, matching local climate to crops and markets, farmers markets, agri-tourism, research and education and training through extension. The overarching goal of HH is to provide an economic, social and environmentally sustainable agriculture industry that has wide community sectoral support.
Agricultural ecosystem services
Ecosystem services are described by Daily (1997) as the conditions and processes through which natural ecosystems, and the species that make them up, sustain and fulfill human life. On the basis of this definition, ecosystem services are a way of thinking about the fundamental ecological processes and capacities that enable our economies and societies to operate. This study seeks to investigate the important role of these ecosystem services provided by agri-industries in their role as landscape buffers around areas of significant natural and cultural heritage such as the GBMWHA. A critical issue for this study is that while the goods generated by agri-industries are accounted for and valued, broader environmental services that are generated tend not to be accounted for and therefore explicitly incorporated in policy and planning.
Some ecosystem services can be considered as ‘umbrella services’ supporting a nested hierarchy of other services which are contingent upon them. One example would be those functions and processes under the rubric of soil health. These reflect the ecosystem functioning of soils and support many of the buffering mechanisms and transformations. In the investigation of ecosystem services in the Goulburn Broken Catchment by CSIRO (Table 1.5), soil management was identified as perhaps the single most significant on-farm ecosystem service issue in the catchment (Binning et al. 2001).
9

Table 1.5 Key issues in the Goulburn Broken Catchment
• Integrating management across ecosystem services
• Managing land use intensification
• Managing transitions in land use
• Managing vegetation – a hub in the landscape
• Managing cultural, heritage and option values
• Maintaining soil health
• Accounting for the value of non-agricultural land and water uses
• Managing water and salinity
• Anticipating and adaptively managing emerging issues
Source: Binning et al. 2001
While studies of ecosystem services have been undertaken at a range of scales, the key interest of this study is the nature of these services generated on-site within agri-industries that contribute to regional and landscape functions. It is recognised that there is an interdependent relationship between local and broader scales. The general ecosystem services described by Cork et al. (2002) included: pollination; life fulfillment; regulation of climate; pest control; provision of genetic resources; maintenance of habitat; provision of shade and shelter; maintenance of soil health; maintenance of healthy waterways; water filtration and erosion control; regulation of rivers and groundwater; and waste absorption and breakdown.
A study of agricultural landscapes by Swift et al. (2004) was found to be particularly useful in providing a framework for understanding the more local aspects of ecosystem services generated by well-managed agro-ecologies, with particular focus on soil and microbial roles. Table 1.6 shows related broad ecosystem services with particular ecosystem functions and functional ecological groups that generate these functions (Swift et al. 2004).
10

Table 1.6 Ecosystem services and functions in agricultural landscapes
Ecosystem services Ecosystem functions Key functional groups Decomposition Decomposers Nutrient cycling Elemental transformation Transformers (bacteria) Soil OM synthesis Ecosystem engineers (macro fauna,
termites, earthworms, fungi, bacteria) Regulation of water flow
Soil structure regulation Ecosystem engineers Soil protection Plants Soil OM synthesis Decomposers
Regulation of soil and sediment movement
Soil structural maintenance Ecosystem engineers Pollination Pollinators (insects, birds, bats) (primary
regulators) Herbivory Herbivores (primary regulators) Parasitism Parasites (primary regulators) Micro-symbiosis Micro-symbionts (primary regulators)
Regulation of biological populations including diseases and pests
Predation Hyper-parasites, Predators (secondary regulators)
Decomposition Decomposers Detoxification of chemical and biological hazards incl. water purification Transformation Elemental transformers
Regulation of atmospheric composition and climate
Greenhouse gas emission Decomposers, Transformers, Plants, Herbivores
Source: Swift et al. 2004
The complexity of interactions between tolerances in ecosystems and the driving processes of markets and other institutions for planning, management and governance is becoming well recognised (eg. Cork et al. 2002), though difficult to deal with methodologically. Previous studies such as those undertaken by the CSIRO (eg. Binning et al. 2001, Cork et al. 2002, Abel et al. 2003) recognised the importance of methodological approaches which combine participatory approaches, along with a suite of varied support analytical methodologies, within a range of case studies. Due to the nature of this complexity, the methodological approach taken in this study was adaptive, beginning with broad qualitative means of investigating the dimensions of the situation, and refining to particular methodological means to support key areas of potential advocacy that emerged.
Resilience in agricultural livelihoods and landscapes
The concept of resilience has become increasingly used in relation to the ability to sustain critical processes in the face of uncertainty and turbulent change. This includes capacities and tolerances at a personal and institutional level, along with the underpinning ecological process within which our societies and economies function. Therefore, resilience is also a key dimension in newly emerging concepts relating to social-ecological systems. Following the emergence of perspectives of adaptive management initiated by Holling (1978) the worldwide Resilience Alliance has sought to extend conceptions initially applied to ecological and regional systems to broader social and institutional contexts. Contributors to the conceptual development of this newly emerging focus on ‘resilience management’ include Australian researchers at CSIRO’s Wildlife and Ecology program.
The following sections outline a brief overview of the conceptual framework developed by the Resilience Alliance. Recent Australian research in this area has included capacity building and the resilience of particular industries, such as the work of Boxelaar et al. (2006) in relation to dairy farmers. Preliminary suggestions regarding critical characteristics contributing to resilience are shown in Table 1.7. These characteristics generally reflect both individual attributes regarding change, along with a sense of connectedness and diversity.
11

Table 1.7 Attributes of individuals and social systems that contribute to resilience
Individual attributes Attributes of the social system
• Willingness to face ‘reality’ of uncertainty and ambiguity
• Ability to make meaning of events in a way that builds a bridge to the future
• A concept of self that is compatible with the current structural changes in agriculture
• Sense of self-efficacy
• Inventiveness
• Social and institutional connectedness
• Environmental efficacy
• Networks
• Institutional arrangements
• Recognition of mutuality and interdependence
• Diversity.
Source: Boxelaar et al. 2006
Resilience is also a key dimension in newly emerging concepts relating to social-ecological systems. Following the emergence of adaptive management initiated by Holling (1978) concept, initially applied to ecological systems, has been extended to address complex social and institutional systems.
Adaptive management and the panarchy
One generic model of transformational change is that of a ‘panarchy’. This model has been developed by members of the worldwide Resilience Alliance through their work on complex systems and adaptive management (Gunderson and Holling 2002). The resultant model, the panarchy, is posed as an integrative theory of scale and discipline, with key properties of potential, connectivity, and resilience. While the model is almost so general to be more like a metaphor of change, it has been used as a testable dynamic against a range of transformational changes in systems embracing people in their natural environment. In essence, the panarchy has two key aspects: a nested hierarchy of critical processes operating at different scales and speeds in a nonlinear fashion; and an adaptive cycle reflecting phases of exploitation, conservation, creative destruction, and renewal.
Nested cycles and variables
Based initially on ecological applications, it has been found that hierarchical structures are regulated by a small set of processes, each at particular frequencies and spatial scales. Examples include the small and fast scales of biophysical processes that control plant physiology; larger slower patch dynamics with competition for resources influencing; meso-scale processes such as fire which determine successional dynamics; and larger scale changes such as climate influencing ecological processes over millennia. While initial applications focused on ecological cases, the work of the resilience alliance over the past decade has increasingly considered questions of resilience in socio-economic and institutional systems. A summary of key variables for a range of systems is shown in Table 1.8.
12

Table 1.8 Examples of key variables and speeds for a range of systems
Variables System Fastest Slower Slowest Forest-pest dynamic
Insect Foliage Tree
Forest-fire dynamics
Intensity Fuel Trees
Savanna Annual grasses Perennial grasses Shrubs and grazers Shallow lakes and seas
Phytoplankton and turbidity Seas grasses Grazers
Deep lakes Phytoplankton Zooplankton Fish and habitat; phosphate in mud
Wetlands Periphyton Saw grass Tree island; peat accreation Human disease Disease organism Vector and susceptibles Human population Social action Allocation of resources
(structures of domination) Rules and norms (structures of legitimation)
Developed myths (structures of signification)
Institutions Operational rules Collective choice rules Constitutional rules Economies Individual preferences Markets Social institutions Developing nations
Markets Infrastructure Governance
Societies Allocation mechanisms Norms Myths Knowledge systems
Local knowledge Management practice Worldview
Source: adapted from Holling et al. 2002
Phases and interactions in the adaptive cycle
The adaptive cycle is described in relation to four general phases: exploitation ( r ), conservation ( K ), creative destruction ( Ω ) and renewal ( α ) (see Figure 1.2). The key feature identified from ecological systems was that change is neither gradual nor chaotic, but episodic, with the slow accumulation of natural capital punctuated by sudden releases and reorganisation. This cascading panarchical collapse is due to a period of success leading to the accumulation of rigidities and brittleness. The exploitation phase is represented by r, reflecting opportunist strategies (e.g. ecological r strategists, entrepreneurial markets), slowly leading to increasing conservation of capital (K) and increasing connectedness and related rigidities ( e.g. ecological K strategists, bureaucracies). Release or creative destruction occurs rapidly (Ω) (e.g. fire) along with a rapid reorganisation or renewal phase (α) through pioneer species, innovation and restructuring, or social transformation.
Figure 1.2 Phases in the adaptive cycle
Source: Holling and Gunderson 2002
13

The interactions between panarchies at different scales (Figure 1.3) is also fundamental, with faster cycles of renewal creating revolt, or diffusing larger episodes of creative destruction, and ‘biotic legacies’ or memory from larger slower cycles can contribute to the reorganisation. The changes in rates of processes, both through the adaptive cycle, and through buffering and interactions of faster and slower cycles, can also lead to maladaptive cycles and ‘traps’. One example of a maladaptive cycle is a ‘rigidity trap’ where highly rigid ‘hierocracies’ are sustained, in human systems reinforced by power, politics and profit. The utility of a model such as panarchy may be in interpreting management or policy intervention in terms of conserving the ability to adapt and respond in a flexible manner to uncertainty and surprises, buffering disturbance and creating novelty (Holling et al. 2002).
Figure 1.3 Interactions of dynamics at different scales
Source: Holling and Gunderson 2002
The key value of the framework outlined above is as a potential ‘framework of interpretation’ for considering the complex individual, social and ecological dimensions of issues involved with agri-industries and their broader regional context.
1.1.4 Integrative methodologies for engagement and policy advocacy
In engaging the complex issues of landscape management, a range of integrative conceptual frameworks continues to be developed. Common to these frameworks is a systemic view of the properties that emerge from the interactions between biophysical, ecological, and socio-cultural facets of people living in their landscapes. Investigations seek to understand critical dynamics of the situations faced in farming communities, and how policy responses can be designed to enable more sustainable paths of management. In Australia, integrative conceptual and policy frameworks have reflected trends worldwide, including:
• Landcare as a social movement reflecting fundamental needs for participative governance and stewardship of our agricultural landscapes and production systems;
• Integrated catchment management, as institutional and policy responses reflecting the key inter-relationships of biophysical attributes;
• Growing interest in investigating sustainability through concepts such as resilience as applied to social-ecological systems;
14

• Interest in innovative institutional responses which address the underlying ecosystem services upon which agro-ecology is sustained;
• A recognition of the need to build upon and communicate between the range of contributing ideas and interests: scientific concepts and tools; diverse local experiential knowledge systems; and broader dialogues of public and political interest.
Agro-ecosystems as managed ecosystems are clearly complex and dynamic systems, with inter-related physical, biological and decision-making dimensions. This complexity poses a substantive methodological challenge in relation to considering the range of relevant drivers in any particular situation. One of the methodological approaches to integration involves models and concepts, enabling linkages across disciplinary boundaries (Antle et al. 2001). A number of investigations into ecosystem services in Australia have shown a pluralism of methodological approaches.
There is a broad literature on different frameworks for managing landscape ecologies. As well as differing scientific and technical perspectives there are the important questions of how these are translated into reproducible methods which can understood by the communities managing the local situations, and can be translated into institutional arrangements which support relevant practice. This reflects a broad-ranging debate on indicators of sustainability, and the need to connect technical exploration of known causes with policy processes ( McCool and Stankey 2004).
15
2. Objectives The objectives as stated in the original project proposal were:
• To identify the agri-industries existing among the diverse small and medium-sized farms and landholdings located along the north-eastern boundary of the Greater Blue Mountains World Heritage Area (GBMWHA), and to document their economic, social and environmental impacts;
• To take a partnership approach with industry, government and communities in the region, and facilitate new activities and approaches which improve agricultural productivity and also complement and enhance the values of the neighbouring protected conservation areas and the Hawkesbury-Nepean River System;
• To take an advocacy role in using regional and local economic, social, and environmental values and objectives as driving forces in developing economically viable and ecologically sustainable agri-industries;
• To adapt and apply what is learned from enabling processes (e.g. farm planning and Landcare) and ensure a high level of ownership of new activities and approaches through comprehensive and on-going participative processes.
Proposed outcomes of research
• New and improved opportunities for sustainable farm-based production, based on integrated technology systems and approaches which enhance economic productivity, consistent with regional and local environmental, cultural and social values and benefits.
• Strengthened partnerships and linkages between industries, local government, state agencies, rural and urban communities, with greater levels of ownership of solutions through positive and sustained participative processes.
• The partnerships and linkages will provide the basis for a suite of successful case studies and pilot studies demonstrating cost-effective and innovative mixes of current and new approaches towards sustainable production consistent with World Heritage and other regional and local values.
• Agricultural enterprises and rural communities understanding World Heritage values and devising consistent activities, management systems and best practices.
• Identified potential for developing clusters of sustainable agri-industries in the region and sustainable land use systems compatible with World Heritage values and catchment protection. A key long-term outcome of the project will be facilitating the use of innovative technology systems. For example, a system based on turning waste into resources, and developing clusters of industries with zero emissions, where the output from one industry becomes the input for another. The research will help industries determine which approaches are most appropriate and which should be pursued (e.g. integrated biosystems, organic waste recycle technology, aquaculture, stormwater reuse and recycling systems).
• Strengthened ecologically sustainable approaches with development and ownership of diverse but environmentally benign, small-scale peri-urban agricultural enterprises.
• Support for new and revised government policies that enable emergence and appropriate continuing operation of new and more sustainable agri-industries.
16

• Development of a regional identity and marketing strategy, with research outcomes serving a direct promotional function which also supports continuing agricultural production in the Hawkesbury-Nepean catchment.
• Increased regional employment through innovative enterprises that is compatible with environmental sustainability (e.g. reduced pesticide use and chemical run-off, reduced water use and increased water re-use) that is integrated within existing industries and enterprises.
17

3. Methodology Due to the need to initially identify what methods were appropriate for the case studies, the early methodological approach taken in this study was adaptive, beginning with a broad qualitative approach to assess the factors impacting on the farming community in the study area, and then identifying particular methodological approaches that were appropriate for the key areas as they emerged in the later phase of the study.
The role of agri-industries as landscape buffers to the neighbouring World Heritage Area was investigated in relation to resilience, communities of practice, and ecosystem services. The case study area was the ridgeline of Hawkesbury–Mount Tomah, which abuts and bisects the GBMWHA. An overall schematic of the methodology is given in Figure 3.1, which included the key steps below.
1. Interviews. A series of semi-structured interviews provided an initial basis for identifying the issues faced by local producers.
2. Representative case studies. Four diverse production and marketing strategies were drawn upon as detailed case studies, reflecting the diversity of viable production and livelihood strategies found in the area.
3. Tools. Three key areas of investigation emerged, based upon (i) the conceptual interests of this project, and (ii) opportunities identified in critical local literature and (iii) those identified in the initial semi-structured interviews. An outline of the methods for each of the tools is given below, with further details given in section 4.
(i) Organic Waste Conversion. Participatory testing and development in relation to organics recycling and low maintenance production of saleable fungal produce. The methodological steps (detailed in section 4.2.1) were:
o Identification and assessment of waste streams
o Identification of bioremediation agents for selected horticultural waste streams
o Fungal isolation and storage
o Development of waste remediation and mushroom production conditions
o Spawn production and growth trials
o Cost benefit analysis
o Field trials and demonstration for growers
(ii) Landscape Function Analysis (LFA). LFA is a methodology to assess the extent to which a hillslope retains its vital resources. It provides a means for assessing functional aspects of the ecosystem such as loss of nutrients and productivity, and was used here to make comparisons between different land uses practices. In this component of the project, LFA was adapted and tested as an indicator-based approach that both supports policy regarding the role of these agricultural systems as landscape buffers, and provides a potential means for simple ongoing monitoring. The methodological steps (detailed in section 4.2.2) in each site were:
o Brief site description and analysis.
o Lay transects and describe landscape organisation.
18

o Soil surface analysis.
o Calculation of stability, infiltration and nutrient cycling indicators.
Different sites were then compared as appropriate.
(iii) Geographical Information Systems (GIS). LFA has potential application at a regional level through its capacity to relate information generated to GIS. GIS tools with the capacity to operate at both the farm and regional level allow for the monitoring of changes in farm and land management practices. These might include such environmental goals as maximum water retention and minimal erosion and leakiness. It would allow for the evaluation at a regional level of soil microbial testing and LFA.
Figure 3.1 Overall methodological approach of the project
Issue
Role of agri-industries as landscape buffer neighbouring world heritage
Investigated in relation to Concepts
• Resilience • Communities of Practice •
Ecosystem Services
Grounded in
Case study
• Hawkesbury – Mt Tomah region • Four diverse production and livelihood strategies
Characterised through
Methods • Qualitative interviews • Semi-quantitative life cycle assessment • Quantitative microbial ecology • Landscape Functional Analysis (LFA) • Critical review of planning instruments
To Develop
Regional Scenarios
• Geographic Information Systems (GIS) • Worksho
ps with stakeholders and policy makers
Informing
Policy and Governance
19

4. Detailed results
4.1 Preliminary analysis
Drivers of change affect agri-industries at a range of temporal and spatial scales (Table 4.1). At a societal and international scale, processes of land use change and urbanisation contribute to the fragmentation of landscapes, reducing their effectiveness in absorbing the impacts of change processes. We would suggest that the policy response required to counteract this is one that recognises and enhances landscape functions and buffers, such as those provided by agro-ecosystems and agricultural landscapes. At a regional scale, these change processes are expressed as differential real estate values, and changes in market access for local products. The values marginalised in the process include established agri-industrial livelihoods and ecosystem services generated by these land uses (e.g. Figure 4.1). The policy need is one that identifies and supports agri-industries that contribute positively to ecosystem services.
At a local scale, these combined drivers contribute to a breakdown in the viability of rural and regional townships, along with the character of the people and their sense of community. Integrative strategies already emerging include the diversification of production and marketing. Within households, financial viability is affected, reducing lifestyle and economic choices, with diversified sources of household income becoming the necessary strategy.
Figure 4.1 Rural residential land uses near Enniskillen Orchard, Grose Wold
20

Table 4.1 Drivers of change in agro-ecosystems
Scale Dominant forces Values marginalised Potential integrative policies or strategies
Societal / international
Land use change; Encroaching urbanisation
Fragmentation of landscape and regional climatic processes
Role of agro-ecosystems as landscape buffers
Regional Real estate prices; Changes in market access
Agri-industrial livelihoods and ecosystem services generated.
Regional role of agri-industries, particularly in relation to ecosystem services
Local Economic viability of rural townships
Sense of community and character
Alternative production and marketing strategies; Government – community partnerships
Household Financial viability Lifestyle choices and economic options
Diversified local livelihoods
To identify an appropriate place to begin this inquiry, it was clear that agri-industries could be defined very differently: primary producers, agri-industrial businesses at many scales, and local retail, service, and tourism interests. As a starting point we chose to define agri-industries as those industries that have established linkages with the NSW Department of Primary Industries (DPI). Preliminary discussions with a number of DPI staff introduced the general intent of the project, and asked about what programs and industries they were involved with, how these were structured in relation to networks and technical support, and who they suggest we could talk to in our initial stages.
Figure 4.2 Produce at a local growers market
Local perspectives on issues faced
This section describes a series of semi-structured interviews with approximately 20 local producers, identified through involvement with DPI programs and a previous community engagement project undertaken for the Hawkesbury City Council. These interviews focused on a number of key clusters: the family, the products, spatial arrangements, communities of practice, and policy enablers.
21

Interview responses were interpreted by mapping the issues raised in terms of different scales, and the extent to which these were internalised or externalised values. An additional step was then to interpret the issues raised in these interviews in terms of the stages of the adaptive cycle discussed in section 1. It was found that issues raised may reflect trends between phases, for example a regional product focus might provide an opportunity for re-organisation (α) and exploitation (r) of new market niches (ie α → r).
Two patterns emerged from this preliminary analysis. Firstly, the range of discussions tended to reinforce a distinction between communities of practice. An example of mapping issues described by orchardists who focused on local community development in focus group discussions is shown in Figure 4.3. These orchardists represent a group of producers who avoid central markets and are associated with alternative marketing arrangements. Another grouping of orchardists is generally of Lebanese descent with high investment and high return orchards that focus on large national markets (see Figure 4.4).
Figure 4.3 Example of mapping issues described by ‘local focus’ orchardists
Internalised ---------- values ------------------- Externalised
Policy
Product
C o P
Spatial
Family
Heritage, including
cultural / community
Local government policies and procedures
Land prices Regional produce / identity
Entrepreneurialism / tourism
Informal network, friendly rivalry
Microclimate specific planning (α → r)
Lifestyle / philosophy
Water recycling Subdivision and land use change
Superannuation requires selling land (K → Ω)
22

Figure 4.4 Example of mapping issues described by ‘market oriented’ orchardists
Internalised ------------------ Values ---------------- Externalised
Policy
Product
C o P
Spatial
Family
Regional advantage / timing to market
High investment to maintain edge on competition
Market contacts: agents, transport, pickers
Water storages and recycling
Interest of son, changing attitudes compared to dad
(α → r)
International terms of trade
Agri-industry duopoly
The second pattern that emerged from this preliminary analysis was a relationship between the phases of the adaptive cycle and the mapping of issues and opportunities in relation to the degree of internalisation / externalisation of values. Those opportunities that reflected internalisation tended to possibly lie in the backloop of the adaptive cycle. For example, where water recycling generates a new resource (Ω → α), or when a regional identity can generate new market opportunity (α → r). As investment, bureaucracy or market control develop, these tend to paradoxically reflect increasing capitalisation and control (e.g. K → Ω), while externalising values and risks. In between these, many of the key methods for making the most of the market opportunities (e.g. entrepreneurialism/tourism and having good market contacts) were middle of the road with regard to internalisation, and capitalise on these structural associations (r → K). These interpretations need to be considered further, both to be careful that this pattern is not just a construct generated by the analysis, and further implications. Another way of representing the interviewee’s responses is shown in Table 4.2, which tabulates issues and opportunities mentioned in relation to the clusters used (family, spatial, communities of practice, product, and policy), and the phases of the panarchy model.
23

Table 4.2 Issues, opportunities, clusters and phases of the adaptive cycle for farmers who participated in focus groups
Opportunity and capital accumulation (r → K)
Brittleness and collapse (K → Ω)
Release (Ω → α)
Reorganisation (α → r)
Policy enablers
• Local regional focus
• Promotion
• Free trade
• Bureaucracy
• Collapse of confidence
• Change of policy / government
• Policy debate and innovation
Product • Comparative advantage
• Tourism potential
• Terms of trade
• Market control
• Pollution and waste
• Structural change
• Innovation
• Alternative products and use of seconds
CoP • Entrepreneurialism
• Community organisation
• Closed groups
• Perceived ineffectiveness
• Change to weekenders
• Networks
• Vision and worldview
Spatial • Microclimate based
• Water harvesting
• Fire, hail, flying foxes
• Land use change
• Regional identity
• Planning
• Water recycling
• Rehabilitation Family • Building family
portfolio • Generational
change
• Over- investment
• Sell up and move
• Philosophy
• Knowledge
• Diversified portfolio
Another key aspect of the panarchy model is the nature of the fast and slow variables that interact, as shown earlier in Table 1.8. A preliminary attempt to interpret these in relation to the clusters used is presented in Table 4.3. Based upon the logic of the panarchy model, an important implication is that a suite of management and policy tools are needed which engage with these different variables collectively. A focus on merely one aspect may contribute to a destabilisation of these interacting variables. This is consistent with strategic integrative frameworks such as integrated catchment management.
Table 4.3 Slower and faster variables for project clusters
System Fast variables Slower variables Slowest variables Policy Lifecycle of issues Policy responses Institutional setting Product Yield and quality Choice of varieties Investment in nets, water, land CoP Individual involvement Means of organisation Formation and re-organisation Spatial Production and waste streams Enterprise mix and resource
management Ecosystem services
Family Demands on family labour Portfolio of roles / activities Generational change
24

The preliminary analysis presented above has a number of implications for the emergent methodology used. These include:
• Focusing feedback on the broad range of interconnected issues and not rushing to focus on singular aspects;
• Trying to work pragmatically through the communities of practice and to identify points of leverage;
• Continuing to focus on the relationships between issues and having a broad suite of established methods to mix and match as appropriate. A summary of some of these potential supporting methodologies is shown in Table 4.4.
Table 4.4 Potential supporting strategies at a range of temporal and spatial scales
Key cluster Potential strategies Farm family / business • Whole farm planning
• Enterprise facilitation Spatial arrangements • Demonstrations of best management practices
• Catchment management / total water cycle management
• Cumulative impact assessment
• Ecosystem services
• Geographic information systems Communities of practice • Information brokerage
• Action research Product • Life cycle assessment
• Waste minimisation and recycling Enabling policy • Critical review
• Community – government partnerships
4.2 Case studies – representative landholders
The second stage of this study was to invite the participation of a small number of primary producers who represented the diversity of production and marketing strategies found in the area (see Table 4.5). Based upon the initial series of semi-structured interviews, six different primary producers were approached, seeking to invite their involvement as representative demonstrations and case studies. A letter was sent out, inviting ongoing participation with the intent of further focused discussions to address:
1. Gaining a detailed understanding of the strategies applied by the family business, including:
o product life cycles and supply chain strategies; and
o interactions in the local landscape.
25

2. Opportunities to enhance the recognition of good practice, and to address issues such as:
o value-adding from waste streams and second grade products; and
o recognition of ecosystem services.
An initial characterisation of each production and marketing system was undertaken through adapting a life cycle assessment to the operations undertaken for each step of their production and marketing strategies.
Table 4.5 Horticultural producers involved in the project
Horticultural producer Property Name Primary production
Bill Shields Shields Orchard Pick your own and roadside stall sales Joe Saliba Saliba Fruits High production orchards John and Adrian Maguire Enniskillen Orchard
Hawkesbury Harvest member Nodal producers
John and Judith Chorley “Northgate” Permaculture farming and berry production
As outlined in Figure 4.5 inputs and outputs were investigated in relation to the following life cycle stages relevant to orchard production:
• Land preparation and establishment, including infrastructure;
• Maintenance and orchard productivity;
• Product harvest and alternate product sources;
• Processing and product differentiation; and
• Marketing, packaging and transport.
26

Figure 4.5 General structure used to inform lifecycle assessments
Land prep. and establishment, incl. infrastructure
Maintenance and orchard productivity
Product harvest and alternate product sources
Processing and product differentiation
Marketing, packaging and transport
Inputs Outputs
Land
Water
Fertiliser
Chemicals
Labour
Fuel
Energy
Products
Ag systems
Products
Organic waste
Other solid wastes
Waterborne wastes
Atmospheric emissions
Coproducts
(eg Ecosystem services)
Life cycle stages
Enniskillen Orchard
John Maguire and his son Adrian run Enniskillen Orchard in Grose Wold, in the hills of Kurrajong on the eastern edge of the Blue Mountains. John has been instrumental in the development of Hawkesbury Harvest (see section 1.1.3), and reflective of this, the production system on his farm is focused on connections to tourism and the roadside sale of products from a broad network of producers. Having moved away from traditional orchard varieties, the Maguires are moving towards increasing production of berries and herbs. This change is part of a diversified family portfolio of income-generating activities that include off-farm income.
Figure 4.6 Adrian Maguire and one of the researchers on Enniskillen Orchard
27
Enniskillen Orchard is situated in the headwaters of Cabbage Tree Creek, and is surrounded by properties that have changed their focus from primary production to rural residential land use. However, part of the Maguires’ vision is for the area to develop into a ‘Tuscany of Sydney’, with tourism and the Hawkesbury Harvest contributing to the natural attractions of the area. Some important limitations to the development of this concept include the need for better water management, increased options for recycling, and the development of infrastructure within this region of the Sydney Basin to accommodate facilities associated with a regular influx of people. As participants in the HARtDac project, an assessment of soil, water and the local climate has been undertaken. This area is zoned for ‘Rural Living’ under the 1989 Hawkesbury City Council Local Environment Plan (Figure 4.7).
Land preparation and establishment, including infrastructure
The Maguire farm produces stone fruit, apples, nashi pears and a range of berry fruits, and sits on a total area of 6 hectares - of which 4 hectares is irrigated using a farm dam. To suit the changing local market, the area dedicated to the production of berries and herbs is increasing. While this is being developed, maintaining cash flow from traditional orchard production requires the replanting of some areas of the farm with new varieties of stone fruit, a process involving ripping and liming due to the acid and sodic soil conditions on the farm.
Maintenance and orchard productivity
Pumping of water to maintain productivity is expensive, particularly when stone fruit and berries are in season. Some applications of Roundup, Sprayseed and zinc are applied as required for the management of weeds. New shoots from stone fruit trees are pruned as part of tree shaping and mulched, and old trees that are no longer productive are cut down, mulched and the chips are spread on herb gardens.
Product harvest and alternate product sources
Stone fruit production varies between 20-50 kg of fruit per tree. Newly established white peach varieties can return approx. $8 / kg if sold on-farm, which is a much higher return than that from markets which entail substantive packaging costs. Raspberry bushes can produce 30-40 punnets per day through summer, providing approx $20/kg with second grade fruit going to jam production. Losses due to birds and bats can be as high as 20%, with damaged fruit disposed of some distance from orchard trees to reduce beetle infestation and fungal diseases.
Processing and product differentiation
Along with fresh fruits and herbs grown on the orchard and sourced regionally, jam production is a major process for utilising second grade fruits. From 1 kg of fruit producing 8 jars of jam can earn approx. $20 profit.
Marketing, packaging and transport
The Maguires rely upon a range of marketing strategies. Their roadside stall at the orchard contains a broad range of local and regional produce, and is well supported by local customers as well as tour groups and buses. They also sell at Farmers Markets in Dural and Penrith, and trade directly with local cafes. Some fruit is sent to the central Flemington Produce Markets early in the season.
28
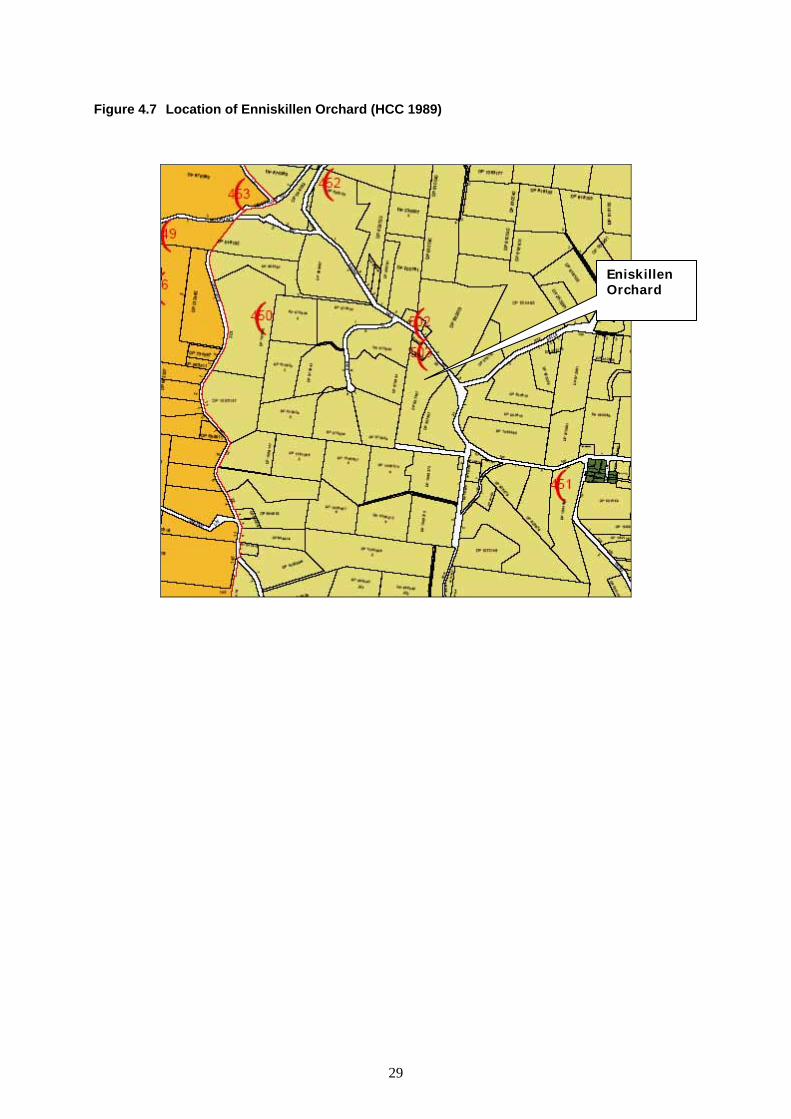
Figure 4.7 Location of Enniskillen Orchard (HCC 1989)
Eniskillen Orchard DP 827407
29

Shields Orchard
Bill Shields runs an orchard in Bilpin, where he sells produce through his roadside stall, and generates extra income by allowing people to ‘pick their own’ fruit from his orchard. Bill has also participated in the HARtDaC project, which documented the range of produce grown historically on the property, and how the range of varieties grown by Bill provide for a continuing supply (of different fruits from season to season). Apples, including some boutique varieties, are the main fruit produced, along with peaches, cherries and plums. Bill has recently joined Hawkesbury Harvest and is involved in a range of local community organisations such as the Bilpin Rural Fire Brigade and the National Parks Regional Advisory Committee. He is a well-respected spokesman on local community issues.
Figure 4.8 Bill Shields at his roadside stall
Shields’ orchard is on the northern side of Bell’s Line of Road in Bilpin, with a northerly aspect. The location of his block is shown in Figure 4.9, and is zoned as ‘Environmental Protection – Agriculture Protection (Scenic)’ under the 1989 Hawkesbury City Council Local Environment Plan.
30

Figure 4.9 Location of Shields Orchard (HCC 1989)
DP596428Shields
Land preparation and establishment, including infrastructure
Bill has approx. 6 hectares of which 4-5 hectares are in production, and has a 14 ML dam. He is currently altering his mix of species and trellis arrangements to facilitate ‘pick your own’ production. While some older tree varieties are maintained (at a planting density of approx. 250 trees / ha), newer varieties are generally of semi-dwarf stock with higher planting densities (1300-1500 trees / ha). Replanting involves significant cultivation and the application of 4-5 tonnes / ha of lime to correct soil pH. Bill has been interested in the use of alternatives such as treated sewage products as a liming treatment. Establishment of new trees including trellises costs approx. $10,000 per hectare, with an additional $1,500 / ha for irrigation.
Maintenance and orchard productivity
Maintenance of orchard productivity includes the need to continually develop new areas planted with different varieties, resulting in areas covered in tree stumps that are commonly burned. Copper and oil sprays are used as pesticides, with fungicides also needed on the stone fruit in Spring to maintain orchard health. Grassed areas between orchard rows are slashed, and left to contribute to soil organic matter. Herbicides are used under the trees to keep this area clear. Some compost is brought onto the property but mainly for the gardens and not the larger orchard.
31

Product harvest and alternate product sources
As described above, the range of varieties grown provides for a broad distribution of available apple and stone fruit through the season. Apple varieties include Red Delicious, Jonathons, Pink lady, Sundowner, and a small number of Cox Orange Pippen. Annual apple production ranges from 25-120 tonnes (most recently 30-40 tonnes). Sixty cherry trees produce 300-400 kg of fruit per annum, and peaches, plums and other stone fruit produce around 5-6 tonnes.
Processing and product differentiation
Along with fresh fruit, Bill also supplies apples to a local producer of apple vinegar, which is sold regionally. Previously some 6-7 tonnes of apples went to a local apple juice processor, but this business was closed down and changed hands.
Marketing, packaging and transport
Bill’s location on Bells Line of Road, along with having an established roadside stall for a number of decades, contributes to repeat buyer purchasing. Bill keeps packaging to a minimum, using recycled wine cartons sourced from Villawood detention centre. Along with the established roadside stall, ‘pick your own’ sales have increased in recent years, and this is seen as an area of potential growth for the business, particularly considering the marketing provided as part of Hawkesbury Harvest. Recent exposure of this method of harvesting on a popular TV show focusing on weekend activities resulted in a significant increase in sales. An increasing volume of produce from this farm is going to growers markets and local retailers.
Saliba Fruits
Joe Saliba runs Saliba Fruits, which provides apples and stone fruit to the major wholesale markets of the east coast of NSW that supply the major food retail chains. The scale of Joe’s operation, and the production strategies he employs, are geared to the emerging supply chain strategies of these major retailers.
Joe Saliba has an intensive orchard on the southern side of Bells Line of Road, Bilpin. Similar to the zoning and location of Bill Shields, the zoning of Joe’s orchard is ‘Environmental Protection – Agriculture Protection (Scenic)’ under the 1989 Hawkesbury City Council Local Environment Plan.
32

Figure 4.10 Location of Saliba Fruits
Saliba DP 210461
Land preparation and establishment, including infrastructure
Joe’s orchard includes 20 acres of stone fruit and 20 acres of apples, with approximately half of the orchard grown under nets to protect ripening fruit from local fauna. The property has 4 dams below the orchard areas with a capacity sufficient for two seasons of irrigation without further rainfall. Netting the orchards has been a major investment, beginning more than ten years ago at approximately $30-50,000 / ha. The establishment of trellises and higher densities of dwarf stock require soil remediation with lime, dolomite, and superphosphate at application rates guided by regular soil testing rates. New varieties of fruit are being established on an ongoing basis.
Maintenance and orchard productivity
Water management is carefully programmed in relation to timing of budding and sap movement in fruit trees, and hardening of stones. Water management includes the use of soil moisture probes to monitor water requirements of trees, and the conversion of microjet irrigation to drip irrigation systems applied as pulses to control water usage, and areas of application. Foliar sprays are being used along with mites and traps, as part of an Integrated Pest Management (IPM) system. Fewer chemicals are used, and major purchasers audit spray records as part of their quality assurance programs. Mechanisation off-ground is increasing, such as for pruning and thinning, with thinnings mechanically mulched where they fall.
Product harvest and alternate product sources
The major retail buyers have very particular market requirements in relation to fruit size and grading, and packaging. Joe’s harvesting strategies are geared to high volume production from this orchard, and an ability to rapidly move these large volumes to appropriate markets.
33

Processing and product differentiation
Newer fashions such as ‘defuzzing’ peaches and waxing apples is included, along with intensive grading and packaging as required by retail chains. Product differentiation is based upon the supply chain requirements of these major retailers.
Marketing, packaging and transport
Joe continues to invest in equipment to enable high volumes of fruit to be separated and packaged as required by major retailers. A considerable cool room capacity is maintained for packaged fruit, which is collected by trucks with air cushion suspension able to move fruit overnight from the orchard to any of the major markets on the east coast of NSW, which is then packaged ready for commercial retailers.
Figure 4.11 Joe Saliba and researcher at Saliba’s orchard
John and Judith Chorley, “Northgate”
John and Judith Chorley (Figure 4.12) have a permaculture garden on their property, which encompasses large natural areas on Bells Line of Road, Mount Tomah (Figure 4.13). Being the most westerly of case study properties, they fall within Blue Mountains City Council, where their zoning is ‘Rural Conservation (Mount Tomah)’ under the 1991 Blue Mountains City Council Local Environment Plan (LEP). The Chorleys also draw upon off-farm sources of income such as work at the neighbouring Mount Tomah botanical gardens.
34
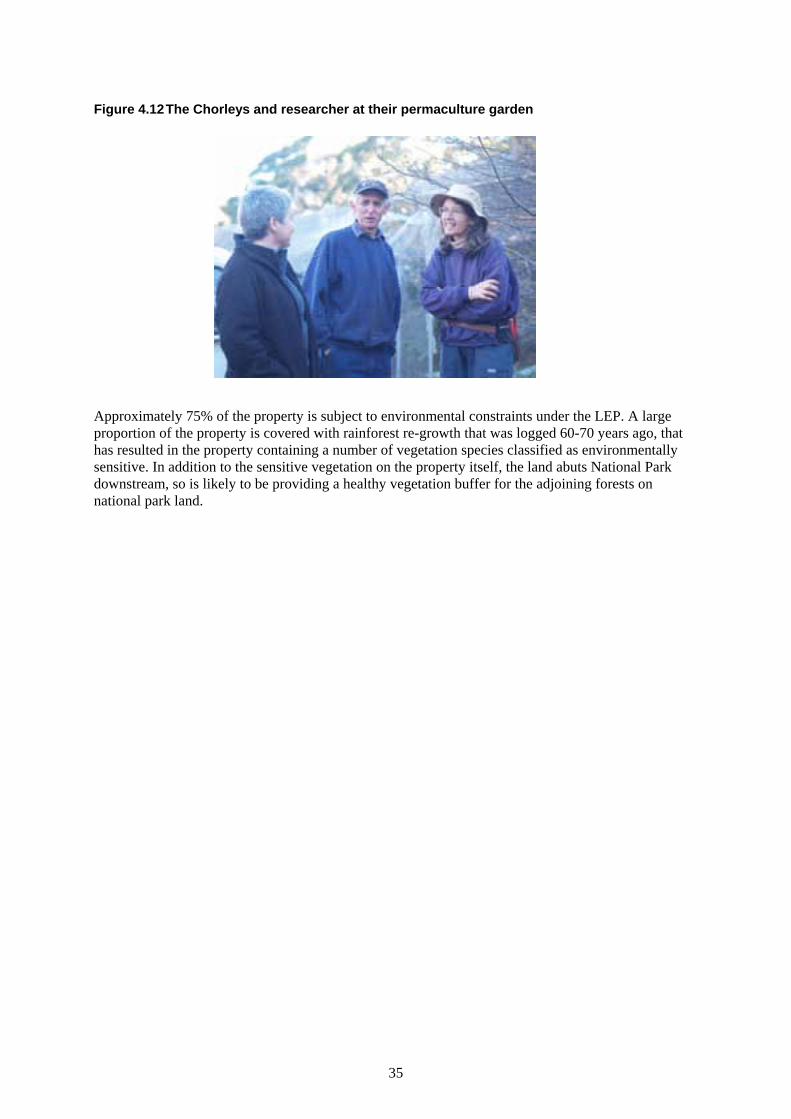
Figure 4.12 The Chorleys and researcher at their permaculture garden
Approximately 75% of the property is subject to environmental constraints under the LEP. A large proportion of the property is covered with rainforest re-growth that was logged 60-70 years ago, that has resulted in the property containing a number of vegetation species classified as environmentally sensitive. In addition to the sensitive vegetation on the property itself, the land abuts National Park downstream, so is likely to be providing a healthy vegetation buffer for the adjoining forests on national park land.
35

Figure 4.13 Location of Northgate
Chorley 43 Bells Line f Rd
Land preparation and establishment, including infrastructure
John and Judith have 65 acres, most of which has never been cleared. One acre containing fruit trees of various kinds, vegetables and berries is under nets, 3 acres contains other plantings (hazelnuts, vegetables, different varieties of tree plantation, and bamboo), and 25 -30 acres under various forms of re-vegetation (mostly natural untouched reforestation – plus a walnut and a chestnut plantation).The property has a series of dams that all draw from a spring and the water is pumped by solar pump to header tanks holding a total of 60,000 gallons. Establishment of the permaculture garden has included mulching, and use of natural and processed manures. In general, establishment procedures follow permaculture principles, linking multiple production systems.
Maintenance and orchard productivity
Mulching is carried out using organic material and cardboard, along with cover crops such as scarlet runner beans and vetch. Irrigation systems are gravity fed from holding tanks previously described. Liquid manures, along with chooks and ducks are used as part of the integrated system both as an alternative production source and as help in maintaining the orchard. This type of production is extremely labour-intensive, and requires itinerant labour assistance for seasonal picking and packaging.
Product harvest and alternate product sources
From October through to December production includes asparagus, eggs, broad beans, artichokes, boysenberries, mulberries, and loquats. From January on, raspberries, blueberries and zucchinis are produced. Hazelnuts are also harvested in season.
36

Processing and product differentiation
Jam production is a major source of alternative income for the farm, with approximately 1000 pots of jam produced each year. A fundamental strategy for product differentiation is due to their organic and permaculture production philosophy and the ability to directly communicate this to purchasers of their products.
Marketing, packaging and transport
A range of alternative marketing strategies are utilised, including selling through established roadside stalls, organic food cooperatives such as at Katoomba, local restaurants and growers markets. Most of these are within 90 km of the farm, so transport and delivery is shared with a neighbour who produces free-range poultry.
Impacts of Local Planning and Land Use Agreements on the representative properties
Three of the project’s representative properties are located within the HCC LGA and are subject to the Hawkesbury LEP 1989, while the fourth property is in the Blue Mountains LGA. Appendix 1 outlines each of the LEPs affecting land use in the Hawkesbury and Blue Mountains, as well as subdivision and Development Control Plans. The need for standardization of plans is also addressed within Appendix 1.
The current zoning applied to these properties restricts subdivision to a level above the minimum suggested by Sinclair (2004) and Mason and Docking (2005), and is already smaller than the minimum lot size specified by the LEP (ie they could not be subdivided further if the current LEP rules are implemented). This is the case with the subdivision rules applying to all representative properties in the case study area. The zone considered to be at most risk of increased intensity of subdivision is the “Rural Living” zone, which is the zone applied to the Maguire property (which consists of 6 hectares). As the Maguire property is currently zoned, the minimum lot size for subdivision is 4 hectares.
Hawkesbury LEP permits minimum lot size for subdivision of 2 Ha in some areas zoned Rural Living. It is conceivable that the minimum size could be reduced to 2 Ha across the entire Rural Living zone by future planning decisions, in which case a “worst case scenario” could see properties such as the Maguires’ subdivided into 3 lots of 2 hectares. However, in order to make use of such information for the purpose of assessing the impacts of subdivision there is a need to know the total number of lots which could ultimately result from broad scale subdivision across the LGA, the cumulative effects of intensive development of the resultant lots and the types of land use that might be permitted on that land. Data regarding landform, vegetation, water quality, proportionate areas of hard/impervious surfaces and issues related to both current and projected land use and land management practices is required.
A notable difference between the Hawkesbury and the Blue Mountains LEPs is the background information available regarding reasoning for the application of zoning and environmental constraint areas. The BMCC LEP makes publicly available mapping data that indicates not only applicable land use zoning, but also the location of watercourses, sensitive vegetation communities, topography, heritage sites, slope and bushfire prone land. The data is used to support decisions regarding the application of particular zoning. Hawkesbury Council does not make such information available, making the task of assessing the implications of various land uses more difficult and time consuming.
It goes without question that if the Hawkesbury LEP rules applying to residential zones were to be applied to the rural areas of the Hawkesbury, there would be detrimental impacts on the sustainability of agriculture and on the WHA. However, it seems unrealistic to try and construct a scenario around this possibility when the LEPs currently in place would not permit such intensive subdivision and extreme changes in land use.
37

4.3 Potential tools and economic opportunities
4.3.1Organic waste conversion
This part of the research was supported by a grant from Horticulture Australia (Wildman 2007) and material from that report is included in this section. The study was designed to explore the potential for using microbial processes to break down waste material and at the same time produce useful commercial end products. In this particular case, organic waste was converted into beneficial fungal products for diversified production, while the mulch produced by the process improved soil condition and increased resistance to nematodes.
Vast quantities of organic wastes, particularly containing lignocellulosic materials, are generated through primary and secondary production systems in the agricultural, forest and food processing industries. Currently, large proportions of these wastes are either burnt or go straight to landfill with resultant economic and ecological implications. For small-scale horticultural businesses, the generation and disposal of waste streams may impact upon profits and have serious ecological consequences for the local environment. However, appropriate bioremediation can convert these wastes into valuable economic and environmental resources.
The aim of this study was to identify suitable microbial bioremediation agents for several horticultural waste streams in the Hawkesbury region neighbouring the GBMWHA and to investigate conversion of these wastes into valuable economic and environmental resources.
A RIRDC report concerning reuse potentials of agri-industry waste in the Melbourne/Metropolitan Region (Meehan et al. 2000) noted that metropolitan and rural industries should fully explore opportunities to convert high cost wastes into value-added environmentally friendly by-products, and that applied research and development should be undertaken to characterise, modify, manage and utilise agri-industry wastes. Several HAL-funded projects (VX99002, HG00033, VG99076) have reviewed or trialled organic waste composting or the use of organic mulches. In the USA there have been positive results through myco-remediation for in situ farm waste management (www.fungi.com/mycotech/farmwaste.html).
This project builds upon the US work and aims to demonstrate its applicability to in situ treatment of horticultural waste streams under Australian conditions.
Detailed methods
Identification and assessment of waste streams
The four producers outlined in section 4.2, representing different types of horticultural production, agreed to be consulted about the waste streams generated from their production systems, and to be involved in evaluating the outcomes of this project. An informal assessment was undertaken to identify types of waste, waste volumes, waste production periods and current methods of waste management. The waste streams identified represent those associated with several different types of horticultural production and are of relevance to both traditional horticulturalists and the exponents of permaculture methods. All the horticulturalists expressed an interest in waste management issues, but from different perspectives, and this was considered when attempting to match waste treatment to requirements of growers.
A more detailed assessment of waste types, volumes, production periods and current methods of waste management were undertaken in a pilot study carried out at Shields Orchard. On the basis of this, apple tree waste was selected as a trial substrate for growth of fungi since fruit tree removal and destruction was identified as the likely source of most on-farm waste for all producers.
38

Identification of bioremediation agents for selected horticultural waste streams
Potentially suitable fungal bioremediation agents for on-farm wastes were surveyed in the literature (e.g. Rinker 2002; Stamets 1993). Discussions with farmers indicated that the basidiomycetous fungi Pleurotus ostreatus (Oyster mushroom) and Lentinula edodes (Shiitake) would both be of interest to farmers and potentially suitable for on-farm growth with minimal handling and cultivation requirements. To reduce costs for this initial experimental work, suitable decomposer fungi were sourced from supermarkets and local native fungi of a similar taxonomic disposition isolated into pure culture.
Fungal isolation
The fungi were isolated into pure cultures from fruiting bodies purchased in supermarkets, or from fruiting bodies excised from environmental substrates. Freshly purchased or collected fruiting bodies were brushed free of any dirt and debris. A sterile scalpel was used to cut into the cap and excise a small amount of gill tissue. A small portion of the gill tissue was removed with a sterile needle and plated onto a suitable growth medium in Petri dishes – usually half-strength potato dextrose agar (PDA) with the antibacterial antibiotics streptomycin sulfate and tetracycline hydrochloride and with or without benomyl (to inhibit growth of Ascomycetous fungi). The Petri dishes were observed frequently for hyphal growth from the gill tissue, and fungi reisolated from hyphal tips as soon as possible.
Fungal storage
Isolates were stored for long-term preservation using a miniaturised system for storage of fungal cultures in sterile water at room temperature (Jones et al. 1991) that is inexpensive and has no potentially costly low temperature maintenance component. The long-term storage protocol was tested after several months’ storage of isolates at room temperature by opening vials and culturing the contents onto ½ strength PDA plates (with added antibacterial antibiotics) to check for isolate viability. Growth was checked by observing mycelial plugs and colonies that had originated from additional dispersed hyphal pieces in the cryovials.
Development of waste remediation and mushroom production conditions
Potential fungal cultivation methods were identified from the literature (Stamets 1993) and from the experience of growing microorganisms on solid substrates for secondary metabolite production in the pharmaceutical industry (Wildman 2007).
Conditions appropriate to in situ treatment of apple wood waste were developed in the laboratory using the aforementioned Pleurotus and Lentinula isolates with the emphasis on both waste transformation and successful fungal fruiting body production.
Production of fungal fruiting bodies on woody materials such as those utilised in this study usually involves the scale-up of fungal inoculum on a substrate that allows rapid fungal growth (spawn production) and, after this has occurred, which can be easily dispersed into the final growth and fruiting body production substrate. The spawn is dispersed within the growth substrate, growth throughout this substrate occurs (the spawn run) and fungal primordia formation (the earliest stage of fruiting body initiation) is initiated by an environmental stimulus (e.g. temperature change, change of atmospheric conditions). Fruiting body development subsequently occurs over a period of time and several cropping cycles usually occur.
Wood-based spawn production trials
Stamets (1993) suggested that for the inoculation of outdoor, unpasteurised substrates, wood-based spawn is better than grain spawn as grain spawn introduced to an outdoor bed can attract insects, birds and slugs seeking food. He noted that sawdust spawn also has more inoculation points per weight than
39

grain and that the distances between mycelial fragments is smaller, resulting in the window of vulnerability to contamination being reduced. However, organic wheat grain-based spawn has been used with some success in trials in Wales where Oyster mushrooms were produced in small 1m x 1m x 0.5m deep holes containing composted wood chips (Frost 2007).
Spawning trials using sterilised and unsterilised wood shavings were undertaken over the 2007 – 2008 summer period to test their suitability. In addition, the spent mushroom substrate from the large-scale growth trials was utilised as a wood-based spawn for the on-farm growth trial.
Small-scale growth trials using sterilised chips
Small twigs and branches were collected from Shields Orchard in early April 2007 and were chopped through an Ozito ‘EnviroShred’ shredder. Several passes of the material through the shredder were made to reduce the material to a suitable size (see Figure 4.14).
Figure 4.14 Shredded apple material (scale = 6” or 15cm)
The apple chips were placed in a plastic tub and watered thoroughly to soak the material. The tub was left open for 24 hours and received an additional 5 mm of rainfall during this time. The excess water, which was brown in colour from extracted tannins and fruity smelling, was then poured off.
Saturated and drained apple chips (250 g wet wt) was added to small growth bags with air breather patches and the bags sterilised by autoclaving at 121°C for 15 minutes. Spawn (25 g wet wt) from the small- and larger-scale spawn production trials was broken up with a sterile scalpel and added to the growth bags of apple chips, representing an inoculation rate of 10%. The growth bags were incubated in the dark at 25°C and fungal growth observed over time.
After the growth bag had become fully colonised by the fungus (the spawn run) it was pierced in many places on the bottom (non breather patch) side with a scalpel and incubated above water in a clear plastic tub to maintain humidity under outdoor conditions. Any fungal growth and primordia formation were observed. Flushes of fruiting body production were noted and fruiting body weights recorded.
40

The biological efficiency (Stamets 1993), an expression of fungus fruiting body yield, was determined for each bag. 100% biological efficiency (BE) is defined as 1 lb of fresh mushrooms grown from 1 lb of dry substrate or 4 lbs of moist substrate.
Large-scale growth trials
Larger-scale growth trials were attempted using commercially chipped apple wood from Shields Orchard (Figure 4) that had not been sterilised prior to inoculation for the spawn run. Non-sterilised chipped apple wood was utilised to more closely mimic the conditions that might be used by the orchardists on their own properties.
Apple chips were soaked overnight in tap water and allowed to drain for several hours. Drained apple chips (3.6 – 4.0 kg wet wt) were added to large growth bags with air breather patches and 2 bags of colonised corn spawn (2 x 500 g wet wt) from the larger-scale spawn production trials was broken up by hand and added whilst wearing sterile gloves. This represented an inoculation rate of ~ 25%. The spawn was added to the growth bags such that it was not evenly dispersed but dispersed in patches throughout the apple chips. The uneven spawn dispersal was done to ensure that the fungus mycelium had sufficient inoculum density in a number of patches to establish growth in competition with any exogenous organisms present on the apple chips. The growth bags were incubated in the dark at 25°C and fungal growth observed over time.
Field trials and demonstrations for growers
A small-scale field trial of waste conversion and mushroom fruiting body production was undertaken at Shields Orchard in March 2008 focusing on F1 (Pleurotus ostreatus) and utilising apple chips from the orchard (see Figure 4.24). The field trial included documentation for the growers of suggested protocols, including bioremediation methodologies and mushroom handling techniques.
Results
Identification and assessment of waste streams
Shields Orchard
Solid organic wastes at Shields Orchard are mainly comprised of trees and their prunings, packaging materials and grass clippings. Packaging material waste is considered minimal, grass clippings are left on the ground to decompose, and a reasonable thickness of grass helps maintain soil organic matter levels. Tree prunings are minimal due to chemical treatments applied to trees to reduce growth after a suitable size is reached. Prunings are shredded with a flail mower and left on the ground.
Trees are removed and replaced on a 10-15 year cycle with a maximum of 60-80 trees removed per annum.
After grubbing out, trees are usually destroyed by burning to reduce habitat for codling moth and other pests, but Bill Shields noted that chipping would likely achieve the same effect. It is estimated that over 200 trees could be chipped in a day (Figure 4.17) compared with the normal practice of burning trees that have been removed. Tree removal is usually undertaken from April to midwinter and new trees are replanted from July.
Bill Shields is interested in the greater use of mulch; he currently uses ~ 25 m3 of green waste on garden beds, which is purchased from the local council, and would use more mulch under young trees. In addition, he has an interest in diversification of products for sale.
41

Figure 4.15 Apple tree layout in Shields Orchard (trees planted at rate 100 trees/acre)
42

Figure 4.16 A pile of apple trees that have been removed prior to burning
Figure 4.17 Chipped apple wood (8 – 10 m3) produced from 22 large trees
43

Saliba Fruits
Saliba Fruits produces apples and stone fruits mainly under netting (as shown in Figure 4.11). Prunings are usually dropped on the ground and chipped by a mulcher pulled between the rows of trees. The chippings are then left on the ground to decompose. Herbicide is applied to grass and weeds under the trees when ~ 15 cm high.
Old tree stocks are replaced with new trees and varieties over time, with up to several hundred trees per annum being replaced. The trees are cut above ground and the remaining stump and root ploughed into the soil. The cut material is chipped by a third party and removed for sale.
It was noted that the orchard is on a slope with several run-off areas from dams (Figures 4.18 and 4.19) and from the irrigation of trees under netting (Figure 4.11). There may be opportunities to myco-remediate the run-off areas to clean up and/or reduce run-off.
Figures 4.18 and 4.19 Run-off areas from dams at Saliba Fruits
Enniskillen Orchard
Enniskillen Orchard is a medium-sized orchard, mainly producing apples and mixed fruits (berries, etc) and recently expanding into herb production. Old trees are replaced with new stocks over time and the removed trees are chipped and spread as mulch. Some parts of the orchard are noted to have root nematode problems.
John and Judith Chorley
John and Judith Chorley farm on a part-time basis using permaculture techniques so a large variety of waste materials are mulched. Their current mulching practice consists of leaving materials on the soil surface and adding cardboard boxes, waste paper and other materials around tree bases. Boxes are sourced from the nearby Mount Tomah Botanic Gardens and from nearby growers.
Identification of bioremediation agents for selected horticultural waste streams
Fungal isolation
Costs for the initial experimental work were reduced by sourcing suitable decomposer fungi from supermarkets and local native fungi (Figures 4.20 and 4.21) of a similar taxonomic disposition and by isolating them into pure culture ( ).
44

Table 4.6 List of fungi isolated into pure culture for this project and their source
Isolate No.
Common Name
Scientific Name
Country of Origin
Grower Source Description Storage Date
F1 Oyster mushroom
Pleurotus ostreatus
Australia Global Mushroom
Harris Farm Markets White fluffy aerial mycelium
8/4/07
F2 Oyster mushroom
Pleurotus ostreatus
Australia Global Mushroom
SMS in garden bed at 6 Marion Crescent Lapstone
White and orange fluffy aerial mycelium
8/4/07
F3 Shiitake Lentinula edodes
China Global Mushroom
Harris Farm Markets White fluffy aerial mycelium
8/4/07
F4 Shiitake Lentinula edodes
Australia Not determined
Woolworths White fluffy aerial mycelium
8/4/07
F5 Oyster mushroom
Pleurotus sp.
Australia Naturally occurring isolate
Stump by roadside in Explorers Reserve, Lapstone
White and caramel fluffy aerial mycelium
15/5/07
Figure 4.20 F3 Pleurotus ostreatus in a garden bed. The fruiting bodies have originated from spent mushroom compost provided by Global Mushrooms that had been mixed in with leaf litter 28 months previously
45

Figure 4.21 F5 Pleurotus sp. fruiting bodies growing on a tree stump in Explorers Reserve, Lapstone
Fungal storage
Isolates underwent long-term preservation using a miniaturised system for storage of fungal cultures in water that is inexpensive and has no potentially costly low temperature maintenance component. The long-term storage protocol was tested after several months storage of isolates at room temperature and in all instances growth was observed from mycelial plugs, and colonies also originated from additional dispersed hyphal pieces in the cryovials (Table 4.7).
Table 4.7 Viability of fungal isolates after long-term preservation in water
Isolate No.
Common Name
Scientific Name
Storage Date
Viability check date
Viability
F1 Oyster mushroom
Pleurotus ostreatus 8/4/2007
24/9/2007 6/11/2007
Growth from all 3 mycelial plugs plus growth from dispersed hyphal pieces
F2 Oyster mushroom
Pleurotus ostreatus 8/4/2007
24/9/2007 6/11/2007
Growth from all 3 mycelial plugs plus growth from dispersed hyphal pieces
F3 Shiitake Lentinula edodes 8/4/2007 16/11/2007 Growth from all 3 mycelial plugs plus
growth from dispersed hyphal pieces
F4 Shiitake Lentinula edodes 8/4/2007 16/11/2007 Growth from all 3 mycelial plugs plus
growth from dispersed hyphal pieces
F5 Oyster mushroom Pleurotus sp. 15/5/2007 6/11/2007 Growth from all 3 mycelial plugs plus
growth from dispersed hyphal pieces
Previous work by the author (Wildman, 2007) and his colleagues (Jones et al. 1991) has shown that viability of many fungi should be maintained for 2 – 5 years.
46

Development of waste remediation and mushroom production conditions
Apple is a hardwood and thus a preferred substrate for the cultivation of fungi on woody material. It should be noted, however, that fruitwoods were thought by Stamets (1993) to be notoriously poor for growing Shiitake mushrooms.
Cultivation methods for fungi on woody substrates essentially fall into two categories – colonisation of intact logs or stumps and colonisation of chipped or mulched material.
Log or, less frequently, stump colonisation is generally via plugs of fungal spawn that are added to holes drilled into the wood. The logs are not sterilised and are traditionally stacked in a formation and covered to prevent drying. Colonisation of the logs may take months, fruiting is seasonal, and the logs can be productive in terms of fruiting body output for years.
The use of chipped and sterilised wood material is usually associated with the commercial production of fungal fruiting bodies utilising bag systems. However broadcast sowing (or mound cultivation) of fungal spawn onto unsterilised wood chips is also possible and makes a greater wood surface area available to the fungus for initial colonisation than the use of logs. Establishment is quicker than on logs, again fruiting is seasonal, and several crops can be produced.
Since apple trees are usually pruned and/or chemically treated to maintain a suitable size they do not have branches of sufficient size to be useful for log cultivation. Thus, broadcast sowing into wood chip beds was considered to be the most suitable method to suit the orchardists’ requirement for minimal handling and maintenance of the fungal fruiting body production process. In addition, the production of Pleurotus fruiting bodies from spent mushroom substrate at 19 and 28 months after mixing in a garden bed with cardboard and leaf litter had demonstrated the long-term survival and growth potential of this fungus under natural conditions.
Figure 4.22 Close-up photograph of a pile of apple tree material that has been stacked prior to burning.
47

Cost Benefit Analysis
A cost-benefit analysis of waste treatment was undertaken and a comparison made with the current waste treatment strategies of growers, which include all producers leaving prunings on the ground and shredding them by various means for mulch.
Annual tree removal and replacement activities result in large amounts of waste material that are dealt with in different ways. These vary from tree removal and chipping by the orchardists themselves who then leave it as mulch (Enniskillen Orchard), to chipping and removal for sale by a third party (Saliba Fruits), through to burning of the removed trees (Shields Orchard).
A cost-benefit analysis of the microbial bioremediation of 1000 kg of apple tree material (Table 4.8) demonstrates that the production of fruiting bodies using woody waste and, assuming a conservative price of $10/kg compared to a supermarket price of over $25/kg, and a modest biological efficiency would result in profits to the producer. A modest 50% biological efficiency and the sale of the resulting mushroom fruiting bodies should result in a profit of over $800. If a greater biological efficiency and higher mushroom sale price are achieved a significant profit in the thousands of dollar range could be realised. In addition, the spent mushroom substrate (SMS) after mushroom harvesting may be of further value to the orchardist in that the Oyster mushroom (Pleurotus ostreatus) is known to exude metabolites that are toxic to nematodes (Thorn and Barron 1984). Root nematodes were noted as a problem in some areas of Enniskillen Orchard and SMS applications to soils may provide some nematode remediation.
It should be noted, however, that this estimate assumes that the orchardist, including the initial spawn production, which would involve the use of sterile spawn medium, does all work. It may be more appropriate and of greater convenience to the end-users if a local co-operative or technical support service provided fungi as growing spawn for further non-sterile spawn scale-up on-farm or for direct woody substrate inoculation. This would involve some additional fees for services but would provide a more likely end product and, if restricted to the initial spawn production stages, should not impact significantly upon profits.
Table 4.8 A cost-benefit analysis of the microbial bioremediation of 1000 kg of apple tree wood and assuming that all work is done on-farm by the end-user. The analysis assumes that all fruiting bodies produced are sold at a conservatively priced $10/kg
Task Description Price Expense Chipping of tree material Chipper hire $300 Spawn initiation on millet 20% inoculation rate of wood shavings. 20 kg of white millet
required 5 growth bags
$60 $2
Spawn production on wood shavings
10% inoculation rate of apple chips. 100 kg of wood shavings required 25 growth bags
$70 $10
Income 100% Biological Efficiency 250 kg fruiting bodies produced $2,500 50% Biological Efficiency 125 kg fruiting bodies produced $1,250 25% Biological Efficiency 62.5 kg fruiting bodies produced $625
Field trials and demonstrations for growers
Spawning trials using wood shavings as a substrate were undertaken over the 2007 – 2008 summer period to test their suitability. In addition, the spent mushroom substrate from the large-scale growth
48

trials is being further used as a wood-based spawn for the on-farm growth trial. A field day was held at Bill Shields Orchard in March 2008 that presented the findings of the project to those in the farming community who had participated along with others interested in the outcomes of the research.
This event provided an opportunity to get feed back from the local farming community on the three tools that had been developed as part of the project.
Figures 4.23 and 4.24 Howard Wildman explains the processes of inoculating the chips with mushroom spore to a group of farmers.
4.3.2 Landscape Function Analysis (LFA)
Objectives:
• To determine the utility of Landscape Function Analysis (LFA) as a method for comparing some of the functional attributes of different land uses, particularly soil stability, water infiltration and nutrient cycling.
• To undertake a pilot study in the use of LFA in human-dominated landscapes such as horticultural, peri-urban and urban gardens.
• To use LFA data to broadly define the impact of loss of agricultural land use in the study area.
• To collect LFA data to generate useful information regarding contribution of agri-industries across a peri-urban landscape and to yield useful information about the level of function of similar sites under vastly different land uses.
• To determine how LFA can be linked with the other tools to provide a clearer picture of the contribution of agri-industries to the peri-urban landscape.
Background on role of LFA in quantifying ecosystem services
Landscape Function Analysis (LFA) is part of a broader suite of techniques called Ecosystem Function Analysis (EFA). LFA involves the description and analysis of the threshold between ‘pasture utilisation’ and ‘landscape degradation’ through a monitoring process designed to record ‘visually assessed indicators of soil surface processes’ (Tongway and Hindley 2005, p14). Landscape function describes the functioning of the biophysical system of a landscape as opposed to the biological composition and structure (Tongway and Hindley 2005). The same authors also describe the concept
49
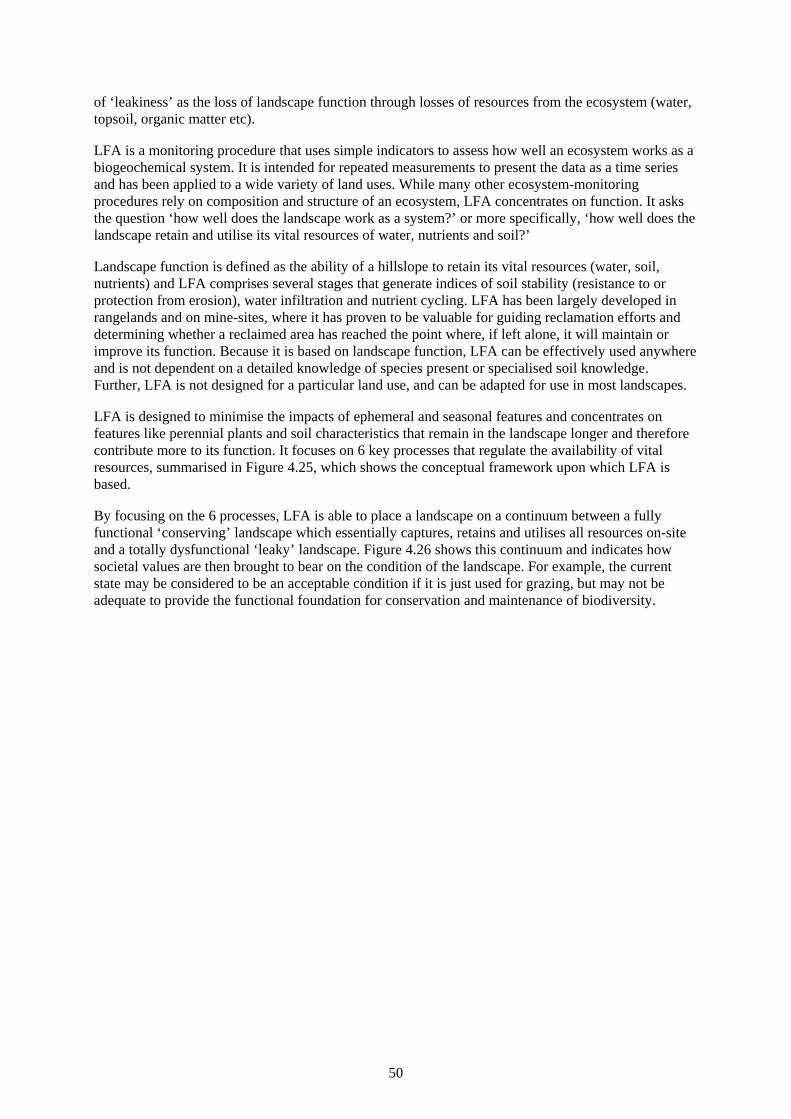
of ‘leakiness’ as the loss of landscape function through losses of resources from the ecosystem (water, topsoil, organic matter etc).
LFA is a monitoring procedure that uses simple indicators to assess how well an ecosystem works as a biogeochemical system. It is intended for repeated measurements to present the data as a time series and has been applied to a wide variety of land uses. While many other ecosystem-monitoring procedures rely on composition and structure of an ecosystem, LFA concentrates on function. It asks the question ‘how well does the landscape work as a system?’ or more specifically, ‘how well does the landscape retain and utilise its vital resources of water, nutrients and soil?’
Landscape function is defined as the ability of a hillslope to retain its vital resources (water, soil, nutrients) and LFA comprises several stages that generate indices of soil stability (resistance to or protection from erosion), water infiltration and nutrient cycling. LFA has been largely developed in rangelands and on mine-sites, where it has proven to be valuable for guiding reclamation efforts and determining whether a reclaimed area has reached the point where, if left alone, it will maintain or improve its function. Because it is based on landscape function, LFA can be effectively used anywhere and is not dependent on a detailed knowledge of species present or specialised soil knowledge. Further, LFA is not designed for a particular land use, and can be adapted for use in most landscapes.
LFA is designed to minimise the impacts of ephemeral and seasonal features and concentrates on features like perennial plants and soil characteristics that remain in the landscape longer and therefore contribute more to its function. It focuses on 6 key processes that regulate the availability of vital resources, summarised in Figure 4.25, which shows the conceptual framework upon which LFA is based.
By focusing on the 6 processes, LFA is able to place a landscape on a continuum between a fully functional ‘conserving’ landscape which essentially captures, retains and utilises all resources on-site and a totally dysfunctional ‘leaky’ landscape. Figure 4.26 shows this continuum and indicates how societal values are then brought to bear on the condition of the landscape. For example, the current state may be considered to be an acceptable condition if it is just used for grazing, but may not be adequate to provide the functional foundation for conservation and maintenance of biodiversity.
50
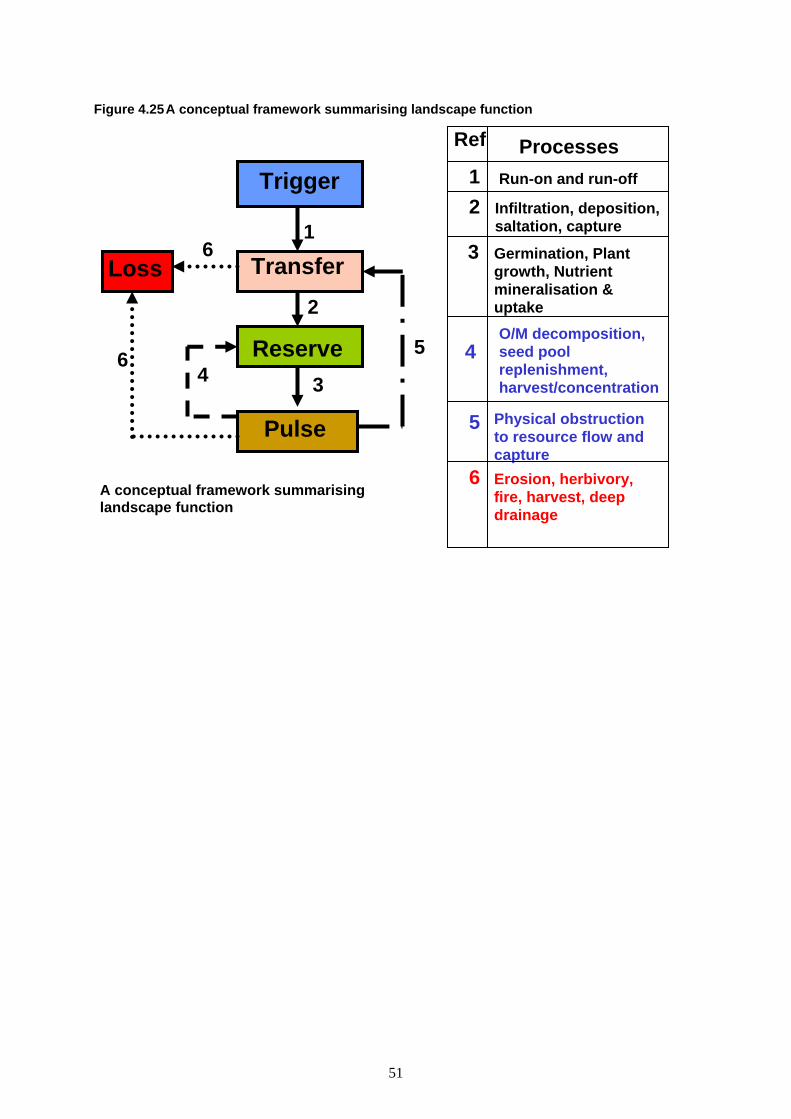
Figure 4.25 A conceptual framework summarising landscape function
Trigger
Transfer
Pulse
Loss 1
2
3 4 56
Ref Processes 1 Run-on and run-off
6
2 Infiltration, deposition, saltation, capture
3 Germination, Plant growth, Nutrient mineralisation & uptake O/M decomposition, seed pool replenishment, harvest/concentration
5 Physical obstruction to resource flow and capture
6 Erosion, herbivory, fire, harvest, deep drainage
Reserve 4
A conceptual framework summarising landscape function
51

Figure 4.26 The relationship between landscape function and landscape condition
Continuum of Landscape Condition
Continuum of Landscape Function
Totally Dysfunctional
‘Leaky’ Landscapes
Fully Functional ‘Conserving’ Landscapes
Current State
Grazing Worst Condition Best Condition
Societal Values
‘Acceptable’ ‘Unacceptable’
CarbonSequestration
Conservation of Biodiversity
The present role of LFA/EFA is in the monitoring and assessment of the rehabilitation of mine sites. Through LFA/EFA, the rate of progress of the site towards a self-sustaining state can be determined. In this context it provides valuable information about the success of rehabilitation and the need for and extent of ongoing investment in managing the rehabilitation sites. Figure 4.27 shows the relationship between an LFA index (stability) and distance from water of a rangeland site, where disturbance decreases further from water due to diminishing impact from stock. This s-shaped curve can be generalised as the key relationship between LFA indicators and disturbance. The figure is annotated to describe how a manager can use position on the curve to determine management actions. For example, is an observed level of function likely to improve if disturbance is reduced, or will active management be needed to bring the landscape to the point where it is self-regulating? These questions are obviously applicable to the land uses in the Hawkesbury region. The technique of LFA has been successfully applied on numerous sites across Australia ranging from sandy deserts (200mm pa rainfall) to tropical rainforests (4000mm pa rainfall) so is broadly applicable.
52

Figure 4.27 Relationship between LFA index and disturbance
Source: CSIRO (Tongway and Hindley 2003)
Using LFA does not require detailed local or technical knowledge and can be learnt quickly with apparently high observer reliability (David Tongway, pers. comm.). Tests of observer reliability are presently being undertaken with novice users being compared to expert users following a 2-day training program. Initial results, as yet unpublished, suggest that the methodology is robust enough for experts and novices to generate very similar results. It has also been shown that field-based EFA measurements were transferable to an airborne hyperspectral platform (Ong et al. in press). Several manuals explaining LFA have been produced (Tongway and Hindley 2004) and the technique is being applied as an integral part of the Western Australian Rangeland Monitoring System (WARMS) since 2000 on grassland sites in the Kimberleys and since 1995 in Scrub in the Pilbara (Watson 2006; Watson et al. 2006). Data from WARMS sites in the Gascoyne-Murchison Region were used as part of a case study reported to the Australian Collaborative Rangeland Information System (ACRIS) management committee (Watson et al. 2006).
In the context of this project, it was anticipated that LFA could provide evidence to help compare different land uses in the same landscape. Some land uses may represent greater levels of disturbance and therefore a greater degree of leakiness.
Methods
Step 1. Brief site description and analysis. This is a more superficial overview of the property, describing slope orientation, and dominant vegetation, land use etc.
Step 2. Describe ‘landscape organisation’ by laying a simple transect down the slope using a long tape (see Figure 4.28). The transect is divided into ‘patches’ and ‘interpatches’ - patches are areas where it is clear that vital resources are being retained, and interpatches where there is evidence that material is or has been flowing down the slope. There may be several different types of patches and interpatches and each is given a name. The boundaries between patches and interpatches are then recorded on a landscape organisation data sheet, along with the widths of the patches.
53

Figure 4.28 Landscape organisation (showing key features involved in carrying out LFA)
Step 3. Sampling. Allocate sampling sites along the transect. Ideally, each patch and interpatch type should have 3 sites, and each site should be 1m in length. In reality this is not always possible.
Step 4. Soil surface analysis for each sampling site. This involves ranking 11 different Soil Surface Indicators (SSIs) and allocating SSIs to stability, water infiltration and nutrient cycling. Each SSI is a ranking and these are recorded on a soil surface data sheet in the field. Subsequently all data are entered into a simple excel-based software package called Landscape Function data entry. The software allocates the SSIs to three different indices: Stability; Water Infiltration; and Nutrient Cycling (see Figure 4.29) and these are expressed as a number out of 100.
Patch Length
PatchWidth
Start
Biological Patches canbe grass, trees, shrubs, logsor any combination.
Litter accumulationIndicates patch size
10
20
30
40LFA transect line
Interpatchzonelength
54

Figure 4.29 Soil Surface Indicators and their contribution to LFA Indices
Source: Tongway and Hindley 2004
The technique is a culmination of more than three decades of painstaking research through which analytical investigations of the three indices were matched to relevant observations. The indicators used in LFA/EFA have been systematically evaluated and have been ‘shown to have a very high degree of verification with the measured properties’(Tongway and Hindley 2003). A full explanation of the technique is contained in a series of manuals written for different users and is available free of charge from the website (http://www.cse.csiro.au/research/efa/#manual).
The next step in the use of LFA is interpretation of the results. The LFA data for each site is summarised in tables on the summary page of the data entry software. Table 4.9 explains how to make use of the information embedded in this summary.
55

Table 4.9 Summary of LFA Data Entry Software
Landscape
ZoneMean Zone Length (m) %
Bare soil 1.08 12.7vegetation Patc 2.64 54.7Tree Patch 3.67 32.5
Total 100.0
Patches Patch zone Code Width (cm) No Meanvegetation Patcvp 5520 7 788.6Tree Patch tp 2160 3 720.0
Total 7680 10 768.0
Number of Patches/10m 3.0Total Patch Area 239.9 sq. m.Patch Area Index 0.71Landscape Organisation Index 0.87Average Interpatch Length (m) 1.08 mRange Interpatch length 0.5 1.55
length of patches/length of transecttotal patch area/max. area of patches (transect length * 10)
Zone Stability Std err Infiltration Std err Nutrients Std errBare soil 64.2 0.8 20.1 3.4 19.4 2.0vegetation Patc 71.3 1.6 30.8 1.8 29.0 2.0
ree Patch 70.4 2.3 40.5 1.7T 38.8 1.5
Zone Stability Std err Infiltration Std err Nutrients Std errBare soil 8.2 0.1 2.6 0.4 2.5 0.3vegetation Patc 39.0 0.9 16.8 1.0 15.9 1.1T
T
Soil Surface Assessment of Individual Zones
Soil Surface Assessment : Individual zones contribution to the whole Landscape
ChowillaBbox woodlandtransect 125/06/07Date
Site NameLocation
Transect Name
ree Patch 22.9 0.8 13.2 0.6 12.6 0.5
otal 70.1 1.9 32.6 2.1 31.0 2.0
This box summarises the proportions of each patch and inter-patch type identified on the LFA transect. The data can be used “on their own” and are also used by the spreadsheet to calculate site LFA indices
This box presents the widths of each patch type
These six indices reflect different aspects of landscape organisation. They vary in their information content according to landscape type. Select the most useful for a given purpose
This table summarises the mean LFA indices for each patch and inter-patch type assessed, and also presents the standard error of the mean, which should be < 2.5.
This table calculates the relative contribution to the whole transect of each patch and inter-patch assessed, using the values from the table immediately above, and the table at the top of the page, which presents the relative proportions. The “site” values for each Index are the bottom line on this table, together with the site standard error of the means.
56

Results
LFA was undertaken at the four representative sites for this project as well as an additional two sites in order to demonstrate a wider range of examples including a suburban garden. As outlined under ‘Methods’, at each property we conducted a site appraisal and laid out a number of LFA transects that would provide relevant and meaningful comparisons to the property and the project. We then conducted Soil Surface Analyses on each transect and generated values for the indicators for nutrient cycling, stability and water infiltration.
Sites analysed:
1. Enniskillen – the orchard and the residential property are on the same hill slope, allowing comparisons.
2. Joe Saliba – comparison was possible of orchard blocks at varying stages in the production cycle on the same property, as well as parkland and bushland on the same hill slope.
3. Chorley’s Permaculture Garden – intensively managed ‘garden’ developed along permaculture lines with various areas under different multi-species horticulture on the same hill slope.
4. Sean’s orchard – an area of mown grassland on the site of a former orchard.
5. Bill Shields’ orchard – comparison possible of blocks of orchard trees at varying stages in the production cycle including areas cleared of trees and awaiting replanting.
6. Suburban area Katoomba – a suburban house with extensive gardens, which provided the opportunity to compare garden, house, landscaping and road on the same hill slope.
The following results show landscape function indicator values for stability, infiltration and nutrient cycling derived from field data collected on several visits to cooperating properties. The raw data and standard errors are available but because of the uniformity of the zones in the landscape that are subject to close management by landholders, standard errors are mostly small (most were less than three). Time series data are needed to generate more information and to gain greater confidence in the findings.
57

Site 1: Established orchard specialising in roadside sales (Shields)
Figure 4.30 LFA - Shields Orchard
Comparison of mature orchard and former orchard on same slope
0.0
10.0
20.030.0
40.0
50.0
60.070.0
80.0
90.0
Old OrchardRow
Old BetweenRow
Total Orchard Row BetweenRow
Total
Former orchard Mature orchard
Land
scap
e Fu
nctio
n V
alue
s
StabilityInfiltrationNutrients
In this orchard transects were measured across two orchard blocks, one from which mature trees had been removed the previous year and one containing mature apple trees. Both blocks had inter-rows dominated by naturalised perennial grass Paspalum dilatatum. As shown in Figure 4.30, the only clear difference was between the old orchard row in the former orchard and the orchard row of the mature orchard. Removing the trees had decreased each of the LFA indicators in the old orchard row but marginally increased between rows. One could speculate that the perennial grass would soon take over in the old orchard row and reduce the difference.
58

Site 2: Established orchard supplying large retail chains (Saliba)
Figure 4.31 LFA Saliba Orchard
Comparing two orchard types and parkland on same slope
0.010.020.030.040.050.060.070.080.0
bush dirt
gras
sTo
tal
orch
ard
gras
sTo
tal
youn
ggr
ass
old
gras
sTo
tal
bush&lawn un-netted netted
Zones
Land
scap
e Fu
nctio
n Va
lues
StabilityInfiltrationNutrients
Figure 4.31 shows a number of comparisons. Firstly, on the bush and lawn zone, areas of ‘lawn’ (grass) and relatively bare soil (dirt) under tall native trees function significantly lower than areas with a shrub layer, especially for water infiltration and nutrient cycling. Secondly, mature orchard trees with a mulch layer underneath function well (in terms of stability, infiltration and nutrient cycling). Thirdly, young trees contribute much less to landscape function than mature trees. Finally, orchard inter-row under a perennial grass sward can function well and that function probably increases as the orchard block matures.
59

Site 3: Semi-commercial orchard and tourism enterprise (Enniskillen)
Figure 4.32 LFA Enniskillen Orchard
Comparison of orchard, former orchard and backyard on same slope
0.010.020.030.040.050.060.070.080.090.0
Mul
ched
Row
Betw
een
Row
sTo
tal
Un-
mul
ched
Form
eror
char
d
rock
ysl
ope
gras
spa
tch
dead
tree
Tota
l
Existing orchard Formerorchard
Backyard aboveorchard
Land
scap
e Fu
nctio
n Va
lues
StabilityInfiltrationNutrients
This site provides another comparison of a number of land uses on a hill slope. From Figure 4.32 it can be seen that a mature existing orchard can function quite highly, and that rows and inter-rows function similarly. However if the orchard row is not mulched, all three landscape function indicators drop sharply. The ‘former orchard’ zone on this site showed no difference between previous rows and inter-rows, with the perennial grass sward having established strongly across the slope. The backyard zone up the slope from the orchard consisted of mown grass under tall mature trees. On this zone, where grass has established strongly (grass patch) it functions similarly to mature mulched orchard but where grass is growing less strongly and there are bare patches (rocky slope and dead tree patch) function is less.
60

Site 4: Former orchard now under mown grass
Figure 4.33 Sean’s orchard
Mown grass after orchard
0.010.020.030.040.050.060.070.080.0
Patch Interpatch Total
Zones
Land
scap
e Fu
nctio
n va
lues
StabilityInfiltrationNutrients
On superficial inspection, this site appeared relatively uniform but under closer scrutiny could be divided into zones of accumulation (patch) and of run-off (interpatch) and these functioned quite differently. As a hillslope it was therefore quite vulnerable to soil and nutrient loss and to erosion if management was such that interpatch area increased. This was a more exposed site under lighter soils, and as a result growth of naturalised perennial grasses was much less here and consequently, rather than a dense, grassy sward, there was more bare ground and more ephemeral herbs which would disappear under dry, hot conditions.
61

Site 5: Permaculture garden (J&J Chorley)
Figure 4.34 LFA Permaculture garden
Permaculture garden
0102030405060708090
Potato Patc
h
Persim
mon Tree
Bluebe
rry Patc
h
Mulched
Path
Hazelnut
Row
Hazelnut
Path Total
Zones
Land
scap
e Fu
nctio
n va
lues
StabilityInfiltrationNutrients
This site was at higher altitude and the monitored part of this site was in a densely vegetated permaculture garden consisting of a variety of exotic perennial tree and bramble crops with some annuals under wire netting to prevent damage from foraging vertebrates. As expected this site had overall high function values with the exception of those parts where a very dense canopy had formed leaving leaf litter and bare ground underneath.
An unexpected feature of this site was that, despite a large volume of litter being produced, there was only evidence of slight decomposition. Much of the litter sat above the clay soil with little or no development of a humus layer. Further consultation and investigation would be necessary to understand this observation. It may be a function of soil type, the relative lack of faunal diversity under the net, or fewer native plants to generate soil biodiversity leading to very limited soil bioperturbation.
62

Site 6: Well-established suburban garden Katoomba
Figure 4.35a LFA garden in Katoomba
Established garden
0.010.020.030.040.050.060.070.080.090.0
grass
y patc
h
mulch patc
h
pine patc
hlaw
n
peren
nial garde
n
vege
table be
dTota
l
Zones
Land
scap
e Fu
nctio
n va
lues
StabilityInfiltrationNutrients
This garden has been in place for up to 100 years and has been actively managed throughout that time. A transect was run down the slope to capture the full range of the parts of the garden as shown in Figure 4.35a. It probably represents the higher end of functioning for a suburban garden dominated by exotic plants. The biggest contributor to function on this transect is long-lived perennials and their litter and the extent to which that litter is decomposing.
Figure 4.35b shows the LFA resulting from an attempt to incorporate the house and driveway into the LFA for the suburban block. The overall plan of the whole block was taken into account and makes judgements about how a house and a driveway should be treated. The indices were not designed with a house in mind, and Table 4.10 provides a justification of the decisions made. An implicit assumption is that the water falling on the roof of the house and on the drive is not used on the block but is removed via the stormwater drainage system.
63

Figure 4.35b LFA of garden including house and driveway
House block with established garden
0.010.020.030.040.050.060.070.080.090.0
gras
sy pa
tch
mulch patc
h
pine patc
hlaw
n
peren
nial garde
n
vege
table be
d
hous
e
drive
wayTota
l
Zones
Land
scap
e Fu
nctio
n V
alue
s
StabilityInfiltrationNutrients
Table 4.10 Attribution of LFA values to house
Features Max score
Value given
Justification
Soil Cover 5 5 Soil totally protected by house
Per. basal / canopy cover 4 1 No perennial plant cover
Litter cover, orig & incorp. 10 1 No litter
Cryptogam cover 4 0 No cryptogam habitat due to complete shade of soil under house
Crust broken-ness 4 0 Assume no crust on soil due to lack of exposure to weather
Erosion type and severity 4 4 Assume no erosion due to complete cover
Deposited materials 4 4 Assume no deposition due to complete cover
Soil surface roughness 5 1 Iron roof does not impede surface flow, soil surface not exposed to run-off
Surface resist. to disturb. 5 4 Equate roof surface with strongly crusted soil
Slake test 4 0 Not relevant due to complete cover
Texture 4 3 Not relevant due to complete cover
It is clear from the data that a well-established and actively managed garden can maintain some landscape function, but as the proportion of the area under paving (driveways, paths etc) and houses increases, water infiltration and nutrient cycling will decline sharply.
Site 6 is by no means a typical suburban block. Figure 4.35c shows what might occur on a more typical block using the data attributed to site 6 but at varying dimensions. It assumes a transect 35m in length stretching from the back to the front of the block divided into zones as shown in Table 4.11 below. Figure 4.35c shows that while the stability indicator doesn’t change much, water infiltration and nutrient cycling are much lower on a typical suburban block. With urban consolidation this effect will become more pronounced.
64

Table 4.11 A typical suburban house and garden
Zone Mean Zone Length (m) %
Lawn 4.75 27.1 Tree 1.50 4.3
Paving 3.00 17.1 House 15.00 42.9
Garden bed 1.50 8.6 Total 100.0
Figure 4.35c LFA of house block more typical of urban landscapes
House block with 'typical' garden
0.010.020.030.040.050.060.070.080.090.0
Lawn Tree Paving house gardenbed
Total
Zones
Land
scap
e Fu
nctio
n va
lues
StabilityInfiltrationNutrients
Figure 4.36 One of the investigators (Peter Ampt) demonstrates the laying out of an LFA transect to a group of interested farmers at a meeting of research participants March 2008
65

4.3.3 GIS tools for regional policy and farm management strategies
Objectives
• To identify GIS data relevant to the study area.
• To investigate how the GIS data can be linked to data collected at the Organic Waste Conversion and LFA levels of analysis.
• To develop a ‘toolkit’ from an integrated data set from the Organic Waste Conversion outcomes and LFA, that can provide a means of monitoring environmental processes at the farm, landscape or regional level.
• To apply the toolkit to assessing not just the ‘leakiness’ at a particular level, but also to assess its cumulative impact across a rural landscape and monitor the success of efforts to address the problem.
Background
GIS Technology
Geographic Information Systems (GIS) provide a platform for spatial analysis of data. Besides simple landscape mapping, they provide a framework for the development of models of real world processes that can be used to make predictions and test hypotheses. Various algorithms have been developed as standard approaches to investigating certain aspects of the spatial world.
The use of GIS involves two main approaches:
• Vector analysis uses points, lines and polygons with associated values to represent real world situations. These are used to represent things such as vegetation, rivers, roads and locational information.
• Raster analysis uses grids of various scales to represent the piece of the real world it covers. Grids, as they are known, provide opportunities to map continuous data across an area, and each grid in some way represents a value in that square.
Applications of GIS to Landscape Analysis
GIS analysis provides the capacity to model and evaluate environmental and ecological processes of landscapes at a regional level. GIS can be used to provide a regional framework for LFA through providing a catchment-wide model for biophysical processes putting the more localised LFA monitoring into a regional context. It is useful for researchers/practitioners to be able to relate LFA to these regional scale indices. There is also potential to develop ‘budgets’ for a catchment and monitor the contribution of each private landholding to these budgets.
A package of tools using existing Arcview and Arcgis extensions was developed to support this project, along with relevant GIS data. This was a compilation of the relevant literature using spatial analyses such as patch analysis, hydrological analysis and erosion and depositional modeling. Several models were produced to provide an indication of the application of GIS to LFA in this project.
Methodology
Data Audit and Preparation
To allow for analysis of the catchments in the study region, the sub-catchments were identified and a data search was conducted to identify GIS data sets developed for each study area.
66

Table 4.12 GIS Tools and Data Sets used in modeling
Title Data Type Data Holder Description 25m Digital Elevation Model Terrain LPI
25k Drainage Drainage LPI
This consists of surface water features that occur naturally. The dataset consists of flowed (vectors point downhill), topologically sound network of surface drainage lines, area features and point features. Attributes for name class and status are included.
RBG Vegetation Vegetation DECC
The composition and extent of the present natural vegetation are mapped and described in terms of structure and characteristic species. Vegetation codes are compatible with other RBG 1:100,000 mapping.
Soil Landscapes
A description of the nature and extent of the soils based on soil landscapes. They provide a basis for broad regional planning, as they relate not only to the soils present, but also to geology, landform and vegetation.
Mean Rainfall for NSW (ESOCLIM Model)
Mean annual rainfall calculated by summing estimated mean monthly climate-derived monthly rainfall grids (ESOCLIM)
Mean Temperature for NSW (ESOCLIM Model)
Mean annual temperature calculated by summing estimate mean monthly climate-derived monthly minimum and maximum temperature grids and then dividing by 24 (ESOCLIM). NB: Values are degrees celsius multiplied by 10 to retain information to one decimal place and maintaining integer format.
Cartographic Geological Spatial Data
Department of Mineral Resources (DMR)
Merged Tenure
Merged tenure for Central Directorate. Created from existing tenure themes to enable analysis of by-tenure area.
UWS Land use UWS DLWC Land use DIPNR
67

Topographic Position
A method described by Weiss (2001) was used to identify the topographic position (TPL) for the various catchments within the study area. The classification criteria used were as follows:
RIDGE TPI > 1 SD UPPER SLOPE TPI > 0.5 SD and <= 1 SD MIDDLE SLOPE TPI > -0.5 SD and < 0.5 SD [Slope > 5 degrees] FLAT SLOPE TPI >= -0.5 SD and <= 0.5 SD [Slope <= 5 degrees] LOWER SLOPE TPI >= -1 SD and < -0.5 SD VALLEY TPI < -1 SD
The outcome of this process can be seen in Figure 4.37, which maps the topographical features of the study area.
Figure 4.37 Topographical features of the study area
68

Erosion, Deposition and the K Factor
The vulnerability of a region to soil erosion is usually understood in terms of the susceptibility of land to the detachment and transportation of soil particles by erosive agents (Houghton & Charman, 1986). It is based solely on soil properties and ignores other attributes such as slope gradient, slope length, landform element and rainfall characteristics. The K Factor gives an indication of the vulnerability to erosion of the soil and depends mainly on soil texture, structure, permeability and organic matter content.
A grid of the K factor was derived by adding the K Factor for each Soil Landscape as described by the associated manual for each soil landscape GIS layer. The resulting map (Figure 4.38) shows the K factor grouped into values:
0.00 - 0.01 very low 0.01 - 0.02 low 0.02 - 0.04 moderate 0.04 - 0.06 high >0.06 very high
Figure 4.38 K Factor grid indicating vulnerability to erosion in the study area
69

LS Factor
The Landscape Slope (LS) factor incorporates the slope length and slope steepness, and was calculated using an implementation of Moore and Burch (1986) as defined in the equation developed by Engel (1999).
Catchment Modeling
To allow for the processing of models used in this project, the 25m Digital Elevation Model (DEM) was produced using the GIS software tool AGREE, to bring it in line with the actual drainage and contour lines. AGREE methods recondition a DEM by imposing (or burning in) linear drainage features onto it. This is an implementation extension of the AGREE method developed at the University of Texas (1997). The AGREE/DEM was raised 28 m to eliminate negative values. The Fill Sinks function was then used to fill sinks in the Agree DEM. This eliminates the problem caused when a cell is surrounded by cells with higher elevation resulting in the water being trapped in that cell and cannot flow (ESRI 2002). From the AGREE/DEM, a series of models were developed which describe catchment functions and provide required data for further analysis.
Through this catchment modeling process a GIS model is developed which has the following characteristics:
• Flow Direction - the flow direction creates a grid that identifies the direction of the steepest descent from that cell.
• Flow Accumulation - computes the flow accumulation grid that contains the accumulated number of cells upstream of a cell, for each cell in the input grid.
• Stream Definition - this function computes a stream grid which contains a value of "1" for all the cells in the input flow accumulation grid that have a value greater than the given threshold. All other cells in the Stream Grid contain no data.
• Stream Segmentation - this function creates a grid of stream segments that have a unique identification. Either a segment may be a head segment, or it may be defined as a segment between two segment junctions. All the cells in a particular segment have the same grid code that is specific to that segment.
• Catchment Grid Delineation - this function creates a grid in which each cell carries a value (grid code) indicating to which catchment the cell belongs. The value corresponds to the value carried by the stream segment that drains that area, defined in the stream segment link grid.
• Catchment Polygon Processing - this function converts a catchment grid it into a catchment polygon feature.
• Drainage Line Processing - this function converts the input Stream Link grid into a Drainage Line feature class. Each line in the feature class carries the identifier of the catchment in which it resides.
• Adjoint Catchment Processing - this function generates the aggregated upstream catchments from the "Catchment" feature class. For each catchment that is not a head catchment, a polygon representing the whole upstream area draining to its inlet point is constructed and stored in a feature class that has an "Adjoint Catchment" tag. This feature class is used to speed up the point delineation process.
• Drainage Point Processing - this function allows generating the drainage points associated to the catchments (ESRI 2002).
70
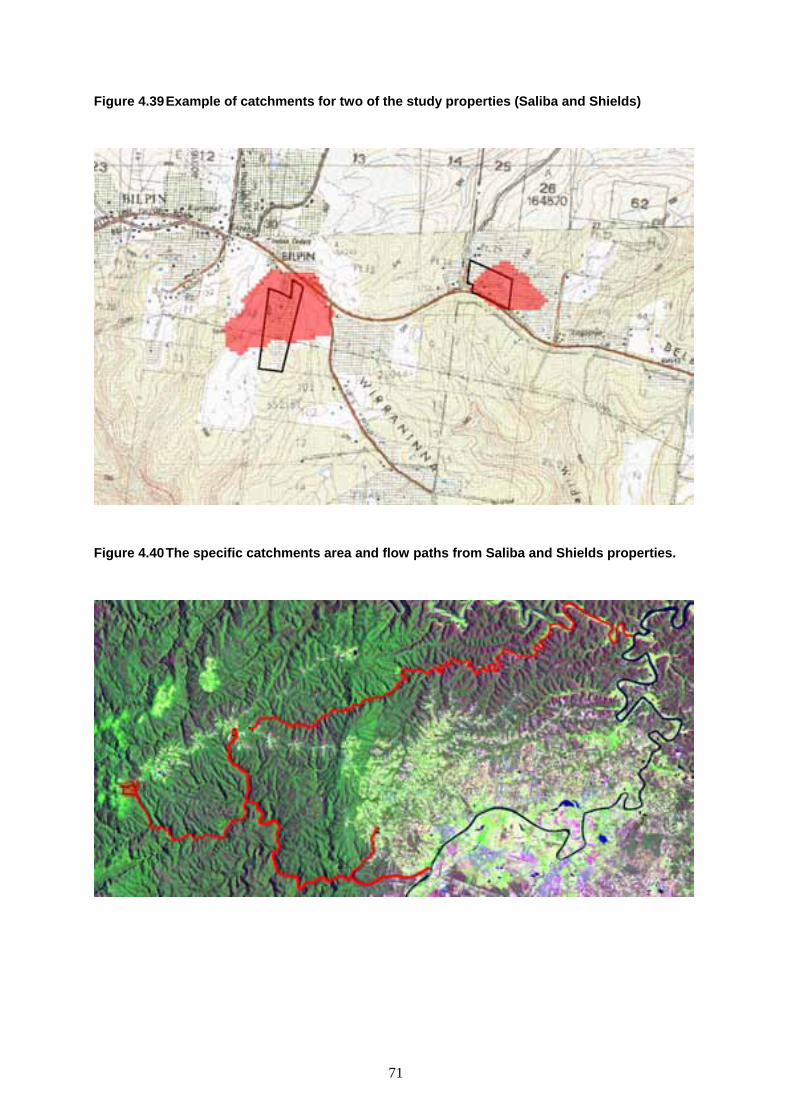
Figure 4.39 Example of catchments for two of the study properties (Saliba and Shields)
Figure 4.40 The specific catchments area and flow paths from Saliba and Shields properties.
71

Climate Change Data
One of the values of using GIS as a farm and regional level tool for monitoring environment change is that it can also provide useful information on the likely impacts of climate change. While the modeling here is somewhat crude (see Figure 4.41, 4.42 and 4.43), they are based on the higher range of the CSIRO scenarios for NSW and are included only to demonstrate the potential of GIS systems to integrate climate change data. While the data used in these models are too broad to have specific predictive accuracy for the study region, they do show the capacity of such GIS systems to map and monitor the potential changes in temperature and rainfall at a catchment and regional basis. As climate models become spatially more finely focused, with regional monitoring data included, GIS-based models will be able to provide farmers with a potential time frame in which to shift from one crop to another. For instance in the future apples might not be able to grown in the study area whereas other crops presently not suited to the area will. However such climate modeling could provide sufficient warning of such long-term temperature and rainfall changes to allow a strategically planned shift to more appropriate crops, and thus enabling greater resilience and more sustainable agricultural production in the region in the future.
Figure 4.41 Current average rainfall pattern in study area
72
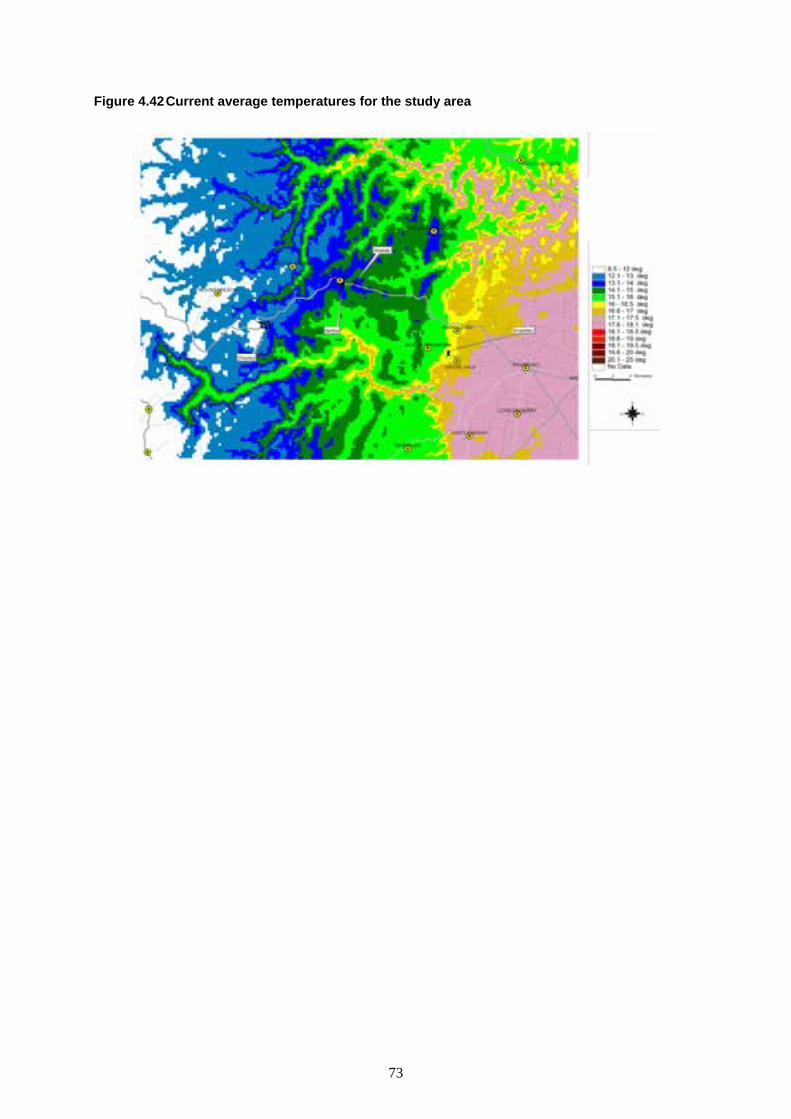
Figure 4.42 Current average temperatures for the study area
73

Figure 4.43 Potential change to rainfall and temperature in study area under conditions of climate change
74

5. Discussion of results
5.1 Organic waste conversion
The HARtDaC project (section 1.1.1) noted that the dominant industries in Hawkesbury include mushrooms, market gardens, orcharding, cut flowers, nurseries, turf and poultry. Orcharding has been a traditional industry in the Hawkesbury area since the 1940s and contributes over $4.6m PA to the economy of Hawkesbury. The value of the mushroom industry in the Hawkesbury was estimated at $25.8m PA at the time of the 2001 agricultural census, but NSW Agriculture currently estimates indicate that the value could be in the range of $70m PA. The mushroom industry (principally the Agaricus mushroom) is one of the largest industries in the Hawkesbury, providing a significant amount of employment to the area. However, the HARtDaC report noted that the mushroom industry is in an uncertain position due to conflicts with the local community over the adverse aspects of the industry, including the odour produced during composting for Agaricus mushroom production. It was thought that this might in time lead to mushroom producers relocating, along with composting facilities, to outer lying council areas in NSW.
The production of so-called specialty mushrooms utilising woody waste from orchards thus represents an opportunity to combine two traditional Hawkesbury activities in a localised eco-friendly way. Oyster (Pleurotus species) and Shiitake (Lentinula edodes) mushrooms were chosen for examination and are well suited for beginning mushroom cultivators because they are considered easier to grow than many of the other species, and they can be grown commercially on a small scale with a moderate initial investment. In addition, there is already a market for them, largely because commercial producers of Agaricus mushrooms have been diversifying their operations into specialty mushrooms. This project examined the in situ bioremediation of woody waste from orchards into these specialty mushroom crops and high quality spent mushroom compost using simple, non-commercial processes that would not add significantly to the growers’ normal activities.
Oyster mushrooms are commonly grown on sterile straw from wheat or rice, but they will also grow on a wide variety of high-cellulose waste materials. In addition, some of these materials do not require sterilisation, only pasteurisation, which is less expensive for commercial production. Another advantage of growing Oyster mushrooms is that a high percentage of the substrate converts to fruiting bodies, increasing the potential profitability. Locally grown Oyster mushrooms have a sales advantage because Oysters have a very limited shelf life and are too fragile to ship easily. The grower with direct, local sales can supply a fresher product that remains in better condition. Shiitake is also well suited as a low-input alternative enterprise because this mushroom type, like Oyster mushrooms, can be grown on a small scale with a moderate initial investment. If suitable for outdoor cultivation on apple wood waste, Shiitake may prove to be a better fungus than the Oyster mushroom, as it is more highly prized (and thus popular), has a longer shelf life and is more robust.
Each year the growers surveyed removed trees as a part of their cycle of stock replacement and to enable the addition of new varieties. Woody waste from this activity would normally be chipped and used on-site, chipped by a third party and removed for sale, or burnt. The growers expressed an interest in the bio-remediation of this material for mushroom production if it could augment their existing horticultural practices without adding significantly to or disrupting their normal activities. This study demonstrated that chipped wood can be used in the commercial production of fungal fruiting bodies under controlled growth conditions utilising bag growth systems and sterilised or pasteurised substrate. However, broadcast sowing (or mound cultivation) onto unsterilised wood chips is also possible and is more suited to non-commercial or the lower maintenance (and yield) operations that are envisaged in this investigation.
In summary, a simple process for the bio-remediation of apple wood chips was developed using Pleurotus ostreatus and fruiting bodies were produced on sterilised material at a small-scale with a
75

biological efficiency of ~ 45%. Biological efficiencies of between 75 – 200% have been recorded for Pleurotus and the lower value obtained in these experiments is thought to be indicative of the suboptimal and non-manipulated primordial and fruiting body development conditions. Pleurotus ostreatus growth at a larger scale (3.6 kg wet wt) on unsterilised apple wood chips in bags was achieved and fruiting body production is anticipated in the near future. Work is continuing to scale-up the process in a simple fashion to establish an on-farm large-scale growth trial using several hundred kilograms of apple wood chips.
A simple cost-benefit analysis of the microbial bioremediation of apple tree material has shown that the production and sale of fruiting bodies using woody waste would result in profits to the producer. If a greater biological efficiency and a mushroom sale price half that of the supermarkets are achieved a significant profit (in thousands of dollars) could be realised per tonne of apple wood waste. In addition, the spent mushroom substrate after mushroom harvesting may be of further value, as mulch to the orchardists in that Pleurotus ostreatus is known to exude metabolites that are toxic to nematodes that may occur within orchard soils. It may be most appropriate and of greater convenience to the end-users if a local co-operative or technical support service provided fungi as growing spawn for further non-sterile spawn scale-up on-farm or for direct woody substrate inoculation. This would involve some additional fees for services but would provide a more likely end product and, if restricted to the initial spawn production stages, should not impact significantly upon profits.
Further, this simple pilot study of one bioremediation process demonstrated that this and other similar processes could be easily and effectively added to commercial orchards, which could enhance the viability and sustainability of these enterprises. These processes would also enhance the ecosystem services and buffer zone functions that the farming community provides.
5.2 LFA outcomes
This work provided an initial determination of the utility of LFA as a method for comparing the functional attributes of different land uses. Comparisons can confidently be made between zones on the one site, but values between sites can only be compared cautiously. Where differences in values between sites are large, conclusions need to be made in the context of key features represented at each of the sites.
LFA discriminated quite finely between orchards with different ages of trees, under tree mulch and between row vegetation. It also provided comparative data that could be used to contrast the functionality of, for example, grassy slopes, lawns, bushland and orchards on the same or similar hill slopes. LFA did not appear to discriminate between land uses that were already functioning at a quite high level based on landscape function indicator values for stability, infiltration and nutrient cycling (e.g. for a multi-species permaculture garden and a mature, well-mulched orchard with a thick stand of perennial grass in the inter-row). The application of LFA to a suburban house, garden and street would appear to be quite informative, especially if it allows urban areas to be included in across-landscape comparisons.
The value of LFA as a farm level tool and as a means of assessing and monitoring changes in land use at a regional level was clearly appreciated by the farmers involved in the field trials in Bill Shields Orchard in March (shown in Figure 4.36). LFA has usually been applied to environmental assessments in rangelands and for land being reclaimed after mining. However coupled with the application of Soil Microbial Systems at one end of the spectrum and GIS at the other, a suite of interlocking tools for monitoring environmental change in each study area could be developed which would act at a complementary range of temporal and spatial scales.
76
5.3 GIS outcomes
A value of GIS modeling is that it can link the environmental functioning of specific properties into a regional framework. In the case of the Saliba and Shields orchards, the sub-catchments for each of the farms were established (Figure 4.39). This model can identify the surrounding landscape that impacts on a particular farm in terms of water flows. It can also provide a means of assessing the landscape function of a farm such as ‘leakiness’ for the overall catchment (Figure 4.40). Over time, the use of such GIS tools in conjunction with LFA could help farmers quantify the environmental services provided by their farm, and also evaluate the impacts of changed production systems and land use. Through a simple monitoring program at a farm and regional level, the ecosystem services provided by agriculture (compared to native bushland or urban developments) could be integrated into a more adaptive environmental management strategy operating at both the farm and regional scale.
5.4 Overview of outcomes and lessons learnt
In the process of identifying agri-industries existing among the diverse landholdings located in the buffer zone between western Sydney and the north-eastern boundary of the Greater Blue Mountains World Heritage Area (GBMWHA), and documenting their economic, social and environmental impacts, this project has confirmed that despite the tacit support of local government, farmers in this region are under considerable pressure. The establishment of Hawkesbury Harvest has been significant for providing support for marketing and branding of regional products, but more initiatives are needed. Despite the recommendations of the Hawkesbury City Council’s HARtDaC report (2005), local government planning and local environmental planning remains confused and contradictory in terms of the support for and retention of agri-industries in the face of relentless pressure for urban development in the area. Nonetheless the very diverse modes of production as exemplified in the four different farming operations discussed in this report suggest that there is considerable resilience in the production systems across the region.
Agri-industries and regional land management agencies need innovative tools and strategies to address the challenges of not only urban development pressure but, significantly, changing climatic conditions and environmental pressures for zero emission production systems. In this respect the three tool sets developed as part of this project provide a starting point, including development of innovative enterprises compatible with environmental sustainability and integrated into existing industries.
The initial survey of producers guided a partnership approach with industry, government and communities in the region, and facilitated the researchers in taking an advocacy role in using regional and local economic, social, and environmental values as driving forces in developing economically viable and ecologically sustainable agri-industries.
A significant innovation arising from the project has been the application of organic waste conversion and the technique of using waste wood as the substrate for mushroom production which in turn leads to valuable mulch with anti-nematode properties. This represents a new paradigm in the treatment of horticultural waste, with the potential for positive economic and environmental outcomes for small horticultural businesses. The enthusiasm at field trials of adopting the approach reflects both its commercial potential and the demands for more sustainable land management, and is encouraging in terms of producers taking a high level of ownership of this as a new initiative. It also reflects the potential of integrated biosystems to not only provide new product ranges to existing farm operations, but also to enhance environmental management at the farm level.
Landscape function analysis (LFA) provides a tool for farm-based monitoring of key environmental indicators, and is an easily applied methodology. Erosion, loss of nutrient and inefficient water management are all aspects of the ‘leakiness’ of a farm system. However this project has demonstrated that most of the farming systems are performing well when measured against the optimal ecosystem services provided by the surrounding natural ecosystem. This is an important role that agri-industries can play in critical buffer zones between urban development and natural heritage areas such as the
77

GBMWHA. Linked, as we have argued, to capability for geographic information system (GIS) monitoring, both farmers and regional managers should also be able to monitor the impacts of both climatic change and the effectiveness of adaptive or remedial actions.
With respect to land use issues and local environmental planning, the project ideally would have assessed the effectiveness of environmental planning instruments across the entire local government area – however this was beyond the scope and means of the project as such analysis would require the extensive involvement of planning experts and access to detailed land use data and planning information.
The results are substantial in guiding new activities and approaches which improve agricultural productivity and also complement and enhance the values of the neighbouring protected conservation areas and the Hawkesbury-Nepean River System. The project focused on local community action and development of innovative local approaches to build resilience, but a major challenge will be the fundamental deficiencies of the planning system (section 1.1.2 and Appendix 1) to support new initiatives.
78

6. Implications The overall aim of this project was to seek conceptual, practical and policy leverage in relation to the role of agri-industries as a recognised and valued landscape buffer between protected conservation areas and encroaching land use change. A key recommendation given in this report (section 7) is development of a World Heritage Area buffer zone, and in particular that this buffer zone in the Hawkesbury-Nepean region be based on small-scale sustainable agri-industries which can provide an adequate buffer between urban development and the World Heritage property. Landscape Function Analysis has been shown to be a useful tool that can provide a measure of the ecosystem function of these buffers. An implication of this is that agricultural producers in the region can utilise the World Heritage status as leverage to gain financial and other support for their agricultural practices. Appendix 2 outlines the current UNESCO World Heritage approach to buffer zones, which is currently being reviewed due to their importance.
An International Expert Meeting on World Heritage and Buffer Zones was held in Switzerland (March 2008) to focus on problems and best practices concerning buffer zones and issues related to the integrity of properties inscribed on the World Heritage List. The outcomes of the meeting, including proposals of modifications to the Operational Guidelines of the World Heritage Convention (2005 version) regarding the definition and management of buffer zones, as well as conditions of integrity, were presented to the 32nd session of the World Heritage Committee (Québec, July 2008). It is therefore likely that World Heritage obligations relating to adequate buffer zones will receive more attention in future. Contention relating to buffer zones for World Heritage areas in Australia has not arisen to any significant extent to date, largely due to the fact that World Heritage sites until recently, have mostly been located in remote areas (Wiffen 2006).
The Greater Blue Mountains represents quite a unique case in this regard. The threatened impact of urban development, and thus the provision of a buffer, is dealt with under the NSW Environment Planning and Assessment Act 1979. However, World Heritage sites in Australia are the responsibility of the Commonwealth government, under its legislation, the Environment Protection and Biodiversity Conservation Act (EPBC Act). Wiffen (2006) notes that “recent case law suggests that the legislation can be used in other ways to prevent or react to impacts from outside a World heritage property”. If buffer zone regulation for World Heritage Areas becomes more stringent, then it may be beholden upon the local landholders to demonstrate their ecosystem services.
The three strategies addressed in this project (organic waste conversion, LGA and GIS) should be supported by local government policies and regulation if there is a serious intention to support agri-industries as critically needed buffer zones between urban and natural areas. Given the time and resources available for this project, we have not been able to develop the tool set identified in this report to the level where they can be easily applied by a small farmer, or regional land manager, however the response of the farming community at the final field day was that they were enthusiastic about seeing this done as part of a future project.
Adaptive management strategies will be necessary if the region’s agriculture is to develop the necessary resilience in the face of urban development pressure, market instability, and climatic change impacts. The application of the three tools outlined in this report (Organic Waste Conversion, LFA and GIS), each operating at a different temporal and spatial scale, support a move on the part of small farmers, larger agri-industries and regional land managers to more adaptive management strategies.
The project recognised at the outset the need to address the complex social, economic, technical and political variables that govern the region’s agri-industries. This led to the recognition that adaptive strategies based on the use of the tools outlined above would have a dual impact. An Integrated Bio-System (IBS) approach to waste using organic waste conversion (e.g. mushrooms) to address old apple trees supports both more sustainable farming practices and at the same time can increase farm income. Local orchardists attended a field day where bioremediation methodologies and mushroom handling
79

techniques were outlined. Feedback from the growers involved in the project was positive and it is anticipated that further field days will be held as the field trial progresses and as mushroom fruiting begins. In addition, one of the landholders (Bill Shields) has shown a strong commitment to establishing and maintaining the field trial through to mushroom production. The local co-operative or technical support service and especially a communal system of non-sterile spawn production will be explored further with growers. Information concerning the economic and environmental benefits to growers will be disseminated through local grower associations (eg Hawkesbury Harvest) to encourage adoption by other growers and inviting participation in the development of broader strategies covering more growers and waste streams. This component of the project has identified an interest in and the market potential for a new in situ waste reduction service for small horticultural businesses. The possible development of specific waste treatments to match growers’ requirements and cost minimisation through cooperative arrangements may help drive initial demand for the service.
Monitoring across farms using LFA would help address the ‘leakiness’ of a system (eg erosion, loss of nutrients and inefficient water management), and test strategies for remediation. GIS tools could in turn look at the aggregate effect of these remedial strategies at a catchment and regional level.
The issues faced by agri-industries in the Hawkesbury Nepean/ Blue Mountains regions are not far removed from those confronting many rural communities across Australia. We therefore believe that the approach taken in this research project and laid out in this report has application in many other rural and peri-urban areas across the country.
80

7. Recommendations There is a need for:
1. Ecosystem services of agriculture and the impacts of urban development
1.1 Further collection by researchers of comparative data on the ecosystem services of agriculture, in particular on:
• Impacts of the various types of existing agricultural uses and their relative values as providers of ecosystem services to the World Heritage Area and the Sydney Basin regime as a whole;
• Environmental impacts of urban development and subdivision such as urban run-off, protection of riparian vegetation and aquatic communities, and habitat loss.
1.2 State and local government to have greater appreciation of the diversity of farming modes in the region and of their contribution to regional ecosystem services as demonstrated by the maintenance of values measured by LFA and monitored by GIS.
1.3 NSW DPI to use the project outcomes to help develop a regional identity and marketing strategy, and to serve a direct promotional function that also supports continuing agricultural production in the Hawkesbury-Nepean catchment. The project results can provide leverage for new and revised government policies that enable emergence and appropriate continuing operation of new and more sustainable agri-industries.
2. Development of a World Heritage buffer zone
2.1 Environmental advocates to consult with natural resource management personnel from agencies regarding desirable changes to land management practices surrounding the World Heritage Area and the development of a buffer zone.
2.2 Researchers to obtain more comprehensive land use data from a wider sample of landholders and agricultural practices, including a comparative analysis of:
• Their relative functioning as an effective buffer for the World Heritage Area.
• The minimum size of buffer areas required for adequate protection of World Heritage Area values.
3. Future land use changes
3.1 Local natural resource management agencies to provide input to reviews of Local Environment Plans (LEPs) regarding the protection of the natural values of the WHA.
3.2 Hawkesbury City Council to build understanding of potential future changes to land use in the region (including urban development), involving a large-scale survey with in-depth interviews with landholders.
4. Tools for landscape-level environmental management
4.1 Development of the three tools (organic waste conversion, landscape function analysis, geographic information systems) into an integrated package for use by landholders to address farm and rural landscape-level environmental management. This development was requested by landholders involved in the project but was not possible within the timeframe of this project.
4.2 Organic waste conversion
81

4.2a DPI to explore as a suitable model the establishment of a local co-operative or technical support service charging a fee-for-service to end-users, for identification of appropriate bioremediation agents for horticultural wastes, such as mushroom cultivation – where spawn are provided (under sterile conditions) to businesses along with methodologies for use.
4.2b As an alternative to 4.2a, to explore a more communal system of non-sterile spawn production and provision for growers (in view of the non-competitive nature of the fruit growers’ different production and marketing strategies and because mushroom production would be a minor activity of the growers). This would reduce costs to growers and encourage co-operation between participants in the scheme. In the longer term a new enterprise development in the form of nodal networks of participants or a potential commercial investor might also be explored.
4.2c Further research into simplifying spawn production methods and the outdoor cultivation of specialty mushrooms.
4.2d Further work on strain selection and optimization, together with research into the suitability of other specialty mushrooms that might be appropriate for the woody wastes of the Hawkesbury region.
4.2e Local grower associations (eg Hawkesbury Harvest) to disseminate information concerning the economic and environmental benefits demonstrated in this project, to encourage adoption by other growers and inviting participation in the development of broader strategies covering more growers and waste streams.
4.3 Landscape function analysis (LFA)
4.3a LFA specialist to promote LFA as a useful methodology for orchardists and other agri-industry landholders in the region. A program could be coordinated (with Hawkesbury Harvest as an umbrella organisation) in which participants use LFA to:
• Inform management decisions of the environmental benefits or weaknesses of production systems;
• Embark on a documented program of continuous improvement to reduce the leakiness of land use;
• Provide evidence for their environmental stewardship that can then be used as a contrast to alternative land uses.
In particular:
4.3b Conduct LFA training with participating landholders and land management agencies in the area.
4.3c Devise a group monitoring and continuous improvement program that might involve regular LFA measurements of different orchard systems that already exist, and possibly a program of experimentation with innovations that might reduce leakiness as measured by LFA.
4.3d Conduct field days or information sessions on progress, and encourage other groups to join.
4.3e Develop a GIS layer that shows LFA values across the region, allowing comparisons between alternative land uses.
4.3f Generate a time series that shows changes in LFA values.
4.3g Develop ways of forecasting likely effects of new developments on the region’s landscape function as a predictive tool to identify potential problems.
4.3h Incorporate LFA into LEPs to manage impacts/risks of changes in planning regulations and to inform the planning process.
82

4.4 GIS Applications
4.4a DPI and Hawkesbury City Council (in conjunction with farming groups) to support the development of assessable GIS applications (ARCVIEW) for monitoring environmental change across the region.
4.4b GIS and LFA specialists to explore the potential links of GIS to LFA data, for both bush and rural landscapes, in relation to ecosystems services and catchment functions.
4.4c Researchers to incorporate climate change assessment into monitoring, and establish bio-monitoring regimes to help the farming and agri-industry groups better adapt to changing environmental conditions.
83
8. Appendices
1. Land Use Planning
This appendix outlines each of the Local Environment Plans (LEP) affecting land use in the Blue Mountains and Hawkesbury Local Government Areas (LGA) as they relate to this project. It addresses subdivisions and Development Control Plans (DCP), and the issue of standardization of plans.
Blue Mountains City Council (BMCC) Local Environment Plan (LEP) 2005
LEP 2005 is one of two LEPs currently in place in the Blue Mountains LGA – the other is LEP 1991. Together, these two plans replaced the earlier LEP 4, which was seen as outdated and inadequate given the sensitive natural environment of the LGA. The planning instruments relating to the outlying areas of the LGA were seen to be in need of urgent revision, so BMCC embarked on a two-stage process of revision, focusing first on the outlying areas, adjacent to the natural bushland. LEP 1991 was subsequently gazetted. After many years of community consultation and a Land and Environment Court public inquiry, LEP 2005 was also gazetted. It has been hailed as a progressive LEP which is based on the principles of sustainable development. As such, it contains many clauses intended to protect the sensitive environment of the Blue Mountains City LGA. LEP 2005 primarily covers the urban areas of the city, but nonetheless it contains zoning for areas of urban-bushland interface.
BMCC conducted extensive community consultation in the process of drawing up LEP 2005 – the first plan for the parts of the city it covers was exhibited in 1989. BMCC had intended to revise the LEP for the areas zoned according to LEP 1991 in line with the principles and objectives contained in LEP 2005, however by the time LEP 2005 was gazetted, the NSW government had embarked on a strategy to reform all of the state’s planning instruments and to standardise all NSW LEPs. This has meant BMCC unable to continue with its revision of LEP 1991 as planned, while it awaits the outcomes of negotiation with the Department of Planning regarding the rewriting of both its LEPs in order to comply with the new “Standard Instrument” (Local Environmental Plans) Order 2006.
LEP 2005 has increased protection of the environment by including zoning such as “Living Bushland Conservation” which, for example:
• increases the minimum lot size for subdivision from 720m2 for the Living General zone to 1,200m2 for the Living Bushland Conservation;
• restricts site coverage and specifies a higher proportion of the lot to be retained as pervious;
• specifies the planting of locally indigenous vegetation species;
• allows the refusal of consent for the planting of environmental weeds.
Where relevant, BMCC LEP 2005 applies “split” zones that allow for constraints on developing environmentally sensitive land. Publicly available mapping data indicates not only the land use zoning, but also the location of watercourses, sensitive vegetation communities, topography, heritage sites, slope and bushfire prone land. Environmental constraints are applied not only to the vegetation community itself, for example, but to a buffer zone applied around the vegetation unit or watercourse.
Had the BMCC review of LEP 1991 proceeded according as planned prior to the State Government Planning reforms, revision of areas such as Mt Tomah, the location of one of the project’s representative landholders (the Chorley property), would have already occurred. The areas covered by LEP 1991 are those most sensitive in terms of environmental protection of the WHA as they are
84

generally on the urban-bushland interface – ie, those areas relevant to the BMWHI project. It is therefore imperative that these areas have clear and stringent development standards that ensure compliance with Environmentally Sustainable Development (ESD).
BMCC LEP 1991
As stated above, LEP 1991 applies to the rural fringes of the Blue Mountains LGA. The principle objectives of LEP 1991, while acknowledging the importance of the Blue Mountains National Park, are very general and quite subjective in nature, leaving them open to varying interpretations. For example “to recognise and maintain the positive qualities of the traditional lifestyle enjoyed by the residents of the city” (p2).
The Chorleys’ property is covered by additional objectives that acknowledge the low density semi-rural heritage and natural landscapes of the Mt Wilson-Mt Tomah area. These additional objectives (for Mt. Wilson, Mt. Irvine, Mt. Tomah and Berambing) are:
a. To conserve the low density, semi-rural heritage and natural landscapes.
b. To conserve areas of natural vegetation which provide key landscape and ecological elements, in particular, the rainforest and tall open forest communities on basalt soils.
c. To retain a pleasing combination of formal avenues and roadside plantings, private gardens and landscaping, forests and stands of natural vegetation, attractive rural and semi-rural landscape, local vistas and distant views.
d. To maintain the characteristics of the existing local roads, (i.e. curves, rises and falls, limited carriageway width, unpaved shoulders and verges, and adjacent vegetation and attractive plantings).
e. To conserve historic buildings, their curtilages and landscaped settings.
f. To ensure that the individual and cumulative impact of development does not have an adverse effect on stream catchments particularly associated with water supply or the Blue Mountains National Park.
g. To encourage a high quality of design.
h. To locate sensitively public utilities to minimise environmental and visual impact.
i. To minimise the impact of development on the Blue Mountains National Park by providing buffer areas and protecting wildlife corridors.
Hawkesbury City Council (HCC) LEP 1989
Amendment 108 and zoning objectives
Amendment 108 is the result of the Hawkesbury Sustainable Agriculture Development Strategy, 1997 that aimed to identify opportunities and strategies for promoting sustainable agriculture and recommended amendments to the Hawkesbury LEP 1989 to ensure that agriculture was preserved and encouraged in the Hawkesbury. Amendment 108 “amends the zone names, objectives and land uses in the rural and environmental protection zones but does not change the minimum lot sizes for subdivision” (Hawkesbury City Council, 2005, p27).
Amendment 108 amends the zone name and objectives of the zoning relevant to the representative landholders in the Bilpin area (Joe Saliba and Bill Shields). These properties are now located within a
85

zone called “Environmental Protection – Agriculture Protection (Scenic). Previously, these properties were zoned: “Zone No 7 (d1) (Environmental Protection (Scenic)). The objectives of Zone 7 (d1) were focused on protecting the scenic values of the rural landscape, as outlined below.
The objectives of this zone are to:
a. preserve the existing wooded ridges and escarpments,
b. protect hilltops, ridgelines, river valleys and other local features of scenic significance by controlling the choice and colour of building materials and the position of buildings, access roads and landscaping,
c. prevent the establishment of traffic-generating development along main and arterial roads,
d. control outdoor advertising so that it does not disfigure the rural landscape,
e. protect the low-density, broad-acre character of the rural areas, and
f. protect orcharding in the Bilpin area.
The new objectives appear to place much more emphasis on protecting the agricultural values of the land covered by this zone, ie, the land adjacent to the Bells Line of Road, approximately between the border of the Wollemi National Park and the boundary of the Hawkesbury / Blue Mountains LGA’s.
Discussions between agency representatives and the BMWHI research team in the early stages of this project pointed to some concern that the final version of Amendment 108 may not encourage or support agriculture in the area which was understood by the agricultural community and the research team to be the original intention of making the amendment. There were some fears that the amendment may in fact increase the potential for land use conflict, for example, by allowing scope for complaint by more recently arrived residents moving to the area seeking rural solitude and amenity but who express dissatisfaction regarding the noise and odours emanating from adjacent agricultural properties. These fears appear to be unfounded, and were dismissed by HCC planners as an inaccurate understanding of the amendment. The objectives clearly indicate that the area is an agricultural one and that the zoning is intended to ensure that agricultural activities are protected while also protecting the environmental values of the area.
The objectives of the new “Environmental Protection—Agriculture Protection (Scenic) zone” are reproduced below:
“(a) to protect the agricultural potential of rural land in order to promote, preserve and encourage agricultural production,
(b) to ensure that agricultural activities occur in a manner:
(i) that does not have a significant adverse effect on water catchments, including surface and groundwater quality and flows, land surface conditions and important ecosystems such as streams and wetlands, and
(ii) that satisfies best practice guidelines and best management practices,
(c) to ensure that development does not create or contribute to rural land use conflicts,
(d) to ensure that development retains or enhances existing landscape values that include a distinctly agricultural component,
86

(e) to preserve river valley systems, scenic corridors, wooded ridges, escarpments, environmentally sensitive areas and other local features of scenic quality,
(f) to protect hilltops, ridgelines, river valleys, rural landscapes and other local features of scenic significance,
(g) to prevent the establishment of traffic-generating development along main and arterial roads,
(h) to control outdoor advertising so that it does not disfigure the rural landscape,
(i) to ensure that development does not create unreasonable economic demands for the provision or extension of public amenities or services,
(j) to preserve the rural landscape character of the area by controlling the choice and colour of building materials and the position of buildings, access roads and landscaping,
(k) to encourage existing sustainable agricultural activities” (HCC 1989, p23).
There is another agricultural zone relevant to the project, the: “Environmental Protection—Mixed Agriculture (Scenic)” zone. In the vicinity of the case study area this zone is used primarily on land adjacent to the Nepean River. Its objectives are:
(a) to encourage existing sustainable agricultural activities,
(b) to ensure that development does not create or contribute to rural land use conflicts,
(c) to encourage agricultural activities that do not rely on highly fertile land,
(d) to prevent fragmentation of agricultural land,
(e) to ensure that agricultural activities occur in a manner:
(i) that does not have a significant adverse effect on water catchments, including surface and groundwater quality and flows, land surface conditions and important ecosystems such as streams and wetlands, and
(ii) that satisfies best practice guidelines and best management practices,
(f) to promote the conservation and enhancement of local native vegetation, including the habitat of threatened species, populations and ecological communities by encouraging development to occur in areas already cleared of vegetation,
(g) to ensure that development retains or enhances existing landscape values that include a distinctly agricultural component,
(h) to prevent the establishment of traffic generating development along main and arterial roads,
(i) to control outdoor advertising so that it does not disfigure the rural landscape,
87

(j) to ensure that development does not create unreasonable economic demands for the provision or extension of public amenities or services.
The key difference between these zoning objectives and those applied in the case study area are (c) and (d), although exactly how the zoning prevents the fragmentation of agricultural land any more so than the other EP-AP zones is unclear given that the lot sizes for subdivision are much the same.
HCC LEP Amendment 145
Amendment 145 of the HCC LEP 1989 was gazetted on the same day as Amendment 108. The aims of Amendment 145 are “to:
(a) include a new “Rural Housing” zone ;
(b) provide for subdivision of land;
(c) make provision in relation to minimum lot sizes; and
(d) alter zoning of certain land at Pitt Town to allow for subdivision of lots for housing and rural housing” (HLEP, 2006, p6447).
It would seem that the “Rural Housing” zone is intended primarily for land in the Pitt Town vicinity and not particularly relevant to the BMWHI project as no land in the case study area has this zoning. The zone is a residential one – its objectives include “(a) to provide primarily for low density residential housing and associated facilities; “(b) minimise conflict with rural land uses” and … “(g) to enable development for purposes other than residential only if it is compatible with the character of the living area and has a domestic scale and character” (HLEP, 2006, p6449).
As a result of amendments 108 and 145, Clause 11 (2) sets out the minimum lot sizes for rural subdivision for land zoned Environmental Protection-Agriculture Protection (Scenic). It stipulates a larger minimum lot size (40 Hectares) where previously the minimum size required was 10 Hectares and “a satisfactory ratio of depth to frontage” [as specified in clause 11 (2) (b) of the LEP 1989 updated July 2000, p29].
For land zoned Rural Living, the minimum lot size specified by clause 11 (2) is between 2 and 4 Hectares if not lot averaging subdivision or 1 Ha if lot averaging.
For land zoned Rural Housing, the smallest minimum lot size permitting subdivision is 1,500 square metres, ie where the density control is 5.0 per hectare.
Subdivision
BMCC LEP 1991
The rules related to subdivision in the relevant areas of the BMCC LGA are covered in Clause 34.1 of LEP 1991 – “General Provision”. This clause states that:
“(a) The Density Control Provision shown on the Map specifies the maximum number of lots per hectare into which land may be subdivided with the consent of the Council.
(b) The Council may consent to subdivision of any land covered by a Density Control Provision shown on the Map only if the total number of lots (other than lots for a public purpose) existing after the subdivision will not exceed the product of the notional development area of the original
88

lot, in hectares, multiplied by the maximum number of lots per hectare specified in the Density Control Provision in respect of the original lot, rounded down to the nearest whole number.
(c) The Council may consent to subdivision of any land that is zoned Bushland Conservation or Residential Bushland Conservation only if each new lot proposed to be created, (other than lots for a public purpose, and other than lots created as part of a cluster housing development), and intended to be the site of a dwelling house, includes land with a minimum area of 750 m2, no part of which is development excluded land, and which is so configured as to be capable of being the site of a dwelling house and accommodating development ordinarily incidental and ancillary to a dwelling house.
(d) The Council may consent to subdivision of any land for the purpose of cluster housing development only if it is satisfied that:
(i) all development for the purpose of any dwelling house proposed to be erected as part of the cluster housing development; and
(ii) all development ordinarily incidental and ancillary to a dwelling house is not to be located on any development excluded land” (BMCC 1991).
Clause 34.2 Rural Conservation Zone – Special Provisions also applies to the case study area. It reads as follows:
(a) The Council may only consent to the subdivision of land in the Rural Conservation Zone if -
(i) it is for a boundary adjustment where no additional lots are created; or
(ii) in Mt Irvine, Mt Tomah, Mt Wilson and Berambing, it is for the purpose of creating an additional lot from an original lot, (provided that the original lot has an area of at least 20 hectares); or
(iii) it is for the purpose of providing land for public purposes.
(b) In any subdivision permitted under clause 34.2(a)(i) or (ii), each lot in the Rural Conservation Zone created by the subdivision shall have a minimum area of
(i) 1 hectare for land in Mt Irvine, Mt Tomah, Mt Wilson, Berambing and
Megalong Valley; or
(ii) 5,000m2 elsewhere (BMCC 1991).
BMCC LEP 2005
LEP 2005 introduced a residential zone called “Living-Bushland Conservation” (L-BC) to provide a zone encompassing the urban-bushland interface and intended to preserve the bushland character of the many areas where residential blocks meet the natural bushland. Because there is such a large area of urban-bushland interface, this zone is critically important in terms of buffering the impacts of urban development.
According to BMCC Environmental Planning Study 2002), L-BC was intended to replicate the Residential-Bushland Conservation zone in LEP 1991, which had a requirement of 8 lots/Hectare. This requirement resulted, in some cases, in lot sizes as small as 600m2, an outcome that “was not
89

achieving the objectives of the zone to maintain bushland character and adequately protect environmental values” (BMCC 2002, p95).
According to BMCC, for achievement of planning principles (environmental management; bushfire protection; limiting urban expansion); together with preserving bushland character objectives of the zone, a minimum lot size of 1200m2 is necessary. A minimum of 60% of the lot (for 1200m2 = 720m2) must be retained as soft, pervious surfaces (to facilitate water infiltration and minimise surface water run-off). However, this doesn’t allow “for bushfire Asset Protection Zone that would require the removal / reduction of vegetation that otherwise contributes to the maintenance of bushland character (BMCC 2002, p95).
HCC LEP 1989
Rural subdivision is addressed in Part 3, Clause 11 of LEP 1989. Clause 11 (2) sets out the minimum lots sizes required before subdivision can be approved. The specific sizes in so far as they are relevant to this project are set out in Appendix 1.
Clause 11 (5) states that all subdivision is prohibited in areas of the map marked Amendment 145 unless the area is equal to or greater than the minimum lot size shown on the map and the number of lots does not exceed the density control for the land. Essentially, H LEP 1989 permits intensive subdivision in residential areas, including some rural-residential zones, but the rules applying to the case study area do not permit it beyond what has occurred in the past. That is, many properties are already smaller than the minimum size that would be permitted now.
Development Control Plans
Hawkesbury DCP
Although the HCC DCP states that its general principles regarding subdivision are intended to ensure environmentally sustainable subdivision and facilitate subdivision that minimises environmental degradation, the specific rules are very vague. For example, with respect to flora and fauna protection, it uses such language as:
“... opportunities for revegetation should be pursued as part of the subdivision process ...”
“... vegetation cover should be retained wherever practical ...”
“... degraded areas are to be rehabilitated ...”
Whilst in principle these are positive rules, it is unclear what definitions of “significant vegetation” is being used, what is meant by “retained” and what proportion of vegetation cover is required, what species are intended by the term “significant vegetation”; what is meant by revegetation.
The aims of the rules for rural lot size and shape are equally vague. While the objectives refer to the design of subdivision needing to take account of “any significant natural features”, the term “significant” is not defined. The rules for this section include one which states that “building envelopes should be located a minimum of 30 metres from significant trees and other significant vegetation or landscape features” (HCC DCP 3-15). The intention of a protective buffer is appropriate and essential, however, again, what is meant by “significant”? There is no definition of the term significant in either the LEP or the DCP. How could this rule be upheld in practice, and in law, unless the DCP or LEP specifies exactly which vegetation species and communities, watercourses and riparian vegetation this rule should apply to? It would also be useful to know on what basis the size of the buffer is decided.
The terms “Environmental Protection” and “environmentally sensitive area” are also used confusingly in this document. An “environmentally sensitive area” is defined as:
90

“ ... land identified in an environmental planning instrument as an environment protection zone such as for the protection or preservation of habitat, plant communities, escarpments, wetlands or ... [land reserved under other legislation]” (HCC DCP, A-3).
The applicable environmental planning instrument in this case is the HCC LEP that contains several Environmental Protection zones, most of which have the objectives of protecting scenic or agricultural values, rather than environmental ones. The zones “EP – wetlands” and “EP consolidated land holdings” are meant to protect natural environmental values, but are applicable only in certain areas and are not represented in the case study area, apart from one very small area adjacent to the Wollemi National Park.
The DCP rules read as though “significant” vegetation and environmentally sensitive areas on land in other zones are afforded some protection by the DCP, but it is unclear how it does so.
BMCC “Better Living” DCP
In addition to specifying the criteria for assessing building and construction standards, the BMCC DCP is a detailed, specific and place-based document. It not only deals with the standard matters such as car parking and landscaping in terms of aesthetics, but incorporates general principles aimed at protecting the natural environment. For example, it clearly sets out performance criteria relating to biodiversity, weeds, stormwater and site management as well as character, landscape assessment, heritage conservation and hazard and risk assessment. It defines such terms as significant vegetation by including a schedule of the species included under that term. It also details specific means of applying protective buffers to such plant communities. It makes provision for ensuring certain proportions of lots are retained as pervious surfaces and includes a weeds list. DA’s containing landscaping plans that include plants on the weeds list can be refused approval.
The Standardisation of NSW LEPs
The NSW Department of Planning has been implementing a series of planning reforms such as the streamlining of Environmental Planning Instruments (EPIs) and the addition of “Part 3A – Major Projects” to the Environmental Planning and Assessment Act 1979.
The main way that the government intends to streamline EPIs is to standardise all NSW LEPs and to merge some State Environmental Planning Policies into them. It increases the power of the State government to act in local planning matters by granting it the power to add land uses to the LEPs by order – and without consultation. The standardisation of LEPs is likely to result in LEPs becoming much more generic with little scope to cater for unique local environmental conditions and differences between Local Government Areas. For example, there appears to be little capacity for including protections (e.g. mandatory controls) for things such as retaining bushland – ie most provisions of the Standard Instrument are limited to such things as height controls, building setbacks etc.
The addition of “Part 3A – Major Projects” to the Environmental Planning and Assessment Act 1979; Part 3A in July 2005 aims to provide for assessment of development involving major infrastructure or other development that, in the Minister’s opinion, is of state or regional environmental planning significance, or where the proponent is also the determining authority, and the development would require an environmental impact statement.
The scheme relating to assessment under this Part replaces other provisions for assessment of state significant development (formerly covered by Part 4 or 5 of the EPandA Act). The Minister is the consent authority for all major projects
Examples of major infrastructure development are: roads, railways, electricity generation, sewage treatment facilities, dams, desalination plants. Any development that is considered a major project under Part 3A may also be declared to be a “critical infrastructure project” if the Minister considers it to be “essential for the State for economic, environmental or social reasons”. An example of such a
91

development is the Kurnell desalination plant. Even if such development is wholly prohibited under an LEP, the Minister has the power to approve it.
In September 2005 the department issued a “Standard LEP Template” for public comment as part of that process. Subsequently, in March 2006, the “Standard Instrument (Local Environmental Plans) Order 2006” (Standard LEP) was gazetted. This means that all Local Government Areas (LGAs) will be required to rewrite their Local Environment Plans so that they comply with the Standard LEP.
The Department of Planning has advised that all local Councils will be formally advised of the timeframe within which new LEPs must be rewritten. Some Councils will have 3 years, others five, within which to comply. It seems that Blue Mountains City Council (BMCC) has been directed to comply – ie, to rewrite its Local Environment Plans within five years.
BMCC has requested an exemption from compliance with that directive and it is understood that Council continues to seek clarification regarding this matter. Informal advice received from Council staff indicates that it will be unlikely for the Dept of Planning to grant the Blue Mountains Local Government Area (LGA) an exemption as was hoped. To date BMCC does not yet have a timetable for its own review of LEP 1991 nor for a rewrite of LEP 2005.
Informal advice from Hawkesbury City Council planning department is that HCC has volunteered to redraft its LEP within the earliest time frame demanded by the Department, ie, 3 years. They are hopeful that a draft LEP will be prepared by the end of 2006, with exhibition in early 2007. They foresee the rewriting of the LEP as a relatively simple exercise of transferring existing zoning names and objectives to the new standardised format.
Amendment 108 to the HLEP was introduced to allow for specific land uses while reducing the likelihood of conflict. A question arises here regarding the potential effect of the standardisation of LEP zones: if HCC believed it necessary to implement a specific zone to cater for particular land uses in particular locations, how can it accept a reduction on the number of zones as seems likely under the standard template?
HCC currently has at least 4 zones that allow for varying levels of agriculture, two of which specify environmental protection objectives. While the Standard LEP sets out 6 rural zones, it is unclear how compatible the objectives and permitted uses of each of these zones will be with those of the HLEP.
It is difficult to assess the implications of standardisation until the new LEPs are drafted. Opportunity for public input into the planning process is now only possible at the exhibition stage, so it is imperative for local landholders and BMWHI to closely scrutinise the draft LEP when it is exhibited and be prepared to make detailed submissions to ensure appropriate zoning for sustainable agriculture and environmental protection outcomes.
92

2. World Heritage Buffer Zones
The UNESCO website states (http://whc.unesco.org/en/events/473/):
“A buffer zone serves to provide an additional layer of protection to a World Heritage property. The concept of a buffer zone was first included in the Operational Guidelines for the implementation of the World Heritage Convention in 1977. In the most current version of the Operational Guidelines of 2005 the inclusion of a buffer zone into a nomination of a site to the World Heritage List is strongly recommended but not mandatory.
Many World Heritage properties face problems that directly or indirectly derive from the situation of their buffer zone. New constructions within a buffer zone may have an impact on the World Heritage property and could threaten its Outstanding Universal Value; a different legal status of a buffer zone could also impact the conservation, the protection or management plan of a site.”
An International Expert Meeting on World Heritage and Buffer Zones was held Mar 11, 2008 - Mar 14, 2008 in Davos, Switzerland, to focus on problems and best practices concerning buffer zones and issues related to the integrity of properties inscribed on the World Heritage List.
The main objectives of the meeting were to: Review the provisions on buffer zones and boundaries in the Operational Guidelines; Examine case studies of World Heritage properties, natural, cultural and cultural landscape sites to be presented to the workshop; Review background papers by the World Heritage Centre and the Advisory Bodies as well as information analyzed through the Retrospective Inventory Project; Compile specific recommendations from the working groups and a draft decision for the 32nd Session of the World Heritage Committee (Québec, July 2008).
As noted under the 4th objective above, the outcomes of the meeting, including proposals of modifications to the Operational Guidelines of the World Heritage Convention (2005 version) regarding the definition and management of buffer zones, as well as conditions of integrity, will be presented to the 32nd session of the Committee (Québec, July 2008).
93

9. References Abel, N., Cork, S., Goddard, R., Langridge, J., Langston, A., Plant, R., Proctor, W., Ryan, P., Shelton,
D., Walker, B. and Yialeloglou, M. 2003. “Natural values: exploring options for enhancing ecosystem services in the Goulburn Broken Catchment”, CSIRO Sustainable Ecosystems.
Abel, N., Binning, C., Cork, S.J., Proctor, W. and Shelton, D. 2002. The ecosystem services project: exploring the importance of ecosystems to people. Ecological Management & Restoration 3(2): 143-146.
Antle, J.M., Capalbo, S.M., Elliott, E.T., Hunt, H.W., Mooney, S. and Paustian, K.H. 2001. “Research needs for understanding and predicting the behaviour of managed ecosystems: lessons from the study of agroecosystems”, Ecosystems 4(8): 723-735.
Binning, C., Cork, S.J., Parry, R., and Shelton, P. 2001. “Natural assets: an inventory of ecosystem goods and services in the Goulburn Broken Catchment” CSIRO Sustainable Ecosystems.
Boguski, T.L., Cornaby, B.W., Harrison, C.L., Hunt, R.G., Latham, H.C., Sellers, J.D., Tolle, D.A., and Vigon, B.W. 1993. “Life-cycle assessment: inventory guidelines and principles”. USEPA Risk Reduction Engineering Laboratory, Lewis Publishers.
Boxelaar, L., Paine, M. and Sharma, M. 2006. “Sustaining our social and natural capital: enhancing the resilience of dairy farmers”. Sustaining our social and natural capital: Proceedings of the 12th annual ANZSYS conference p383-395. http://www.bmwhi.org.au/live/images/stories/katoomba_proceedings_contents.pdf
Buck, L.,Wollenberg, E. and Edmunds, D. 2000. “Using scenarios to make decisions about the future: anticipatory learning for the adaptive co-management of community forests” Landscape and Urban Planning 47: 65-77.
Butler, R., and Maronek, D.M. (eds.) 2002. “Urban and agricultural communities: opportunities for common ground”. Council for Agricultural Science and Technology, Ames Iowa.
Clark, S.J., Carpenter, R.S., Barber, M., Collins, S., Dobson, A., Foley, A.F., Lodge, M.D., Pascual, M., Pielke Jr, R., Pfizer, W., Pringle, C., Reid, V.W., Rose, A.K., Sala, O., Schlesinger, H.W., Wall, H.D. and Wear, D. 2001. “Ecological forecasts: an emerging imperative science” Science 27 July 2001: Vol. 293. no. 5530, pp. 657 - 660
Cork, S.J., Proctor, W., Shelton, D., Abel, N. and Binning, C. 2002. “The ecosystem services project: exploring the importance of ecosystems to people”, Ecological Management & Restoration 3(2): 143-146.
Cox, A., 2006. “The Sterilisation of Urban Life” in National Parks Journal, Vol 50, No 5, October-November 2006, p 25.
Docking, A., Mason, D. and Knowd, I. 2006. “Urban agriculture: the new frontier” Paper presented to the Planning for Food Seminar, Vancouver 21st June 2006.
Engel, B., 1999. “Estimating Soil Erosion using RUSLE using Arcview”. Purdue, Purdue University.
Environmental Systems Research Institute (ESRI). 2002. ArcMap Version 8.3. ESRI, Redlands, CA.
Farrier, D. and Stein, P. 2006. “The Environmental Law Handbook: Planning and Land Use in NSW”, Redfern Legal Centre Publishing, Sydney.
94

Frost, D. 2007. “The use of composted woodchip as a substrate for growing varieties of edible mushrooms” http://www.mushworld.com/common/print.asp?vid=7835
Funtowicz, S.O., Martinez-Alier, J., Munda, G. and Ravetz, J.R. 1999. “Information tools for environmental policy under conditions of complexity” Environmental Issues Series, No.9 European Environment Agency, Luxembourg.
Gillespie, P.D. and Masson, D. 2002. “The value of agriculture in the Sydney region” (Draft), NSW Agriculture, Sydney.
Greeuw, S.C.H., Van Asselt, M.B.A., Grosskurth, J., Storms, C.A.M.H., Rijkens-Klomp, N., Rothman, D.S. and Rotmans, J. 2000. “Cloudy crystal balls: an assessment of recent European and global scenario studies and models”. European Environment Agency, Copenhagen. Environmental Issues Series No 17.
Gunderson, L.H. and Holling, C.S. 2002. “Panarchy: understanding transformations in human and natural systems”, Island Press, Washington D.C.
Hawken, P., Lovins, A.B. and Lovins, L.H. 1999. “Natural Capitalism: Creating the Next Industrial Revolution”, Little, Brown and Company, New York.
Hawkesbury Harvest Inc. 2004. Hawkesbury Harvest Business Plan, May 2004, Section 1, Hawkesbury Harvest History and Evolution; Section 2. “Hawkesbury Harvest Model of Community Development”.
Hawkesbury City Council. 2005. “Growing Hawkesbury’s Future - the Hawkesbury Agricultural Retention through Diversification and Clustering Project (HARtDaC)”. Agriculture Victoria Services. Windsor. Available at http://www.hawkesbury.nsw.gov.au/environment/1232/21007.html
Healthy Cities Survey. 1997. Hawkesbury City Council, Windsor.
HLP 2006. Hawkesbury Local Environmental Plan 1989 (Amendment No 145), New South Wales Government Gazette No 103, 18th August 2006, p 6446 – 6456.
Holling, C.S. 1978. “Adaptive environmental assessment and management”, John Wiley and Sons Ltd., New Jersey.
Holling, C.S., Gunderson, L.H. and Ludwig, D. 2002. “In quest of a theory of adaptive change”, in: Gunderson, L.H., Holling, C.S. (2002) Panarchy: understanding transformations in human and natural systems, Island Press, Washington D.C.
Holling, C.S., Gunderson, L.H. and Peterson, G.D. 2002. “Sustainability and panarchies”, In: Gunderson, L.H., Holling, C.S. (2002) Panarchy: understanding transformations in human and natural systems, Island Press, Washington D.C.
Holling, C.S. and Gunderson, L.H. 2002. “Resilience and adaptive cycles”, in: Gunderson, L.H., Holling, C.S. (2002) Panarchy: understanding transformations in human and natural systems, Island Press, Washington D.C.
Hollinger, E. 1998. “Links between management of a market garden and stormwater losses of sediment, nitrogen and phosphorus” Master of Science, Honours thesis, University of Western Sydney, Hawkesbury, NSW.
Holm, A.M., Bennett, L.T., Loneragan, W,A. and Adams, M.A. 2002. “Relationships between empirical and nominal indices of landscape function in the arid shrubland of Western Australia” Journal of Arid Environments 50: 1-21.
95

Houston, P.D. 1997. “Revaluing the fringe: some findings of the value of peri-urban agriculture in Australia” Australian Journal of Regional Studies Hawkesbury Social Plan. 2000, Hawkesbury Sust, Ag, Devel. Strategy
ICEM 2005 “Leading into community: the community-government partnership project, Phase II”. Final Report March 2005.
Izac, A. M. N., Noordwijk, M. Van. and Swift, M. J. 2004. “Biodiversity and ecosystem services in agricultural landscapes – are we asking the right questions?” Agriculture, Ecosystems and Environment 104: 113-134.
Jones, R. J., Sizmur, K. J. and Wildman, H. G. 1991. “A miniaturised system for storage of fungal cultures in water”. The Mycologist 5, 184-186.
Kelleher, F.M., Chant, J.J. and Johnson, N.L. 1998. “Impact of Rural Subdivision on Agriculture: A Report for the Rural and Industrial Development Corporation”, Farming Systems Research Centre, University of Western Sydney, Hawkesbury.
Lee, K. 1993. Compass and gyroscope. Island Press, Washington D.C.
Mason, D. and Docking, A. 2005. “Agriculture in Urbanising Landscapes: A Creative Planning Opportunity”, paper presented to Agri-Food ’05, 5-8 July 2005, Yeppoon.
Mason, D., Knowd, I. and Docking, A. 2006. “Urban Agriculture: the New Frontier”, paper presented to Planning For Food Seminar, Vancouver, 21 June 2006.
McCool, S.F. and Stankey, G.H. 2004. “Indicators of sustainability: challenges and opportunities at the interface of science and policy”. Environmental Management 33(3): 294-305.
Meehan, B., Maheswaran, J., and Phung, K. 2000. “Reuse Potentials of Agri-Industry Waste in the Melbourne/Metropolitan Region”. RIRDC Publication No. 01/144. Rural Industries Research and Development Corporation.
Moore, I. and Burch (1986). "Modeling erosion and deposition: topographic effects." Trans. ASAE 29(6): 1624-1630.
NSW Agriculture. 1998. Strategic Plan for Sustainable Agriculture - Sydney Region, NSW Agriculture, Orange.
NSW Agriculture. 2002.“Best practice guidelines: horticulture in the Sydney drinking water catchment. NSW Agriculture, Sydney.
Ong, C., Tongway, D., Caccetta, M. and Hindley, N. In press. “Phase 1: Deriving ecosystem function analysis indices from airborne hyperspectral data”. CSIRO Exploration and Mining, Report awaiting publication No., Unpublished.
Peterson, G. D., T. D. Beard Jr., B. E. Beisner, E. M. Bennett, S. R. Carpenter, G. S. Cumming, C. L. Dent, and T. D. Havlicek. 2003 “Assessing future ecosystem services: a case study of the Northern Highlands Lake District, Wisconsin.” Ecology and Society 7(3): 1 on line.
Rinker, D.L. 2002 “Handling and using of the spent mushroom substrate around the world’ (1). http://www.mushworld.com/common/print.asp?vid=5059
Rinker, D.L. 2002 “Handling and using of the spent mushroom substrate around the world” (2). http://www.mushworld.com/common/print.asp?vid=5135
96

Sinclair, I. 2001a. “A View from the Edge, Issues in Rural and Metropolitan Fringe Planning: Rural Residential Development” New Planner, No 47, June 2001.
Sinclair, I. 2001b. “A View from the Edge, Issues in Rural and Metropolitan Fringe Planning: Rural Residential Development Impact” New Planner, No 48, September 2001.
Sinclair, I., Docking, A., Jarecki, S., Parker, F. and Saville, L. 2004. From the Outside Looking In: The Future of Sydney’s Rural Land. University of Western Sydney, Hawkesbury, NSW.
Social and Institutional Research Program, Land and Water Australia. 2003. “Assessing ecosystem services in the Goulburn Broken Catchment”. Fact Sheet. Available at http://downloads.lwa2.com/downloads/publications_pdf/EF051059.pdf
Stamets, P. 1993. Growing gourmet and medicinal mushrooms. Ten Speed Press, Berkeley, CA, USA ISBN 0 89815 608 4.
Thorn, R. G. and Barron, G. L. 1984. Carnivorous mushrooms. Science 224: 76-77.
Tongway, D. and Hindley, N. 2003. "Indicators of ecosystem rehabilitation success: Stage 2 - verification of EFA Indicators". Final Report. CSIRO Sustainable Ecosystems in association with Ben Seaborn, CMLR, University of Queensland, Canberra ACT.
Tongway, D.J. and Hindley, N.L. 2004. Landscape function analysis: procedures for monitoring and assessing landscapes with special reference to mine sites and rangelands. CSIRO Sustainable Ecosystems, Canberra ACT.
Tongway, D.J. and Hindley, N.L. 2005. Landscape Function Analysis: Procedures for Monitoring and Assessing Landscapes. Canberra, CSIRO Sustainable Ecosystems.
University of Texas. 1997. Implementation of the AGREE method. http://www.ce.utexas.edu/prof/maidment/GISHYDRO/ferdi/research/agree/agree.html
97
RIRDC Publication No. INSERT PUB NO. HERE
Urban Expansion and Sensitive Environments
Assessing the role of agri-industries as landscape buffers to the neighbouring Greater Blue Mountains World Heritage Area
by J Merson, R Attwater, S Booth, R Mulley, P Ampt, H Wildman, M Nugent, S Hooper, M Campbell R Chapple
RIRDC Publication No. 09/025
This study assess the complex social, economic and environmental factors impacting on the small-scale rural communities in the eastern edges of the Greater Blue Mountains World Heritage Area (GBMWHA). It looks at the role of agri-industries as landscape buffers to the neighbouring World Heritage Area and explores how local government planning might be improved to help this vulnerable but essential peri-urban farming community. In conjunction with targeted representative landholders, tools were developed to assist in enhancing the economic and environmental resilience of agri-industries involved in diverse modes of production.
The report is targeted at the individuals and families undertaking a range of agribusinesses in the Hawkesbury-Nepean region, and aspects of the complex challenges faced by these farming communities. This report will also be of interest to regional and
local government, environmental advocates, natural resource managers and others interested in the critical buffer zones between encroaching urban sprawls and naturally significant areas.
The Rural Industries Research and Development Corporation (RIRDC) manages and funds priority research and translates results into practical outcomes for industry.
Our business is about developing a more profitable, dynamic and sustainable rural sector. Most of the information we produce can be downloaded for free from our website: www.rirdc.gov.au. Books can be purchased by phoning 02 6271 4166 or online at: www.rirdc.gov.au.
Contact RIRDC:Level 2
15 National CircuitBarton ACT 2600
PO Box 4776Kingston ACT 2604
Ph: 02 6271 4100Fax: 02 6271 4199
Email: [email protected]: www.rirdc.gov.au
This publication can be viewed at our website— www.rirdc.gov.au. All RIRDC books can be purchased from:.
www.rirdc.gov.au
RIRDCInnovation for rural Australia