Embed Size (px)
Citation preview

https://doi.org/10.32438/iCRBE.202050
Manuscript History
Receipt of completed manuscript: 20 July 2020
Receipt of Revised Manuscript: 20 August 2020
Date of Acceptance: 34 August 2020
Online available from: 12 October 2020
Page | 107
Available online at www.weentechpublishers.com
iCRBE Procedia Volume 1: Issue 1 (2020) 107-115
1st International Conference on Climate Resilient Built Environment-iCRBE, 21-23 September 2020, Bali, Indonesia
Urban form and pandemic spread: Reflections from Ahmedabad
Pratyoosh Madhavia, Digisha Mehta
a, Ankit Kumar
a , Sandhya MC
*b,
aInstitute of Architecture and Planning, Nirma University
bDepartment of Civil Engineering, Ahmedabad Institute of Technology
*Corresponding author’s mail: [email protected]
Abstract
Covid-19 which has been declared a pandemic by the World Health Organization has impacted all the spheres of human life including
health, economy, education, social life, etc. The spread of the virus has been found to be primarily due to human movement and human
contact. Certain areas like slums and other highly dense areas of the city having narrow streets, high density housing, compact social spaces
and poor sanitation, have shown rapid spread and long duration of stay of the virus. Tracing Covid-19 spread, one finds an underlying link
between Covid-19 cases and city’s urban form. Today, reconsideration on different aspects of planning seems necessary. The objective of
this paper is to find the link between spread of Covid-19 cases and various urban forms existing within Ahmedabad. Ahmedabad being one
of the most populated metropolitan city of Gujarat, India and also acknowledged for its rich heritage culture and built-forms, stands suitable
for this study giving opportunity to explore and study varied urban spatial forms ranging from heritage settlements known as ‘Pols’ existing
in the inner core city to the new townships developed in the recent years. The study relies on secondary data for tracing spread of Covid-19
in Ahmedabad and on primary study and analysis of different selected neighbourhoods. This study urges to adopt newer approaches to
bring resilience in urban form through planning during such pandemic.
Keywords: Covid-19; Zones of Ahmedabad; Urban form; Pandemic spread
Copyright © 2020 Published by WEENTECH Publishers. This is an open access article under the CC BY License
(http://creativecommons.org/licenses/BY/4.0/). All Peer-review responsibility is on technical committee of 1st International
Conference on Climate Resilient Built Environment-iCRBE2020.

Page | 108
1. Introduction
The year 2020 has marked itself in the future history with the Covid-19 global pandemic and the
havoc it has created around the world. Covid-19 has changed the normal course of life globally. Today
social distancing has become the biggest necessity for human safety. A parallel virtual world supported
by information and communication technology has emerged as a saviour sufficing all human needs in all
sectors of life.
As defined by Lewis Mumford, “A city is a geographic plexus, an economic organization, an
institutional process, a theatre of social action and an aesthetic symbol of collective unity.” He said that
“…. a city is a related collection of primary groups and purposive associations.” [1]. Besides this thinker
like Aristotle described a city as a place in which each citizen is able to recognize the other by sight [2].
Jane Jacobs also emphasized the importance of users and their relationship with the built form which
makes certain spaces alive and active compared to others [3]. Now with this pandemic these aspects of
the city need to be revisited with new lenses. A special address towards the new requirement bringing
resilience to deal with such a pandemic is necessary. Urban planning is such a field that deals with
almost all the aspects of human lives in a city. It works at various scales ranging from neighbourhood to
large regions.
Urban planning is a tool through which macro and micro aspects at different levels are managed.
Perspective plans, Development/Master plans, Zonal level plans and Area development plans are some
of the methods through which Urban Planning address social life, economic development,
environmental concerns, physical planning etc.
Considering Covid-19 one observes that the growth and spread of the pandemic is not homogeneous
throughout the city. City has areas which show presence of more cases and act as hotspots of the city
compared to other parts of the city. One feels that there is an underlying hidden link between the urban
form and the spread of the pandemic. The objective of this paper is to understand and identify this link
taking case of Ahmedabad, India.It takes up samples of typical neighbourhoods from different zones of
Ahmedabad, defined by Ahmedabad Municipal Corporation.Further it studies the spread of Covid-19 in
the various areas lying within the different zones of Ahmedabad. The study tries to establish a link
between the urban form and the spread of the pandemic. The methodology relies on mapping the cases
of Covid-19 on GIS in the month of May which was the peak period of the spread. Further the urban
form of the location where there are optimum cases are studied to build a link between intensity of cases
and elements of urban form.
2. Zones of Ahmedabad
Ahmedabad is the largest city in the state of Gujarat and the seventh largest urban agglomeration in
India. The city is located on the banks of river Sabarmati. It was founded in 1411 to serve as the capital
of the Sultanate of Gujarat [4]. Ahmedabad is a cultural and commercial heart of Gujarat, and much of
western India. Today it is a rising centre of education, information technology and scientific industries.
Today the city witnesses a large number of skyscrapers, shopping malls and multiplexes. It is interesting
to observe the contrast between east and the west of Ahmedabad divided by the river Sabarmati. West is
a later addition to the chronological development and hence exhibits a very different spatial character in
comparison to the natural growth in the east. As we move radially, the neighbouring areas to the city
Theory and City form A case of
Ahmedabad by Shraddha Sejpal

Page | 109
core and towards the fringes have a more organised pattern of the open and built form. The development
of consecutive town planning schemes is a major determinant of the radial development of city streets,
along which all the areas have drastically evolved
At present the city is divided into 6 zones for administrative purposes and each zone is further divided
into wards. Each zone as seen in fig 2 have evolved over a period of time and therefore exhibit
extremely different and contrasting characteristics in terms of social life, density, built fabric, etc. To
understand this diversity, a typical residential neighbourhood from each of the zones have been selected
Fig. 1 Growth Map of Ahmedabad [7]
Fig. 2 Ahmedabad city Zone wise Classification [8]

Page | 110
and studied. The neighbourhood level study was conducted by Students of Bachelor of Planning of batch
B.Plan 2018-22 of the Institute of Architecture and Planning, Nirma University, Ahmedabad. The study
was conducted in the month of January 2020 before the outburst of the pandemic. The following table is
a compilation of the variations studied within different neighbourhoods in terms various spatial
parameters.
Table 1 Study of Neighbourhoods in terms of Spatial Parameters
Sno Zones West Zone South West
Zone
South Zone North Zone Central Zone East Zone
Area
Selected
Pratiksha Ashok Vatika Maninagar Bapunagar Pol (Khadia) Amraiwadi
1 Study Area 12.71 Ha 12.6 Ha 6.7 Ha 100 Ha 3.5 Hectare 10.76
2 Population 8640 132 2540 54100 1665 2365
3 Population
Density 680 Ppha 11 Ppha 379 Ppha 541 Ppha 475 Ppha 248 Ppha
4 Gross F.S.I 1.09 0.2 1.5 2.2 2.1 0.88
5 Net F.S.I 1.9 0.3 2.2 2.7 2.8 1.42
6 Dwelling
Unit 1728 22 780 1800 392 869
7 Dwelling
Density 136 Du/ Ha 2 Du/Ha 56 Du /Ha 90 Du/ Ha 112 Du/Ha 82 Du/Ha
8 Land use
9 Open v/s
Built
10 Road
Network
11 Road
Hierarchy
12 Open
Space
13 Building
Typology
Page | 111
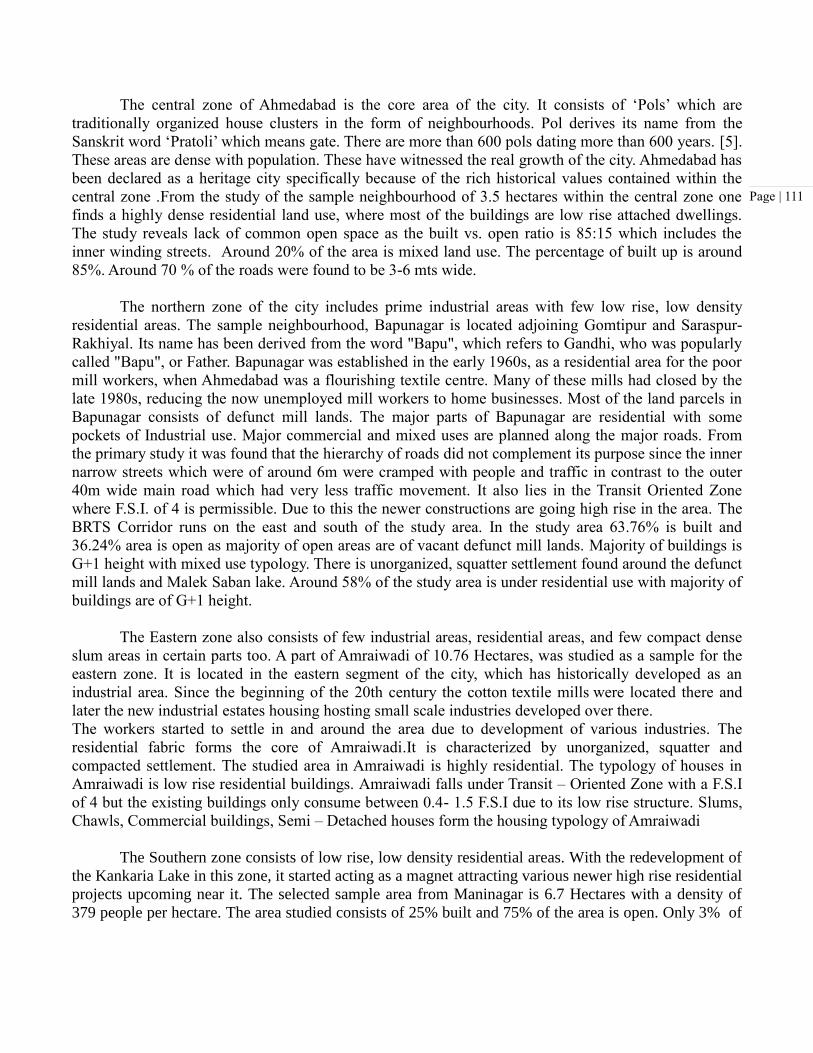
The central zone of Ahmedabad is the core area of the city. It consists of ‘Pols’ which are
traditionally organized house clusters in the form of neighbourhoods. Pol derives its name from the
Sanskrit word ‘Pratoli’ which means gate. There are more than 600 pols dating more than 600 years. [5].
These areas are dense with population. These have witnessed the real growth of the city. Ahmedabad has
been declared as a heritage city specifically because of the rich historical values contained within the
central zone .From the study of the sample neighbourhood of 3.5 hectares within the central zone one
finds a highly dense residential land use, where most of the buildings are low rise attached dwellings.
The study reveals lack of common open space as the built vs. open ratio is 85:15 which includes the
inner winding streets. Around 20% of the area is mixed land use. The percentage of built up is around
85%. Around 70 % of the roads were found to be 3-6 mts wide.
The northern zone of the city includes prime industrial areas with few low rise, low density
residential areas. The sample neighbourhood, Bapunagar is located adjoining Gomtipur and Saraspur-
Rakhiyal. Its name has been derived from the word "Bapu", which refers to Gandhi, who was popularly
called "Bapu", or Father. Bapunagar was established in the early 1960s, as a residential area for the poor
mill workers, when Ahmedabad was a flourishing textile centre. Many of these mills had closed by the
late 1980s, reducing the now unemployed mill workers to home businesses. Most of the land parcels in
Bapunagar consists of defunct mill lands. The major parts of Bapunagar are residential with some
pockets of Industrial use. Major commercial and mixed uses are planned along the major roads. From
the primary study it was found that the hierarchy of roads did not complement its purpose since the inner
narrow streets which were of around 6m were cramped with people and traffic in contrast to the outer
40m wide main road which had very less traffic movement. It also lies in the Transit Oriented Zone
where F.S.I. of 4 is permissible. Due to this the newer constructions are going high rise in the area. The
BRTS Corridor runs on the east and south of the study area. In the study area 63.76% is built and
36.24% area is open as majority of open areas are of vacant defunct mill lands. Majority of buildings is
G+1 height with mixed use typology. There is unorganized, squatter settlement found around the defunct
mill lands and Malek Saban lake. Around 58% of the study area is under residential use with majority of
buildings are of G+1 height.
The Eastern zone also consists of few industrial areas, residential areas, and few compact dense
slum areas in certain parts too. A part of Amraiwadi of 10.76 Hectares, was studied as a sample for the
eastern zone. It is located in the eastern segment of the city, which has historically developed as an
industrial area. Since the beginning of the 20th century the cotton textile mills were located there and
later the new industrial estates housing hosting small scale industries developed over there.
The workers started to settle in and around the area due to development of various industries. The
residential fabric forms the core of Amraiwadi.It is characterized by unorganized, squatter and
compacted settlement. The studied area in Amraiwadi is highly residential. The typology of houses in
Amraiwadi is low rise residential buildings. Amraiwadi falls under Transit – Oriented Zone with a F.S.I
of 4 but the existing buildings only consume between 0.4- 1.5 F.S.I due to its low rise structure. Slums,
Chawls, Commercial buildings, Semi – Detached houses form the housing typology of Amraiwadi
The Southern zone consists of low rise, low density residential areas. With the redevelopment of
the Kankaria Lake in this zone, it started acting as a magnet attracting various newer high rise residential
projects upcoming near it. The selected sample area from Maninagar is 6.7 Hectares with a density of
379 people per hectare. The area studied consists of 25% built and 75% of the area is open. Only 3% of

Page | 112
the studied area is mixed land use and 38% residential. Around 20 % of the area is green. The typology
of houses mostly consists of mid rise and semi detached.
The Western zone is full of mix of high rise and mid rise residential areas. The selected sample
neighbourhood is a part of Naranpura, in the west of Ahmedabad and started developing in the early
1960s. This area consists of a mix of elegant bungalows, row houses, apartment buildings and organized
grid patterned street network. The precinct is a peaceful neighbourhood. Naranpura had developed
considering the rise in population for the future. The planned approach to the development of this
neighbourhood has been beneficial for everyone living in and nearby the community. The study of
Naranpura stresses on the fact that getting ready for future densities is significant for a city's
sustainability and success.
The selected neighbourhood shows ample open spaces since 44% area are open and rest area is
built up. The majority of buildings in Pratiksha are Low rise, semi attached. The neighborhood has 48%
private open spaces.
One finds all types of residential typologies in this zone including detached bunglows,
apartments, row houses and semi- detached houses. The road structure in the west is very much
organized as compared to unorganized road sections in the east. Area under road also increases as one
move from central core to the western regions. Streets contribute to largest public realm in this zone.
The North Western and South Western zone are newer areas consisting of a number of newly
developed townships spread over the zone with very low density. The sample neighbourhood, Ashok
Vatika from the South West zone of Ahmedabad exhibits low rise, low density housing, with wide roads
and ample open spaces. In the study area, 80 % is open and only 20% is built up, out of which
67%accounts for residential use. Majority of the housing typology in Ashok Vatika is low rise detached
houses with ample private open spaces.
3. Covid-19 Spread in Ahmedabad
Fig. 3 Day wise Reported Cases of COVID-19 in Ahmedabad [6]
Ahmedabad has been one of the major epicentres and hotspot of Covid-19 in Gujarat as well as in India.
The above graph indicates the day wise growth of number of Covid-19 cases recorded in Ahmedabad till
6th
July 2020.This study has considered growth of Covid-19 cases in the month of May for
understanding the areas that have been highly impacted. The first week of May indicates location of
cases that have been recorded up to the first week of May since the first occurrence of Covid-19 and
similarly the mid-week and fourth-week of May indicate cases recorded up to that date. As one can see
from Fig 3.May stood as peak month considering the spread of Covid-19.The limitation of considering

Page | 113
data till May also lies because of Government’s decision of not making data public as it was realised that
it created panic situation among residents.
4. Spatial Character of highly impacted areas
Following are few of the highly impacted areas that have been extracted from the above maps.
Fig. 4 Spread of Covid-19 in various zones of Ahmedabad in the month of May

Page | 114
Table 2 Highly impacted wards from Covid-19 SL.NO
WARDS NAME COUNTS_1ST WEEK
COUNT_LAST WEEK
% INCREASE Zone
1 JAMALPUR 220 430 48.8 Center 2 DANILIMDA 136 359 62.1 South 3 KHADIA 199 571 65.1 Center 4 BAHERAMPURA 97 295 67.1 South 5
SARASPUR-RAKHIYAL 89 288 69.1 North
6 SHAHPUR 56 186 69.9 Center 7 DARIYAPUR 87 304 71.4 Center 8 GOMTIPUR 83 297 72.1 East 9 SHAHIBAG 58 246 76.4 Center 10 MANINAGAR 75 334 77.5 South 11 ASARWA 91 450 79.8 Center 12 BAPUNAGAR 49 280 82.5 North 13 ISANPUR 43 294 85.4 South
Covid-19 has intensely affected the Central zone. As the pandemic was associated with a contagious
disease social distancing didn’t work in the dense fabric of old part of city. High density housing,
compact houses, narrow streets, lack of open spaces and the presence of interactive spaces around
houses and amid junctions for social bonding went against the precautionary guidelines of Covid-
19.Table 2, shows the highly affected areas of Ahmedabad. If put together, the highly impacted areas and
their urban form, one finds a very clear link between the kind of spatial character which has catalysed
the growth of the spread. The newer areas which contain townships having followed building regulations
with adequate open spaces witnessed fewer cases. The neighbourhoods from Centre and South zones
have been more vulnerable.
5. Conclusions
The pandemic has brought forth the need to relook into city planning. The case of Ahmedabad
showed that neighbourhoods with high density, inadequate open spaces, narrow streets etc seemed more
vulnerable to spread of Covid-19 cases. This paper establishes this link between urban form and the
spread of Corona virus and paves the way for further detailed investigation establishing a link between
each of the elements in urban form and the spread. This paper urges planners and city developers to not
avoid pockets of congested built spaces which have acted as epicentres in the case of Covid-19 spread.
A mixed use kind of planning which allows people to support each other and also access of resources to
all should be promoted. The density, the built vs open ratio, the concentration of human activities, the
land use, the spatial fabric, etc are some of the factors within the built environment of our cities that
have been found to have links with the spread of the Covid-19 and it is therefore essential to critically
relook at our built fabric existing in the city. It is also important to consider this as one equally important
parameter as the other required social and physical criteria while planning our future cities.

Page | 115
Acknowledgements
We would like to show our gratitude to Ar. Anal Vaishnav and Ar. Sandeep Paul for their
assistance in conducting neighbourhood study by the students of B.Plan 2018-22 batch, Institute of
Architecture and Planning, Nirma University.
References
© 2020 by the authors. Licensee WEENTECH Publishers, Coventry, United Kingdom. This
article is an open access article distributed under the terms and conditions of the Creative
Commons Attribution (CC BY) license (http://creativecommons.org/licenses/by/4.0/)
[1] L. Mumford, “What is a city,” Architectural Record, pp. 93-96, 1937.
[2] H. Kitto, “The Polis,” The City Reader, 1996.
[3] J. Jacobs, The Death and Life of Great American Cities, 1961.
[4] G. o. Gujarat, “history,” 1 july 2020. [Online]. Available: https://ahmedabad.nic.in/history/.
[5] A. Jain, “https://www.livehistoryindia.com/amazing-india/2020/02/03/ahmedabad-live-life-pol-size,” 3 February 2020.
[Online]. Available: https://www.livehistoryindia.com/amazing-india/2020/02/03/ahmedabad-live-life-pol-size. [Accessed
7 July 2020].
[6] “Ahmedabad Municipal Corporation,” 15 July 2020. [Online]. Available:
https://ahmedabadcity.gov.in/portal/web?requestType=ApplicationRH&actionVal=loadCoronaRelatedDtls&queryType=S
elect&screenId=114. [Accessed 19 July 2020].
[7] S. Sejpal, “Theory and city form : the case of Ahmedabad,” Thesis (M.S.)--Massachusetts Institute of Technology, Dept.
of Architecture, 1987, 1987.
[8] S. MC, “GEOSPATIAL DATA MAPPING & DISSEMINATION FOR RESPONSES TO,” vol. 07, no. 06 June 2020,
2020.