Embed Size (px)
Citation preview
Urban land use/cover mapping using ALOS AVNIR-2
Ronald C. Estoque, Yuji Murayama, and Koko Lwin Division of Spatial Information Science
University of Tsukuba, Japan
November 18, 2011 JAXA ALOS-3 workshop; Tsukuba International Congress Center, Tsukuba city, Japan 1

Contents
1. Urban land use/cover mapping in Baguio: A hill station city in the Philippines
2. Multispectral Classification of ALOS AVNIR-2 for Human Settlement Mapping in South East Asia Cities
2

1. Urban land use/cover mapping in Baguio: A hill station city in the Philippines
• Objective
To map the land use/cover of Baguio and explore its urban development pattern.
3

• Approximate area – 57 sq. km
• Temperature – lowest = 6.3oC (January 18, 1961)
– highest= 30.4oC (March 15, 1988)
– ave. mean = 15–23oC
Philippines
Manila
Province of Benguet
Baguio City
Benguet
Road
a
b
c
• formally established in 1909
• it was envisioned to accommodate up to 25,000 people only
• protection and conservation of the ridges, hilltops and forest resources
- was emphasized in the plan for Baguio (Crossette, 1999; Gutierrez and Cariño, 2009; Reed, 1999)
4
Study area: Baguio city
Source: Saldivar-Sali & Einstein (2007); Basilan & Vicente (2008)
ALOS AVNIR-2 (2009)

• However, the population of Baguio has grown to at least 301,926 (NSO, 2007)
– greatly surpassing the maximum number of people it was envisioned to accommodate
• Its growth has been rapid since the 1980s – It is now one of the highly
urbanized cities in the Philippines – Unfortunately, rapid urbanization
and population growth are affecting the city’s natural environment
continued…
Highly urbanized hill
Traffic condition at the CBD Burnham park
Outside CBD
5
Study area: Baguio city

• Data
6
Land use/cover mapping
Data Date Scale/ Resolution
Source
1. RS image ALOS AVNIR-2
January, 2009 (dry season)
10 m
JAXA
2. Land use map of Baguio
2002
1:50,000
Baguio city, Philippines
3. Ground truth data 2010 & 2011 N/A Field survey
4. QuickBird image 2009 0.67m Google Earth
• Methods
• Maximum likelihood supervised classification
• Ground truth survey
• Training sites and signature development

Land use/cover classification scheme
Land use/cover types
Descriptions
Built-up Including concrete structures like buildings, houses, roads, bridges, airport, and others.
Forest Including thickly forested areas with Pine trees and broadleaved trees.
Brushland Including sparsely vegetated areas, bushes/scrubland, grassland, scattered trees mixed with scrubland especially in the very steep areas.
Cropland Including areas being utilized for agricultural activities particularly for growing cash crops like vegetables.
7
• Methods
Land use/cover mapping

8
Elevation Slope
Exploring urban development pattern Data • Map of developed areas
• Extracted from the land use/cover map
• Maps of spatial factors • City center, growth nodes, tourist spots, major
roads, elevation and slope
Methods • Buffering - city center, growth nodes, major roads
• 200m buffer size
• Reclassification – elevation and slope
• 30 classes
• Regression analysis • Density of develop area versus the spatial factors

9
• Results 2009 Land use/cover map of Baguio
2009 QuickBird satellite image (Source: Google Earth)

10
• Results
Classified data
Reference data Total
User's accuracy (%) Built-up Forest Brushland Cropland
Built-up area 119 0 0 5 124 95.97 Forest 0 68 4 0 72 94.44 Brushland 3 5 51 3 62 79.03 Cropland 8 1 3 42 54 77.78 Total 134 74 56 48 312 Producer's accuracy (%)
89.55 91.89 87.5 85.42
Overall Classification Accuracy (%) = 89.10 Overall Kappa Statistics = 0.847
Accuracy assessment using 312 ground truth points

11
• Results
R² = 0.8999
0
20
40
60
80
100
0 1000 2000 3000 D
ensi
ty o
f u
rban
d
evel
op
men
t (%
) Distance to growth node
R² = 0.4043
0
20
40
60
80
0 500 1000 1500
Den
sity
of
urb
an
dev
elo
pm
ent
(%)
Elevation (m asl)
R² = 0.7817
0
20
40
60
80
0 20 40 60
Den
sity
of
urb
an
dev
elo
pm
ent
(%)
Slope (degrees)
R² = 0.4639
0
20
40
60
80
0 2000 4000 6000
Den
sity
of
urb
an
dev
elo
pm
ent
(%)
Distance to tourist spot (m)
R² = 0.606
0
20
40
60
80
100
0 2000 4000 6000 8000
Den
sity
of
urb
an
dev
elo
pm
ent
(%)
Distance to city center (m)
R² = 0.8585
0
20
40
60
80
0 1000 2000
Den
sity
of
urb
an
dev
elo
pm
ent
(%)
Distance to major road (m)
Relationship of the density of urban development with the spatial factors

2. Multispectral Classification of ALOS AVNIR-2 for Human Settlement Mapping in South East
Asia Cities • Objective
To identify human settlement areas for population estimation in Yangon, Myanmar and Hanoi, Vietnam.
12

Yangon, Myanmar
13

Hanoi, Vietnam
14
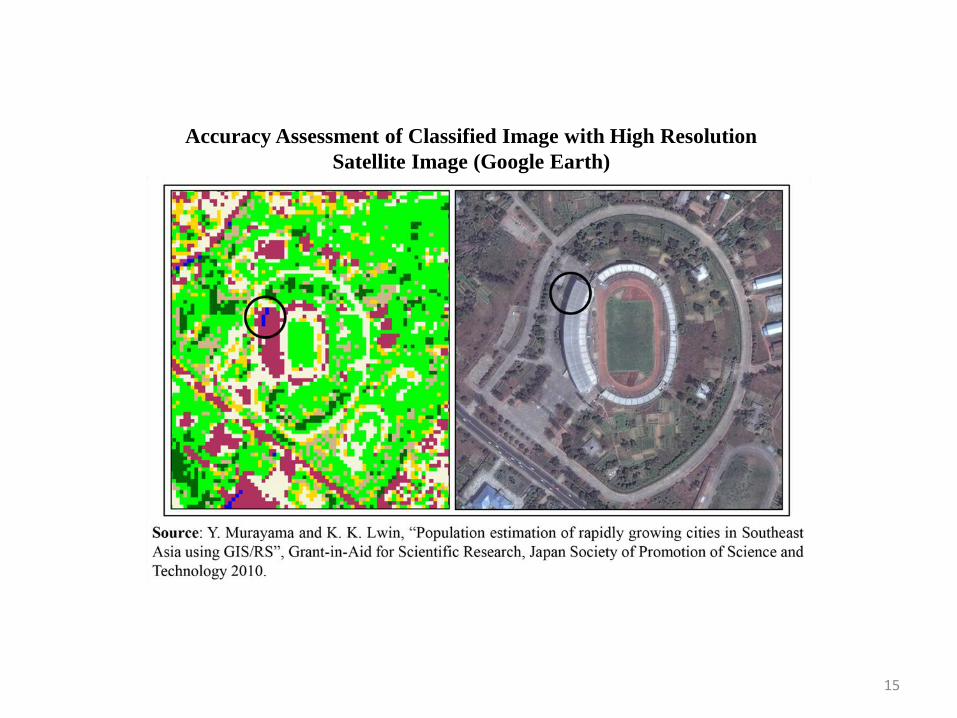
Accuracy Assessment of Classified Image with High Resolution
Satellite Image (Google Earth)
15

Accuracy Assessment of Classified Image with High Resolution
Satellite Image (Google Earth)
16

17
• Overall accuracy for Yangon and Hanoi
Yangon
Overall Classification accuracy 89.84%
Overall Kappa Statistics 0.8622
Hanoi
Overall Classification accuracy 86.67%
Overall Kappa Statistics 0.8314

• Using ALOS AVNIR-2 and multispectral classification • urban land use/cover maps for Baguio, Yangon and Hanoi were
mapped
• spatial distribution patterns of built-up and human settlements were clearly identified in all 3 cities
• 10m spatial resolution was able to capture features like major roads
• Accuracy assessment
• errors were observed especially between forest and brushland, and built-up and cropland
• spectral confusion due to mixed pixels
• shadows also caused errors in the classification
• Nevertheless, the classified land use/cover maps have relatively high accuracy.
Summary
18

Thank you very much for your attention…
どうもありがとうございました…
Baguio City 2010
Photo by R.C. Estoque
19
References
• Basilan, J. and Vicente, K. L. 2008. Baguio wakes up to coldest morn in 2008: Mercury drops to 10.8 degrees Celsius. Philippine Daily Inquirer, Manila, Philippines.
• Crossette, B. 1999. The great hill stations of Asia. Basic Books, USA.
• Gutierrez, C. B. and Cariño, J. K. 2009. The Baguio centennial yearbook. Heritage Promotions, Baguio city, Philippines.
• Murayama, Y. and Lwin, K. 2010. Population estimation of rapidly growing cities in Southeast Asia using GIS/RS. Grant-in-Aid for Scientific Research, Japan Society of Promotion of Science and Technology.
• National Statistics Office (NSO). 2007. Census of population and housing. NSO, Philippines.
• Reed, R. R. 1999. City of Pines: The origins of Baguio as a colonial hill station and regional capital. A-Seven Publishing, Baguio city, Philippines.
• Saldivar-Sali, A. and Einstein, H. H. 2007. A landslide risk rating system for Baguio, Philippines. Engineering Ecology, 91, 85–99.
20


![OBJETS CONNECTES - avniR · 2015. 12. 2. · La Pensée Cycle de Vie appliquée aux « OBJETS CONNECTES » Journée [avniR] plateforme [avniR], cd2e 5 novembre 2015, Nouveau Siècle,](https://img.pdfslide.net/doc/110x75/60661f83c6aa8d1d987c6f60/objets-connectes-avnir-2015-12-2-la-pense-cycle-de-vie-applique-aux-.jpg)


![Bulletin d’Informations de la Plateforme [avniR] [avniR ... · Les points clefs pour comprendre et faire comprendre* 27 // Formation : Comprendre l'ACV et l'éco-conception dans](https://img.pdfslide.net/doc/110x75/5b98e75e09d3f22f0a8ccc29/bulletin-dinformations-de-la-plateforme-avnir-avnir-les-points-clefs.jpg)