Embed Size (px)
Citation preview
URBAN RENEWAL AND RESIDENTIAL DISPLACEMENT IN MYLLYPURO
Master’s Thesis
Marika Ventovuori
Aalto University School of Business
Economics Fall 2021
Aalto University, P.O. BOX 11000, 00076 AALTO www.aalto.fi Abstract of master’s thesis
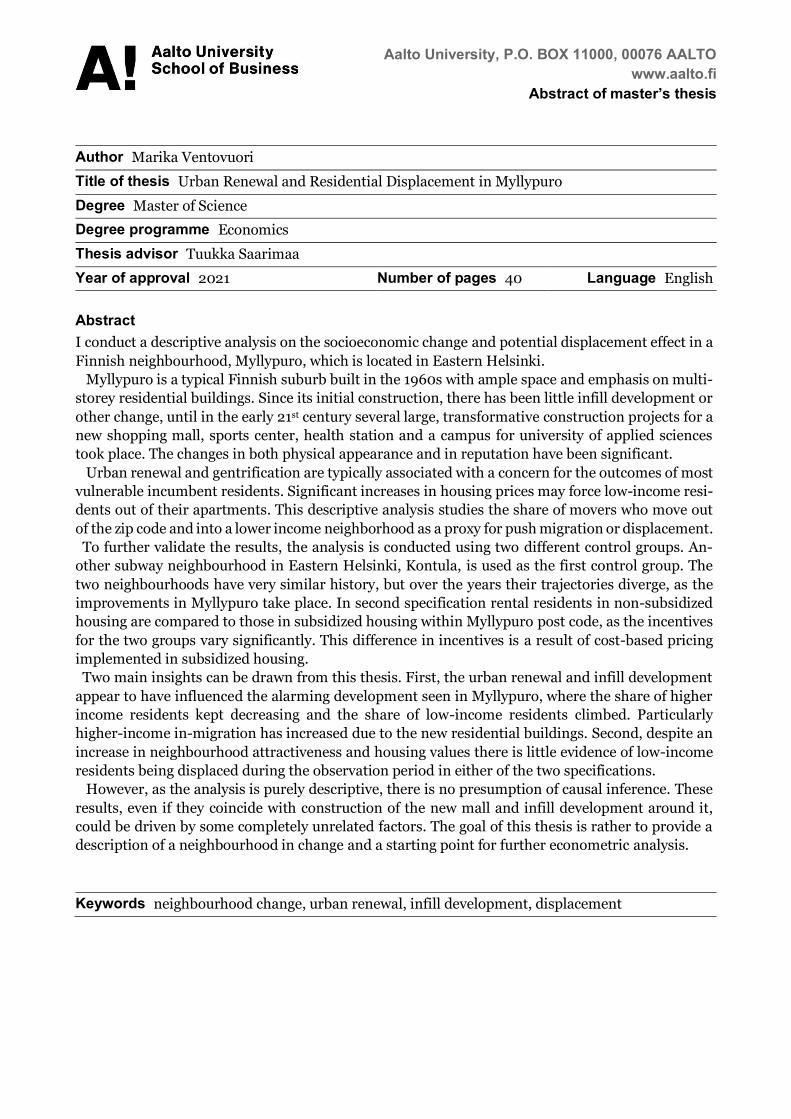
Author Marika Ventovuori Title of thesis Urban Renewal and Residential Displacement in Myllypuro Degree Master of Science Degree programme Economics
Thesis advisor Tuukka Saarimaa Year of approval 2021 Number of pages 40 Language English
Abstract I conduct a descriptive analysis on the socioeconomic change and potential displacement effect in a
Finnish neighbourhood, Myllypuro, which is located in Eastern Helsinki.
Myllypuro is a typical Finnish suburb built in the 1960s with ample space and emphasis on multi-
storey residential buildings. Since its initial construction, there has been little infill development or
other change, until in the early 21st century several large, transformative construction projects for a
new shopping mall, sports center, health station and a campus for university of applied sciences
took place. The changes in both physical appearance and in reputation have been significant.
Urban renewal and gentrification are typically associated with a concern for the outcomes of most
vulnerable incumbent residents. Significant increases in housing prices may force low-income resi-
dents out of their apartments. This descriptive analysis studies the share of movers who move out
of the zip code and into a lower income neighborhood as a proxy for push migration or displacement.
To further validate the results, the analysis is conducted using two different control groups. An-
other subway neighbourhood in Eastern Helsinki, Kontula, is used as the first control group. The
two neighbourhoods have very similar history, but over the years their trajectories diverge, as the
improvements in Myllypuro take place. In second specification rental residents in non-subsidized
housing are compared to those in subsidized housing within Myllypuro post code, as the incentives
for the two groups vary significantly. This difference in incentives is a result of cost-based pricing
implemented in subsidized housing.
Two main insights can be drawn from this thesis. First, the urban renewal and infill development
appear to have influenced the alarming development seen in Myllypuro, where the share of higher
income residents kept decreasing and the share of low-income residents climbed. Particularly
higher-income in-migration has increased due to the new residential buildings. Second, despite an
increase in neighbourhood attractiveness and housing values there is little evidence of low-income
residents being displaced during the observation period in either of the two specifications.
However, as the analysis is purely descriptive, there is no presumption of causal inference. These
results, even if they coincide with construction of the new mall and infill development around it,
could be driven by some completely unrelated factors. The goal of this thesis is rather to provide a
description of a neighbourhood in change and a starting point for further econometric analysis.
Keywords neighbourhood change, urban renewal, infill development, displacement
Aalto-yliopisto, PL 11000, 00076 AALTO www.aalto.fi Maisterintutkinnon tutkielman tiivistelmä Tekijä Marika Ventovuori Työn nimi Urban Renewal and Residential Displacement in Myllypuro Tutkinto Kauppatieteiden maisteri Koulutusohjelma Taloustiede
Työn ohjaaja Tuukka Saarimaa Hyväksymisvuosi 2021 Sivumäärä 40 Kieli Englanti
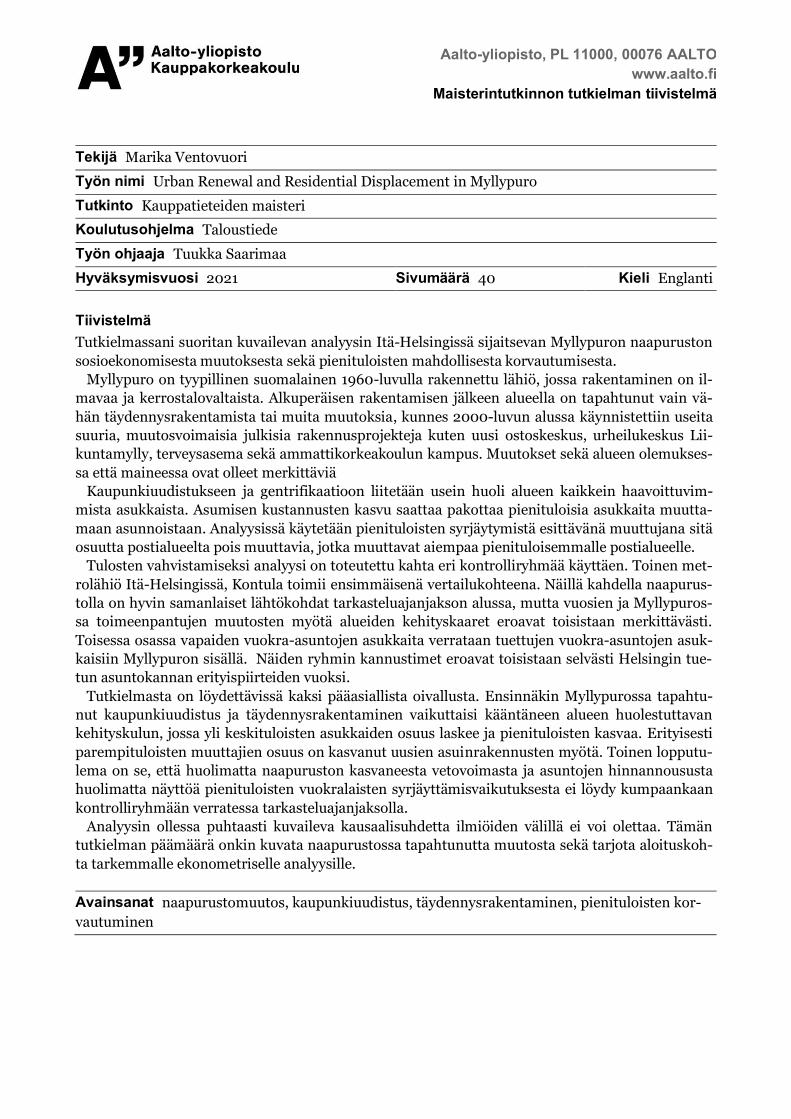
Tiivistelmä Tutkielmassani suoritan kuvailevan analyysin Itä-Helsingissä sijaitsevan Myllypuron naapuruston
sosioekonomisesta muutoksesta sekä pienituloisten mahdollisesta korvautumisesta.
Myllypuro on tyypillinen suomalainen 1960-luvulla rakennettu lähiö, jossa rakentaminen on il-
mavaa ja kerrostalovaltaista. Alkuperäisen rakentamisen jälkeen alueella on tapahtunut vain vä-
hän täydennysrakentamista tai muita muutoksia, kunnes 2000-luvun alussa käynnistettiin useita
suuria, muutosvoimaisia julkisia rakennusprojekteja kuten uusi ostoskeskus, urheilukeskus Lii-
kuntamylly, terveysasema sekä ammattikorkeakoulun kampus. Muutokset sekä alueen olemukses-
sa että maineessa ovat olleet merkittäviä
Kaupunkiuudistukseen ja gentrifikaatioon liitetään usein huoli alueen kaikkein haavoittuvim-
mista asukkaista. Asumisen kustannusten kasvu saattaa pakottaa pienituloisia asukkaita muutta-
maan asunnoistaan. Analyysissä käytetään pienituloisten syrjäytymistä esittävänä muuttujana sitä
osuutta postialueelta pois muuttavia, jotka muuttavat aiempaa pienituloisemmalle postialueelle.
Tulosten vahvistamiseksi analyysi on toteutettu kahta eri kontrolliryhmää käyttäen. Toinen met-
rolähiö Itä-Helsingissä, Kontula toimii ensimmäisenä vertailukohteena. Näillä kahdella naapurus-
tolla on hyvin samanlaiset lähtökohdat tarkasteluajanjakson alussa, mutta vuosien ja Myllypuros-
sa toimeenpantujen muutosten myötä alueiden kehityskaaret eroavat toisistaan merkittävästi.
Toisessa osassa vapaiden vuokra-asuntojen asukkaita verrataan tuettujen vuokra-asuntojen asuk-
kaisiin Myllypuron sisällä. Näiden ryhmin kannustimet eroavat toisistaan selvästi Helsingin tue-
tun asuntokannan erityispiirteiden vuoksi.
Tutkielmasta on löydettävissä kaksi pääasiallista oivallusta. Ensinnäkin Myllypurossa tapahtu-
nut kaupunkiuudistus ja täydennysrakentaminen vaikuttaisi kääntäneen alueen huolestuttavan
kehityskulun, jossa yli keskituloisten asukkaiden osuus laskee ja pienituloisten kasvaa. Erityisesti
parempituloisten muuttajien osuus on kasvanut uusien asuinrakennusten myötä. Toinen lopputu-
lema on se, että huolimatta naapuruston kasvaneesta vetovoimasta ja asuntojen hinnannoususta
huolimatta näyttöä pienituloisten vuokralaisten syrjäyttämisvaikutuksesta ei löydy kumpaankaan
kontrolliryhmään verratessa tarkasteluajanjaksolla.
Analyysin ollessa puhtaasti kuvaileva kausaalisuhdetta ilmiöiden välillä ei voi olettaa. Tämän
tutkielman päämäärä onkin kuvata naapurustossa tapahtunutta muutosta sekä tarjota aloituskoh-
ta tarkemmalle ekonometriselle analyysille. Avainsanat naapurustomuutos, kaupunkiuudistus, täydennysrakentaminen, pienituloisten kor-
vautuminen

Contents
1 Introduction 1
2 Previous literature 4
2.1 Migration trends, gentrification and displacement . . . . . . . . . . . . . . 4
2.2 Urban renewal and infill development . . . . . . . . . . . . . . . . . . . . . 6
2.3 Subsidised housing . . . . . . . . . . . . . . . . . . . . . . . . . . . . . . . 12
3 Research design and data 14
3.1 Neighbourhood characteristics and descriptive statistics . . . . . . . . . . . 15
3.2 Data . . . . . . . . . . . . . . . . . . . . . . . . . . . . . . . . . . . . . . . 19
4 Results 21
4.1 Neighbourhood specification . . . . . . . . . . . . . . . . . . . . . . . . . . 21
4.2 ARA specification . . . . . . . . . . . . . . . . . . . . . . . . . . . . . . . . 26
5 Conclusions 30
A Additional figures 34
B Institutional framework 38
B.1 Helsinki housing market and city housing policy . . . . . . . . . . . . . . . 38
B.2 Housing finance and development centre of Finland . . . . . . . . . . . . . 39
B.3 Helsinki city housing company . . . . . . . . . . . . . . . . . . . . . . . . . 39
List of Figures
1 Treatment and control neighbourhoods . . . . . . . . . . . . . . . . . . . . 14
2 Multistories in Myllypuro . . . . . . . . . . . . . . . . . . . . . . . . . . . 19
3 Residential multistory buildings in Kontula . . . . . . . . . . . . . . . . . . 20
4 Mean disposable income and population . . . . . . . . . . . . . . . . . . . 22
5 Share of residents in the lowest quartile and above median . . . . . . . . . 23
6 Mean disposable income of inmovers and outmovers . . . . . . . . . . . . . 24
7 Migration trends . . . . . . . . . . . . . . . . . . . . . . . . . . . . . . . . 25
8 Inmovers by income group . . . . . . . . . . . . . . . . . . . . . . . . . . . 26
9 Mean disposable income . . . . . . . . . . . . . . . . . . . . . . . . . . . . 27
10 Share of outmovers who move into lower income postal code . . . . . . . . 28
11 Mean disposable income of inmovers and outmovers . . . . . . . . . . . . . 29
A1 Residential housing development in Myllypuro . . . . . . . . . . . . . . . . 34
A2 Residential housing development in Kontula . . . . . . . . . . . . . . . . . 35
List of Tables
1 Summary statistics of Myllypuro . . . . . . . . . . . . . . . . . . . . . . . 16
2 Summary statistics of Kontula . . . . . . . . . . . . . . . . . . . . . . . . . 18
A1 Number of observations - Neighbourhood specification . . . . . . . . . . . . 36
A2 Number of observations - ARA specification . . . . . . . . . . . . . . . . . 37
1 Introduction
The city of Helsinki is growing at a fast speed. Its population is expected to grow by 22-36
percent by 2050, and this growth may induce some negative externalites, such as inade-
quate supply of housing and rapidly increasing housing costs. To accommodate growth
while keeping prices from escalating Helsinki utilizes extensively infill development, which
can be defined as building on vacant lots in already populated areas. Infill development is
typically considered as an environmentally and economically convenient way to increase
the housing stock. Benefits and downsides are however hotly debated. Evaluating and
understanding the actual outcomes of such measures is crucial in order to implement a
well-rounded housing policy that accomplishes its goals.
A common concern related to infill development and urban renewal is the displacement
of most vulnerable residents. This could happen if new, higher-quality housing stock and
increased neighbourhood appeal attract wealthier new residents. These new residents may
induce positive spillover effects such as improved services which ultimately contribute to
an increase in housing prices. If the cost of living significantly increases, the least affluent
rental residents might be forced to relocate into a more affordable location or apartment.
This issue is further emphasized as lower-income areas tend to see most infill development.
In Finland, the low-income suburbs are often those built in 1960’s and 1970’s. They are
often quite depreciated, but the resident density is small so it is possible to increase both
housing stock and neighbourhood quality through infill development. These neighbour-
hoods may also be more attractive to developers. As McConnell and Wiley (2010) note,
the biggest obstacle to infill development is typically residential opposition. In the de-
preciated suburbs there is perhaps smaller share of owners who are actively resisting this
kind of community change.
Literature mainly report slightly positive or insignificant changes to housing values around
new infill development (see e.g. Ooi and Le (2013) and Kurvinen and Vihola (2016)) and
in areas targeted with urban renewal programs (see e.g. Ahlfeldt et al. (2017) and Rossi-
Hansberg et al. (2010)), Evidence on significant displacement effect that is induced by
1
gentrification, urban renewal or infill development is scarce (Freeman (2005)). This poten-
tial contradiction might result from rents that adjust slowly to increased housing prices.
Also the increased housing supply could reduce rents (Pennington (2021), Asquith et al.
(2021)).
This thesis is focused on the neighbourhood change and potential displacement effect
in a Finnish suburb. For the past decade Myllypuro, once a notorious and depreciating
neighbourhood in eastern Helsinki has undergone a significant increase in reputation and
overall neighbourhood attractiveness, something other similar suburbs have been unable
to achieve. Myllypuro has been a target of many urban revitalisation programs, as well as
public projects like construction of a new mall and a health station. Significant amount
of infill development was constructed within a relatively short period of time. In this
thesis migration trends that contribute to the cycle of improvement Myllypuro appears
to be experiencing are investigated to produce a detailed explanation on the main drivers
of this change. Particular emphasis is placed on the lower income residents by assessing
whether the substantial increases in housing prices (Kallio (2019)) and overall reputation
(Nieminen (2020)) could have led to displacement.
Empirical part consists of two specifications. First, Myllypuro is compared to an adja-
cent neighbourhood, which has experienced similar development until the drastic renewal
actions in Myllypuro took place. Then, rental residents in subsidised and non-subsidised
housing within Myllypuro are compared to investigate potential displacement effect.
Results seem to confirm that the notions of McKinnish et al. (2010) and Brummet and
Reed (2019), who claim that the neighbourhoods are changed in most part by inmov-
ing residents, hold for Myllypuro as well. Affluent inmovers since 2012 seem to be the
largest direct cause shifting Myllypuro into a new trajectory. New infill development
has increased the number of inmovers, who have been on average more affluent than the
incumbent residents, shaping the overall income diversity of the neighbourhood. Higher
income residents, higher quality buildings and public development projects have induced
2
positive externalities, supposedly improving the attractiveness of the area as whole.
As for the second part of the analysis, there is little evidence of displacement or push
migration in Myllypuro. Displacement was proxied as the share of outmovers who move
into post codes with lower income level. Rental residents in non-subsidised apartments
were compared to those in subsidised, cost-based rental apartments. There is no dis-
cernible increase in outmoves to lower income post codes for residents in non-subsidised
apartments. Low-income residents in Myllypuro also were not more likely to suddenly
move out of Myllypuro when compared to another similar neighbourhood in Helsinki.
Despite a significant increase in housing prices, there is thus little reason to believe that
low-income residents of Myllypuro are being displaced, at least within the bounds of the
observation period employed. It could also be, that the encumbent residents appreciate
the increased neighbourhood quality over the increase in price. The observed socioeco-
nomic change might then be mostly driven by so-called indirect displacement, caused by
selective entry. In other words, the rate of low-income outmovers does not increase, but
the new inmovers are systematically wealthier than before. Additionally, the turnover
rate of high-income residents may decrease, contributing to the increase in mean dispos-
able income.
There are several potential pitfalls connected to empirical urban research. Spatial data
is by its nature non-random, which makes causal inference difficult or even impossible.
The goal of this thesis is not to suggest causal inference, but rather to visualize the data
in order to describe a neighbourhood in change and explore the possibility of adverse
effects.
3
2 Previous literature
The literature on the effects of urban renewal and infill development is quite varied. In
most studies the effect on housing prices is slightly positive (see for example Ooi and Le
(2013), Rossi-Hansberg et al. (2010), Zahirovich-Herbert and Gibler (2014) and Ahlfeldt
et al. (2017)). Research on the effects on rents is scarcer, but recent studies papers by
Pennington (2021) and Asquith et al. (2021) show that rents decrease in the vicinity of
new construction. Neighbourhoods however differ in many aspects, making straightfor-
ward conclusions impossible. Construction of housing, and particularly social housing,
may have very different effects in affluent and in poor neighbourhoods. According to Dia-
mond and McQuade (2019), accommodation of lower income-residents through subsidised
housing may decrease property values in affluent neighbourhoods, while in poor areas new
construction can increase overall neighbourhood quality and thereby housing prices.
This literature review is broken into three sections. First, neighbourhood change and
gentrification are described, along with the mechanisms behind these phenomena. Then
a review of quasi-experimental research papers on the effects of infill development and
urban revitalisation is conducted. Research on subsidised housing concludes the chapter.
2.1 Migration trends, gentrification and displacement
Areas may be differentiated using the concept of economic gains. A neighbourhood experi-
ences economic gains if it experiences an increase in the average income level. Considering
a simple supply and demand framework, it is natural to assume that housing prices and
income level might be cointegrated, as the wealthiest can outbid lower-income households
for the most desirable places to live. As Rosenthal (2008) observes, there is often con-
stant fluctuation in the form of economic gains and losses within neighbourhoods. These
patterns are in part driven by the aging and depreciation of the housing stock and rede-
velopment, but social interactions associated with local externalities are likely to make
significant contributions to them too. Having more affuent residents in an area can pro-
duce positive externalities, such as increased homeownership share, more amenities, and
4
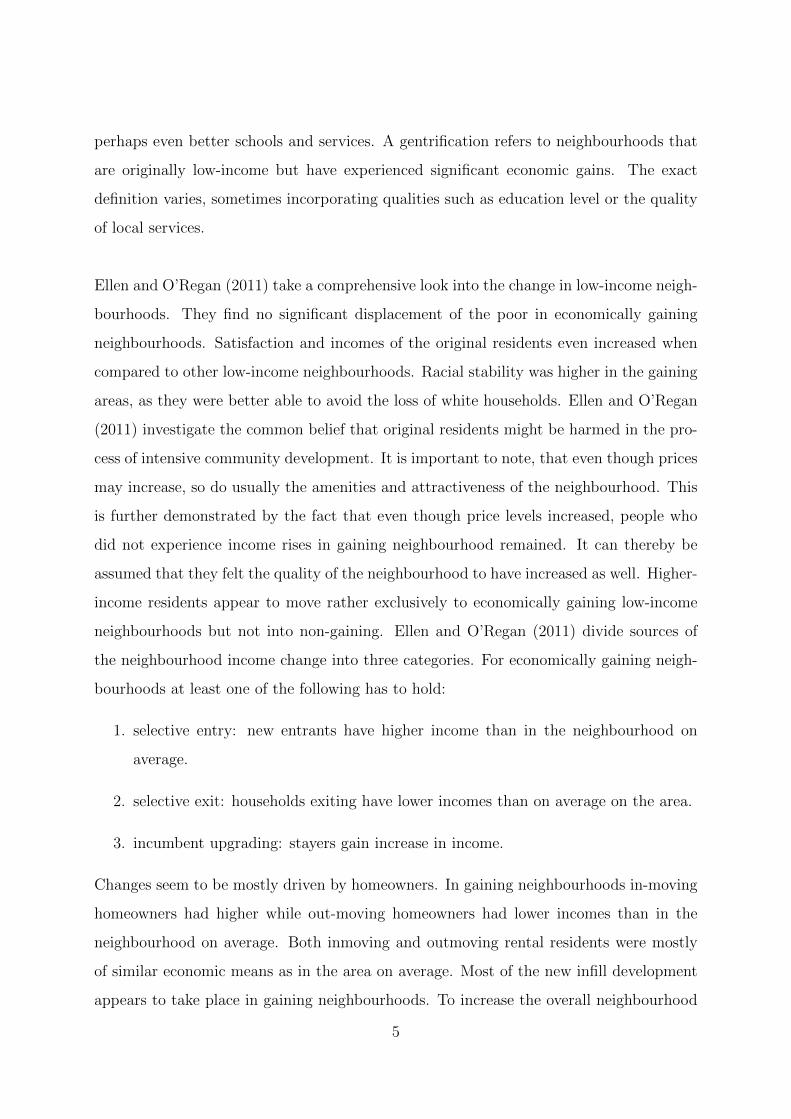
perhaps even better schools and services. A gentrification refers to neighbourhoods that
are originally low-income but have experienced significant economic gains. The exact
definition varies, sometimes incorporating qualities such as education level or the quality
of local services.
Ellen and O’Regan (2011) take a comprehensive look into the change in low-income neigh-
bourhoods. They find no significant displacement of the poor in economically gaining
neighbourhoods. Satisfaction and incomes of the original residents even increased when
compared to other low-income neighbourhoods. Racial stability was higher in the gaining
areas, as they were better able to avoid the loss of white households. Ellen and O’Regan
(2011) investigate the common belief that original residents might be harmed in the pro-
cess of intensive community development. It is important to note, that even though prices
may increase, so do usually the amenities and attractiveness of the neighbourhood. This
is further demonstrated by the fact that even though price levels increased, people who
did not experience income rises in gaining neighbourhood remained. It can thereby be
assumed that they felt the quality of the neighbourhood to have increased as well. Higher-
income residents appear to move rather exclusively to economically gaining low-income
neighbourhoods but not into non-gaining. Ellen and O’Regan (2011) divide sources of
the neighbourhood income change into three categories. For economically gaining neigh-
bourhoods at least one of the following has to hold:
1. selective entry: new entrants have higher income than in the neighbourhood on
average.
2. selective exit: households exiting have lower incomes than on average on the area.
3. incumbent upgrading: stayers gain increase in income.
Changes seem to be mostly driven by homeowners. In gaining neighbourhoods in-moving
homeowners had higher while out-moving homeowners had lower incomes than in the
neighbourhood on average. Both inmoving and outmoving rental residents were mostly
of similar economic means as in the area on average. Most of the new infill development
appears to take place in gaining neighbourhoods. To increase the overall neighbourhood
5
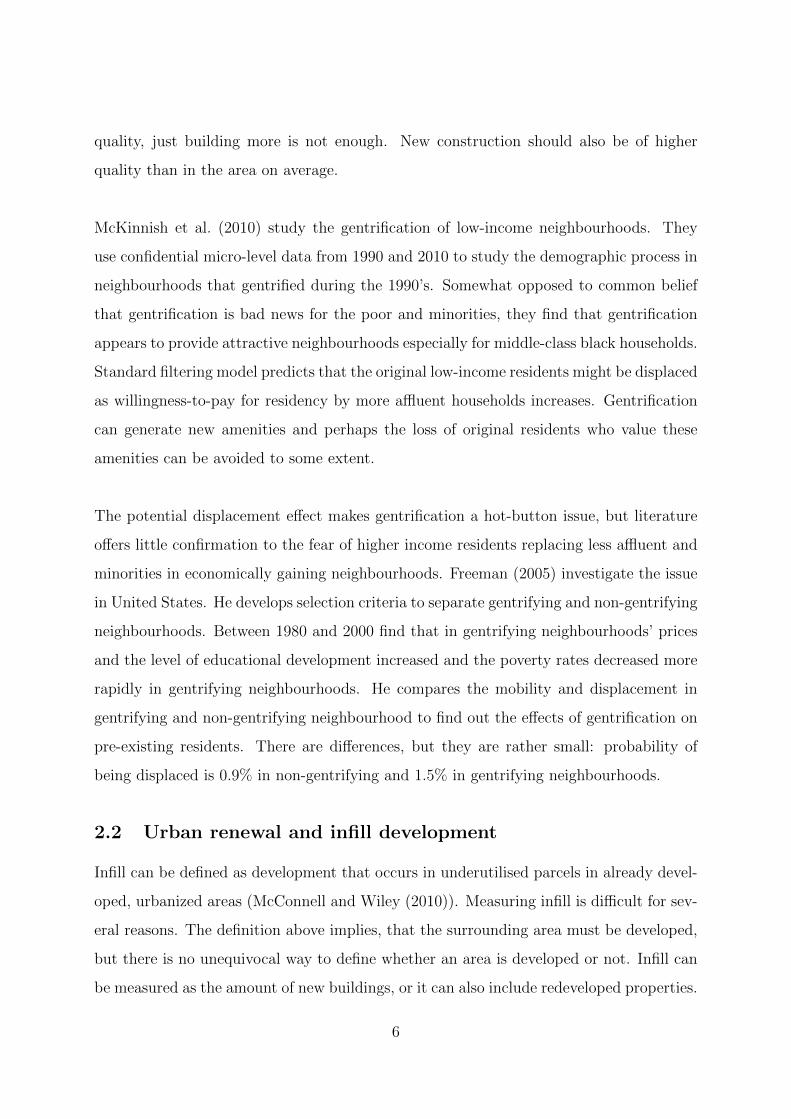
quality, just building more is not enough. New construction should also be of higher
quality than in the area on average.
McKinnish et al. (2010) study the gentrification of low-income neighbourhoods. They
use confidential micro-level data from 1990 and 2010 to study the demographic process in
neighbourhoods that gentrified during the 1990’s. Somewhat opposed to common belief
that gentrification is bad news for the poor and minorities, they find that gentrification
appears to provide attractive neighbourhoods especially for middle-class black households.
Standard filtering model predicts that the original low-income residents might be displaced
as willingness-to-pay for residency by more affluent households increases. Gentrification
can generate new amenities and perhaps the loss of original residents who value these
amenities can be avoided to some extent.
The potential displacement effect makes gentrification a hot-button issue, but literature
offers little confirmation to the fear of higher income residents replacing less affluent and
minorities in economically gaining neighbourhoods. Freeman (2005) investigate the issue
in United States. He develops selection criteria to separate gentrifying and non-gentrifying
neighbourhoods. Between 1980 and 2000 find that in gentrifying neighbourhoods’ prices
and the level of educational development increased and the poverty rates decreased more
rapidly in gentrifying neighbourhoods. He compares the mobility and displacement in
gentrifying and non-gentrifying neighbourhood to find out the effects of gentrification on
pre-existing residents. There are differences, but they are rather small: probability of
being displaced is 0.9% in non-gentrifying and 1.5% in gentrifying neighbourhoods.
2.2 Urban renewal and infill development
Infill can be defined as development that occurs in underutilised parcels in already devel-
oped, urbanized areas (McConnell and Wiley (2010)). Measuring infill is difficult for sev-
eral reasons. The definition above implies, that the surrounding area must be developed,
but there is no unequivocal way to define whether an area is developed or not. Infill can
be measured as the amount of new buildings, or it can also include redeveloped properties.
6
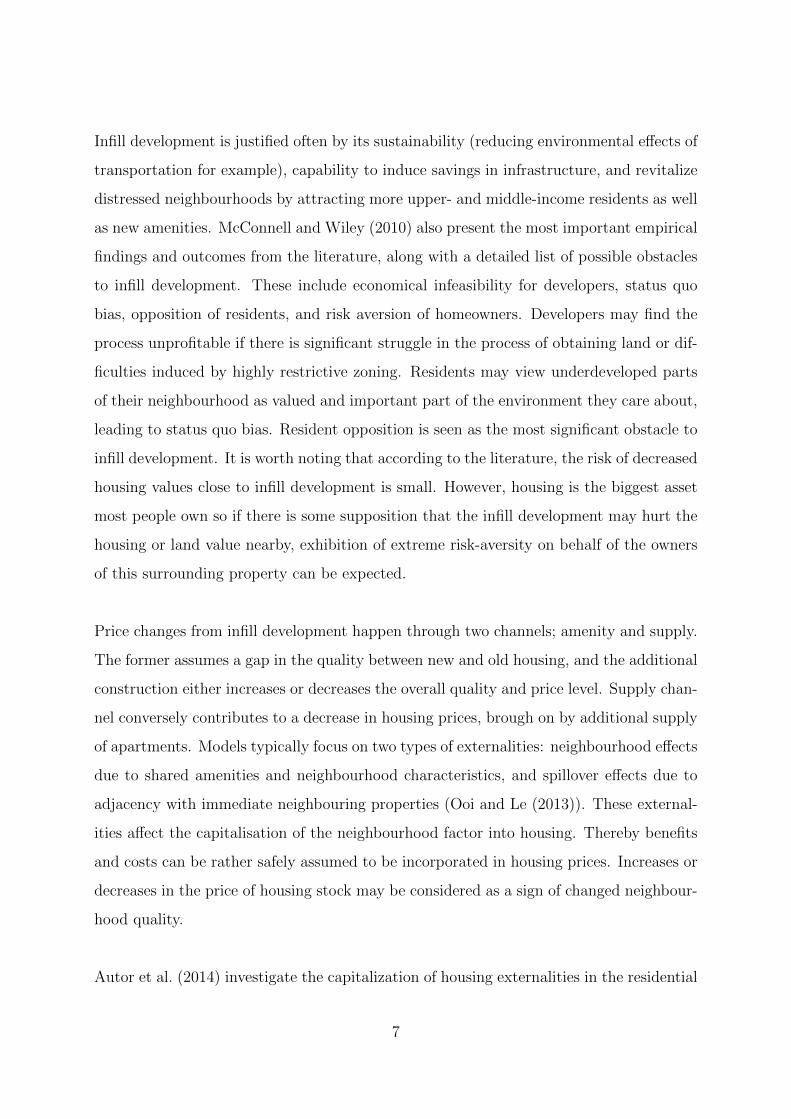
Infill development is justified often by its sustainability (reducing environmental effects of
transportation for example), capability to induce savings in infrastructure, and revitalize
distressed neighbourhoods by attracting more upper- and middle-income residents as well
as new amenities. McConnell and Wiley (2010) also present the most important empirical
findings and outcomes from the literature, along with a detailed list of possible obstacles
to infill development. These include economical infeasibility for developers, status quo
bias, opposition of residents, and risk aversion of homeowners. Developers may find the
process unprofitable if there is significant struggle in the process of obtaining land or dif-
ficulties induced by highly restrictive zoning. Residents may view underdeveloped parts
of their neighbourhood as valued and important part of the environment they care about,
leading to status quo bias. Resident opposition is seen as the most significant obstacle to
infill development. It is worth noting that according to the literature, the risk of decreased
housing values close to infill development is small. However, housing is the biggest asset
most people own so if there is some supposition that the infill development may hurt the
housing or land value nearby, exhibition of extreme risk-aversity on behalf of the owners
of this surrounding property can be expected.
Price changes from infill development happen through two channels; amenity and supply.
The former assumes a gap in the quality between new and old housing, and the additional
construction either increases or decreases the overall quality and price level. Supply chan-
nel conversely contributes to a decrease in housing prices, brough on by additional supply
of apartments. Models typically focus on two types of externalities: neighbourhood effects
due to shared amenities and neighbourhood characteristics, and spillover effects due to
adjacency with immediate neighbouring properties (Ooi and Le (2013)). These external-
ities affect the capitalisation of the neighbourhood factor into housing. Thereby benefits
and costs can be rather safely assumed to be incorporated in housing prices. Increases or
decreases in the price of housing stock may be considered as a sign of changed neighbour-
hood quality.
Autor et al. (2014) investigate the capitalization of housing externalities in the residential
7
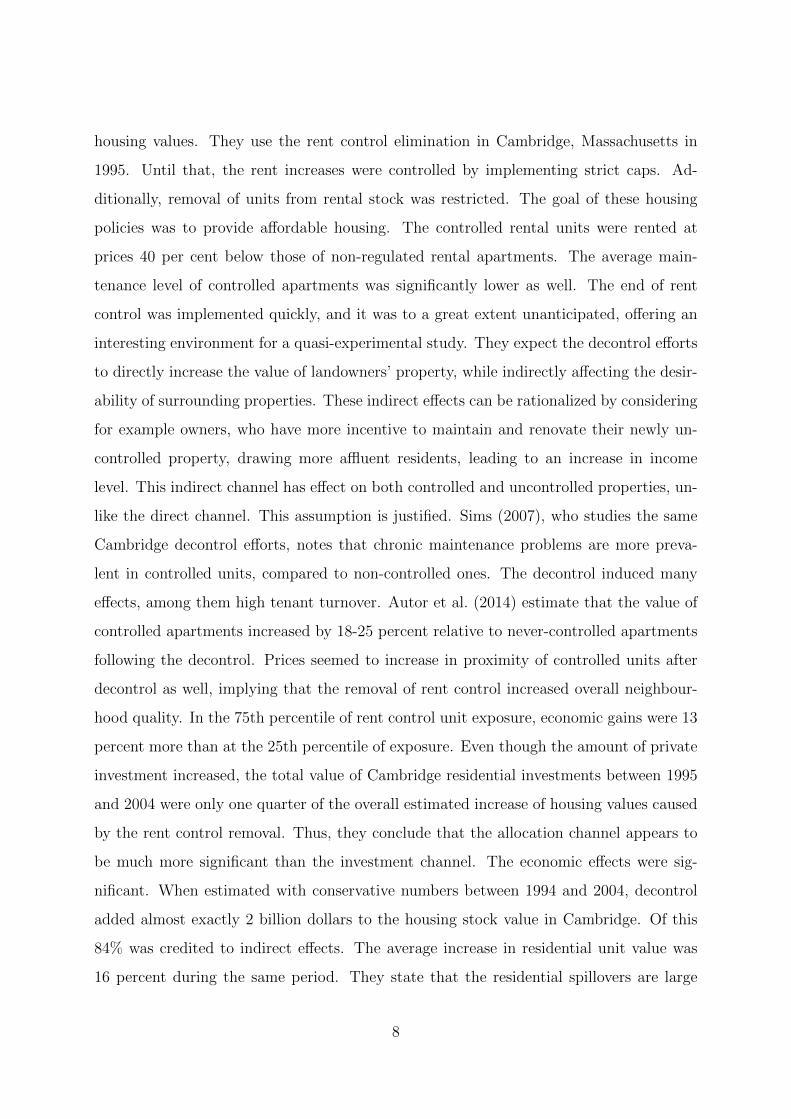
housing values. They use the rent control elimination in Cambridge, Massachusetts in
1995. Until that, the rent increases were controlled by implementing strict caps. Ad-
ditionally, removal of units from rental stock was restricted. The goal of these housing
policies was to provide affordable housing. The controlled rental units were rented at
prices 40 per cent below those of non-regulated rental apartments. The average main-
tenance level of controlled apartments was significantly lower as well. The end of rent
control was implemented quickly, and it was to a great extent unanticipated, offering an
interesting environment for a quasi-experimental study. They expect the decontrol efforts
to directly increase the value of landowners’ property, while indirectly affecting the desir-
ability of surrounding properties. These indirect effects can be rationalized by considering
for example owners, who have more incentive to maintain and renovate their newly un-
controlled property, drawing more affluent residents, leading to an increase in income
level. This indirect channel has effect on both controlled and uncontrolled properties, un-
like the direct channel. This assumption is justified. Sims (2007), who studies the same
Cambridge decontrol efforts, notes that chronic maintenance problems are more preva-
lent in controlled units, compared to non-controlled ones. The decontrol induced many
effects, among them high tenant turnover. Autor et al. (2014) estimate that the value of
controlled apartments increased by 18-25 percent relative to never-controlled apartments
following the decontrol. Prices seemed to increase in proximity of controlled units after
decontrol as well, implying that the removal of rent control increased overall neighbour-
hood quality. In the 75th percentile of rent control unit exposure, economic gains were 13
percent more than at the 25th percentile of exposure. Even though the amount of private
investment increased, the total value of Cambridge residential investments between 1995
and 2004 were only one quarter of the overall estimated increase of housing values caused
by the rent control removal. Thus, they conclude that the allocation channel appears to
be much more significant than the investment channel. The economic effects were sig-
nificant. When estimated with conservative numbers between 1994 and 2004, decontrol
added almost exactly 2 billion dollars to the housing stock value in Cambridge. Of this
84% was credited to indirect effects. The average increase in residential unit value was
16 percent during the same period. They state that the residential spillovers are large
8
and that when considering public housing policies, they should be considered not only
through direct, but also through indirect effects.
Ooi and Le (2013) study infill development in Singapore employing arbitrarily chosen
rings around the new development and estimating the price changes of surrounding prop-
erties before and after the new developments. This change is then compared to price
changes of properties of a comparable control group. They argue that infill development
tends to be sold at excessive prices and calculate the price premiums developers earn to
be around 4,8%. In addition to two most studied channels, amenity and supply, they
also include a third channel concerning capitalisation of new information, following the
effects all the way from purchase of the land until the point where apartments are turned
over to their new owners. They find that capitalisation effect is concentrated in the land
acquisition and preparation phase when the housing prices in immediate vicinity of new
infill construction site increased up to 2,11%. The effects are heterogeneous regarding the
attributes of developments such as location, height, and scale. The relative physical size
of new buildings has a negative impact on these prices, while building on teardown sites
has positive externalities.
Rossi-Hansberg et al. (2010) study the housing externalities that are caused by revitalisa-
tion programs in Virginia, United States. They focused on the Neighbourhoods-in-Bloom
program, which directed federally funded housing investments to a few struggling neigh-
bourhoods. In their paper government intervention, such as subsidised renewal projects,
are justified by assumption that market interactions between households and houses within
a neighbourhood that the residents cannot control lead to inefficiency in equilibrium allo-
cation of housing. They provide a model of housing externalities, where the value of hous-
ing services to agents (homeowners in this case) depends linearly on the value of their own
house, and a weighted average of the value of all surrounding houses, both measured net of
land rents. Weights decrease exponentially with distance. They use changes in land prices
to measure the magnitude of revitalisation policy effects. In their model the agents maxi-
mize a Cobb-Douglas utility function through consumption of goods and housing services.
9
Their estimates obtained by using a semiparametric hedonic price regression imply that
the neighbourhoods targeted with residential urban revitalisation projects experienced on
average 2-5% increase in land prices annually compared to control neighbourhoods. They
observe that these results are unlikely to be caused by increased private investments, since
anyone moving there after the Neighbourhoods-in-Bloom program probably would have
taken advantage of the program. Second reason they offer is that the level of overall
sales in project neighbourhoods did not change after the implementation of programme.
Additionally, externalities appear to decrease by half approximately every 1000 feet. The
return on each dollar spent on the program caused the land value to increase by 2 to
6 dollars. Even though these results do not necessarily fully extend to other cities and
countries, their paper does show the existence of significant housing externalities.
Ahlfeldt et al. (2017) conduct a quasi-experiment in Berlin, studying spatially targeted re-
newal policies that followed unification of the city in 1990. They find that these policies in-
creased renovation and maintenance spending and reduced the propensity of poor-quality
buildings, accompanied by property price increase of 0.1-2% per year. This increase how-
ever seems to mostly follow from the change in internal quality upgrades, implying the
absence of significant externalities or spillovers. They state that it is unclear whether
the spatially targeted renewal policies induce improvements in welfare even though they
appear to have a beneficial effect on the built environment.
Zahirovich-Herbert and Gibler (2014) find price effects to be insignificant in size as well.
They estimate the impact of new single-family construction on the surrounding housing
prices employing a hedonic pricing model. Their results imply positive but very small ef-
fects for the average size homes. The effect was slightly bigger for relatively larger houses.
Pennington (2021) utilizes the variation in probability of new development caused by
serious building fires in San Francisco. A fire increases the likelihood of new development,
but the location and timing of such events are random. She concludes that while new
residential buildings may contribute to the gentrification of the area in the long run, it
10
also decreases rents by 1.2-2.3 percent for residents within 500 meters of the new building.
Additionally, the probability of displacement is reduced.
Asquith et al. (2021) find rents to decrease by 6 percent compared to units that are
slightly farther away. Using address-level microdata on new construction in 11 cities they
construct three empirical strategies and conduct difference-in-differences analysis compar-
ing buildings by location and time, and finally combining the two for a triple-difference
specification. They show that even though the housing stock is significantly increased
and new buildings accommodate higher-income residents, there is little evidence of strong
demand effect. This might follow from the certain attributes of the neighbourhoods, as
typically new construction is aimed at areas that are already changing.
In Finland, there has been some research on the subject. Ahvenniemi et al. (2018) study
seven case neighbourhoods in Helsinki metropolitan area (HMA) to investigate the impact
of infill development on existing properties. Changes were captured by a difference-in-
difference estimator, and value formation was estimated with a hedonic regression model.
They find neither positive nor significantly negative effect. Differing results were obtained
by Kurvinen and Vihola (2016), who also use a hedonic regression and a difference-in-
difference approach to study the price effects in Helsinki metropolitan area. They find
immediate positive effects of 2.3% to 2.6% on price levels of similar buildings within 300
meters of a newly completed multi-story apartment building.
Price changes in Myllypuro are examined by Kallio (2019), who finds that the value
of pre-existing multistories in Myllypuro has seen an increase of cumulative growth of
4 to 16 percent above comparable control neighbourhoods in the past decade. He con-
tributes this increase to urban revitalisation projects, and in particular the construction
of new shopping mall.
11
2.3 Subsidised housing
Diamond and McQuade (2019) use Low Income Housing Tax Credit (LIHTC) develop-
ment in the United States to estimate the spillover effects of subsidised infill development
on surrounding property prices. Developers cannot control when the funding is granted
or the exact geological location, and this non-randomness is exploited to identify the price
effects. Through transforming data on housing prices to data on the derivative of housing
prices with respect to distance from LIHTC development, they develop a nonparametric
difference-in-differences style estimator to factor out local time trends and neighbourhood
variation. Combined with a structural, generalized hedonic model of housing choice they
can recover individual preferences. Long-term partial equilibrium welfare effects are mea-
sured so that there are zero moving costs, and when affordable housing is constructed, all
households will reoptimize. Renters and homeowners face same optimization problem in
the pre-period. For households who live far away from new LIHTC housing, the welfare
effect is zero. For homeowners who live close to new sites, and choose to move away,
the welfare impact is given by the change in prices. At least in the short term, renters
benefit if the LIHTC is seen as an amenity. If LIHTC is seen as a disamenity, the rents
should decrease. The welfare effects are calculated also for landlords whose properties
are located near LIHTC sites. Aggregating all these, they get the overall welfare effects
to the society. They find that income and race affect households’ preferences for LIHTC
proximity. Households in the bottom income quintile are willing to pay 6% of their house
price to live within 0.1 mile from an LIHTC site. For the second quintile the price effects
are essentially zero, but third and fourth quintile households in low-minority areas are
willing to pay about 1.6 percent of their house price to avoid living 0.1 from an LIHTC
site. In high-minority areas 3rd and 4th quintiles have economically insignificant effects.
In low-minority, affluent neighbourhoods subsidised infill development appears to cause
welfare loss, while the opposite is true for lower income areas with higher share of mi-
norities. Does this indicate that building subsidised housing in low-income areas is the
most beneficial strategy? General equilibrium effects are not considered, so it is difficult
to know whether these results provide sufficient understanding of the subject. It may also
be worthwhile to consider whether the overall benefit maximization should be the goal,
12
or if the distribution of additional welfare should play a part. Particular concern is shown
over the outcomes of the most vulnerable in high-poverty areas.
Chetty et al. (2016) study the effects of the Moving to Opportunity program in United
States, which provided randomly chosen families from high-poverty housing projects
vouchers to move to neighbourhoods less affected by poverty. They report substantial
benefits to children who moved to lower-poverty neighbourhoods below the age of 13, in-
cluding higher level of education and a decreased probability of becoming a single parent.
In their mid-twenties, these children had a 31% higher annual income on average relative
to the control group. While acknowledging the significance of these results, Diamond
and McQuade (2019) argue that the monetary benefits of building in higher-income areas
would be offset by substantially larger opportunity cost of having one building less in the
low-income neighbourhood.
13
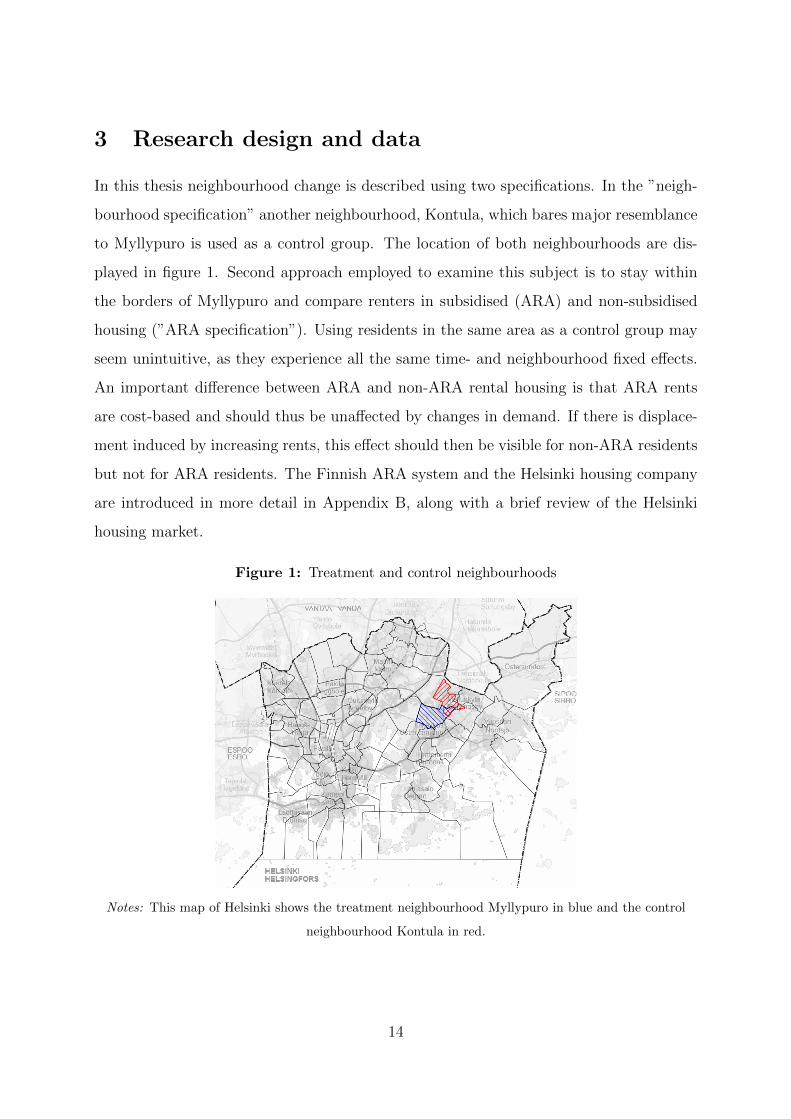
3 Research design and data
In this thesis neighbourhood change is described using two specifications. In the ”neigh-
bourhood specification” another neighbourhood, Kontula, which bares major resemblance
to Myllypuro is used as a control group. The location of both neighbourhoods are dis-
played in figure 1. Second approach employed to examine this subject is to stay within
the borders of Myllypuro and compare renters in subsidised (ARA) and non-subsidised
housing (”ARA specification”). Using residents in the same area as a control group may
seem unintuitive, as they experience all the same time- and neighbourhood fixed effects.
An important difference between ARA and non-ARA rental housing is that ARA rents
are cost-based and should thus be unaffected by changes in demand. If there is displace-
ment induced by increasing rents, this effect should then be visible for non-ARA residents
but not for ARA residents. The Finnish ARA system and the Helsinki housing company
are introduced in more detail in Appendix B, along with a brief review of the Helsinki
housing market.
Figure 1: Treatment and control neighbourhoods
Notes: This map of Helsinki shows the treatment neighbourhood Myllypuro in blue and the control
neighbourhood Kontula in red.
14
In both specifications at least 20 years old residents of multistorey apartment buildings
are considered. The outcomes of interest are the evolution of mean disposable income
and characteristics of movers into and out of the neighbourhood. For the neighbourhood
specification, income structure of residents is examined and the mechanism behind neigh-
bourhood change is discussed in detail with emphasis on the role of infill development and
inmovers. ARA specification focuses on the displacement effect, which is proxied by the
share of low-income movers who move out of Myllypuro and into one with a lower mean
disposable income than Myllypuro.
3.1 Neighbourhood characteristics and descriptive statistics
Myllypuro is a typical Finnish suburb in eastern Helsinki built in 1960s with ample space
and plenty of multistorey apartments. Like many other similar neighbourhoods, there
has been little renewal after it was first built, and it has depreciated over time in both
physical condition and reputation. This deterioration had become apparent at the turn
of the century. Services were declining, and the old mall was outdated and disreputable.
According to Nieminen (2020), the already poor reputation of Myllypuro may have fur-
ther suffered by an incident in 1998, when soil in an area built on an old landfill was
found to be contaminated. This caused a potential health hazard for the residents who
were evacuated and eventually all 11 multistorey buildings in the area were dismantled.
Since 1997, Myllypuro has been target of several urban revitalisation projects, including
EU-funded Urban I and Urban II. These projects focused on improving the reputation
of notorious suburbs by increasing general neighbourhood attractiveness. The neighbour-
hood change in Myllypuro began to pick up speed with completion of several public
construction projects over two decades. These include new sports complex Liikuntamylly
which was opened in 2000, construction of a new health station (finished in 2012), cam-
pus for the University of applied sciences Metropolia (first part finished in 2019) and the
reconstruction of the central city block. Renewed city block consists of a new shopping
mall and residential housing around and above it. Construction lasted from 2009 to 2012.
This time period is also the treatment period of this study, since that is when the most
15
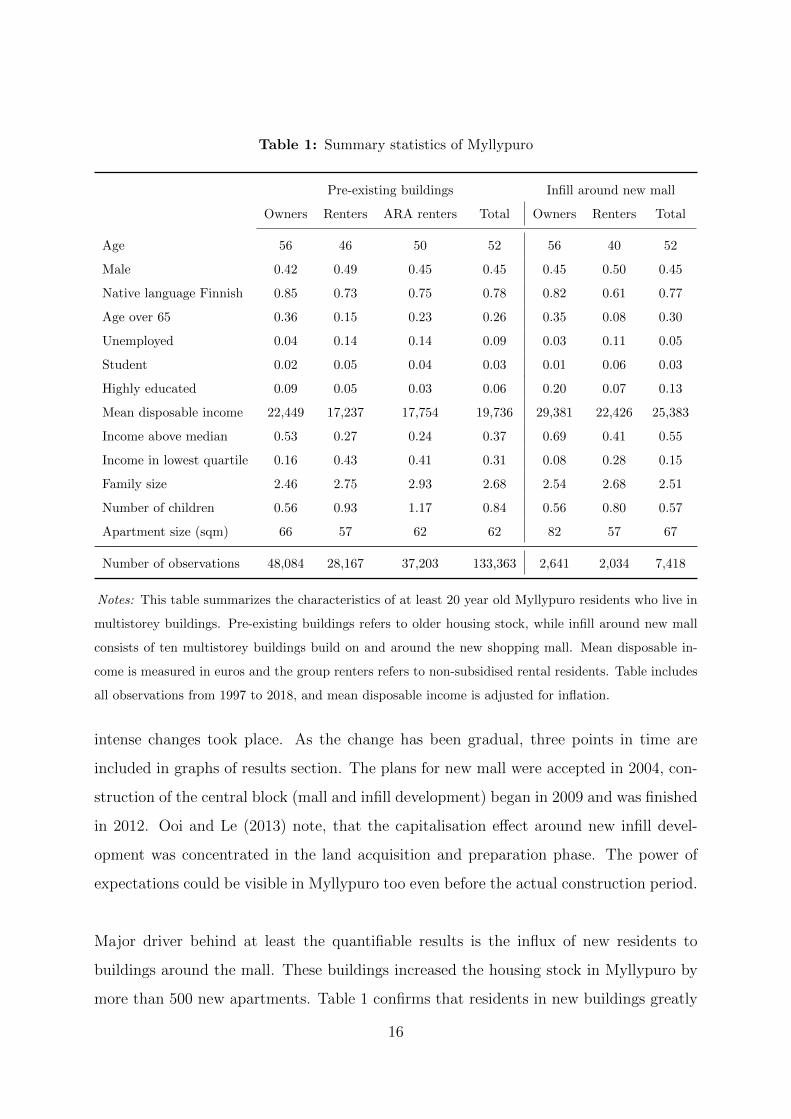
Table 1: Summary statistics of Myllypuro
Pre-existing buildings Infill around new mall
Owners Renters ARA renters Total Owners Renters Total
Age 56 46 50 52 56 40 52
Male 0.42 0.49 0.45 0.45 0.45 0.50 0.45
Native language Finnish 0.85 0.73 0.75 0.78 0.82 0.61 0.77
Age over 65 0.36 0.15 0.23 0.26 0.35 0.08 0.30
Unemployed 0.04 0.14 0.14 0.09 0.03 0.11 0.05
Student 0.02 0.05 0.04 0.03 0.01 0.06 0.03
Highly educated 0.09 0.05 0.03 0.06 0.20 0.07 0.13
Mean disposable income 22,449 17,237 17,754 19,736 29,381 22,426 25,383
Income above median 0.53 0.27 0.24 0.37 0.69 0.41 0.55
Income in lowest quartile 0.16 0.43 0.41 0.31 0.08 0.28 0.15
Family size 2.46 2.75 2.93 2.68 2.54 2.68 2.51
Number of children 0.56 0.93 1.17 0.84 0.56 0.80 0.57
Apartment size (sqm) 66 57 62 62 82 57 67
Number of observations 48,084 28,167 37,203 133,363 2,641 2,034 7,418
Notes: This table summarizes the characteristics of at least 20 year old Myllypuro residents who live in
multistorey buildings. Pre-existing buildings refers to older housing stock, while infill around new mall
consists of ten multistorey buildings build on and around the new shopping mall. Mean disposable in-
come is measured in euros and the group renters refers to non-subsidised rental residents. Table includes
all observations from 1997 to 2018, and mean disposable income is adjusted for inflation.
intense changes took place. As the change has been gradual, three points in time are
included in graphs of results section. The plans for new mall were accepted in 2004, con-
struction of the central block (mall and infill development) began in 2009 and was finished
in 2012. Ooi and Le (2013) note, that the capitalisation effect around new infill devel-
opment was concentrated in the land acquisition and preparation phase. The power of
expectations could be visible in Myllypuro too even before the actual construction period.
Major driver behind at least the quantifiable results is the influx of new residents to
buildings around the mall. These buildings increased the housing stock in Myllypuro by
more than 500 new apartments. Table 1 confirms that residents in new buildings greatly
16
differ from incumbent residents. They have a much higher disposable income than in pre-
existing buildings: 25,383 euros to 19,736. They are also less likely to be unemployed or
belong to the lowest income quartile. Share of highly educated is more twice as much. New
apartments are also larger. Owners in new buildings have on average 82 square meters,
but only 66 in older buildings. This radical difference in the socioeconomic composition
of residents is an essential element in the mechanism that could possibly lead to displace-
ment of low-income residents. Construction of housing that is of higher quality than the
buildings around it tends to attract a larger share of more affluent residents. Increased
neighbourhood attractiveness in the form of good quality housing and the purchasing
power of higher-income residents could translate into increased services and increase in
affluent people who are willing to move into the area. These improvements are captured
by the value of housing, inducing increases in prices. Eventually, these price increases are
translated into increases in rent as well, which might force low-income households out of
their apartments.
For majority of the observation period, Kontula appears to evolve in a highly similar
way as Myllypuro. Built in the same decade and similarly depreciated, they also have
adjacent subway stations and are located side by side. Both have been part of same urban
revitalisation projects since the 1990s, and there has been little infill development in either
one after the initial construction (see figures A1 and A2 of the appendix). While Myl-
lypuro has been a target of several influential construction projects for the past decade,
hope of such improvements have remained out of reach for the residents of Kontula.
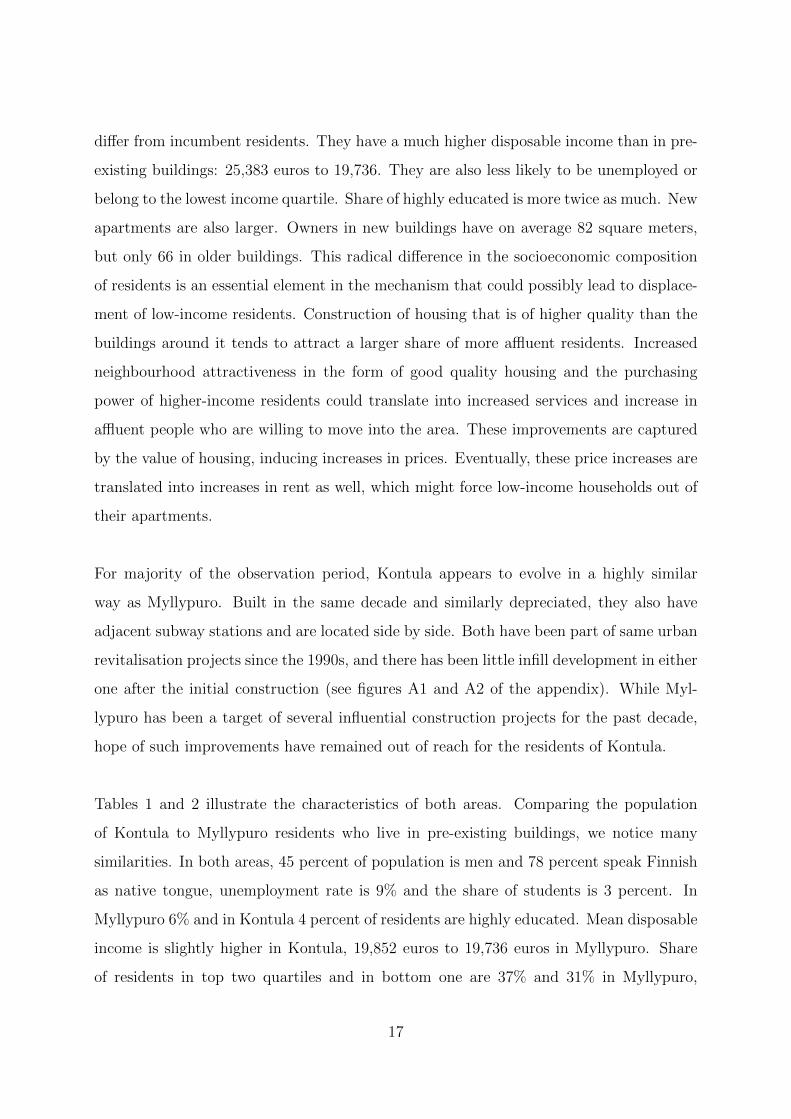
Tables 1 and 2 illustrate the characteristics of both areas. Comparing the population
of Kontula to Myllypuro residents who live in pre-existing buildings, we notice many
similarities. In both areas, 45 percent of population is men and 78 percent speak Finnish
as native tongue, unemployment rate is 9% and the share of students is 3 percent. In
Myllypuro 6% and in Kontula 4 percent of residents are highly educated. Mean disposable
income is slightly higher in Kontula, 19,852 euros to 19,736 euros in Myllypuro. Share
of residents in top two quartiles and in bottom one are 37% and 31% in Myllypuro,
17
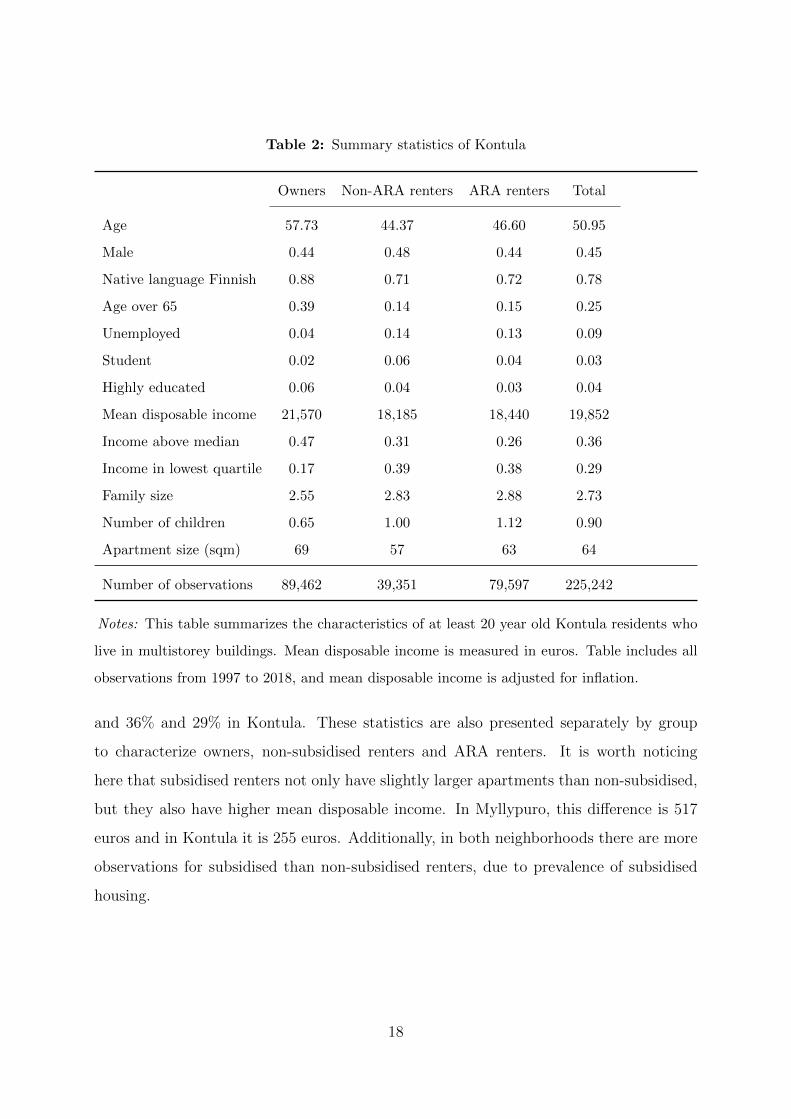
Table 2: Summary statistics of Kontula
Owners Non-ARA renters ARA renters Total
Age 57.73 44.37 46.60 50.95
Male 0.44 0.48 0.44 0.45
Native language Finnish 0.88 0.71 0.72 0.78
Age over 65 0.39 0.14 0.15 0.25
Unemployed 0.04 0.14 0.13 0.09
Student 0.02 0.06 0.04 0.03
Highly educated 0.06 0.04 0.03 0.04
Mean disposable income 21,570 18,185 18,440 19,852
Income above median 0.47 0.31 0.26 0.36
Income in lowest quartile 0.17 0.39 0.38 0.29
Family size 2.55 2.83 2.88 2.73
Number of children 0.65 1.00 1.12 0.90
Apartment size (sqm) 69 57 63 64
Number of observations 89,462 39,351 79,597 225,242
Notes: This table summarizes the characteristics of at least 20 year old Kontula residents who
live in multistorey buildings. Mean disposable income is measured in euros. Table includes all
observations from 1997 to 2018, and mean disposable income is adjusted for inflation.
and 36% and 29% in Kontula. These statistics are also presented separately by group
to characterize owners, non-subsidised renters and ARA renters. It is worth noticing
here that subsidised renters not only have slightly larger apartments than non-subsidised,
but they also have higher mean disposable income. In Myllypuro, this difference is 517
euros and in Kontula it is 255 euros. Additionally, in both neighborhoods there are more
observations for subsidised than non-subsidised renters, due to prevalence of subsidised
housing.
18
3.2 Data
This thesis employs a dataset that is a combination of data on individual and build-
ing characteristics, exact geographic locations, and information on subsidised housing.
Individual and building characteristics come from Statistics Finland’s confidential Folk
database which includes variables for the most important socioeconomic characteristics,
collected annually at the end of the year. Exact geographic locations for multistorey
residents allows matching of individuals to specific buildings. Additionally, information
on subsidised housing allows for identification of residents living in subsidised apartments.
Figure 2: Multistories in Myllypuro
Notes: This figure displays the buildings in Myllypuro that are included in analysis. Infill development
around the new mall is in blue. Dismantled buildings built on toxic landfill are displayed in yellow and
the buildings where the building identifier was changed are displayed in green.
To create indicators for moves in and out of the neighbourhoods, all residents who lived
in Myllypuro postal code at any time between 1995 to 2019 are identified. Then a panel
dataset of their locations, socioeconomic characteristics and moves for each year is con-
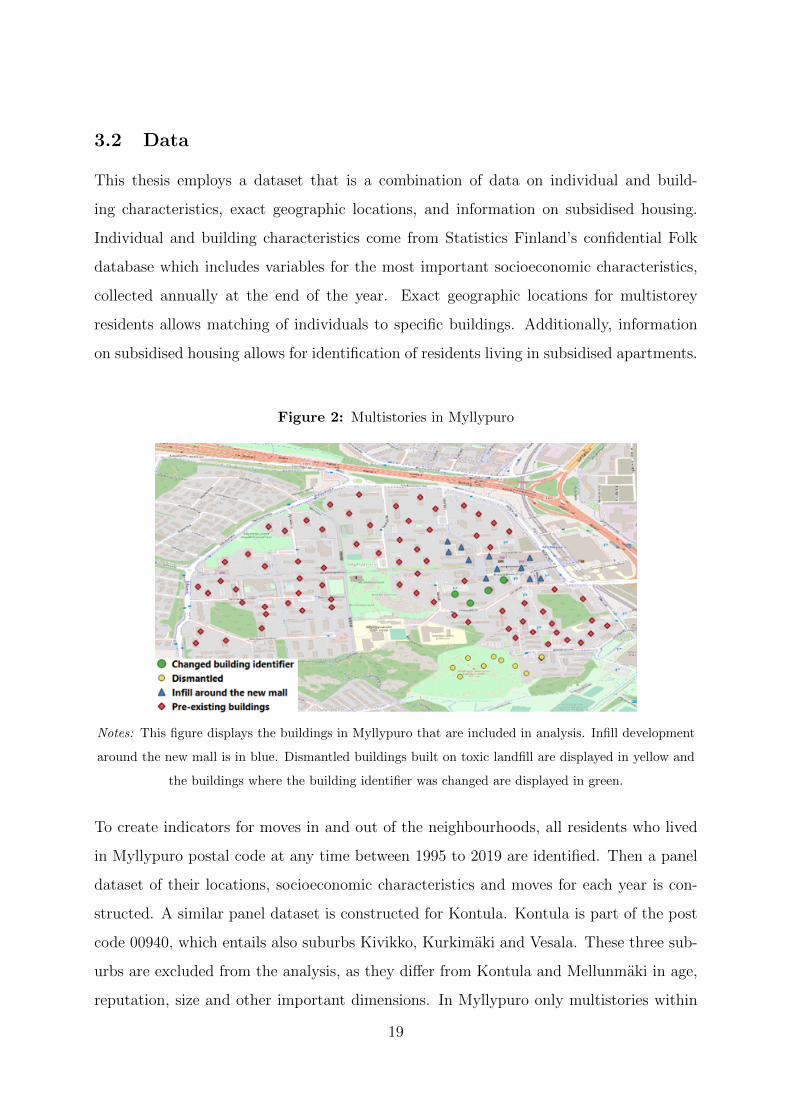
structed. A similar panel dataset is constructed for Kontula. Kontula is part of the post
code 00940, which entails also suburbs Kivikko, Kurkimaki and Vesala. These three sub-
urbs are excluded from the analysis, as they differ from Kontula and Mellunmaki in age,
reputation, size and other important dimensions. In Myllypuro only multistories within
19
1 kilometer from the mall are considered, and the eleven multistories built on the toxic
landfill that were dismantled between 1999 and 2004 are excluded from the analysis of
moving rates. Additionally, the building number of four buildings changes in 2005, so the
movers of these buildings for this year are excluded as well.
Figure 3: Residential multistory buildings in Kontula
Notes: This figure displays the buildings in Kontula that are included in the analysis.
Mean disposable income for households is calculated using the OECD equivalence scale.
A value of 1 is assigned to the head of the household, 0.7 to each additional adult and kids
who are at least 14 years old and 0.5 to each child under 14. Total income is then divided
by these weights. All adult residents in Helsinki are divided into income quartiles using
this measure. All postal codes with a lower mean disposable income than Myllypuro
are identified for each year. Employing these variables on the relative income level of
individuals and post codes, it is possible to identify low-income residents who move to
even lower income areas, which may be considered as a proxy for displacement.
20
4 Results
This section contains the descriptive analysis on the neighbourhood change and potential
displacement. The first section covers the neighbourhood specification, aiming to under-
stand the mechanism behind the socioeconomic change in Myllypuro. Second section is
focused on the displacement effect, which is investigated in the ARA specification. Par-
ticularly in the second part, the numbers of observations are rather low and vary by year.
Complete tables of the numbers of observations are included in appendix as tables A1
and A2.
4.1 Neighbourhood specification
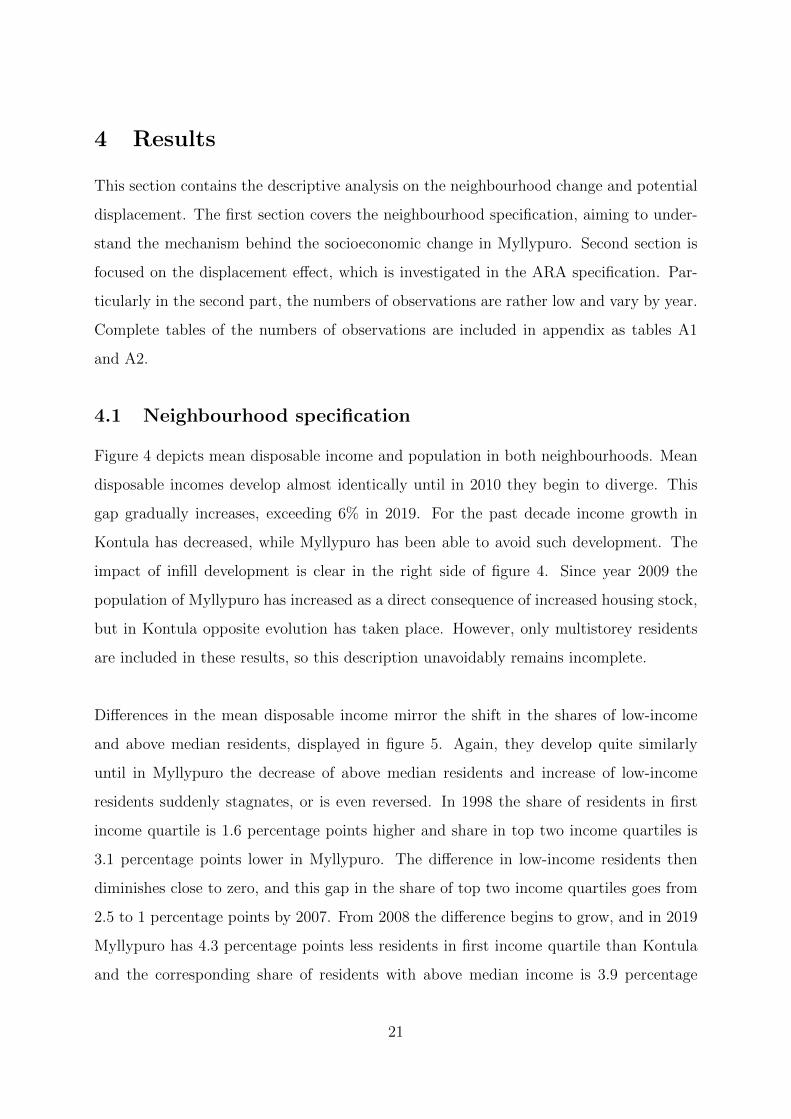
Figure 4 depicts mean disposable income and population in both neighbourhoods. Mean
disposable incomes develop almost identically until in 2010 they begin to diverge. This
gap gradually increases, exceeding 6% in 2019. For the past decade income growth in
Kontula has decreased, while Myllypuro has been able to avoid such development. The
impact of infill development is clear in the right side of figure 4. Since year 2009 the
population of Myllypuro has increased as a direct consequence of increased housing stock,
but in Kontula opposite evolution has taken place. However, only multistorey residents
are included in these results, so this description unavoidably remains incomplete.
Differences in the mean disposable income mirror the shift in the shares of low-income
and above median residents, displayed in figure 5. Again, they develop quite similarly
until in Myllypuro the decrease of above median residents and increase of low-income
residents suddenly stagnates, or is even reversed. In 1998 the share of residents in first
income quartile is 1.6 percentage points higher and share in top two income quartiles is
3.1 percentage points lower in Myllypuro. The difference in low-income residents then
diminishes close to zero, and this gap in the share of top two income quartiles goes from
2.5 to 1 percentage points by 2007. From 2008 the difference begins to grow, and in 2019
Myllypuro has 4.3 percentage points less residents in first income quartile than Kontula
and the corresponding share of residents with above median income is 3.9 percentage
21
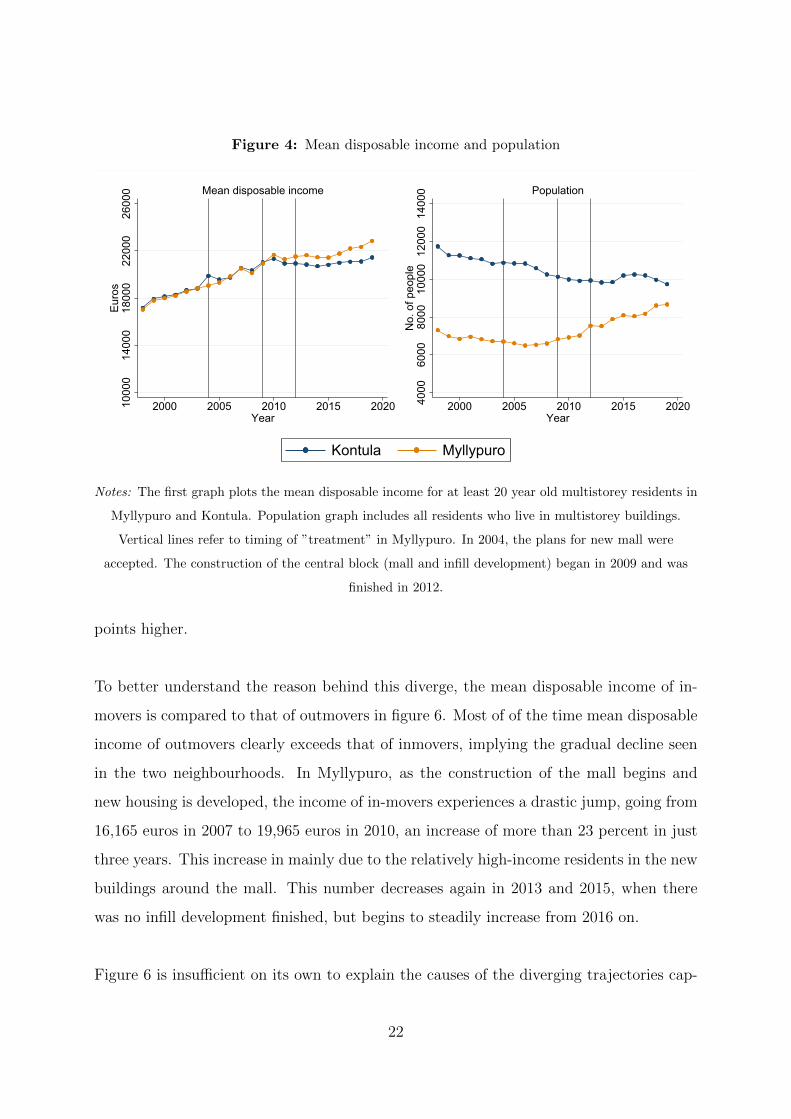
Figure 4: Mean disposable income and population
1000
014
000
1800
022
000
2600
0Eu
ros
2000 2005 2010 2015 2020Year
Mean disposable income
4000
6000
8000
1000
012
000
1400
0N
o. o
f peo
ple
2000 2005 2010 2015 2020Year
Population
Kontula Myllypuro
Notes: The first graph plots the mean disposable income for at least 20 year old multistorey residents in
Myllypuro and Kontula. Population graph includes all residents who live in multistorey buildings.
Vertical lines refer to timing of ”treatment” in Myllypuro. In 2004, the plans for new mall were
accepted. The construction of the central block (mall and infill development) began in 2009 and was
finished in 2012.
points higher.
To better understand the reason behind this diverge, the mean disposable income of in-
movers is compared to that of outmovers in figure 6. Most of of the time mean disposable
income of outmovers clearly exceeds that of inmovers, implying the gradual decline seen
in the two neighbourhoods. In Myllypuro, as the construction of the mall begins and
new housing is developed, the income of in-movers experiences a drastic jump, going from
16,165 euros in 2007 to 19,965 euros in 2010, an increase of more than 23 percent in just
three years. This increase in mainly due to the relatively high-income residents in the new
buildings around the mall. This number decreases again in 2013 and 2015, when there
was no infill development finished, but begins to steadily increase from 2016 on.
Figure 6 is insufficient on its own to explain the causes of the diverging trajectories cap-
22
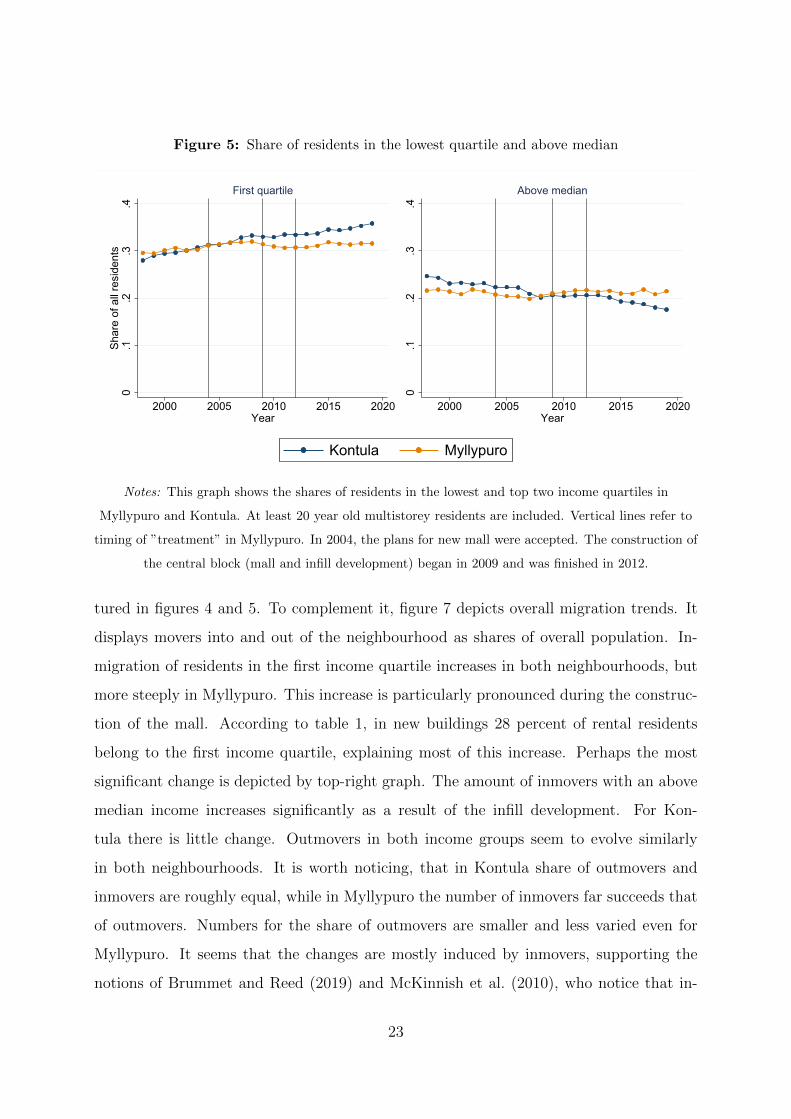
Figure 5: Share of residents in the lowest quartile and above median
0.1
.2.3
.4Sh
are
of a
ll re
side
nts
2000 2005 2010 2015 2020Year
First quartile
0.1
.2.3
.42000 2005 2010 2015 2020
Year
Above median
Kontula Myllypuro
Notes: This graph shows the shares of residents in the lowest and top two income quartiles in
Myllypuro and Kontula. At least 20 year old multistorey residents are included. Vertical lines refer to
timing of ”treatment” in Myllypuro. In 2004, the plans for new mall were accepted. The construction of
the central block (mall and infill development) began in 2009 and was finished in 2012.
tured in figures 4 and 5. To complement it, figure 7 depicts overall migration trends. It
displays movers into and out of the neighbourhood as shares of overall population. In-
migration of residents in the first income quartile increases in both neighbourhoods, but
more steeply in Myllypuro. This increase is particularly pronounced during the construc-
tion of the mall. According to table 1, in new buildings 28 percent of rental residents
belong to the first income quartile, explaining most of this increase. Perhaps the most
significant change is depicted by top-right graph. The amount of inmovers with an above
median income increases significantly as a result of the infill development. For Kon-
tula there is little change. Outmovers in both income groups seem to evolve similarly
in both neighbourhoods. It is worth noticing, that in Kontula share of outmovers and
inmovers are roughly equal, while in Myllypuro the number of inmovers far succeeds that
of outmovers. Numbers for the share of outmovers are smaller and less varied even for
Myllypuro. It seems that the changes are mostly induced by inmovers, supporting the
notions of Brummet and Reed (2019) and McKinnish et al. (2010), who notice that in-
23
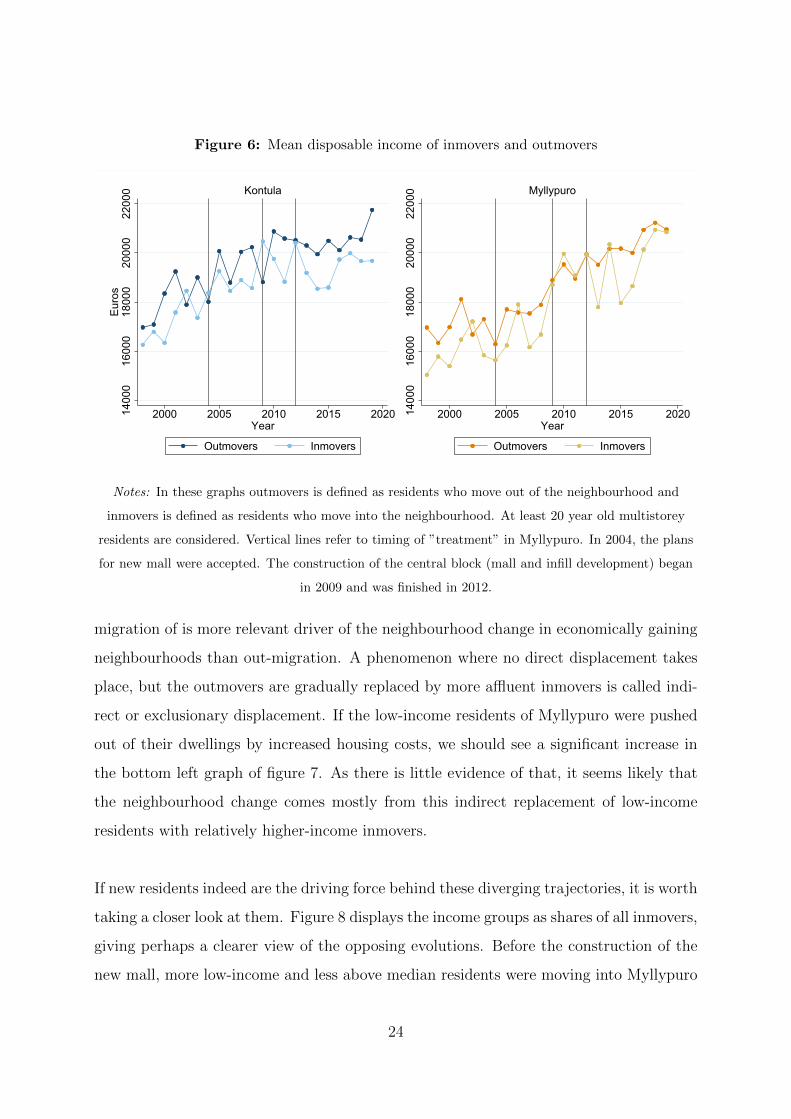
Figure 6: Mean disposable income of inmovers and outmovers
1400
016
000
1800
020
000
2200
0Eu
ros
2000 2005 2010 2015 2020Year
Outmovers Inmovers
Kontula
1400
016
000
1800
020
000
2200
02000 2005 2010 2015 2020
Year
Outmovers Inmovers
Myllypuro
Notes: In these graphs outmovers is defined as residents who move out of the neighbourhood and
inmovers is defined as residents who move into the neighbourhood. At least 20 year old multistorey
residents are considered. Vertical lines refer to timing of ”treatment” in Myllypuro. In 2004, the plans
for new mall were accepted. The construction of the central block (mall and infill development) began
in 2009 and was finished in 2012.
migration of is more relevant driver of the neighbourhood change in economically gaining
neighbourhoods than out-migration. A phenomenon where no direct displacement takes
place, but the outmovers are gradually replaced by more affluent inmovers is called indi-
rect or exclusionary displacement. If the low-income residents of Myllypuro were pushed
out of their dwellings by increased housing costs, we should see a significant increase in
the bottom left graph of figure 7. As there is little evidence of that, it seems likely that
the neighbourhood change comes mostly from this indirect replacement of low-income
residents with relatively higher-income inmovers.
If new residents indeed are the driving force behind these diverging trajectories, it is worth
taking a closer look at them. Figure 8 displays the income groups as shares of all inmovers,
giving perhaps a clearer view of the opposing evolutions. Before the construction of the
new mall, more low-income and less above median residents were moving into Myllypuro
24
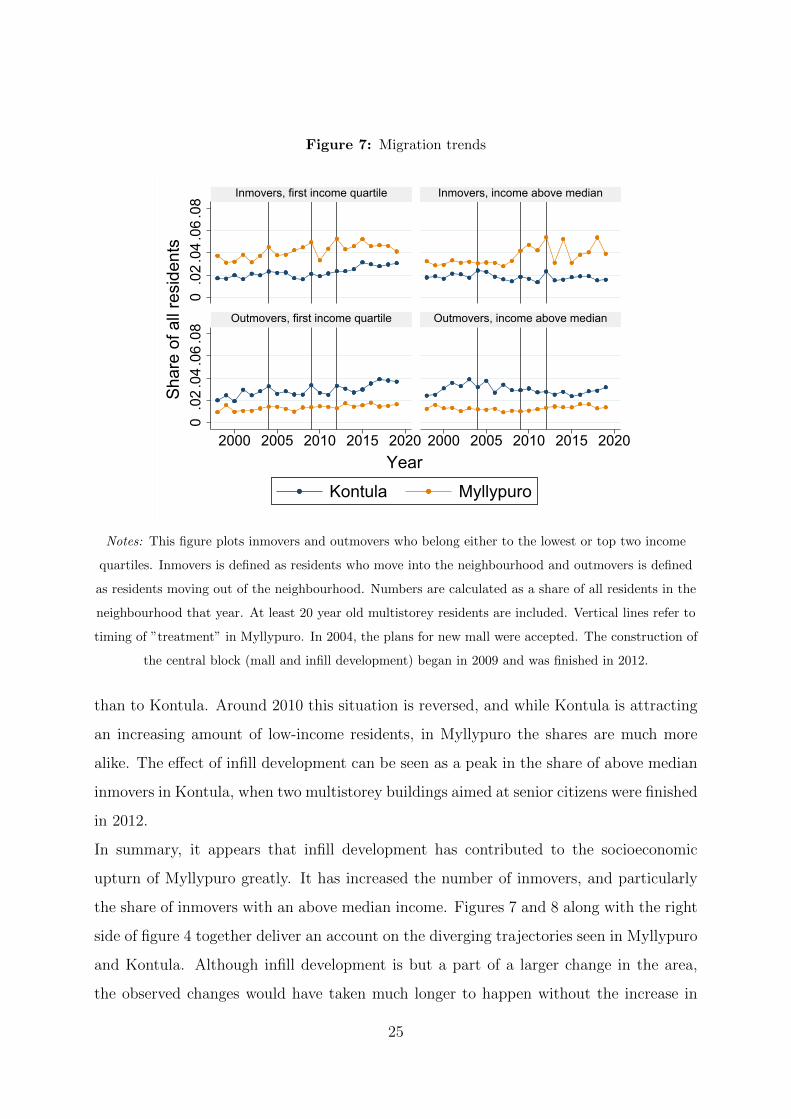
Figure 7: Migration trends
0.0
2.0
4.0
6.0
80
.02
.04
.06
.08
2000 2005 2010 2015 2020 2000 2005 2010 2015 2020
Inmovers, first income quartile Inmovers, income above median
Outmovers, first income quartile Outmovers, income above median
Kontula Myllypuro
Shar
e of
all
resi
dent
s
Year
Notes: This figure plots inmovers and outmovers who belong either to the lowest or top two income
quartiles. Inmovers is defined as residents who move into the neighbourhood and outmovers is defined
as residents moving out of the neighbourhood. Numbers are calculated as a share of all residents in the
neighbourhood that year. At least 20 year old multistorey residents are included. Vertical lines refer to
timing of ”treatment” in Myllypuro. In 2004, the plans for new mall were accepted. The construction of
the central block (mall and infill development) began in 2009 and was finished in 2012.
than to Kontula. Around 2010 this situation is reversed, and while Kontula is attracting
an increasing amount of low-income residents, in Myllypuro the shares are much more
alike. The effect of infill development can be seen as a peak in the share of above median
inmovers in Kontula, when two multistorey buildings aimed at senior citizens were finished
in 2012.
In summary, it appears that infill development has contributed to the socioeconomic
upturn of Myllypuro greatly. It has increased the number of inmovers, and particularly
the share of inmovers with an above median income. Figures 7 and 8 along with the right
side of figure 4 together deliver an account on the diverging trajectories seen in Myllypuro
and Kontula. Although infill development is but a part of a larger change in the area,
the observed changes would have taken much longer to happen without the increase in
25
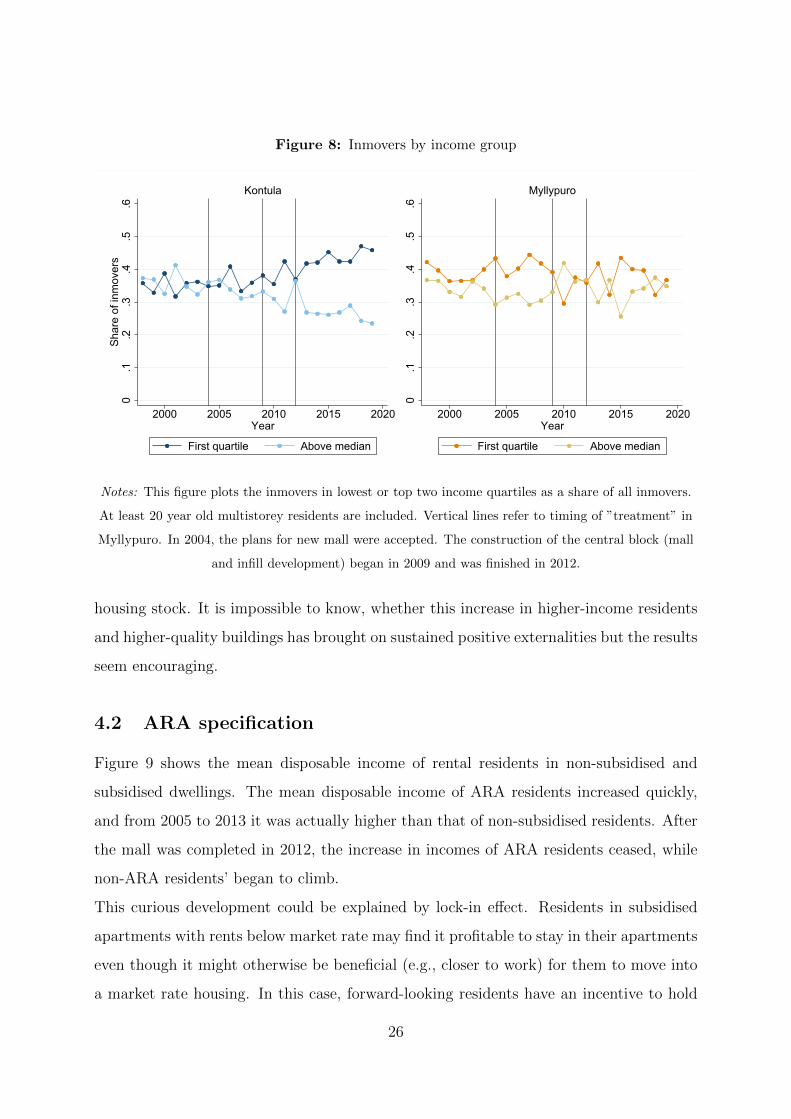
Figure 8: Inmovers by income group
0.1
.2.3
.4.5
.6Sh
are
of in
mov
ers
2000 2005 2010 2015 2020Year
First quartile Above median
Kontula
0.1
.2.3
.4.5
.62000 2005 2010 2015 2020
Year
First quartile Above median
Myllypuro
Notes: This figure plots the inmovers in lowest or top two income quartiles as a share of all inmovers.
At least 20 year old multistorey residents are included. Vertical lines refer to timing of ”treatment” in
Myllypuro. In 2004, the plans for new mall were accepted. The construction of the central block (mall
and infill development) began in 2009 and was finished in 2012.
housing stock. It is impossible to know, whether this increase in higher-income residents
and higher-quality buildings has brought on sustained positive externalities but the results
seem encouraging.
4.2 ARA specification
Figure 9 shows the mean disposable income of rental residents in non-subsidised and
subsidised dwellings. The mean disposable income of ARA residents increased quickly,
and from 2005 to 2013 it was actually higher than that of non-subsidised residents. After
the mall was completed in 2012, the increase in incomes of ARA residents ceased, while
non-ARA residents’ began to climb.
This curious development could be explained by lock-in effect. Residents in subsidised
apartments with rents below market rate may find it profitable to stay in their apartments
even though it might otherwise be beneficial (e.g., closer to work) for them to move into
a market rate housing. In this case, forward-looking residents have an incentive to hold
26
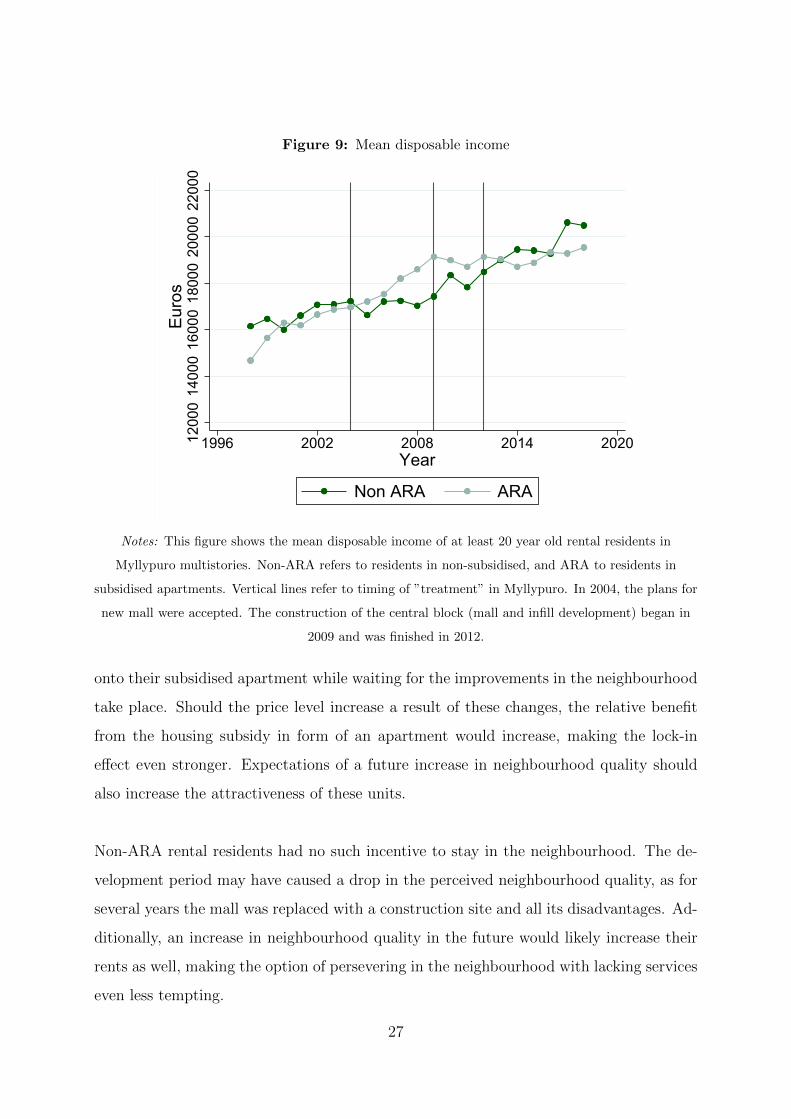
Figure 9: Mean disposable income
1200
014
000
1600
018
000
2000
022
000
Euro
s
1996 2002 2008 2014 2020Year
Non ARA ARA
Notes: This figure shows the mean disposable income of at least 20 year old rental residents in
Myllypuro multistories. Non-ARA refers to residents in non-subsidised, and ARA to residents in
subsidised apartments. Vertical lines refer to timing of ”treatment” in Myllypuro. In 2004, the plans for
new mall were accepted. The construction of the central block (mall and infill development) began in
2009 and was finished in 2012.
onto their subsidised apartment while waiting for the improvements in the neighbourhood
take place. Should the price level increase a result of these changes, the relative benefit
from the housing subsidy in form of an apartment would increase, making the lock-in
effect even stronger. Expectations of a future increase in neighbourhood quality should
also increase the attractiveness of these units.
Non-ARA rental residents had no such incentive to stay in the neighbourhood. The de-
velopment period may have caused a drop in the perceived neighbourhood quality, as for
several years the mall was replaced with a construction site and all its disadvantages. Ad-
ditionally, an increase in neighbourhood quality in the future would likely increase their
rents as well, making the option of persevering in the neighbourhood with lacking services
even less tempting.
27
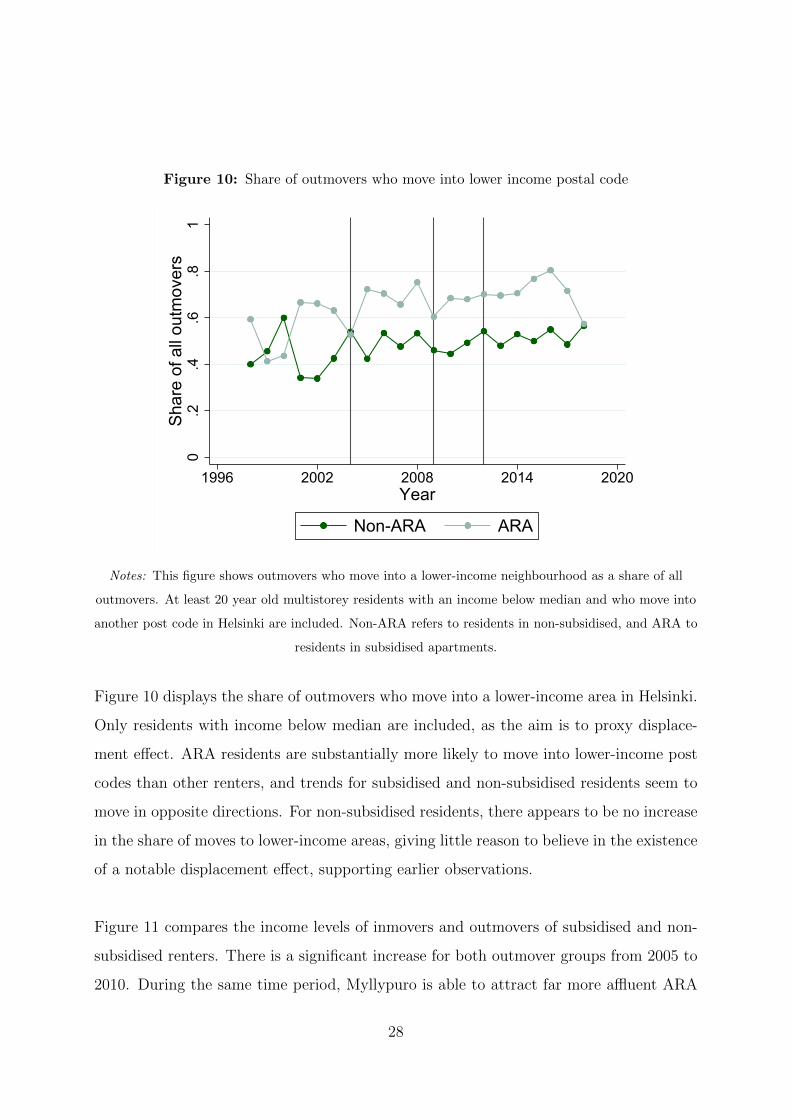
Figure 10: Share of outmovers who move into lower income postal code0
.2.4
.6.8
1Sh
are
of a
ll ou
tmov
ers
1996 2002 2008 2014 2020Year
Non-ARA ARA
Notes: This figure shows outmovers who move into a lower-income neighbourhood as a share of all
outmovers. At least 20 year old multistorey residents with an income below median and who move into
another post code in Helsinki are included. Non-ARA refers to residents in non-subsidised, and ARA to
residents in subsidised apartments.
Figure 10 displays the share of outmovers who move into a lower-income area in Helsinki.
Only residents with income below median are included, as the aim is to proxy displace-
ment effect. ARA residents are substantially more likely to move into lower-income post
codes than other renters, and trends for subsidised and non-subsidised residents seem to
move in opposite directions. For non-subsidised residents, there appears to be no increase
in the share of moves to lower-income areas, giving little reason to believe in the existence
of a notable displacement effect, supporting earlier observations.
Figure 11 compares the income levels of inmovers and outmovers of subsidised and non-
subsidised renters. There is a significant increase for both outmover groups from 2005 to
2010. During the same time period, Myllypuro is able to attract far more affluent ARA
28
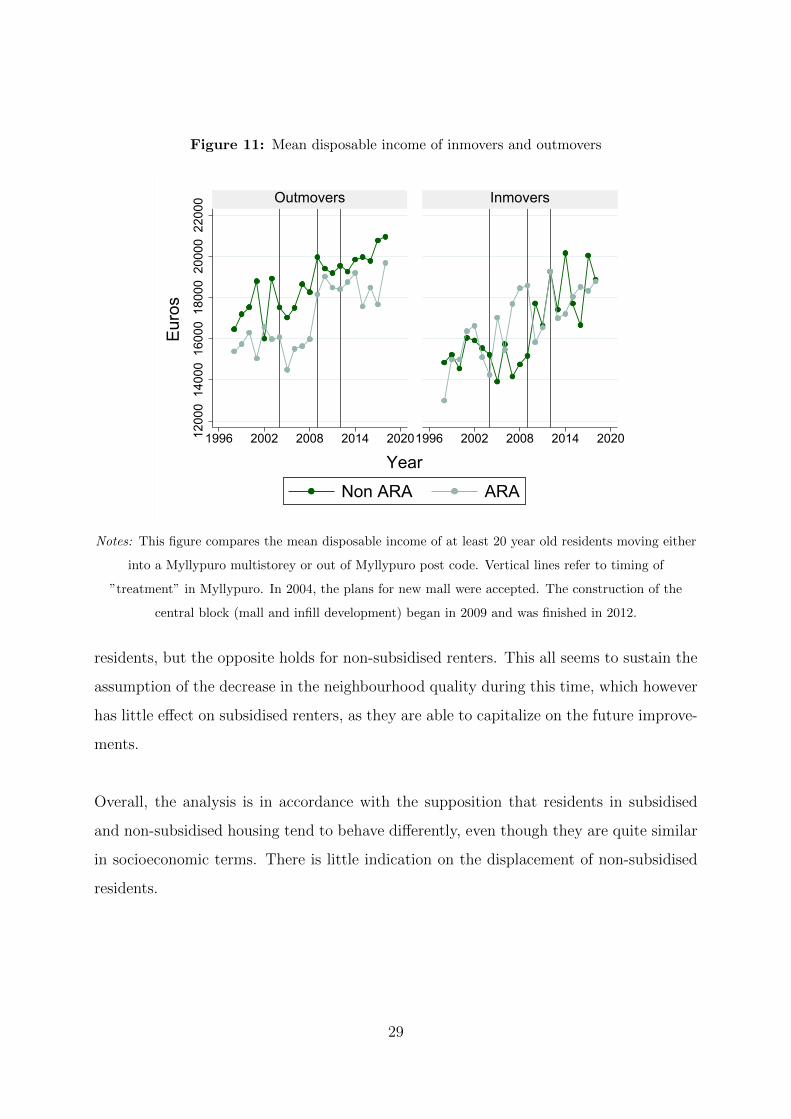
Figure 11: Mean disposable income of inmovers and outmovers
1200
014
000
1600
018
000
2000
022
000
1996 2002 2008 2014 20201996 2002 2008 2014 2020
Outmovers Inmovers
Non ARA ARA
Euro
s
Year
Notes: This figure compares the mean disposable income of at least 20 year old residents moving either
into a Myllypuro multistorey or out of Myllypuro post code. Vertical lines refer to timing of
”treatment” in Myllypuro. In 2004, the plans for new mall were accepted. The construction of the
central block (mall and infill development) began in 2009 and was finished in 2012.
residents, but the opposite holds for non-subsidised renters. This all seems to sustain the
assumption of the decrease in the neighbourhood quality during this time, which however
has little effect on subsidised renters, as they are able to capitalize on the future improve-
ments.
Overall, the analysis is in accordance with the supposition that residents in subsidised
and non-subsidised housing tend to behave differently, even though they are quite similar
in socioeconomic terms. There is little indication on the displacement of non-subsidised
residents.
29
5 Conclusions
As Helsinki is emphasizing the importance of infill development and increased density to
keep the city vibrant, enjoyable, and affordable while accommodating a large number of
new residents, it is important to understand their effects as well as possible. This thesis
contributes to this goal by investigating the effects of infill development and urban re-
newal on neighbourhood change and potential displacement in Myllypuro.
The descriptive analysis supports the main findings from the literature. New infill devel-
opment has increased the number of relatively more affluent in-migrants, inducing positive
externalities that affect the entire neighbourhood. Even though the housing prices and
general neighbourhood quality have increased, displacement effect appears to be small or
insignificant. However, Myllypuro is still going through this change and rents may adjust
more slowly than apartment prices, making this thesis inconclusive in long term.
For the first 10 years of the observation period both Myllypuro and Kontula were ex-
periencing a rapid structural change where the share of above median residents was de-
creasing and the share of low-income residents increasing. In Myllypuro this development
was seized or even reversed, but Kontula has remained on the same trajectory. It seems
likely that a large part of this difference can be contributed to the urban renewal process
that has taken place in Myllypuro. In addition to tangible improvements, Myllypuro has
been able to transform its reputation, from a notorious low-income suburb into a role
model of urban renewal.
30
References
Ahlfeldt, G.M., Maennig, W., Richter, F.J., 2017. Urban renewal after the berlin wall: a
place-based policy evaluation. Journal of Economic Geography 17, 129–156.
Ahvenniemi, H., Pennanen, K., Knuuti, A., Arvola, A., Viitanen, K., 2018. Impact of
infill development on prices of existing apartments in finnish urban neighbourhoods.
International Journal of strategic property management 22, 157–167.
Asquith, B.J., Mast, E., Reed, D., 2021. Local effects of large new apartment buildings
in low-income areas. The Review of Economics and Statistics , 1–46.
Autor, D.H., Palmer, C.J., Pathak, P.A., 2014. Housing market spillovers: Evidence from
the end of rent control in cambridge, massachusetts. Journal of Political Economy 122,
661–717.
Brummet, Q., Reed, D., 2019. The effects of gentrification on the well-being and oppor-
tunity of original resident adults and children .
Chetty, R., Hendren, N., Katz, L.F., 2016. The effects of exposure to better neighborhoods
on children: New evidence from the moving to opportunity experiment. American
Economic Review 106, 855–902.
City of Helsinki, . Asumisen ja siihen liittyvan maankayton toteutusohjelma. URL:
https://www.hel.fi/static/kanslia /Julkaisut /KotikaupunkinaHelsinki
/2020/ Asumisen ja maankayton ohjelma 2020.pdf.
Diamond, R., McQuade, T., 2019. Who wants affordable housing in their backyard? an
equilibrium analysis of low-income property development. Journal of Political Economy
127, 1063–1117.
Eerola, E., Saarimaa, T., 2018. Delivering affordable housing and neighborhood quality:
A comparison of place-and tenant-based programs. Journal of Housing Economics 42,
44–54.
31
Ellen, I.G., O’Regan, K.M., 2011. How low income neighborhoods change: Entry, exit,
and enhancement. Regional Science and Urban Economics 41, 89–97.
Freeman, L., 2005. Displacement or succession? residential mobility in gentrifying neigh-
borhoods. Urban Affairs Review 40, 463–491.
Kallio, P., 2019. The spillover effect of urban renewal on local housing prices: Case
myllypuro .
Kurvinen, A.T., Vihola, J., 2016. The impact of residential development on nearby hous-
ing prices. International Journal of Housing Markets and Analysis .
McConnell, V., Wiley, K., 2010. Infill development: Perspectives and evidence from
economics and planning. Resources for the Future 10, 13.
McKinnish, T., Walsh, R., White, T.K., 2010. Who gentrifies low-income neighborhoods?
Journal of urban economics 67, 180–193.
Nieminen, K., 2020. Myllypuro mullistuu, kontula odottaa uutta nousua vertaileva
tutkimus kahden lahion maineen rakentumisesta sanomalehdessa vuosien 2000 ja 2017
valisena aikana .
Oikarinen, E., Peltola, R., Valtonen, E., 2015. Regional variation in the elasticity of
supply of housing, and its determinants: The case of a small sparsely populated country.
Regional Science and Urban Economics 50, 18–30.
Ooi, J.T., Le, T.T., 2013. The spillover effects of infill developments on local housing
prices. Regional Science and Urban Economics 43, 850–861.
Pennington, K., 2021. Does building new housing cause displacement?: The supply and
demand effects of construction in san francisco .
Rosenthal, S.S., 2008. Old homes, externalities, and poor neighborhoods. a model of
urban decline and renewal. Journal of urban Economics 63, 816–840.
Rossi-Hansberg, E., Sarte, P.D., Owens III, R., 2010. Housing externalities. Journal of
political Economy 118, 485–535.
32
Sims, D.P., 2007. Out of control: What can we learn from the end of massachusetts rent
control? Journal of Urban Economics 61, 129–151.
Vilkama, K., Ahola, S., Vaattovaara, M., 2016. Valttelya vai vetovoimaa.
Asuinympariston vaikutus asuinalueilla viihtymiseen ja muuttopaatoksiin
paakaupunkiseudulla. Helsinki: Helsingin kaupungin tietokeskus .
Zahirovich-Herbert, V., Gibler, K.M., 2014. The effect of new residential construction on
housing prices. Journal of Housing Economics 26, 1–18.
33
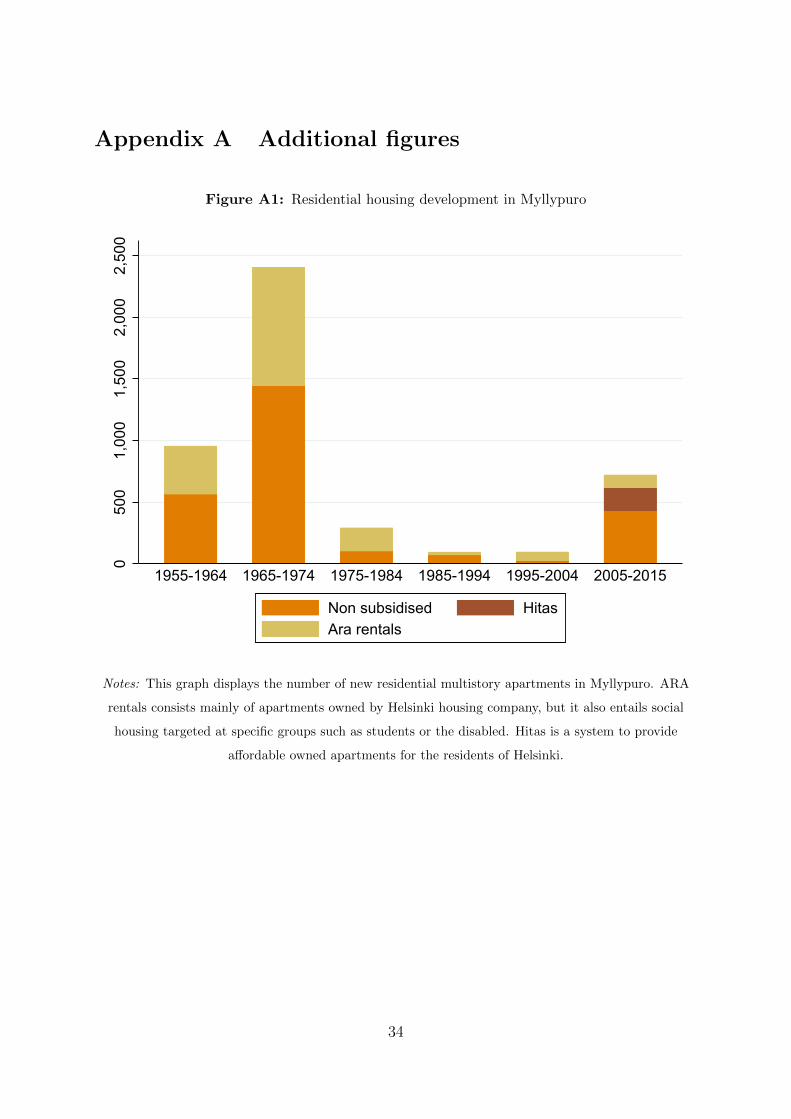
Appendix A Additional figures
Figure A1: Residential housing development in Myllypuro
050
01,
000
1,50
02,
000
2,50
0
1955-1964 1965-1974 1975-1984 1985-1994 1995-2004 2005-2015
Non subsidised HitasAra rentals
Notes: This graph displays the number of new residential multistory apartments in Myllypuro. ARA
rentals consists mainly of apartments owned by Helsinki housing company, but it also entails social
housing targeted at specific groups such as students or the disabled. Hitas is a system to provide
affordable owned apartments for the residents of Helsinki.
34
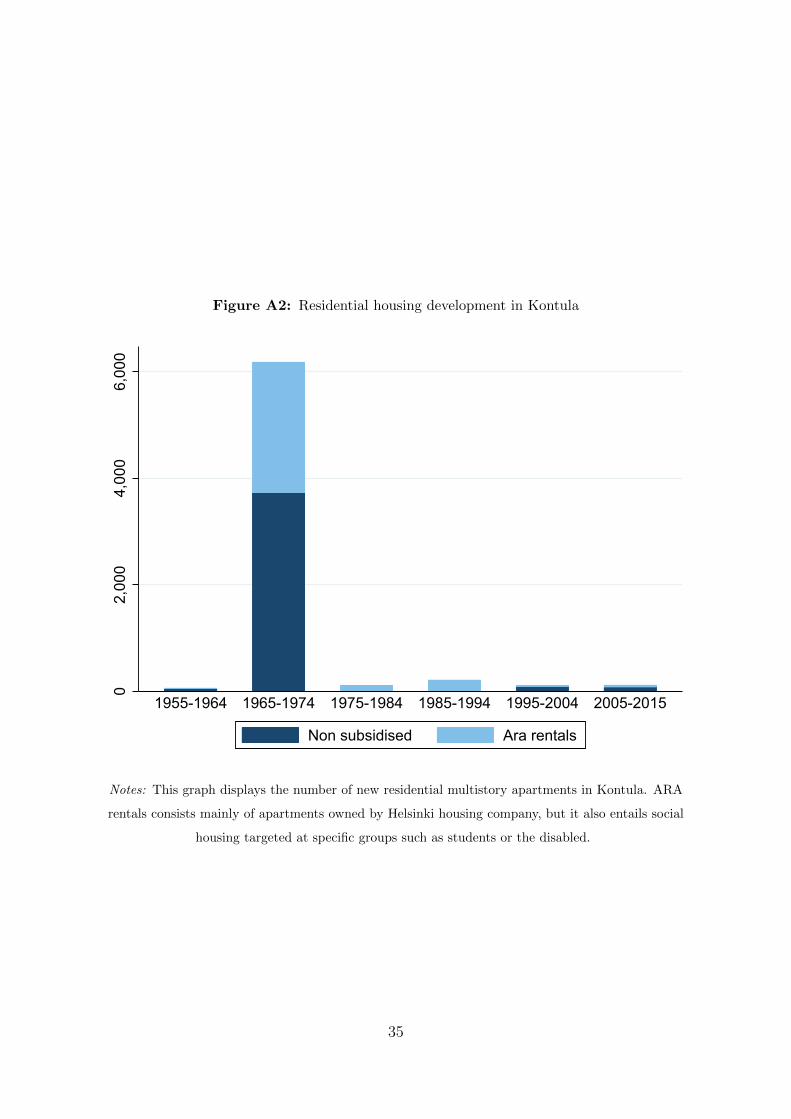
Figure A2: Residential housing development in Kontula
02,
000
4,00
06,
000
1955-1964 1965-1974 1975-1984 1985-1994 1995-2004 2005-2015
Non subsidised Ara rentals
Notes: This graph displays the number of new residential multistory apartments in Kontula. ARA
rentals consists mainly of apartments owned by Helsinki housing company, but it also entails social
housing targeted at specific groups such as students or the disabled.
35
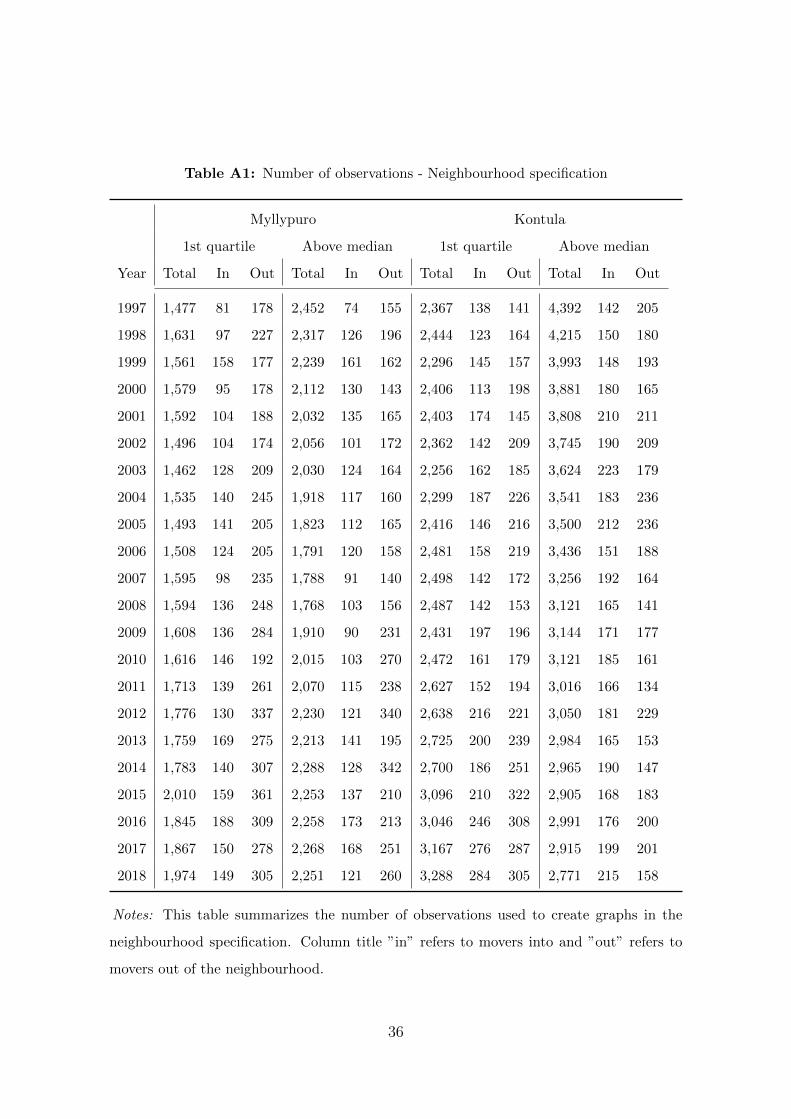
Table A1: Number of observations - Neighbourhood specification
Myllypuro Kontula
1st quartile Above median 1st quartile Above median
Year Total In Out Total In Out Total In Out Total In Out
1997 1,477 81 178 2,452 74 155 2,367 138 141 4,392 142 205
1998 1,631 97 227 2,317 126 196 2,444 123 164 4,215 150 180
1999 1,561 158 177 2,239 161 162 2,296 145 157 3,993 148 193
2000 1,579 95 178 2,112 130 143 2,406 113 198 3,881 180 165
2001 1,592 104 188 2,032 135 165 2,403 174 145 3,808 210 211
2002 1,496 104 174 2,056 101 172 2,362 142 209 3,745 190 209
2003 1,462 128 209 2,030 124 164 2,256 162 185 3,624 223 179
2004 1,535 140 245 1,918 117 160 2,299 187 226 3,541 183 236
2005 1,493 141 205 1,823 112 165 2,416 146 216 3,500 212 236
2006 1,508 124 205 1,791 120 158 2,481 158 219 3,436 151 188
2007 1,595 98 235 1,788 91 140 2,498 142 172 3,256 192 164
2008 1,594 136 248 1,768 103 156 2,487 142 153 3,121 165 141
2009 1,608 136 284 1,910 90 231 2,431 197 196 3,144 171 177
2010 1,616 146 192 2,015 103 270 2,472 161 179 3,121 185 161
2011 1,713 139 261 2,070 115 238 2,627 152 194 3,016 166 134
2012 1,776 130 337 2,230 121 340 2,638 216 221 3,050 181 229
2013 1,759 169 275 2,213 141 195 2,725 200 239 2,984 165 153
2014 1,783 140 307 2,288 128 342 2,700 186 251 2,965 190 147
2015 2,010 159 361 2,253 137 210 3,096 210 322 2,905 168 183
2016 1,845 188 309 2,258 173 213 3,046 246 308 2,991 176 200
2017 1,867 150 278 2,268 168 251 3,167 276 287 2,915 199 201
2018 1,974 149 305 2,251 121 260 3,288 284 305 2,771 215 158
Notes: This table summarizes the number of observations used to create graphs in the
neighbourhood specification. Column title ”in” refers to movers into and ”out” refers to
movers out of the neighbourhood.
36
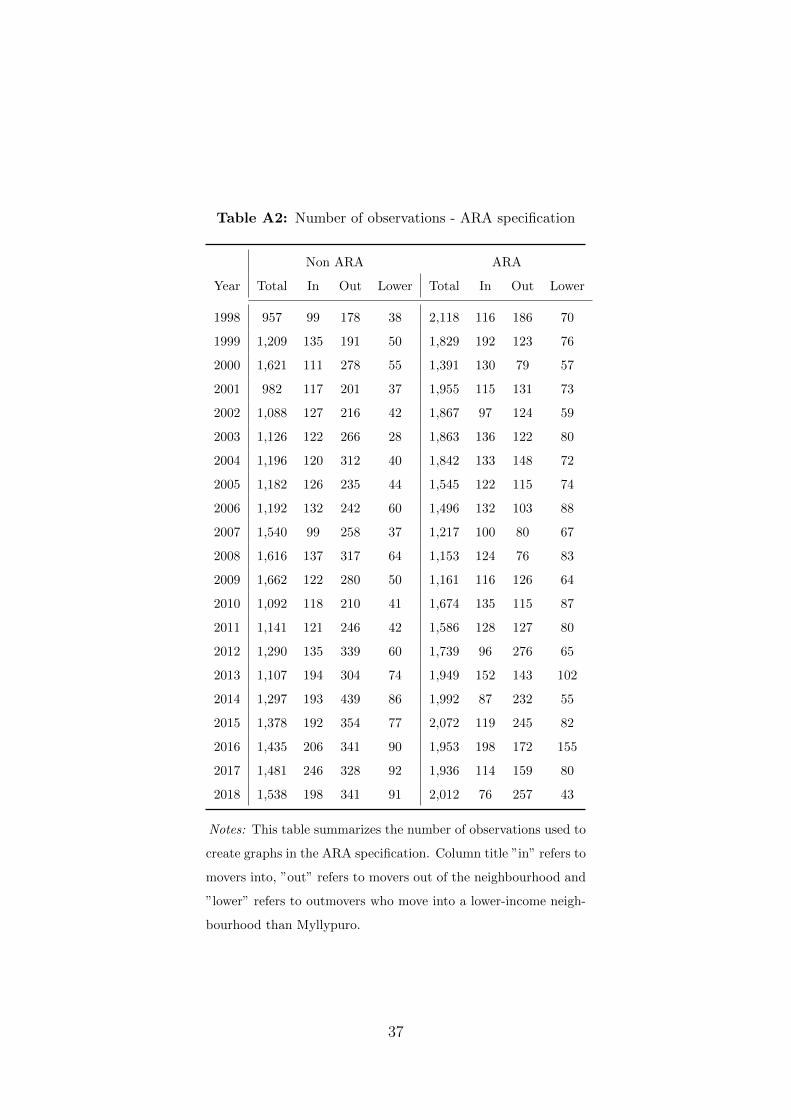
Table A2: Number of observations - ARA specification
Non ARA ARA
Year Total In Out Lower Total In Out Lower
1998 957 99 178 38 2,118 116 186 70
1999 1,209 135 191 50 1,829 192 123 76
2000 1,621 111 278 55 1,391 130 79 57
2001 982 117 201 37 1,955 115 131 73
2002 1,088 127 216 42 1,867 97 124 59
2003 1,126 122 266 28 1,863 136 122 80
2004 1,196 120 312 40 1,842 133 148 72
2005 1,182 126 235 44 1,545 122 115 74
2006 1,192 132 242 60 1,496 132 103 88
2007 1,540 99 258 37 1,217 100 80 67
2008 1,616 137 317 64 1,153 124 76 83
2009 1,662 122 280 50 1,161 116 126 64
2010 1,092 118 210 41 1,674 135 115 87
2011 1,141 121 246 42 1,586 128 127 80
2012 1,290 135 339 60 1,739 96 276 65
2013 1,107 194 304 74 1,949 152 143 102
2014 1,297 193 439 86 1,992 87 232 55
2015 1,378 192 354 77 2,072 119 245 82
2016 1,435 206 341 90 1,953 198 172 155
2017 1,481 246 328 92 1,936 114 159 80
2018 1,538 198 341 91 2,012 76 257 43
Notes: This table summarizes the number of observations used to
create graphs in the ARA specification. Column title ”in” refers to
movers into, ”out” refers to movers out of the neighbourhood and
”lower” refers to outmovers who move into a lower-income neigh-
bourhood than Myllypuro.
37
Appendix B Institutional framework
B.1 Helsinki housing market and city housing policy
Helsinki has stated its goal to become the most functional city in the world. Urban de-
velopment and planning appear to be a subject of pride to the city. The population of
Helsinki has increased rapidly, being 648,043 at the end of 2019 with projections for the
2050 population ranging from 884,000 to 795,000. Rapid population growth tends to pose
some difficult challenges that must be dealt with one way or another.
Long-term city planning in Helsinki is conducted in accordance with the implementa-
tion programme on housing and related land use. This program is prepared every four
years, for each council. I refer to the current program, approved on 11.11.2020 (City of
Helsinki). The most important goals specified here include annual housing production
target, which is 7000 housing units and at least 8000 units from 2023. This is a big
improvement on the subject, since between 2003 and 2018, new construction amounted
to around 3000 apartments per year on average. Environmental aspect is considered as
Helsinki aims for carbon—neutrality by 2035. Housing costs are influenced through in-
creased overall production as well as a construction quota of regulated housing units.
Each goal has certain indicators, which are monitored annually. Suburban generation is
defined as a tool to prevent regional segregation, with a purpose of improving the com-
fort and appeal of residential areas comprehensibly as well as enable high-quality infill
construction. Current target areas for this regeneration are Malminkartano, Kannelmaki,
Malmi and Mellunkyla. Additional objectives mention that homogenous residential areas
should be avoided, and that the share of rental apartments in the housing stock of an
area must not exceed 50% (City of Helsinki). Case for increased housing construction
is justified. As Oikarinen et al. (2015) point out, housing supply in Helsinki is highly
inelastic. This induces price increases and frictions for apartment seekers and may even
limit the possibilities of growth and development. An important tool in accomplishing
the city goals is infill development, which makes up 50 % of annual housing construction
volume in Helsinki.
38
According to Vilkama et al. (2016), spatial aggregation of disadvantaged residents has
increased, and socio-economically segregated areas have increased in size in Helsinki
metropolitan area. Their research shows that increased immigration flows have been
targeted very heavily to some areas, as immigrants tend to locate in areas with already
relatively larger shares of immigrants. Additionally, these areas tend to often be socio-
economically disadvantaged.
B.2 Housing finance and development centre of Finland
The first Finnish housing subsidy system, ARAVA was founded soon after the second
world war in 1949 to provide solutions for the lack of housing supply. As disposition of
sizable tracts of land to Russia was in completion, approximately 400 000 migrants from
Karelia needed new housing within the newly shrunk borders of Finland. Going through
a couple of changes in name and to some extent, the objective of their action, the insti-
tution now is known as the Housing finance and development centre of Finland or ARA.
ARA ownership is diversified, as it is shared by municipalities, non-profit organisations,
and their subsidiaries. ARA employs steering and monitoring to make sure that the state
subsidies are allocated correctly to residents. Municipalities monitor rents and resident
selection, while ARA does the general steering of municipalities and debtors. Approx-
imately third of the Finnish housing stock of 3 million apartments has been built with
ARA state subsidies, with some 380 000 additional apartments renewed. In addition,
ARA provides a body of information on the housing markets and produces their own re-
search on the subject. The central aim is to provide safe and affordable housing conditions
to its residents. Another longer-term goal is to promote diversity of the tenant structure.
B.3 Helsinki city housing company
Subsidised housing makes a big part of overall rental housing in Helsinki. Nearly half
of all rentals (20% of overall housing stock) are part of ARA system. HEKA rents are
approximately one third below market level rents, 13,29 euros per square meter on av-
39
erage. Average rent per square meter in non-subsidised apartments is 21,47 euros in
the fourth quarter of the year 2020. It is impossible to make inference on the observ-
able characteristics of individual subsidised and non-subsidised apartments, so this is not
necessarily a valid comparison. ARA buildings are predominantly located in low-income
neighbourhoods, and it is possible that they are systematically of lower quality, larger
or lack amenities such as good access public transportation. Research however suggests,
that after analysing the situation more closely via hedonic regression methods, there is a
persistent and significant gap even after controlling for basic properties, such as distance
from central business district, apartment size, age of apartment and general quality of
dwellings (Eerola and Saarimaa (2018)).
Obtaining an apartment from HEKA is not a trivial task as there are many applicants
and much fewer apartments become available annually. At the end of the November 2020,
the numbers of applications waiting was 23,749 (54% of them very urgent, 29% urgent
and 16% non-urgent) while the number of apartments supplied since January 2020 was
2,888. Even the applicants in most dire need face difficulties getting them. Problem
is further exacerbated as the residents, after being lucky enough to be offered a HEKA
home, may be reluctant to move out of their apartments, even if it no longer is the best
fit for their needs. Rent increases in HEKA apartments are more restrained than in the
non-subsidised housing market, which may contribute to a lock-in effect, where the rela-
tive benefit from living in subsidised apartment increases as the general price level around
the subsidised building increases.
As the demand for these reasonably priced subsidised dwellings greatly exceeds supply,
a large part of low-income applicants who are not offered a subsidised rental unit end
up living in same low-income neighbourhood. Residents in subsidised units have higher
incentives to hold onto their apartments, and they are unlikely to experience significant
rent hikes or other conditions that might push them out of their apartment as other rental
residents do. Thus in a way, the treatment effect that potentially causes displacement of
low-income rental residents should not apply to subsidised rental residents.
40