Embed Size (px)
Citation preview
Proceedings, 6th International Space Syntax Symposium, İstanbul, 2007
URBAN SHAPES AND URBAN GRIDS: a comparative study of Adriatic and Ionian coastal cities
009 Ermal Shpuza School of Architecture, Southern Polytechnic State University
Abstract This paper models in a precise quantitative manner the proposition that the properties of urban shapes strongly and significantly affect the syntactic properties of urban grids. Urban shapes are described according to three measures of shape compactness and fragmentation and their skewness of distribution. The analysis of a large sample of coastal cities has shown that urban shapes affect the integration of urban grids according to the underlying principles of grid morphology.
Introduction Syntactic research on urban environments has not so far directly addressed the relationship between settlement shape and syntactic properties of street networks. While it is shown that street networks evolve by resolving the paradoxes of centrality and visibility (Hillier 1996), there is little understanding on how the mutual effect of shape compactness, which is related to centrality, and shape convex fragmentation, which is related to visibility, affects the configurational properties of street networks. Urban grids have been considered as independent systems with their own internalized global logic tied to patterns of connectivities between streets (Hillier 1996, Hillier 1999). The partitioning experiments have illustrated the dependence of grids from topology and explained the emergence of the geometry of deformed grids. However, with the exception of considering the shape torus, no attention is given to the nature of the outer boundary of the systems, especially to the nature of boundary in actual cities. For example, the axial structure of cities of London and New York do not depend only to the nature of the deformed wheel and the Manhattan grid; they also reflect the cropping effect of Thames, Hudson and East River. This paper argues that urban grids are results of two interrelated factors: the internalized order of urban grids and the
Keywords: Urban shape Urban grid Urban typology Integration Connectivity Compactness Fragmentation Bias
Ermal Shpuza Southern Polytechnic State University, School of Architecture CET&C, 1100 South Marietta Parkway, Marietta, GA 30060, USA [email protected]
Shpuza; Urban Shapes and Urban Grids: A Comparative Study of Adriatic and Ionian Coastal Cities
Proceedings, 6th International Space Syntax Symposium, İstanbul, 2007
009-02
extent to which grids have developed as constrained by bounding urban shapes.
Previous research on office buildings (Shpuza and Peponis 2005, Shpuza 2006) has shown that office floorplate shape affects internal layout integration according to the generative principles of layouts. This paper uses these findings as a departure point to inquire the effect of settlement shape on syntactic features of street networks.
Unlike buildings, where layouts are bound by the limitations posed by building shells, in cities the relationship between urban shapes and grids is mutual. Considering geographical constraints, urban shapes affect urban grids by exerting the limitations of where it is possible to extend, while grids affect urban shapes due to growth occurring along outlying streets. Therefore the study addresses the interaction between urban shapes and urban grids and is aimed at discovering robust generic principles that link shape properties of urban shapes to properties of street networks.
Space syntax studies that have dealt with comparative or typological classification of urban form have so far relied on small samples of cities or have considered limited representative fragments of urban grids. In contrast to building typologies, which are formulated on the basis of large samples, the typological classification of urban form is generally marred by the problem of dealing with large systems and the economy of surveying, observing, representing and computing. It is necessary to support the formulation of typological classifications of urban form with samples of sufficient size.
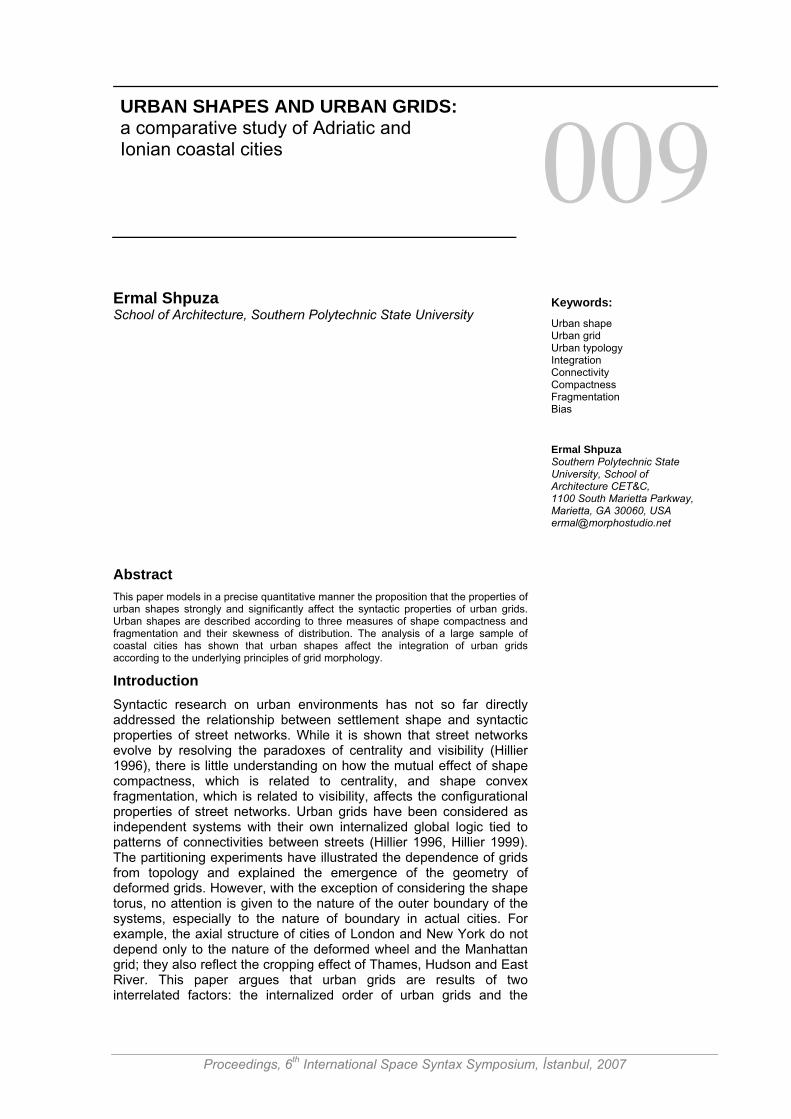
The search for generic affinities between urban shapes and urban grids is based on the morphological analysis of a large sample which enables statistical reliability. The sample includes 50 coastal cities and towns located in the Ionian and Adriatic seaside of Italy, Slovenia, Croatia, Montenegro, Albania and Greece. Citiesi are listed in a clockwise direction starting from the southeastern corner of Sicily, going up the Apennine coast, down the Western Balkans, and ending in Peloponnese (table 2). The study does not inquire into the historical factors that have influenced the development of the cities, while acknowledging the likelihood for similarity among them due to continuous cultural and economic exchange across the region.
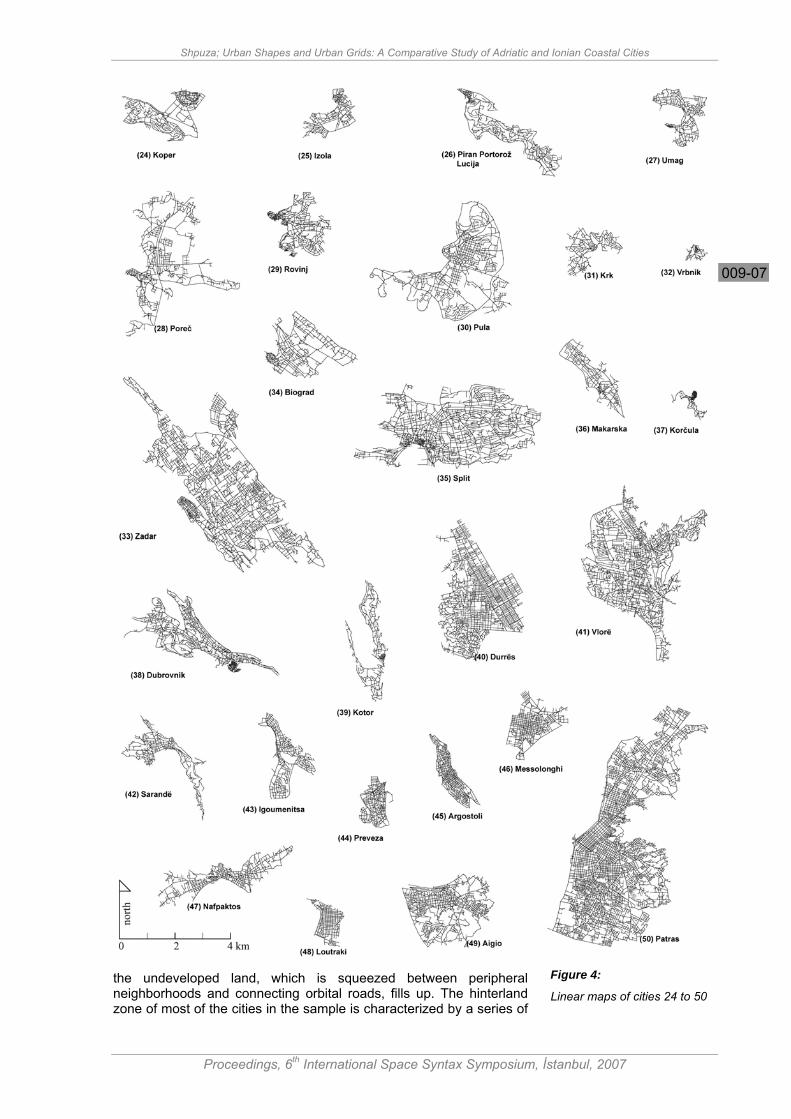
For the purposes of the argument “urban boundary” is defined according to the contiguity of the built area by disregarding administrative boundaries; “urban shape hull” is defined according to the shape enclosed inside the outmost urban boundary of the settlement; “holes” inside the urban shape consist of undeveloped land caught inside urban development; “urban shape” is defined as the shape resulting from subtracting holes from the urban shape hull; the “urban grid” is defined as the street network located entirely inside the urban shape. Urban grids are represented with linear maps (Hillier and Hanson 1984, Peponis et al 1998), also known as axial maps, and are characterized accordingly.
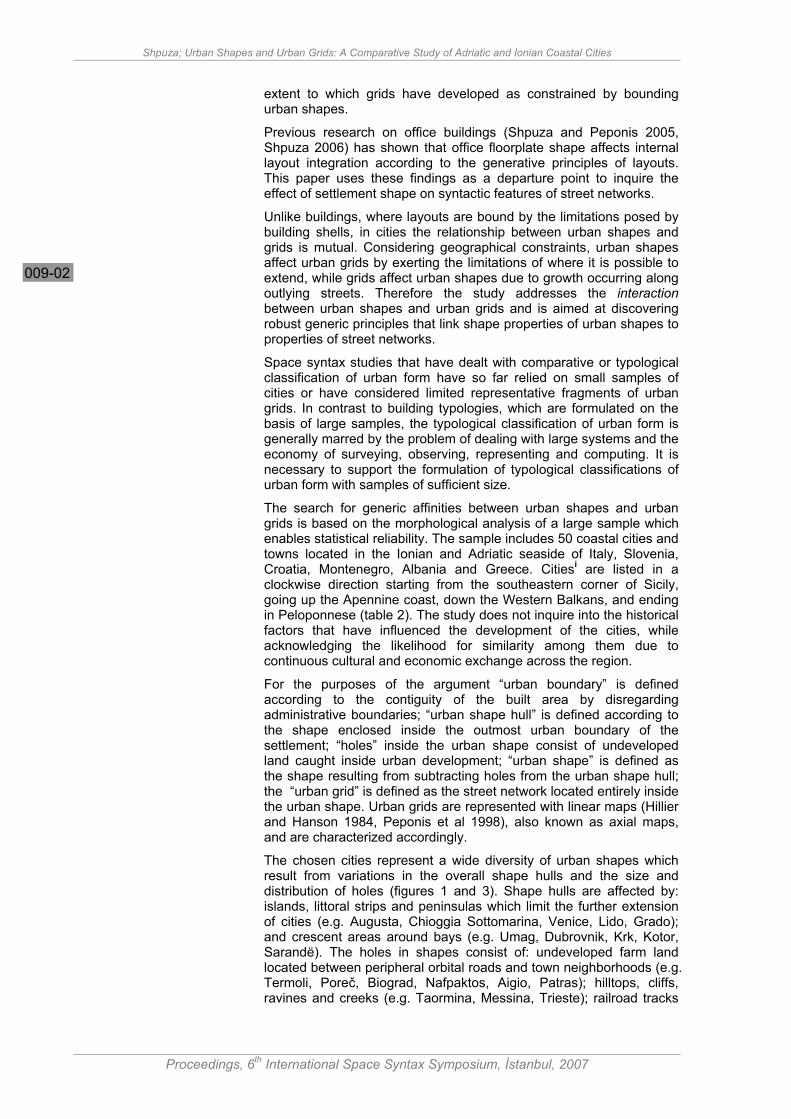
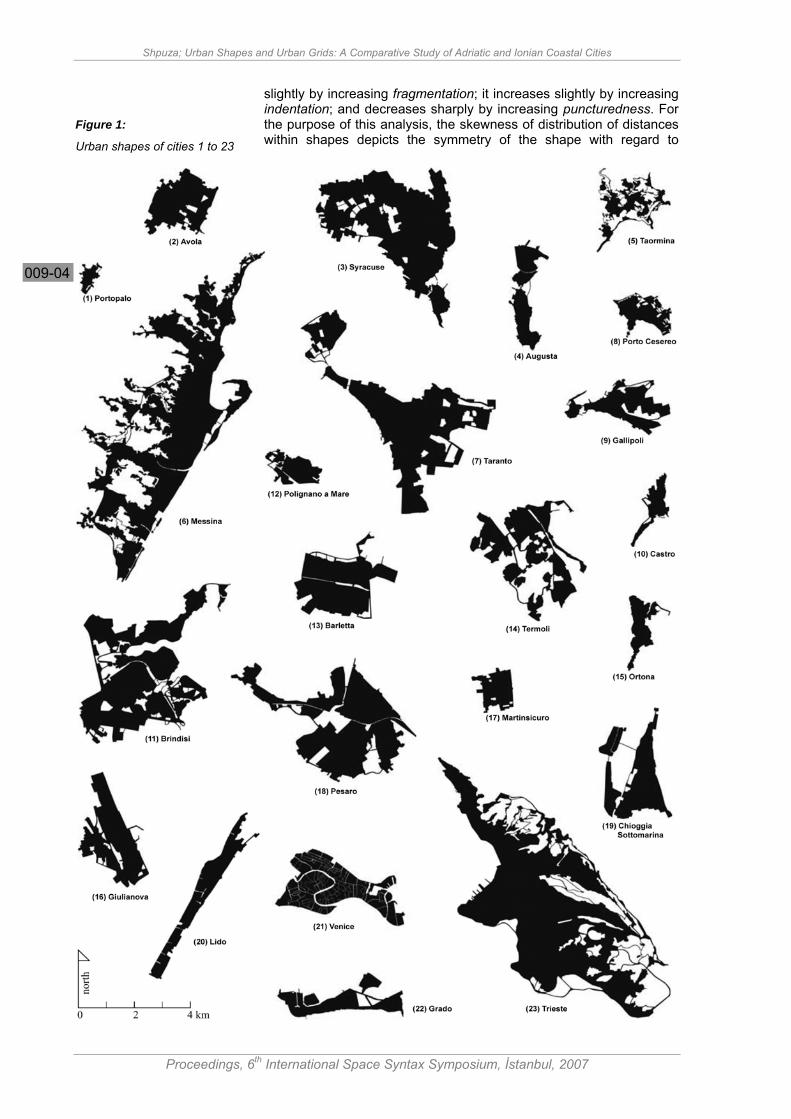
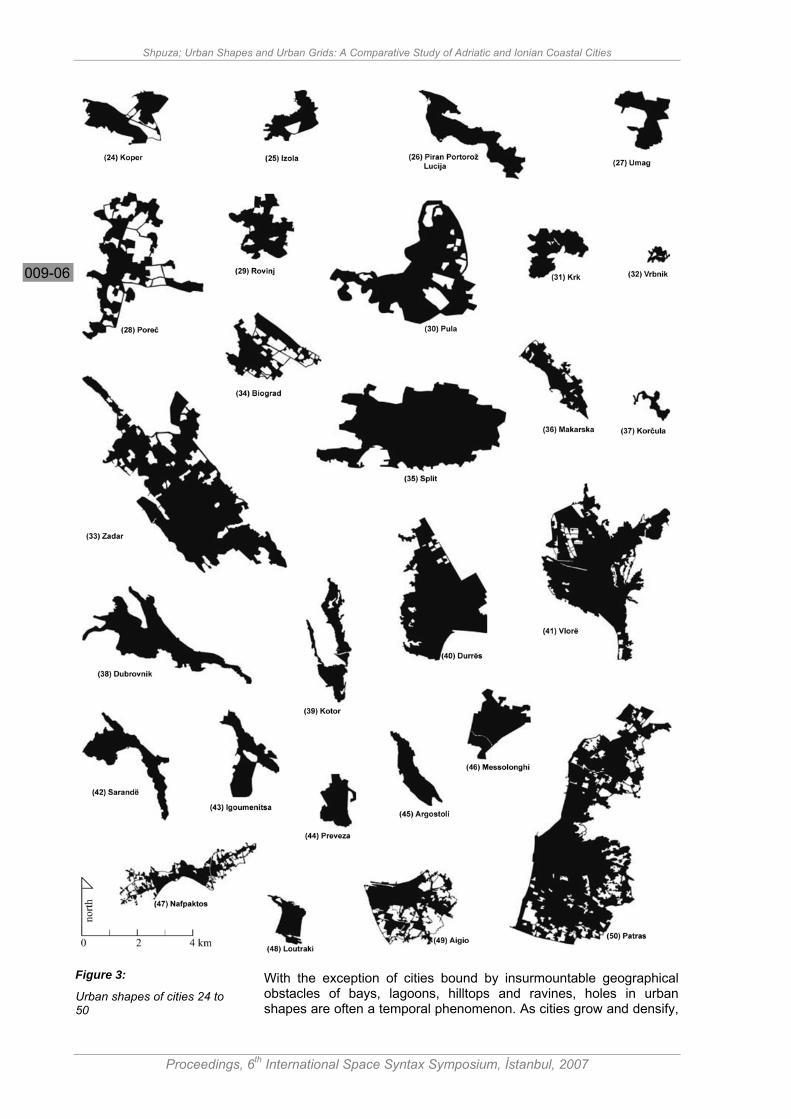
The chosen cities represent a wide diversity of urban shapes which result from variations in the overall shape hulls and the size and distribution of holes (figures 1 and 3). Shape hulls are affected by: islands, littoral strips and peninsulas which limit the further extension of cities (e.g. Augusta, Chioggia Sottomarina, Venice, Lido, Grado); and crescent areas around bays (e.g. Umag, Dubrovnik, Krk, Kotor, Sarandë). The holes in shapes consist of: undeveloped farm land located between peripheral orbital roads and town neighborhoods (e.g. Termoli, Poreč, Biograd, Nafpaktos, Aigio, Patras); hilltops, cliffs, ravines and creeks (e.g. Taormina, Messina, Trieste); railroad tracks
Shpuza; Urban Shapes and Urban Grids: A Comparative Study of Adriatic and Ionian Coastal Cities
Proceedings, 6th International Space Syntax Symposium, İstanbul, 2007
009-03
and industrial areas (e.g. Brindisi, Barletta, Termoli, Giulianova, Pesaro); and canals (e.g. Chioggia Sottomarina, Lido, Venice).
The argument is developed in four steps: First, urban shapes are analyzed with three measures that gauge compactness and fragmentation of shape (Shpuza 2001); Second the linear maps in the sample are analyzed with the conventional space syntax measures; Third, statistical analysis is used to discover the existence of three types of urban grid based on patterns connectivity; urban grids show generic commonalities with office layouts, thus illustrating fundamental characteristics of the built environment; Fourth, according to the interaction between shapes and grids, it is argued that the effect of shape upon the integration of urban grid is exerted according to different urban grid types.
Analysis of urban shapes The representation and analysis of built environment with modular units (Batty 2001, Dalton and Dalton 2001, Turner et al 2001) has a threefold advantage: first, the association of descriptions and measures with continuous qualities of space; second, gauging these qualities in a configurational manner; third, these methods take into account dimensional aspects of shape by weighing the configurational analysis with metrics of size and distance. Space syntax studies using modular analysis have addressed differences between parts of buildings and cities without characterizing the systems globally. Here, in contrast, the focus is on describing the entire shape with a few indices, where the aggregate measures of each and every modular unit in the shape are summed up and relativized for size.
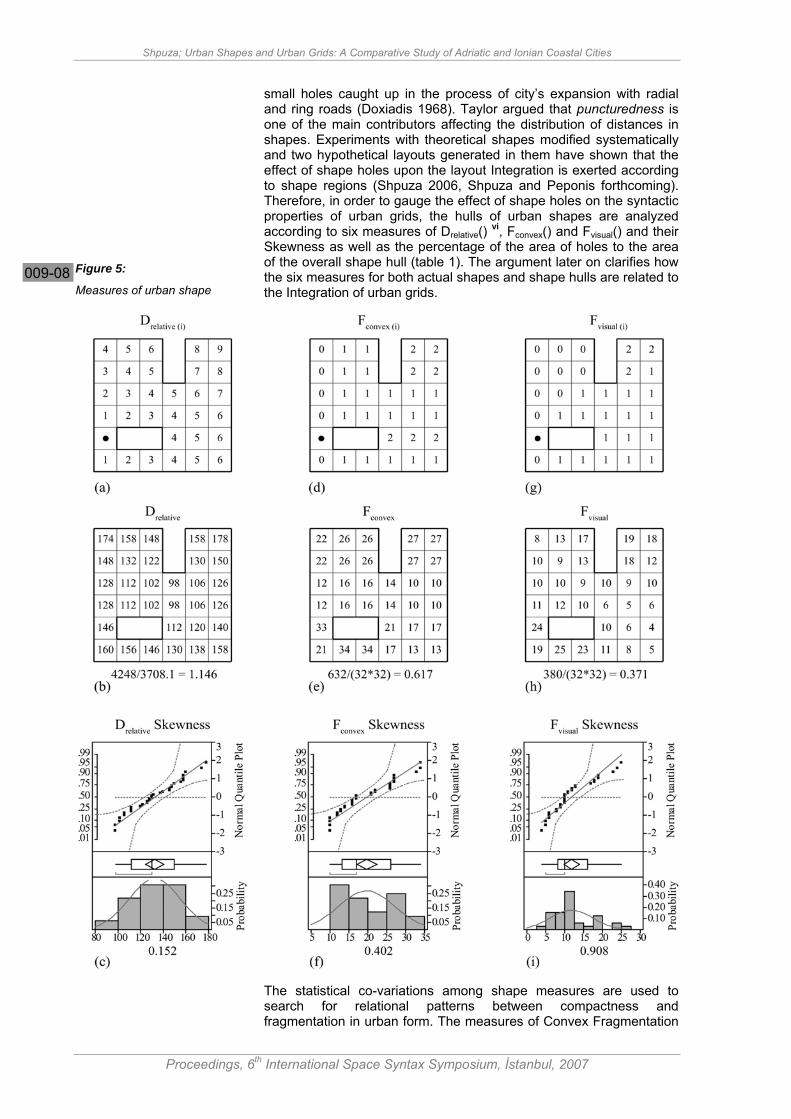
Urban shapes are represented with modular square units and analyzed with Qelize ii according to three measures of Relative Grid Distance Drelative
iii (figures 5a and 5b), Convex Fragmentation Fconvexiv
(figures 5d and 5e) (Shpuza 2001, Shpuza and Peponis 2005), and the proposed measure of Visual Fragmentation Fvisual which is calculated by the formula:
211
n
fF
nj,ni
j,i)ij(visual
visual
∑==
=== (1)
where fvisual(ij) is the visual depth between two unit tiles i and j, whereas n is the total number of unit tiles in the shape. The visual depth between two tiles is similar to the visual accessibility (Hillier and Hanson 1984) and visual shortest path length (Turner et al 2001). The first group of tiles visible from a given tile has a visual depth of zero (figures 5g and 5h); the next group of tiles visible from the first group of tiles has a depth of one and so on. Similar to Convex Fragmentation, for a sufficient large number of representation units, the measure of Visual Fragmentation is not affected by the number of representation units. The value 0 indicates a convex shape, whereas larger values show the fragmentation in the shape due to indents, wings or holes.
The three shape measures are based on aggregating distances between shape locations: grid metric distances in the case of Drelative; distances across overlapping convex areas for Fconvex; and distances across isovists for Fvisual. Former research has used the distribution of metric distances in shapes to characterize geographical shapes (Luu-Mau-Thanh 1962, Bunge 1966, Maceachren 1985) and the skewness of a few geometrical measures to describe isovists (Batty 2001). Taylor (1971) has shown that the skewness of distribution of metric distances within shapes is directly affected by changes in shapes: skewness increases markedly by increasing elongality; it decreases
Shpuza; Urban Shapes and Urban Grids: A Comparative Study of Adriatic and Ionian Coastal Cities
Proceedings, 6th International Space Syntax Symposium, İstanbul, 2007
009-04
slightly by increasing fragmentation; it increases slightly by increasing indentation; and decreases sharply by increasing puncturedness. For the purpose of this analysis, the skewness of distribution of distances within shapes depicts the symmetry of the shape with regard to
Figure 1:
Urban shapes of cities 1 to 23
Shpuza; Urban Shapes and Urban Grids: A Comparative Study of Adriatic and Ionian Coastal Cities
Proceedings, 6th International Space Syntax Symposium, İstanbul, 2007
009-05
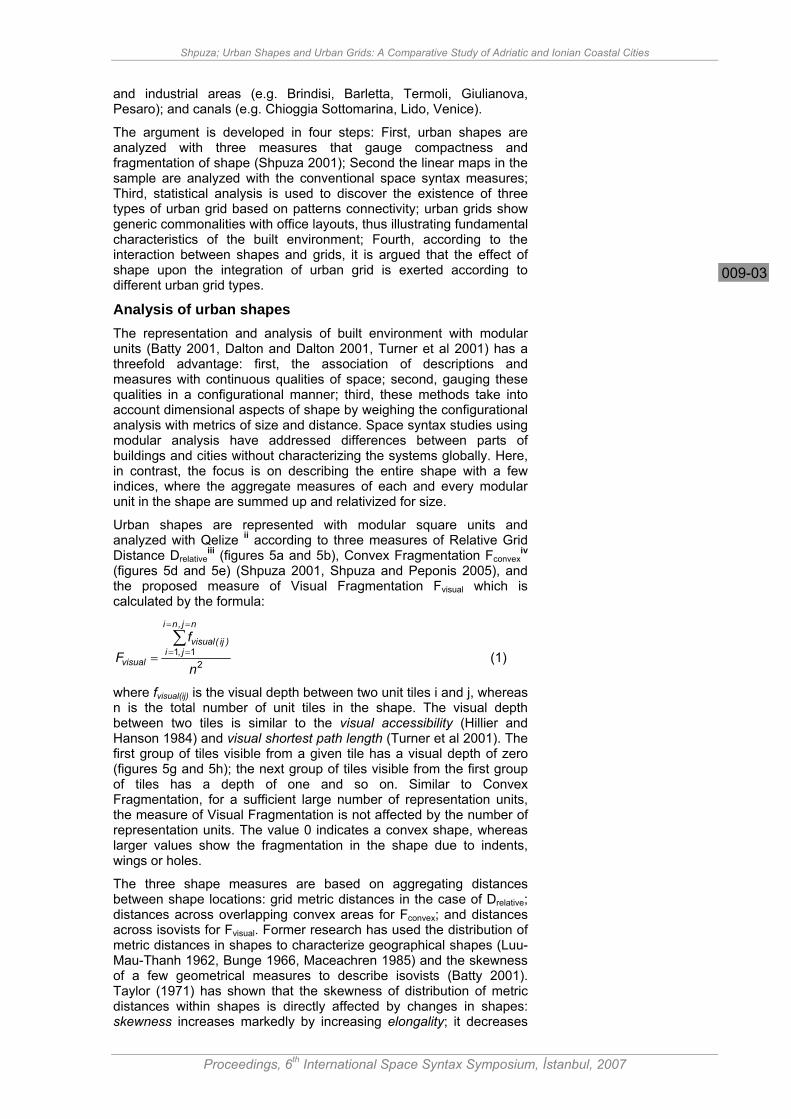
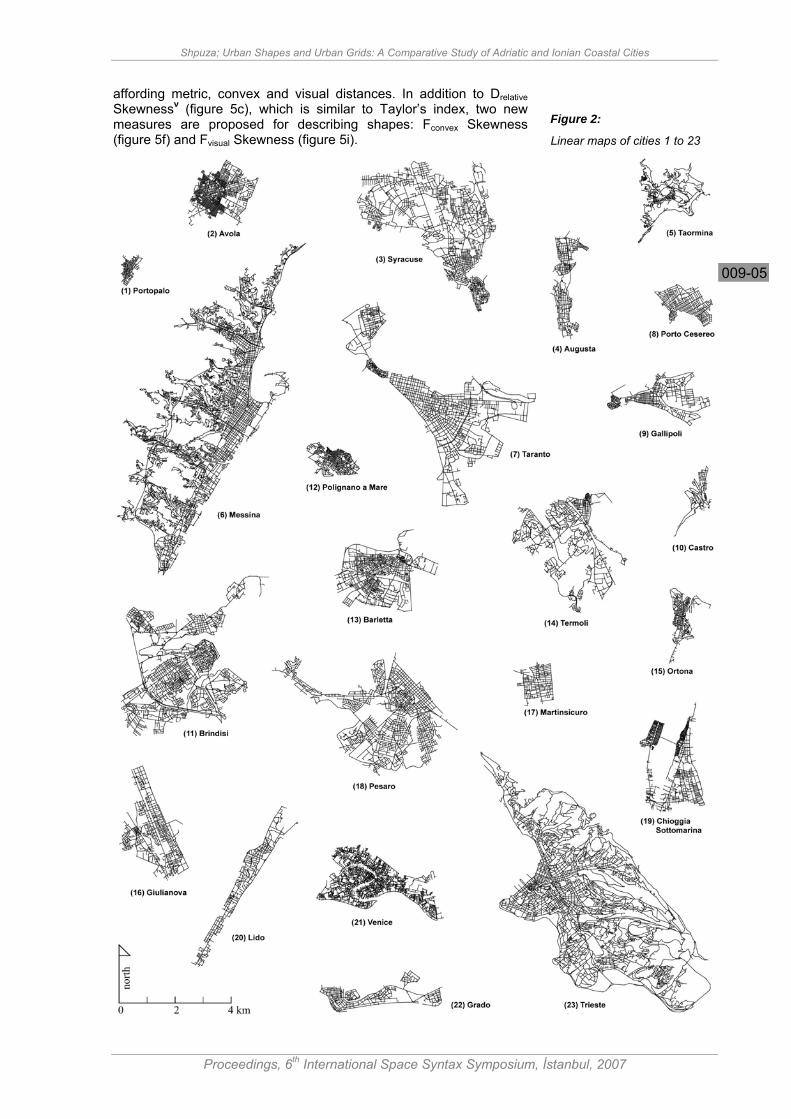
affording metric, convex and visual distances. In addition to Drelative Skewnessv (figure 5c), which is similar to Taylor’s index, two new measures are proposed for describing shapes: Fconvex Skewness (figure 5f) and Fvisual Skewness (figure 5i).
Figure 2:
Linear maps of cities 1 to 23
Shpuza; Urban Shapes and Urban Grids: A Comparative Study of Adriatic and Ionian Coastal Cities
Proceedings, 6th International Space Syntax Symposium, İstanbul, 2007
009-06
With the exception of cities bound by insurmountable geographical obstacles of bays, lagoons, hilltops and ravines, holes in urban shapes are often a temporal phenomenon. As cities grow and densify,
Figure 3:
Urban shapes of cities 24 to 50
Shpuza; Urban Shapes and Urban Grids: A Comparative Study of Adriatic and Ionian Coastal Cities
Proceedings, 6th International Space Syntax Symposium, İstanbul, 2007
009-07
the undeveloped land, which is squeezed between peripheral neighborhoods and connecting orbital roads, fills up. The hinterland zone of most of the cities in the sample is characterized by a series of
Figure 4:
Linear maps of cities 24 to 50
Shpuza; Urban Shapes and Urban Grids: A Comparative Study of Adriatic and Ionian Coastal Cities
Proceedings, 6th International Space Syntax Symposium, İstanbul, 2007
009-08
small holes caught up in the process of city’s expansion with radial and ring roads (Doxiadis 1968). Taylor argued that puncturedness is one of the main contributors affecting the distribution of distances in shapes. Experiments with theoretical shapes modified systematically and two hypothetical layouts generated in them have shown that the effect of shape holes upon the layout Integration is exerted according to shape regions (Shpuza 2006, Shpuza and Peponis forthcoming). Therefore, in order to gauge the effect of shape holes on the syntactic properties of urban grids, the hulls of urban shapes are analyzed according to six measures of Drelative() vi, Fconvex() and Fvisual() and their Skewness as well as the percentage of the area of holes to the area of the overall shape hull (table 1). The argument later on clarifies how the six measures for both actual shapes and shape hulls are related to the Integration of urban grids.
The statistical co-variations among shape measures are used to search for relational patterns between compactness and fragmentation in urban form. The measures of Convex Fragmentation
Figure 5:
Measures of urban shape
Shpuza; Urban Shapes and Urban Grids: A Comparative Study of Adriatic and Ionian Coastal Cities
Proceedings, 6th International Space Syntax Symposium, İstanbul, 2007
009-09
and Visual Fragmentation for actual shapes and shape hulls correlate strongly and significantly, Fconvex vs. Fvisual r=0.962, p<0.0001 and Fconvex() vs. Fvisual() r=0.949, p<0.0001, indicating that the two measures are closely interrelated. Interestingly, the relative fragmentation of shapes due to the depth of overlapping convex areas is almost identical to the relative fragmentation of shapes due to the visual depth of overlapping isovists. Since the sample includes urban shapes, it is not possible to conclude whether the two above correlations indicate a generic mathematical relation between the two fragmentation measures or whether they describe a specific property of urban form.
The study of office building floorplates demonstrated that the correlation r=0.625, p<0.0001 between Drelative and Fconvex is indicative of a property of the office building type since the two measures are not related mathematically (Shpuza 2006, Shpuza and Peponis forthcoming). In the case of urban shapes, the correlations between compactness and fragmentation are even weaker, Drelative vs. Fconvex r=0.567, p<0.0001; Drelative vs. Fvisual r=0.487, p=0.0003, showing that urban shapes exhibit less regularity than office floorplates (figure 6). However, these correlations improve noticeably when urban shape hulls are considered:
Drelative() vs. Fconvex() r=0.844, p<0.0001; Drelative() vs. Fvisual() r=0.876, p<0.0001. The correlations between compactness and fragmentation are descriptive of a unique characteristic of urban form where shape hulls overcome geographical constraints and occupy a narrow sector in the spectrum of potential shapes. The extension of radial wings and the connection with peripheral orbital roads (Doxiadis 1968) are some of the dynamic processes that lead to a striking balance between compactness and fragmentation across urban shape hulls. It is possible to speculate that while cities grow, the dialogue between centrality and visibility (Hillier 1996) inside street networks causes urban shape hulls to maintain a tight relationship between compactness and fragmentation, hence expressed as a manifestation of urban emergence and essential urban dynamic (Hillier 1993, Hillier 1999).
Analysis of Urban Grids Without exception, all cities in the sample have a denser core of street network located near the coast, which includes the historical center, and sparser area of larger urban blocks which are spread towards the hinterland. Urban grids include a combination of radial and orthogonal grids illustrating the urban global near-variant (Hillier 1999) and serpentine roads developed along hilly terrains (figures 2 and 4).
Linear maps of cities are analyzed according to the standard syntactic measures of Integration vii, Connectivity and Line Length as well as their statistical distributions Integration Skewness, Connectivity Skewness and Line Length Skewness (table 2). The Integration in the sample varies between 0.210 and 1.861 and has a mean of 0.800. The most notable correlations among axial measures for the sample are: Connectivity vs. Line Length r=0.758, p<0.0001; Connectivity Skewness vs. Length Skewness r=0.821, p<0.0001; Integration vs. Line Length r=0.664, p<0.0001; and Integration vs. Connectivity r=0.845, p<0.0001. In general, Integration in urban grids increases due to both the elongation of streets, i.e. greater Line Length, and the densification, i.e. greater Connectivity. At this point, it is unclear whether the increase of Connectivity and Length results from the effect of a few better connected and longer lines or whether it results from the combined effect of most of lines in urban grids. This will be clarified at a later part of the discussion.
Shpuza; Urban Shapes and Urban Grids: A Comparative Study of Adriatic and Ionian Coastal Cities
Proceedings, 6th International Space Syntax Symposium, İstanbul, 2007
009-10
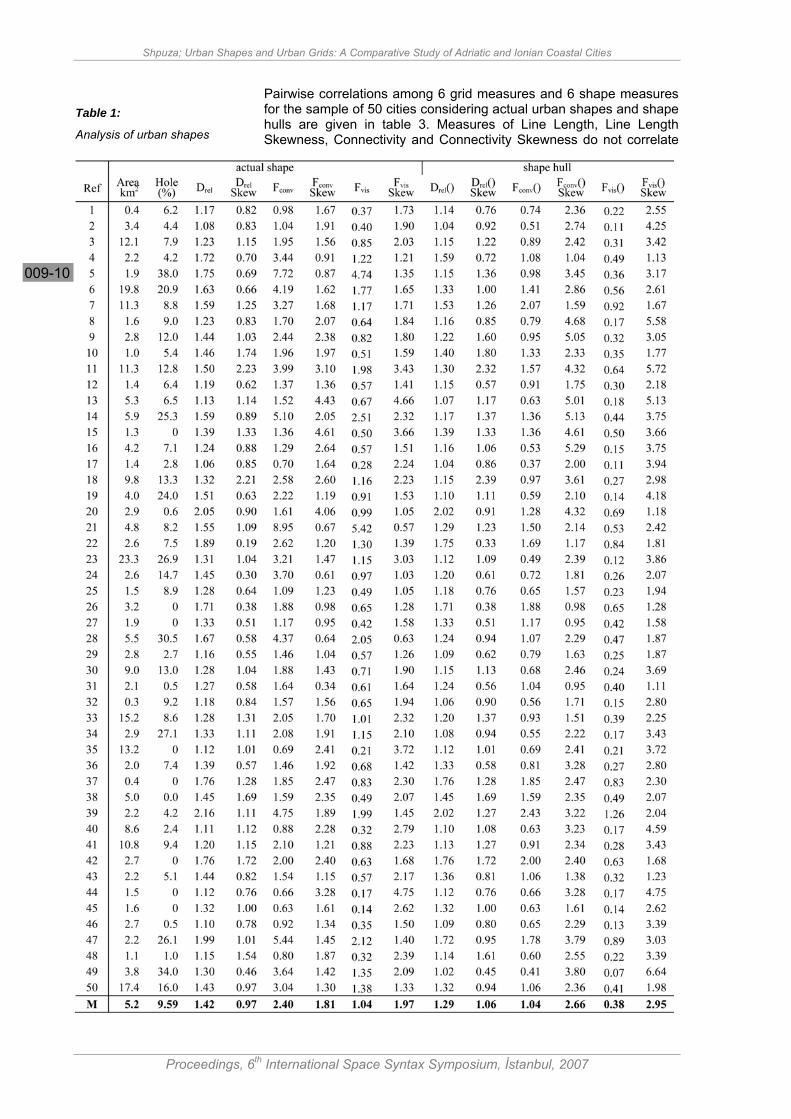
Pairwise correlations among 6 grid measures and 6 shape measures for the sample of 50 cities considering actual urban shapes and shape hulls are given in table 3. Measures of Line Length, Line Length Skewness, Connectivity and Connectivity Skewness do not correlate
Table 1:
Analysis of urban shapes
Shpuza; Urban Shapes and Urban Grids: A Comparative Study of Adriatic and Ionian Coastal Cities
Proceedings, 6th International Space Syntax Symposium, İstanbul, 2007
009-11
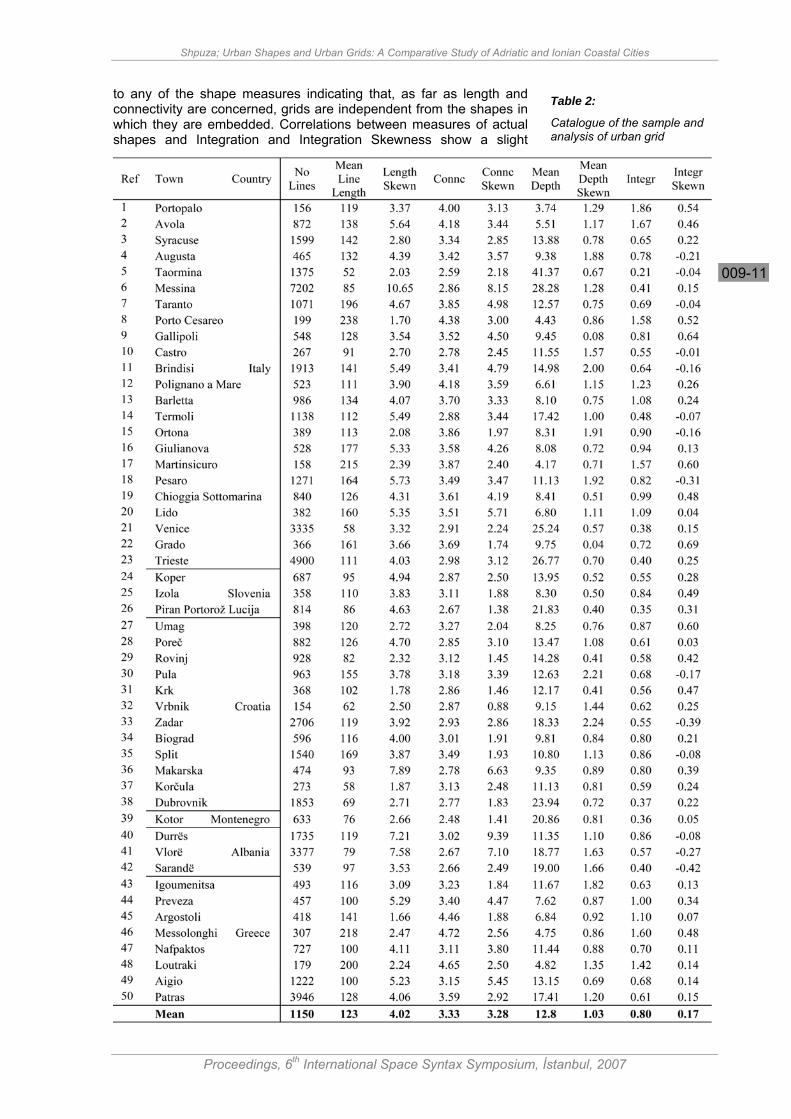
to any of the shape measures indicating that, as far as length and connectivity are concerned, grids are independent from the shapes in which they are embedded. Correlations between measures of actual shapes and Integration and Integration Skewness show a slight
Table 2:
Catalogue of the sample and analysis of urban grid

Shpuza; Urban Shapes and Urban Grids: A Comparative Study of Adriatic and Ionian Coastal Cities
Proceedings, 6th International Space Syntax Symposium, İstanbul, 2007
009-12
improvement, notably Drelative vs. Integration r=-0.505, p<0.0001; Drelative Skewness vs. Integration Skewness r=-0.581, p<0.0001; Fconvex vs. Integration r=-0.552, p<0.0001; Fvisual vs. Integration r=-0.476, r=0.001. According to these negative correlations, more compact shapes and less fragmented shapes would coincide with more integrated grids. The correlations while significant are nevertheless weak suggesting two possibilities: either urban shapes do not have a strong effect on the syntactic characteristics of urban grids, or the effect is different according to various kinds of grids. The later suggests the need for discovering urban grid types and investigating how different types are affected by urban shapes.
Correlations with r>0.500 and probability <0.05 are highlighted and their probability is shown beneath
Syntactic Typology of Urban Grids Space syntax models the topology of connections of spaces and urban grids create structure as a pattern of connectivities (Hillier
Figure 6:
Interaction between compactness and fragmentation in urban shapes
Table 3:
Correlations between shape measures and grid measures for the sample of 50 cities.
Shpuza; Urban Shapes and Urban Grids: A Comparative Study of Adriatic and Ionian Coastal Cities
Proceedings, 6th International Space Syntax Symposium, İstanbul, 2007
009-13
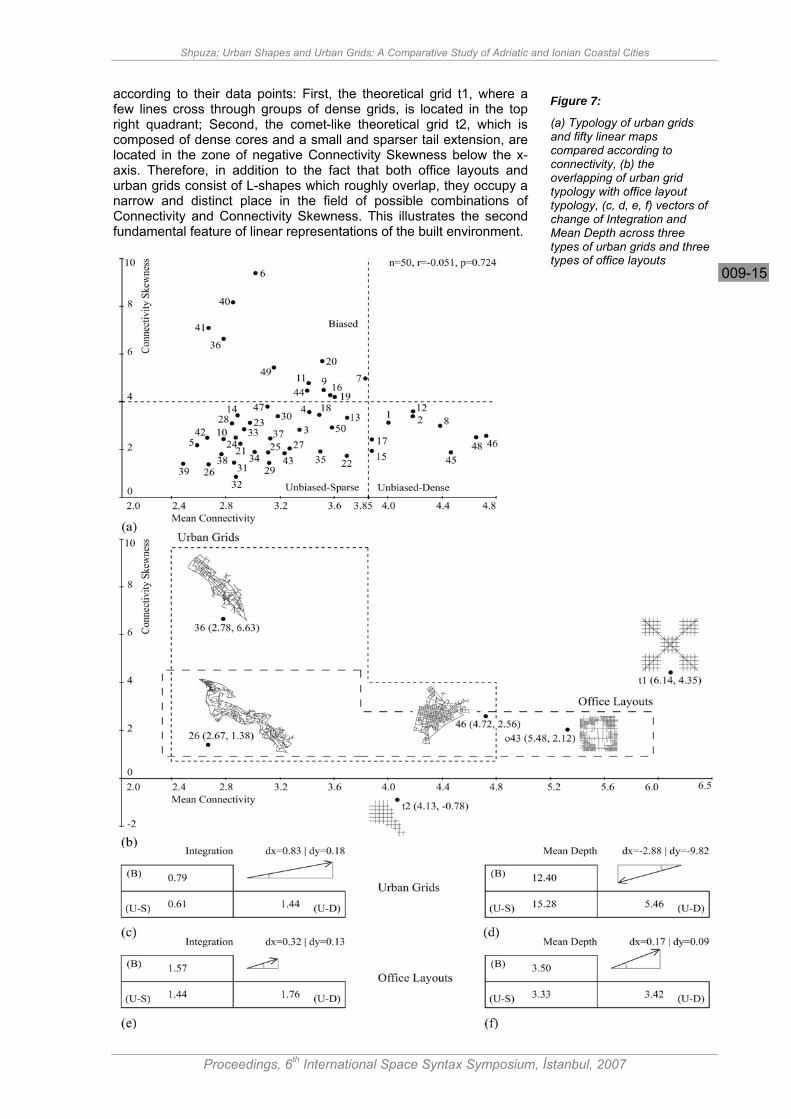
1999). Therefore, the relationship between Connectivity and Connectivity Skewness is scrutinized in detail. The scatterplot between the two measures for 50 urban grids, despite a weak correlation, shows that all data points fall inside an L-shaped cluster (figure 7a), which is almost identical to the pattern discovered for linear maps of office layouts (Shpuza 2006, Shpuza and Peponis forthcoming). The statistical splitting of the cluster into three groups is unequivocal and produces three types of urban grids located in three quadrants: First, “biased” includes 12 cases of grids with high Connectivity Skewness and low Connectivity located in the top left quadrant. This type distinctly exhibits cities with long boulevards that cross a large number of secondary streets (e.g. Messina, Durrës, Makarska). Second, “unbiased-sparse” includes 27 cases of grids with low Connectivity Skewness and low Connectivity located in the bottom left quadrant. The lower left corner of this type contains very sparse grids composed of serpentine roads of small towns located in hilly terrains (e.g. Taormina, Kotor, Piran Portorož Lucija). Moving towards the center of the scatter, still inside the bottom left quadrant, one finds larger cities that exhibit a combination of orthogonal grids and serpentine peripheral additions (e.g. Patras, Pula, Syracuse). Third, “unbiased-dense” includes 9 cases with low Connectivity Skewness and high Connectivity located in the bottom right quadrant. The mid-size cities of this type are characteristically composed of simple orthogonal grids that extend almost evenly in both directions (e.g. Portopalo, Messolonghi, Loutraki).
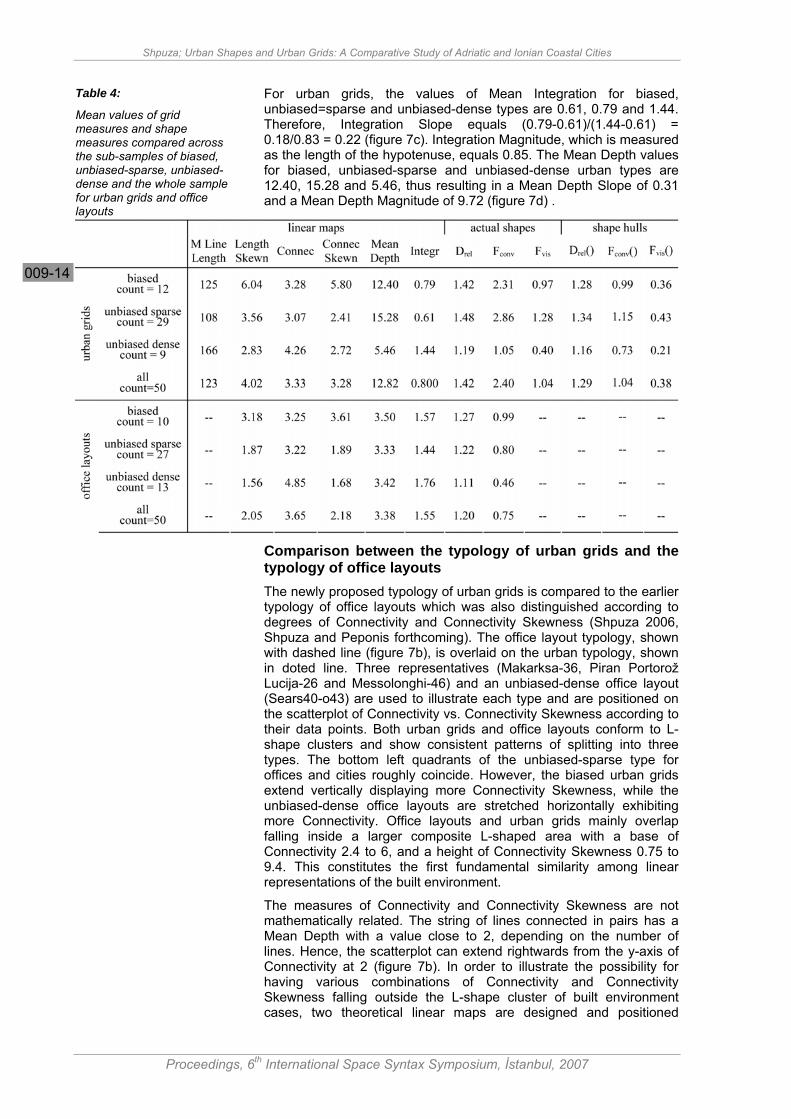
The mean values of the syntactic measures for urban grids, shapes and shape hulls and their skewness are calculated and compared among three urban types and the sample as a whole and are shown in the upper rows of table 4. In comparison to the other two types, the unbiased-dense urban grids have the highest Line Length at 166m and Connectivity at 4.257. The Integration for the unbiased-sparse at 0.61 is the lowest of the three types; it increases at 0.79 for the biased; and increases further at 1.44 for the unbiased-dense. Integration for urban grids increases both due to the increase of Connectivity Skewness, moving vertically from the unbiased-sparse to the biased; and due to the increase of Connectivity, moving horizontally from the unbiased-sparse to the unbiased-dense. However, the increase of Integration due to Connectivity is much more pronounced than the increase due to Connectivity Skewness. Two new measures are proposed to express the degree of change of a measure among the three types of axial maps.
Slope ά measures the relative change of a measure among three types and equals the slope of the vector defined by the three values of the measure:
xΔΔ
=αy (2)
The rise Δy is given by the difference between values of the measure for biased and unbiased-sparse types. The run Δx is given by the difference between values for unbiased-dense and unbiased-sparse.
Magnitude δ measures the absolute change of a measure among three types and is calculated by the length of the vector defined by the three values of the measure:
22 yx Δ+Δ=δ (3)
The rise and the run of the vector are defined as in the formula (2) above.
Shpuza; Urban Shapes and Urban Grids: A Comparative Study of Adriatic and Ionian Coastal Cities
Proceedings, 6th International Space Syntax Symposium, İstanbul, 2007
009-14
For urban grids, the values of Mean Integration for biased, unbiased=sparse and unbiased-dense types are 0.61, 0.79 and 1.44. Therefore, Integration Slope equals (0.79-0.61)/(1.44-0.61) = 0.18/0.83 = 0.22 (figure 7c). Integration Magnitude, which is measured as the length of the hypotenuse, equals 0.85. The Mean Depth values for biased, unbiased-sparse and unbiased-dense urban types are 12.40, 15.28 and 5.46, thus resulting in a Mean Depth Slope of 0.31 and a Mean Depth Magnitude of 9.72 (figure 7d) .
Comparison between the typology of urban grids and the typology of office layouts The newly proposed typology of urban grids is compared to the earlier typology of office layouts which was also distinguished according to degrees of Connectivity and Connectivity Skewness (Shpuza 2006, Shpuza and Peponis forthcoming). The office layout typology, shown with dashed line (figure 7b), is overlaid on the urban typology, shown in doted line. Three representatives (Makarksa-36, Piran Portorož Lucija-26 and Messolonghi-46) and an unbiased-dense office layout (Sears40-o43) are used to illustrate each type and are positioned on the scatterplot of Connectivity vs. Connectivity Skewness according to their data points. Both urban grids and office layouts conform to L-shape clusters and show consistent patterns of splitting into three types. The bottom left quadrants of the unbiased-sparse type for offices and cities roughly coincide. However, the biased urban grids extend vertically displaying more Connectivity Skewness, while the unbiased-dense office layouts are stretched horizontally exhibiting more Connectivity. Office layouts and urban grids mainly overlap falling inside a larger composite L-shaped area with a base of Connectivity 2.4 to 6, and a height of Connectivity Skewness 0.75 to 9.4. This constitutes the first fundamental similarity among linear representations of the built environment.
The measures of Connectivity and Connectivity Skewness are not mathematically related. The string of lines connected in pairs has a Mean Depth with a value close to 2, depending on the number of lines. Hence, the scatterplot can extend rightwards from the y-axis of Connectivity at 2 (figure 7b). In order to illustrate the possibility for having various combinations of Connectivity and Connectivity Skewness falling outside the L-shape cluster of built environment cases, two theoretical linear maps are designed and positioned
Table 4:
Mean values of grid measures and shape measures compared across the sub-samples of biased, unbiased-sparse, unbiased-dense and the whole sample for urban grids and office layouts
Shpuza; Urban Shapes and Urban Grids: A Comparative Study of Adriatic and Ionian Coastal Cities
Proceedings, 6th International Space Syntax Symposium, İstanbul, 2007
009-15
according to their data points: First, the theoretical grid t1, where a few lines cross through groups of dense grids, is located in the top right quadrant; Second, the comet-like theoretical grid t2, which is composed of dense cores and a small and sparser tail extension, are located in the zone of negative Connectivity Skewness below the x-axis. Therefore, in addition to the fact that both office layouts and urban grids consist of L-shapes which roughly overlap, they occupy a narrow and distinct place in the field of possible combinations of Connectivity and Connectivity Skewness. This illustrates the second fundamental feature of linear representations of the built environment.
Like in offices, Integration in urban grids increases due to the increase of Connectivity and due to the increase of positive bias of Connectivity; however, the Integration in urban grids is mostly influenced by Connectivity. For office layouts, the Integration Slope is 0.41, which is almost twice as steep as 0.22 for urban grids; while the Integration Magnitude is 0.34, almost twice as smaller as 0.85 in urban grids (figure 7e). The lower Integration Slope for urban grids is indicative of a greater influence of Connectivity than Connectivity Skewness. Despite this difference, the vectors of Integration for cities and offices have the same orientation growing towards the top right, i.e. the ranking orders of Integration among three types of urban grids
Figure 7:
(a) Typology of urban grids and fifty linear maps compared according to connectivity, (b) the overlapping of urban grid typology with office layout typology, (c, d, e, f) vectors of change of Integration and Mean Depth across three types of urban grids and three types of office layouts
Shpuza; Urban Shapes and Urban Grids: A Comparative Study of Adriatic and Ionian Coastal Cities
Proceedings, 6th International Space Syntax Symposium, İstanbul, 2007
009-16
and three types of office layouts are strictly maintained: unbiased-sparse < biased < unbiased-dense (figure 7c and 7e). This suggests the third fundamental similarity between the two kinds of built environment.
The Mean Depth Slope for offices at 0.41 is higher than 0.31 for urban grids, while Mean Depth Magnitude at 0.18 (figure 7f) is much smaller than 9.72 for urban grids. For urban grids the ranking order is unbiased-sparse>biased>unbiased-dense, whereas for offices the ranking order is biased>unbiased-dense>unbiased-dense (figure 7d and 7f). These reversed orders are also explained by the fact that the vector of Mean Depth for offices is oriented in an opposite direction to the vector of Mean Depth for cities.
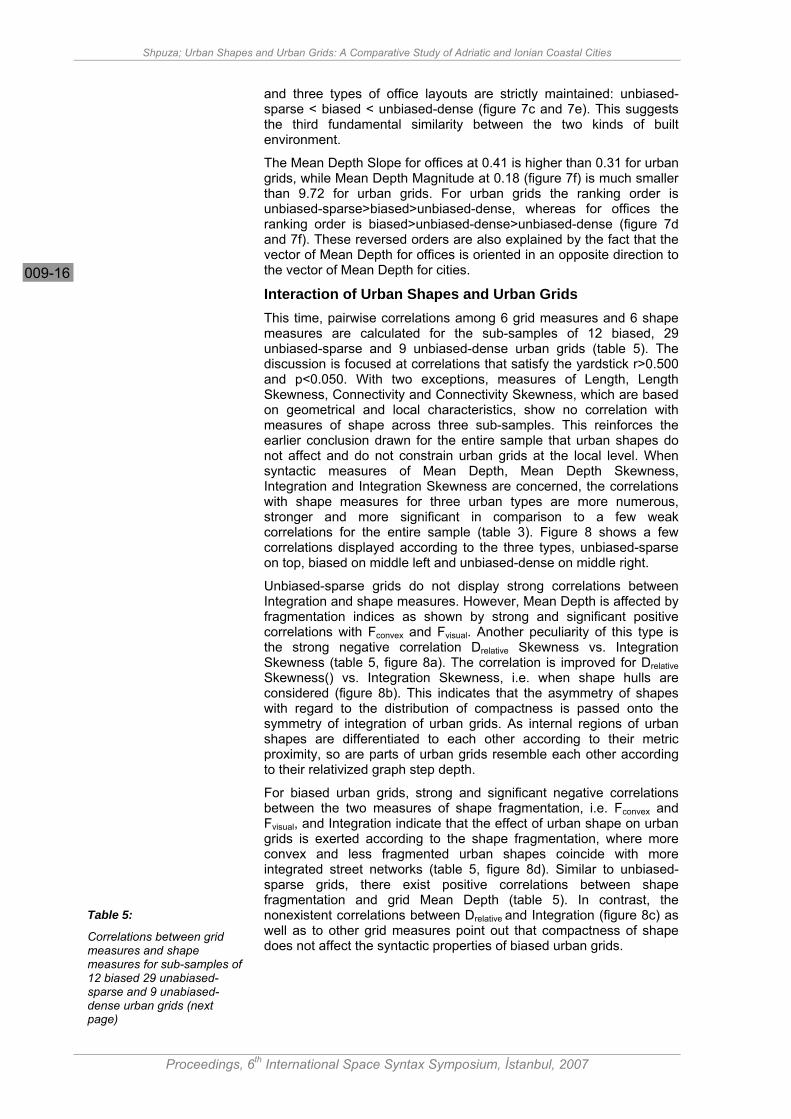
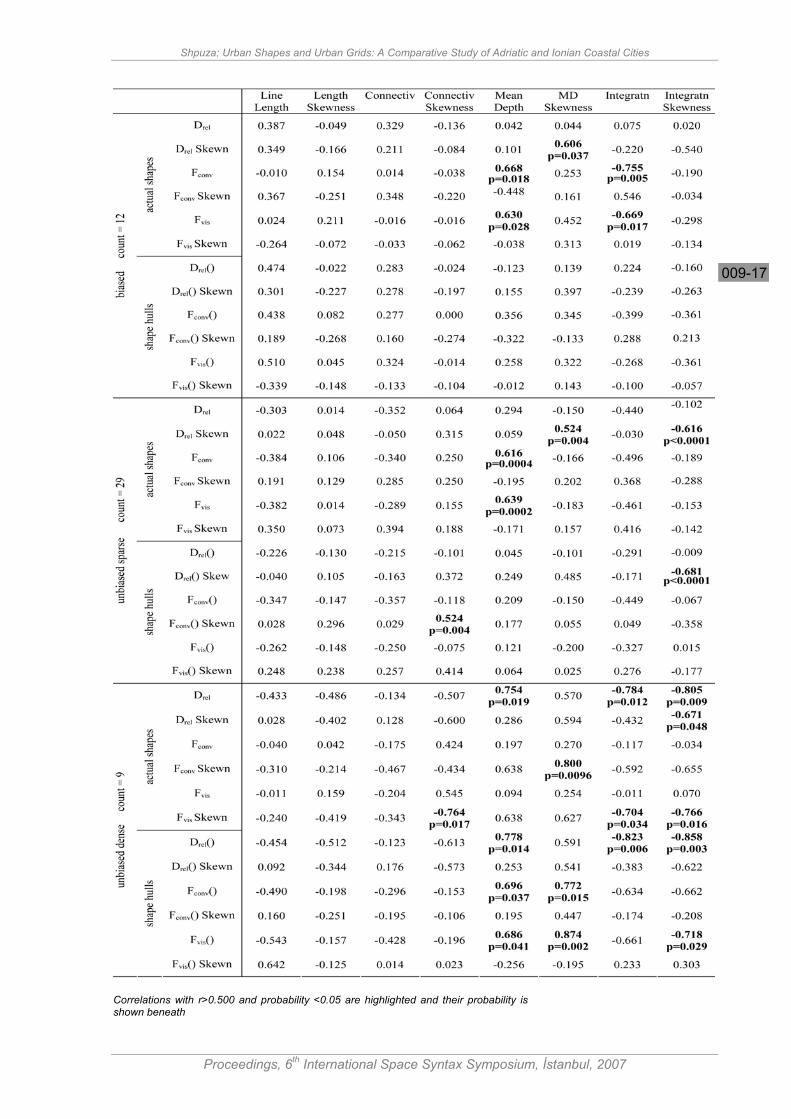
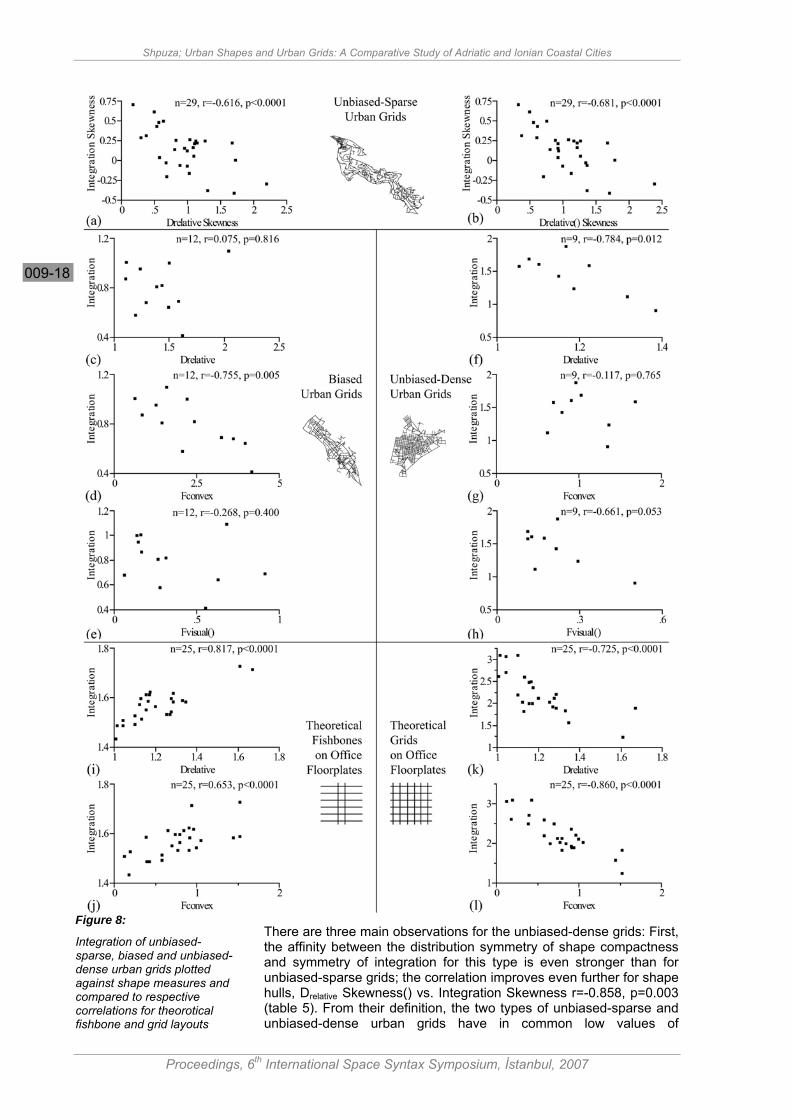
Interaction of Urban Shapes and Urban Grids This time, pairwise correlations among 6 grid measures and 6 shape measures are calculated for the sub-samples of 12 biased, 29 unbiased-sparse and 9 unbiased-dense urban grids (table 5). The discussion is focused at correlations that satisfy the yardstick r>0.500 and p<0.050. With two exceptions, measures of Length, Length Skewness, Connectivity and Connectivity Skewness, which are based on geometrical and local characteristics, show no correlation with measures of shape across three sub-samples. This reinforces the earlier conclusion drawn for the entire sample that urban shapes do not affect and do not constrain urban grids at the local level. When syntactic measures of Mean Depth, Mean Depth Skewness, Integration and Integration Skewness are concerned, the correlations with shape measures for three urban types are more numerous, stronger and more significant in comparison to a few weak correlations for the entire sample (table 3). Figure 8 shows a few correlations displayed according to the three types, unbiased-sparse on top, biased on middle left and unbiased-dense on middle right.
Unbiased-sparse grids do not display strong correlations between Integration and shape measures. However, Mean Depth is affected by fragmentation indices as shown by strong and significant positive correlations with Fconvex and Fvisual. Another peculiarity of this type is the strong negative correlation Drelative Skewness vs. Integration Skewness (table 5, figure 8a). The correlation is improved for Drelative Skewness() vs. Integration Skewness, i.e. when shape hulls are considered (figure 8b). This indicates that the asymmetry of shapes with regard to the distribution of compactness is passed onto the symmetry of integration of urban grids. As internal regions of urban shapes are differentiated to each other according to their metric proximity, so are parts of urban grids resemble each other according to their relativized graph step depth.
For biased urban grids, strong and significant negative correlations between the two measures of shape fragmentation, i.e. Fconvex and Fvisual, and Integration indicate that the effect of urban shape on urban grids is exerted according to the shape fragmentation, where more convex and less fragmented urban shapes coincide with more integrated street networks (table 5, figure 8d). Similar to unbiased-sparse grids, there exist positive correlations between shape fragmentation and grid Mean Depth (table 5). In contrast, the nonexistent correlations between Drelative and Integration (figure 8c) as well as to other grid measures point out that compactness of shape does not affect the syntactic properties of biased urban grids.
Table 5:
Correlations between grid measures and shape measures for sub-samples of 12 biased 29 unabiased-sparse and 9 unabiased-dense urban grids (next page)
Shpuza; Urban Shapes and Urban Grids: A Comparative Study of Adriatic and Ionian Coastal Cities
Proceedings, 6th International Space Syntax Symposium, İstanbul, 2007
009-17
Correlations with r>0.500 and probability <0.05 are highlighted and their probability is shown beneath
Shpuza; Urban Shapes and Urban Grids: A Comparative Study of Adriatic and Ionian Coastal Cities
Proceedings, 6th International Space Syntax Symposium, İstanbul, 2007
009-18
There are three main observations for the unbiased-dense grids: First, the affinity between the distribution symmetry of shape compactness and symmetry of integration for this type is even stronger than for unbiased-sparse grids; the correlation improves even further for shape hulls, Drelative Skewness() vs. Integration Skewness r=-0.858, p=0.003 (table 5). From their definition, the two types of unbiased-sparse and unbiased-dense urban grids have in common low values of
Figure 8:
Integration of unbiased-sparse, biased and unbiased-dense urban grids plotted against shape measures and compared to respective correlations for theorotical fishbone and grid layouts
Shpuza; Urban Shapes and Urban Grids: A Comparative Study of Adriatic and Ionian Coastal Cities
Proceedings, 6th International Space Syntax Symposium, İstanbul, 2007
009-19
Connectivity Skewness; hence it is possible to speculate that the affinity between the bias of shape compactness and grid integration is a result of the lack of connectivity bias in urban grids. Second, the asymmetry of integration is affected by both the symmetry of shape fragmentation and by the symmetry of shape compactness, as shown by the negative correlations Drelative Skewness vs. Integration Skewness and Fvisual Skewness vs. Integration Skewness. Hence, as far as asymmetry of integration is concerned, unbiased-dense urban grids are sensitive to both the fragmentation and compactness of the containing urban shapes. Third, unbiased-dense urban grids display the best correlations between Integration and shape measures in comparison to the other two types. There exist strong and significant negative correlations Drelative vs. Integration (figure 8f) and Drelative vs. Mean Depth, which improve for shape hulls Drelative() vs. Integration. Therefore, unlike the biased type, the effect of urban shape on the integration of unbiased-dense cities is exerted according to the compactness of urban shape; this is further improved when shape hulls are considered. As a conclusion, cities with dense and undifferentiated grids located inside compact urban areas tend to be more integrated than those located in elongated areas.
In the study of offices, the theoretical fishbone in which secondary lines intersect the main double-lined spine, was defined as the ideal type representing the underlying structure of biased office layouts, whereas the theoretical grid evenly extended in both directions was defined as the ideal type representing the underlying structure of unbiased-dense office layouts. Fishbones consistently generated into a sample of 25 actual office floorplates showed strong and significant positive correlations between Integration and shape compactness and fragmentation (figure 8i and 8j). Grids showed strong and significant negative correlations between Integration and the two shape measures (figure 8k and 8l).
At a glance, the findings about urban grids seem to partially contradict and partially reinforce the results of theoretical experiments with office floorplates. Correlations for fishbones are compared to the respective correlations for biased urban grids, while those for theoretical grids are compared to unbiased-dense urban grids. For fishbones, while the best match was the positive correlation Drelative vs. Integration (figure 8i), the respective correlation for biased urban grids is nonexistent (figure 8c). In addition, the correlation for fishbones Fconvex vs. Integration (figure 8j) entirely contradicts the respective one for biased urban grids (figure 8d).
For unbiased-dense urban grids, the strong and significant negative correlation between shape compactness and Integration (figure 8f) perfectly resembles the respective one for theoretical grids (figure 8k). The strong correlation between fragmentation and Integration for theoretical grids (figure 8l) is not matched by the poor correlation for unbiased-dense urban grids (figure 8g). However, when shape hulls are considered, a good and significant correlation is found (figure 8h).
Leaving the fishbones aside, biased urban grids resemble theoretical grids from the point of view of the affinity between shape fragmentation and grid integration (figure 8d and 8l). A closer examination of twelve urban grids which belong to the biased type reveals that their linear maps do have characteristics of grids where axial lines run mostly in two directions and cross each other to form rectangular city blocks. The bias in these grids is due to the existence of a few long connecting boulevards. These cities are thus termed “boulevard grids”. The extension of long boulevards in these cities takes advantage of long corridor strips in urban shapes that stretch along flat land or extend across bridges (e.g. Messina, Taranto,
Shpuza; Urban Shapes and Urban Grids: A Comparative Study of Adriatic and Ionian Coastal Cities
Proceedings, 6th International Space Syntax Symposium, İstanbul, 2007
009-20
Gallipoli, Makarska). The starkly decreased correlation between fragmentation and integration from actual shapes to shape hulls (figure 8d and figure 8e), shows that these urban grids are sensitive to the fragmentation of actual urban shapes, which results from the combined effect of shape hulls and the size and distribution of holes. In conclusion, biased urban grids best resemble regular orthogonal or Manhattan grids which maintain a few uninterrupted connecting spines; interruptions in the grid occurring due to indentations and holes in urban shapes.
The unbiased-dense urban grids do inhibit even more characteristics of Manhattan grids where most streets cross each other at right angles forming square-like blocks. However, in contrast to the biased type of boulevard grids, these grids maintain the uniformity in both directions and no lines extend and become distinctly more connected than others even in cities developed in elongated shapes (ex. Ortona, Argostoli). The explanation lies on the fact that these cities have developed by patching together a few orthogonal grids rotated in different directions where no single direction is favored. Thus “patched grids” maintain density, uniformity and the lack of sensitivity to shape fragmentation.
Conclusion This paper proposes a model of relating properties of urban grids to features of the bounding urban shapes. Shape and axial structure are interdependently linked as two-two-dimensional and one-two-dimensional representations of the city as a single system. The analysis with linear maps is a widely used and well-established technique in space syntax. In contrast, descriptions of shape in configurational terms are new and have mostly considered local properties or relations among parts. Three measures of compactness and fragmentation are used for describing urban form, the two fragmentation measures being interrelated. Cities display distinct characteristics from the view point of a close relationship between compactness and fragmentation of their shape hulls. This phenomenon arguably reflects the balancing dynamics between the centrality and visibility in the growth of street networks.
The analysis of urban grid has first considered the patterns of connectivities which have been argued to depict best the geometrical and topological order in grids. Three urban grid types are proposed based on degrees of connectivity and connectivity differentiation: biased grids, unbiased-sparse grids and unbiased-dense grids. The interaction between shape measures and grid integration reveals that the effect of shapes on grid is strongest according to urban types, i.e. according to the principles that underlie the grid morphology. When unbiased-sparse grids are compared to the two other types, two phenomena are observed: first that the effect of shape onto urban grids is more pronounced for biased and unbiased-dense grids; second the two types have higher grid integration. The later illustrates two ways of increasing integration in urban grids: by increasing bias and differentiation of connectivities and by increasing density of connections.
When two rather different scales of built environment of office layouts and urban grids are compared to each other, stark resemblances are exhibited: the interaction between grids and shapes, the peculiar confinement of all linear maps into a defined L-shaped zone in the field of connectivity and connectivity bias, the split into three types, and the increase of integration parallel to the increase of connectivity and connectivity bias.

Shpuza; Urban Shapes and Urban Grids: A Comparative Study of Adriatic and Ionian Coastal Cities
Proceedings, 6th International Space Syntax Symposium, İstanbul, 2007
009-21
The effect of shape on urban grids varies according to three types: In unbiased-sparse cities the asymmetry of shape compactness strongly coincides with the symmetry of the distribution of integration; Biased urban grids, termed boulevard grids, are organized according to orthogonal grid where a few lines extend to connect most other lines and where more convex and less fragmented shapes coincide with more integrated cities; Unbiased-dense grids are realized by patching different grids without favoring specific directions. In this type more compact urban shape lead to more integrated urban grids.
The findings presented here suggest foundations for formulating a theory of the interaction between urban shapes and urban grids and proposes a methodological model for bridging the two sides. The issues addressed in this paper can potentially benefit studies in urban morphology and the urban design and planning considering the continuous process of urban growth.
Acknowledgement; I would like to thank my brother Fisnik Shpuza for his help with the computer programming of the current version of Qelizë application.
References Batty, M., 2001, “Exploring Isovist Fields: Space and Shape in Architectural and Urban Morphology”, Environment and Planning (B): Planning and Design, vol. 28, pp. 123-150.
Bunge, W., 1966, Theoretical Geography, C. W. K. Gleerup, Lund.
Conroy Dalton, R., Dalton, N., 2001, “OmniVista: An Application for Isovist Field and Path Analysis”, Proceedings, 3rd International Space Syntax Symposium, Atlanta, pp. 25.1-25.10.
Doxiadis, C., 1968, “An Introduction to the Science of Human Settlements”, Ekistics, Oxford University Press, New York, pp. 527.
Hillier, B., 1989, “The Architecture of the Urban Object”, Ekistics, vol. 56, no. 334-335, pp. 5-21.
Hillier, B., 1996, Space is the Machine, Cambridge University Press, Cambridge.
Hillier, B., 1999, “The Hidden Geometry of Deformed Grids: Or, Why Space Syntax Works, When It Looks as Though It Shouldn't”, Environment and Planning B: Planning and Design, vol. 26, no. 2, pp. 169-191.
Hillier, B., Penn, A., Hanson, J., Grajewski, T., Xu, J., 1993, “Natural Movement: Or, Configuration and Attraction in Urban Pedestrian Movement”, Environment and Planning (B): Planning and Design, vol. 20, pp. 29-66.
Luu-Mau, T., 1962, “Distributions Théoriques des Distances Entre Deux Points Répartis Uniformément sur Une Surface”, J. Sutter (Ed.), Human Displacements. Measurements Methodological Aspects, pp. 173-184.
Maceachren, A., 1985, “Compactness of Geographic Shape: Comparison and Evaluation of Measures”, Geografiska Annaler. Series B, Human Geography, vol. 67, no. 1, pp. 53-67.
Peponis, J., Wineman, J., Bafna, S., Rashid, M., Kim, S.H., 1998, “On the Generation of Linear Representations of Spatial Configuration, Environment and Planning (B): Planning and Design, vol. 25, pp. 559-576.
Shpuza, E., 2001, “Floorplate Shapes as Generators of Circulation”, Proceedings, 3rd International Space Syntax Symposium, Atlanta, pp. 29.1-29.15.
Shpuza, E., 2006, “Floorplate Shapes and Office Layouts: A Model of the Effect of Floorplate Shape on Circulation Integration, PhD Thesis, College of Architecture, Georgia Institute of Technology, Atlanta, GA, http://etd.gatech.edu/theses/available/etd-03172006-111654.

Shpuza; Urban Shapes and Urban Grids: A Comparative Study of Adriatic and Ionian Coastal Cities
Proceedings, 6th International Space Syntax Symposium, İstanbul, 2007
009-22
Shpuza, E., Peponis, J., 2005, “Floorplate Shapes and Office Layouts: A Model of the Relationship Between Shape and Circulation Integration”, A. van Nes (Ed.), Proceedings, 5th International Space Syntax Symposium, TuDelft, Techne Press, Delft, vol. 2 pp. 89-102.
Shpuza, E., Peponis, J., forthcoming, “The Effect of Floorplate Shape upon Office Layout Integration”, Environment and Planning (B): Planning and Design.
Taylor, P., 1971, “Distances within Shapes: An Introduction to a Family of Finite Frequency Distributions”, Geografiska Annaler. Series B, Human Geography, vol. 53, no. 1, pp. 40-53.
Turner, A., Doxa, M., O’Sullivan, D., Penn, A., 2001, “From Isovist to Visibility Graphs: A Methodology for the Analysis of Architectural Space”, Environment and Planning (B): Planning and Design, vol. 28, pp. 103-122.
Electronic Map Sources
Cromaps, http://www.cromaps.com
Hellenic Resources Network, http://www.hri.org/info/maps
Google Earth
Grad Split, http://www.split.hr
Istra, http://www.istra.com
Mapquest, http://www.mapquest.com
Municipality of Argostoli, http://www.argostoli.gr/en
Municipality of Nafpaktos, http://www.nafpaktos.gr
Slovenian Istra, http://www.slo-istra.com
Slovenia Landmarks, http://www.burger.si
Tutto Cittá, http://www.tuttocitta.it
Venice Xplorer, http://maps.venicexplorer.net
i. The word “city” is used to refer to both cities and towns.
ii. Qelizë is a Java applet designed for the configurational analysis of shapes which can be accessed at www.morphostudio.net/qelize.
iii. The calculation of Drelative is based on the metric grid distance between two points in the shape and is measured as the ratio of the grid metric distance of the shape to the grid metric distance that would be obtained for a square of the same area. Thus, Drelative is a measure of shape compactness. The value 1 indicates a square, whereas larger values result from elongation, fragmentation and puncturing holes.
iv. Convex Fragmentation Fconvex gauges the extent to which the shape is divided into different overlapping maximal convex areas. The value 0 indicates a convex shape, whereas larger values show fragmentation in the shape due to indents, wings or holes.
v. The measure of Skewness gauges the sidedness or the symmetry of a distribution. It is based on the third moment about the mean.
vi. Measures of shape hulls are denoted with ().
vii. Capitalized words are used for variables. Lower case words refer to the common concept.