Embed Size (px)
Citation preview
Discoli, Carlos; Martini, Irene, Urban sprawl in the peri-urban areas of La Plata and its surroundings, Argentina, 44
th ISOCARP Congress 2008
1
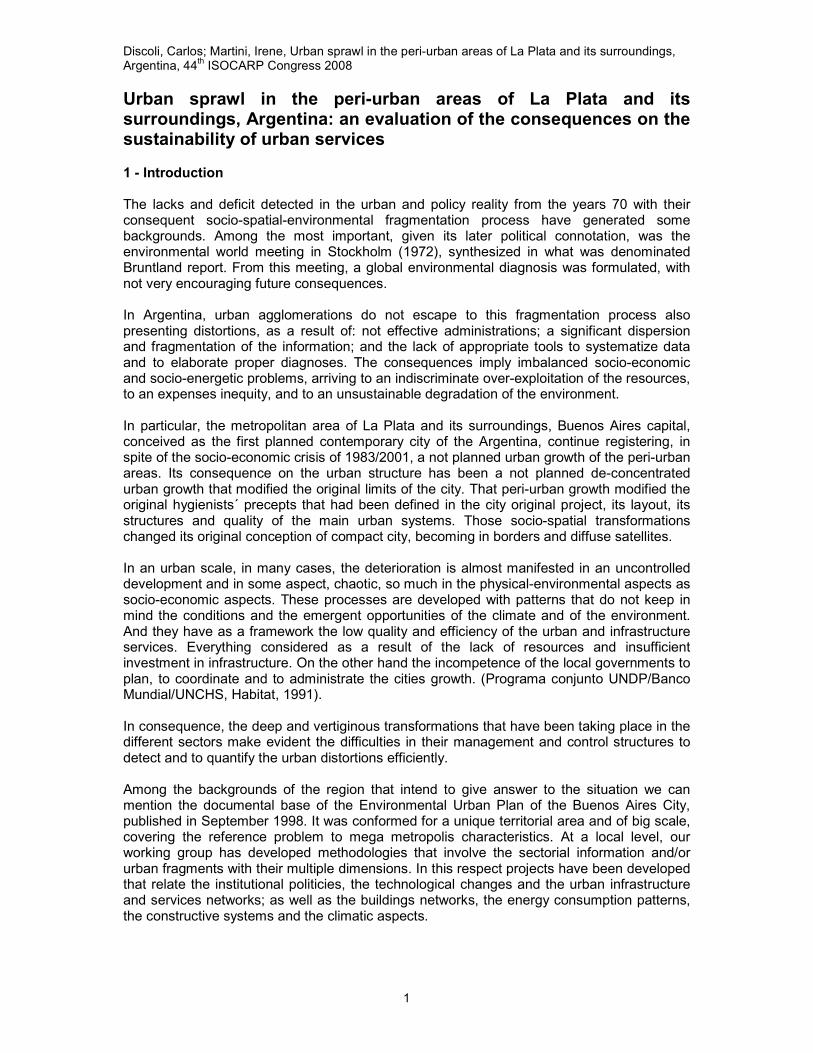
Urban sprawl in the peri-urban areas of La Plata and its surroundings, Argentina: an evaluation of the consequences on the sustainability of urban services 1 - Introduction The lacks and deficit detected in the urban and policy reality from the years 70 with their consequent socio-spatial-environmental fragmentation process have generated some backgrounds. Among the most important, given its later political connotation, was the environmental world meeting in Stockholm (1972), synthesized in what was denominated Bruntland report. From this meeting, a global environmental diagnosis was formulated, with not very encouraging future consequences. In Argentina, urban agglomerations do not escape to this fragmentation process also presenting distortions, as a result of: not effective administrations; a significant dispersion and fragmentation of the information; and the lack of appropriate tools to systematize data and to elaborate proper diagnoses. The consequences imply imbalanced socio-economic and socio-energetic problems, arriving to an indiscriminate over-exploitation of the resources, to an expenses inequity, and to an unsustainable degradation of the environment. In particular, the metropolitan area of La Plata and its surroundings, Buenos Aires capital, conceived as the first planned contemporary city of the Argentina, continue registering, in spite of the socio-economic crisis of 1983/2001, a not planned urban growth of the peri-urban areas. Its consequence on the urban structure has been a not planned de-concentrated urban growth that modified the original limits of the city. That peri-urban growth modified the original hygienists´ precepts that had been defined in the city original project, its layout, its structures and quality of the main urban systems. Those socio-spatial transformations changed its original conception of compact city, becoming in borders and diffuse satellites. In an urban scale, in many cases, the deterioration is almost manifested in an uncontrolled development and in some aspect, chaotic, so much in the physical-environmental aspects as socio-economic aspects. These processes are developed with patterns that do not keep in mind the conditions and the emergent opportunities of the climate and of the environment. And they have as a framework the low quality and efficiency of the urban and infrastructure services. Everything considered as a result of the lack of resources and insufficient investment in infrastructure. On the other hand the incompetence of the local governments to plan, to coordinate and to administrate the cities growth. (Programa conjunto UNDP/Banco Mundial/UNCHS, Habitat, 1991). In consequence, the deep and vertiginous transformations that have been taking place in the different sectors make evident the difficulties in their management and control structures to detect and to quantify the urban distortions efficiently. Among the backgrounds of the region that intend to give answer to the situation we can mention the documental base of the Environmental Urban Plan of the Buenos Aires City, published in September 1998. It was conformed for a unique territorial area and of big scale, covering the reference problem to mega metropolis characteristics. At a local level, our working group has developed methodologies that involve the sectorial information and/or urban fragments with their multiple dimensions. In this respect projects have been developed that relate the institutional politicies, the technological changes and the urban infrastructure and services networks; as well as the buildings networks, the energy consumption patterns, the constructive systems and the climatic aspects.
Discoli, Carlos; Martini, Irene, Urban sprawl in the peri-urban areas of La Plata and its surroundings, Argentina, 44
th ISOCARP Congress 2008
2
In this context a methodology has been developed and implemented in which convergent strategies of analysis intervene pointing to a common objective (Discoli, C. et al. 2006). The development and implementation of different techniques and models, allowed us to relate the variables diversity from the environment and urban life quality point of view. We purpose to transform the traditional point of view through the incorporation of models for policy instrumentation; and the inclusion of innovative actions that tend to generate structural changes in the global framework of what is denominated “healthy environmental cities”. These goals are in consonance with those elaborated initially in the World Conference on Environment and Development, Rio ´92, where the XXI Agenda was approved, in the framework of the sustainable development at a global scale. Here, the importance of developing appropriate methodologies was outlined for the proper realization of diagnostic, evaluation and adoption of decisions, to restate alternative stages and to reformulate energy policies. (Conferencia Mundial sobre Medio Ambiente, Agenda XXI. 1992). In a complementary way, the macro variables are studied according to the approaches of the World Health Organization criterion, where the population is identified with the culture, the economy and the environment. This work proposes to analyze the main variables, in particular the socio-energetic ones, its socio-spatial consequences and the users´ opinion on the phenomena involved in a quali-quantitative model of urban life quality (Discoli, C. 2007a, Discoli, C. 2007b). Quality maps of homogeneous areas are conformed that identify the urban services offer through the infrastructure, its covering, as well as the demand requirements taking into account the inhabitants perception. As a result of the work, areas with a bigger urban vulnerability are presented, as a consequence of the urban sprawl in agreement with the biggest lacks of urban control. This confirms the trajectory of growing unsustainability that we have detected in this agglomeration. We conclude that the appropriate answer would correspond to a planning that includes quali-quantitive models that contemplate the urban and environmental aspects integration. 2 – Urban sprawl and its consequence on the sustainability of urban services. We propose to evaluate, with an urban life quality model, areas with urban vulnerability, consequence of the urban sprawl. In this way, we propose to study the following aspects:
- Residential sector: consists on evaluating the occupation in the territory, and their evolution taking into account their growth and their energy needs;
- Basic infrastructure services: they are related to cover the urban energy demand (Electric power and Natural Gas), obtaining profiles represented in maps with quality levels of each service, where the offer is related through qualities that characterize it and coverings of each network with the users opinion (the demand).
Basic answers are developed, in order to show the utilized methodology, and its potentiality as for the possible answers diversity. 2.1. Residential sector The population in general is asymmetrically distributed in the territory, and its occupation degree and settlements’ levels are considered in what we denominate the Residential sector. Its conformation and its distribution in the territory, is proposed to be analyzed pointing out the consolidation characteristics and the socio-energetic structure.
Discoli, Carlos; Martini, Irene, Urban sprawl in the peri-urban areas of La Plata and its surroundings, Argentina, 44
th ISOCARP Congress 2008
3
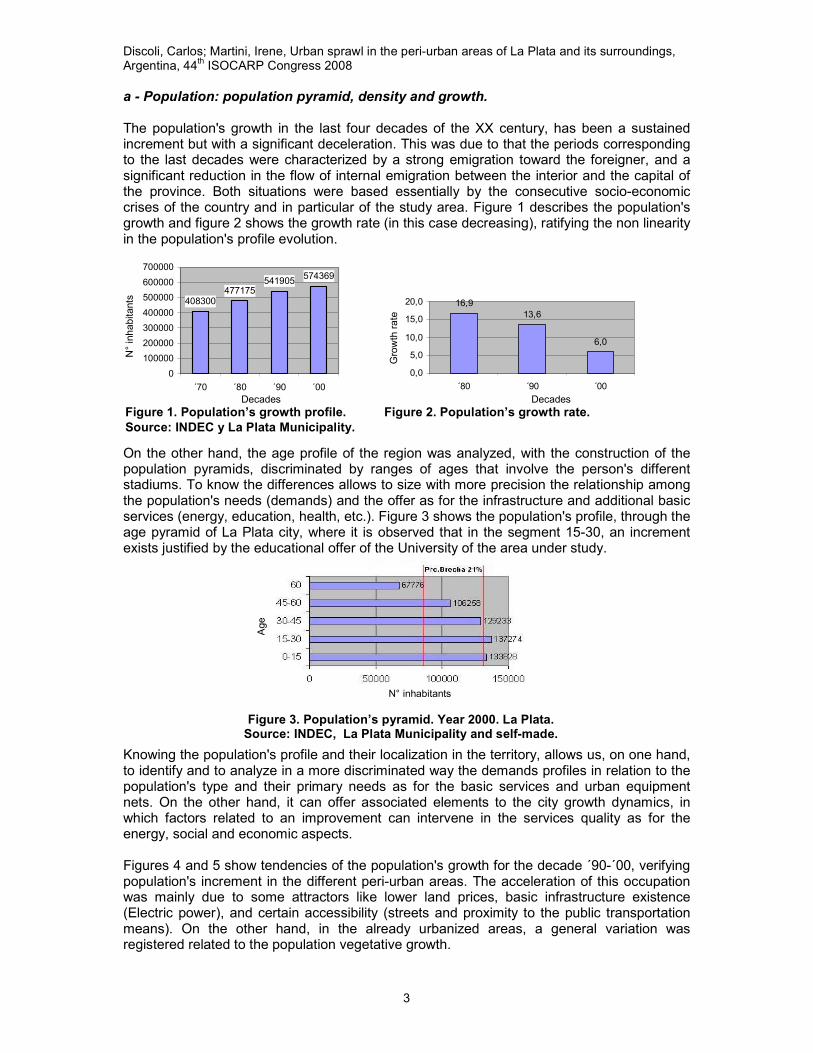
a - Population: population pyramid, density and growth. The population's growth in the last four decades of the XX century, has been a sustained increment but with a significant deceleration. This was due to that the periods corresponding to the last decades were characterized by a strong emigration toward the foreigner, and a significant reduction in the flow of internal emigration between the interior and the capital of the province. Both situations were based essentially by the consecutive socio-economic crises of the country and in particular of the study area. Figure 1 describes the population's growth and figure 2 shows the growth rate (in this case decreasing), ratifying the non linearity in the population's profile evolution.
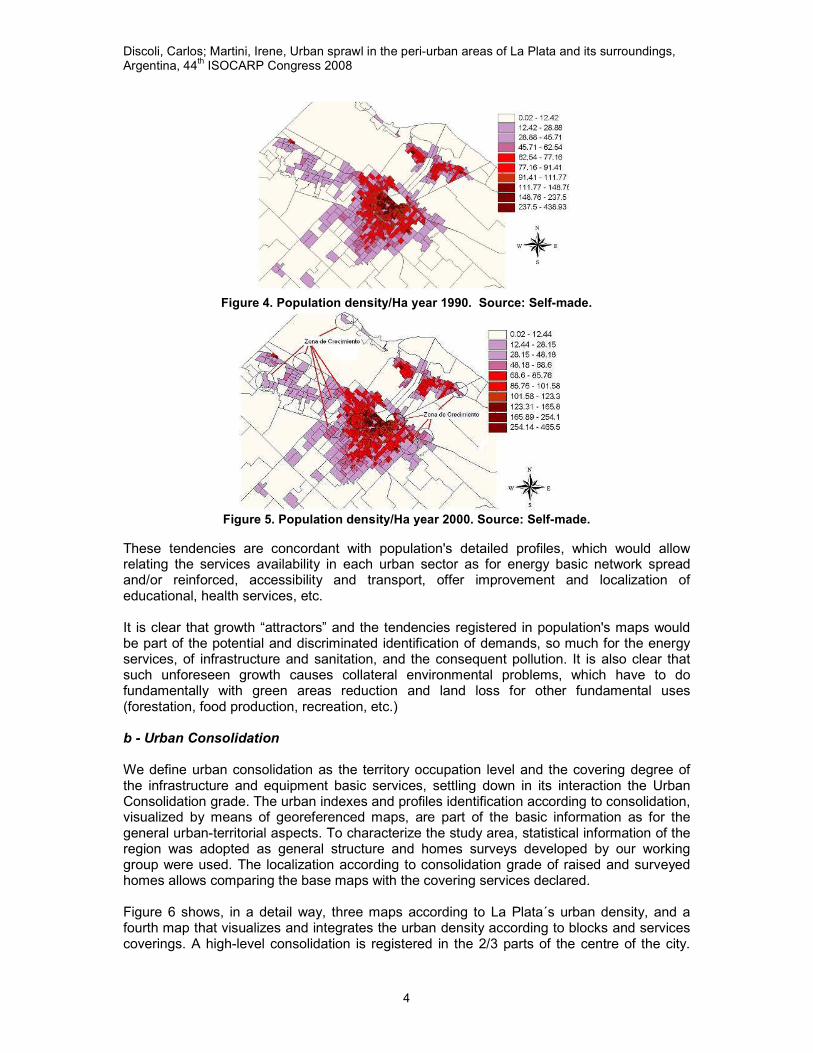
On the other hand, the age profile of the region was analyzed, with the construction of the population pyramids, discriminated by ranges of ages that involve the person's different stadiums. To know the differences allows to size with more precision the relationship among the population's needs (demands) and the offer as for the infrastructure and additional basic services (energy, education, health, etc.). Figure 3 shows the population's profile, through the age pyramid of La Plata city, where it is observed that in the segment 15-30, an increment exists justified by the educational offer of the University of the area under study.
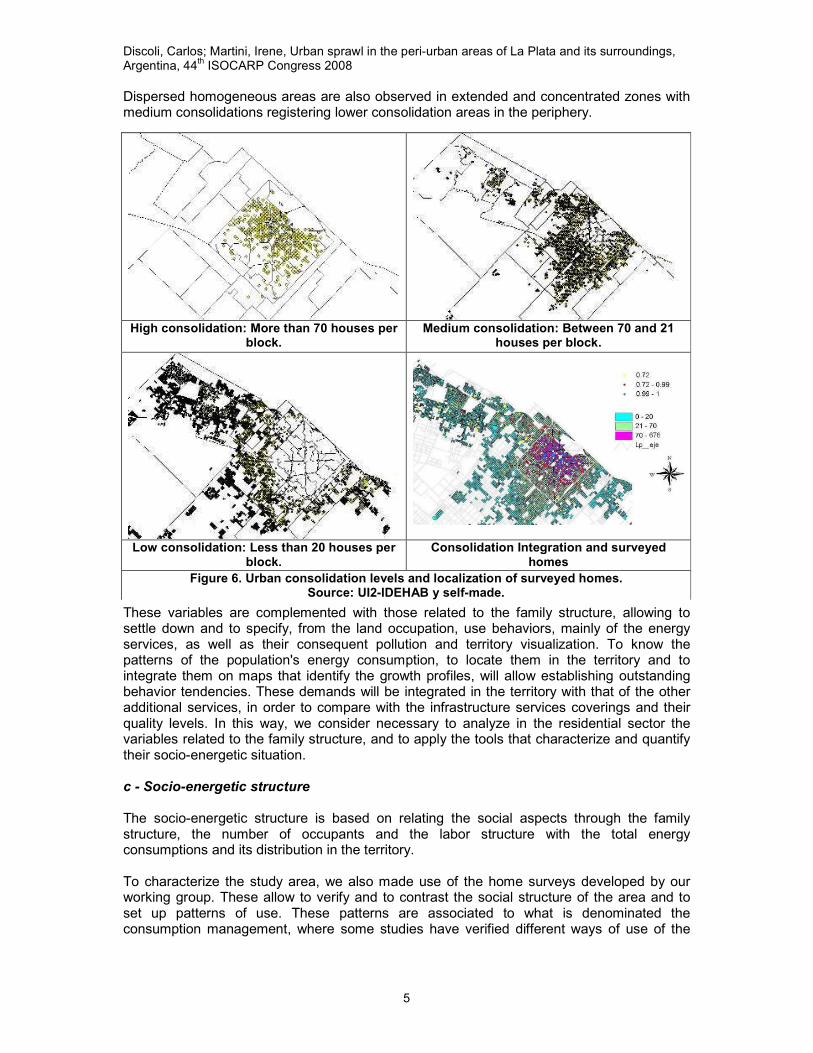
Knowing the population's profile and their localization in the territory, allows us, on one hand, to identify and to analyze in a more discriminated way the demands profiles in relation to the population's type and their primary needs as for the basic services and urban equipment nets. On the other hand, it can offer associated elements to the city growth dynamics, in which factors related to an improvement can intervene in the services quality as for the energy, social and economic aspects. Figures 4 and 5 show tendencies of the population's growth for the decade ´90-´00, verifying population's increment in the different peri-urban areas. The acceleration of this occupation was mainly due to some attractors like lower land prices, basic infrastructure existence (Electric power), and certain accessibility (streets and proximity to the public transportation means). On the other hand, in the already urbanized areas, a general variation was registered related to the population vegetative growth.
408300477175
541905574369
0
100000
200000
300000
400000
500000
600000
700000
´70 ´80 ´90 ´00
16,9
13,6
6,0
0,0
5,0
10,0
15,0
20,0
´80 ´90 ´00 Decades Decades Figure 1. Population’s growth profile. Figure 2. Population’s growth rate.
Source: INDEC y La Plata Municipality.
N° inhabitants
Growth rate
Figure 3. Population’s pyramid. Year 2000. La Plata. Source: INDEC, La Plata Municipality and self-made.
N° inhabitants
Age
Discoli, Carlos; Martini, Irene, Urban sprawl in the peri-urban areas of La Plata and its surroundings, Argentina, 44
th ISOCARP Congress 2008
4
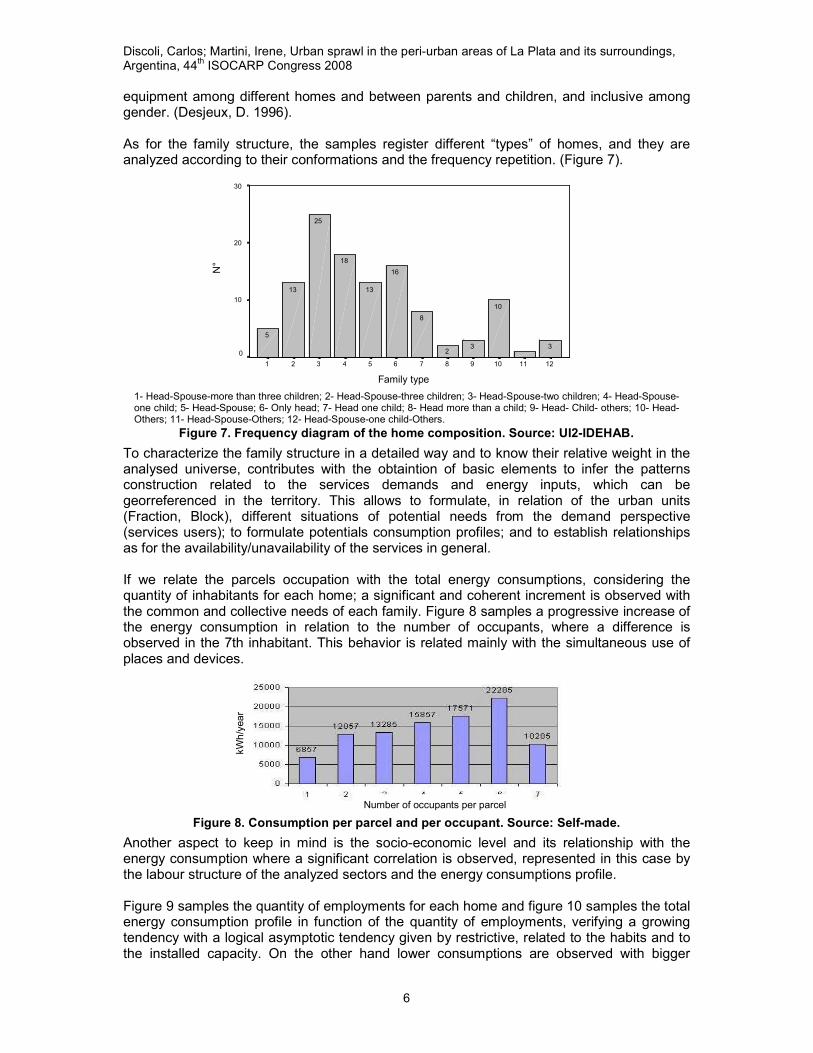
These tendencies are concordant with population's detailed profiles, which would allow relating the services availability in each urban sector as for energy basic network spread and/or reinforced, accessibility and transport, offer improvement and localization of educational, health services, etc. It is clear that growth “attractors” and the tendencies registered in population's maps would be part of the potential and discriminated identification of demands, so much for the energy services, of infrastructure and sanitation, and the consequent pollution. It is also clear that such unforeseen growth causes collateral environmental problems, which have to do fundamentally with green areas reduction and land loss for other fundamental uses (forestation, food production, recreation, etc.) b - Urban Consolidation We define urban consolidation as the territory occupation level and the covering degree of the infrastructure and equipment basic services, settling down in its interaction the Urban Consolidation grade. The urban indexes and profiles identification according to consolidation, visualized by means of georeferenced maps, are part of the basic information as for the general urban-territorial aspects. To characterize the study area, statistical information of the region was adopted as general structure and homes surveys developed by our working group were used. The localization according to consolidation grade of raised and surveyed homes allows comparing the base maps with the covering services declared. Figure 6 shows, in a detail way, three maps according to La Plata´s urban density, and a fourth map that visualizes and integrates the urban density according to blocks and services coverings. A high-level consolidation is registered in the 2/3 parts of the centre of the city.
Figure 4. Population density/Ha year 1990. Source: Self-made.
Figure 5. Population density/Ha year 2000. Source: Self-made.
Discoli, Carlos; Martini, Irene, Urban sprawl in the peri-urban areas of La Plata and its surroundings, Argentina, 44
th ISOCARP Congress 2008
5
Dispersed homogeneous areas are also observed in extended and concentrated zones with medium consolidations registering lower consolidation areas in the periphery.
These variables are complemented with those related to the family structure, allowing to settle down and to specify, from the land occupation, use behaviors, mainly of the energy services, as well as their consequent pollution and territory visualization. To know the patterns of the population's energy consumption, to locate them in the territory and to integrate them on maps that identify the growth profiles, will allow establishing outstanding behavior tendencies. These demands will be integrated in the territory with that of the other additional services, in order to compare with the infrastructure services coverings and their quality levels. In this way, we consider necessary to analyze in the residential sector the variables related to the family structure, and to apply the tools that characterize and quantify their socio-energetic situation. c - Socio-energetic structure The socio-energetic structure is based on relating the social aspects through the family structure, the number of occupants and the labor structure with the total energy consumptions and its distribution in the territory. To characterize the study area, we also made use of the home surveys developed by our working group. These allow to verify and to contrast the social structure of the area and to set up patterns of use. These patterns are associated to what is denominated the consumption management, where some studies have verified different ways of use of the
High consolidation: More than 70 houses per block.
Medium consolidation: Between 70 and 21 houses per block.
Low consolidation: Less than 20 houses per block.
Consolidation Integration and surveyed homes
Figure 6. Urban consolidation levels and localization of surveyed homes. Source: UI2-IDEHAB y self-made.
Discoli, Carlos; Martini, Irene, Urban sprawl in the peri-urban areas of La Plata and its surroundings, Argentina, 44
th ISOCARP Congress 2008
6
equipment among different homes and between parents and children, and inclusive among gender. (Desjeux, D. 1996). As for the family structure, the samples register different “types” of homes, and they are analyzed according to their conformations and the frequency repetition. (Figure 7).
To characterize the family structure in a detailed way and to know their relative weight in the analysed universe, contributes with the obtaintion of basic elements to infer the patterns construction related to the services demands and energy inputs, which can be georreferenced in the territory. This allows to formulate, in relation of the urban units (Fraction, Block), different situations of potential needs from the demand perspective (services users); to formulate potentials consumption profiles; and to establish relationships as for the availability/unavailability of the services in general. If we relate the parcels occupation with the total energy consumptions, considering the quantity of inhabitants for each home; a significant and coherent increment is observed with the common and collective needs of each family. Figure 8 samples a progressive increase of the energy consumption in relation to the number of occupants, where a difference is observed in the 7th inhabitant. This behavior is related mainly with the simultaneous use of places and devices.
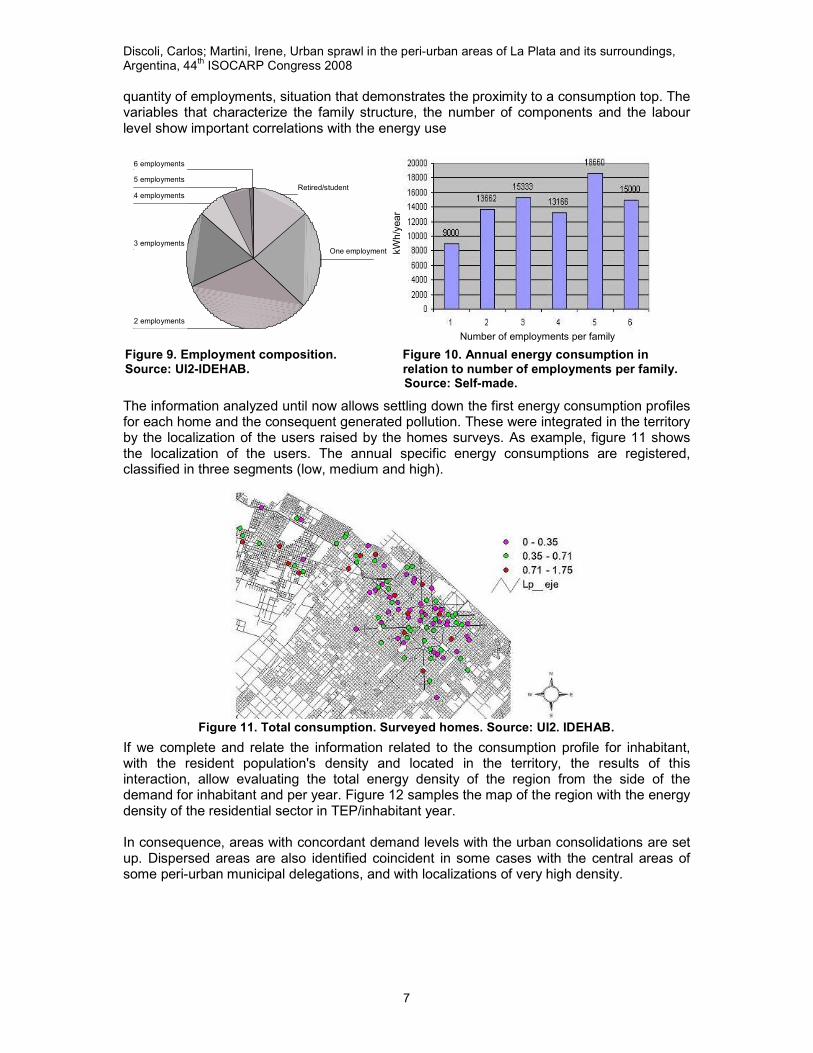
Another aspect to keep in mind is the socio-economic level and its relationship with the energy consumption where a significant correlation is observed, represented in this case by the labour structure of the analyzed sectors and the energy consumptions profile. Figure 9 samples the quantity of employments for each home and figure 10 samples the total energy consumption profile in function of the quantity of employments, verifying a growing tendency with a logical asymptotic tendency given by restrictive, related to the habits and to the installed capacity. On the other hand lower consumptions are observed with bigger
121110987654321
30
20
10
03
10
32
8
16
13
18
25
13
5
1- Head-Spouse-more than three children; 2- Head-Spouse-three children; 3- Head-Spouse-two children; 4- Head-Spouse-one child; 5- Head-Spouse; 6- Only head; 7- Head one child; 8- Head more than a child; 9- Head- Child- others; 10- Head- Others; 11- Head-Spouse-Others; 12- Head-Spouse-one child-Others.
Figure 7. Frequency diagram of the home composition. Source: UI2-IDEHAB.
Figure 8. Consumption per parcel and per occupant. Source: Self-made.
N°
Family type
kWh/year
Number of occupants per parcel
Discoli, Carlos; Martini, Irene, Urban sprawl in the peri-urban areas of La Plata and its surroundings, Argentina, 44
th ISOCARP Congress 2008
7
quantity of employments, situation that demonstrates the proximity to a consumption top. The variables that characterize the family structure, the number of components and the labour level show important correlations with the energy use
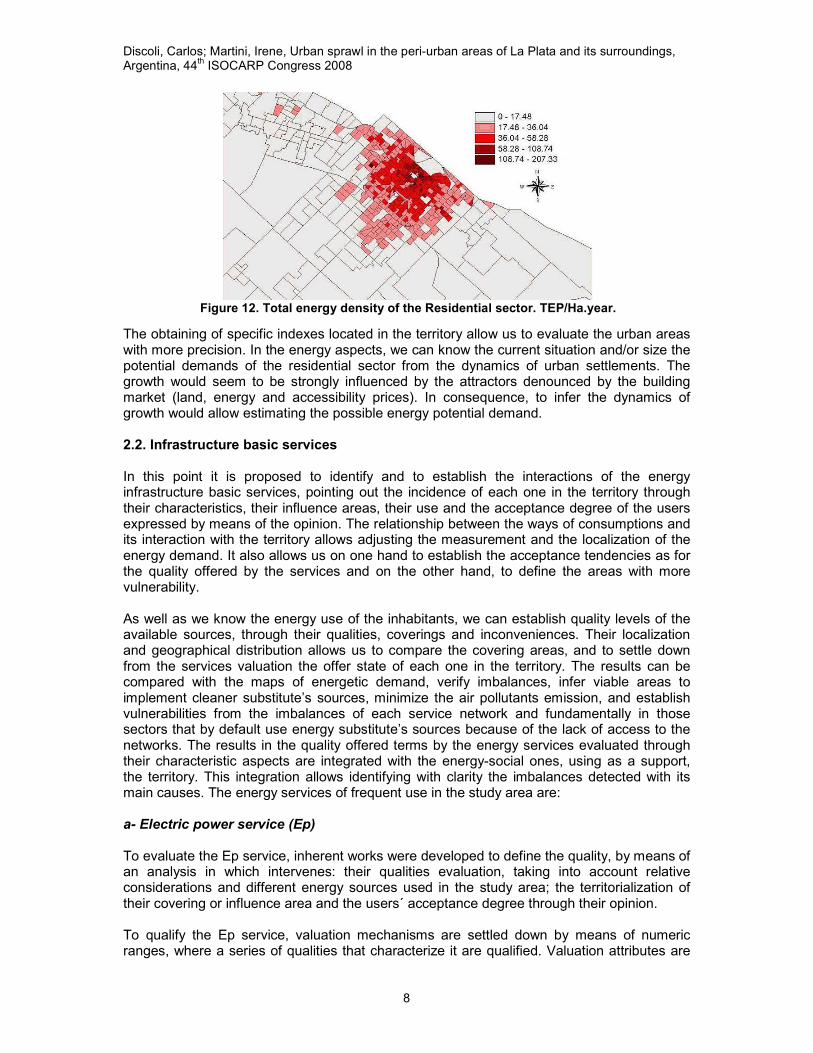
The information analyzed until now allows settling down the first energy consumption profiles for each home and the consequent generated pollution. These were integrated in the territory by the localization of the users raised by the homes surveys. As example, figure 11 shows the localization of the users. The annual specific energy consumptions are registered, classified in three segments (low, medium and high).
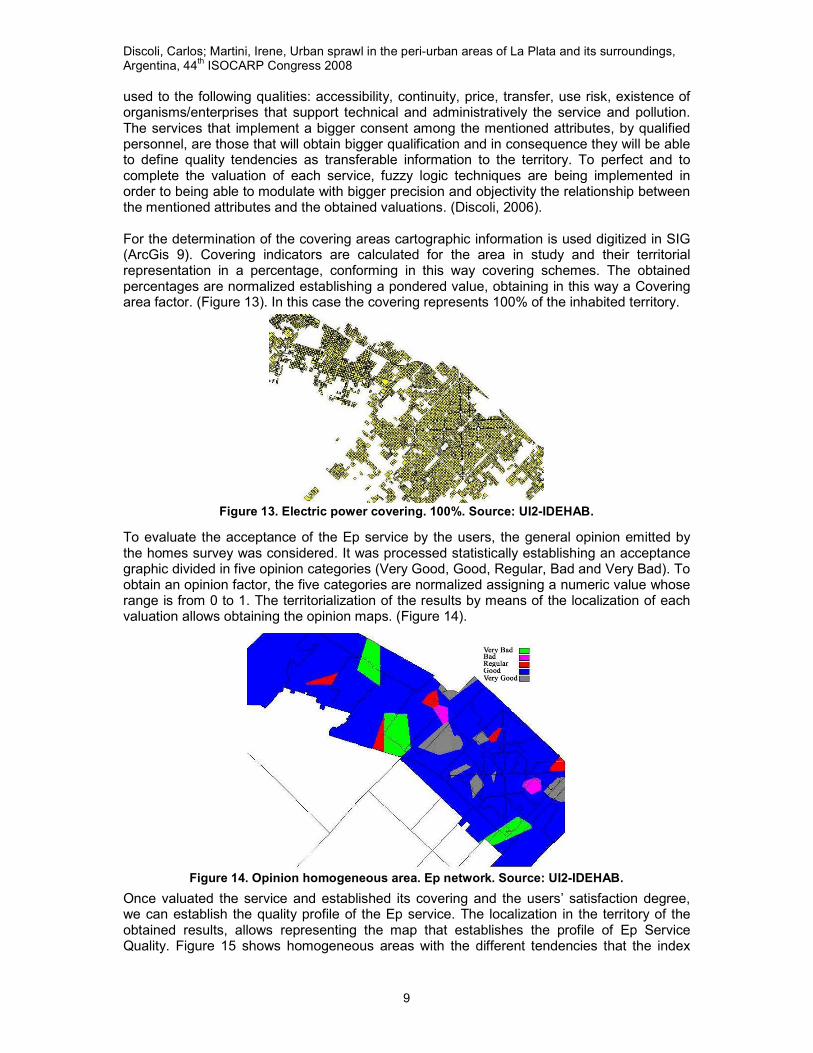
If we complete and relate the information related to the consumption profile for inhabitant, with the resident population's density and located in the territory, the results of this interaction, allow evaluating the total energy density of the region from the side of the demand for inhabitant and per year. Figure 12 samples the map of the region with the energy density of the residential sector in TEP/inhabitant year. In consequence, areas with concordant demand levels with the urban consolidations are set up. Dispersed areas are also identified coincident in some cases with the central areas of some peri-urban municipal delegations, and with localizations of very high density.
Figure 11. Total consumption. Surveyed homes. Source: UI2. IDEHAB.
6 Trabajos
5 Trabajos
4 Trabajos
3 Trabajos
2 Trabajos
1 Trabajo
Jubilado/Estudiante
Figure 9. Employment composition. Figure 10. Annual energy consumption in Source: UI2-IDEHAB. relation to number of employments per family. Source: Self-made.
6 employments
5 employments
4 employments
3 employments
2 employments
One employment
Retired/student
kWh/year
Number of employments per family
Discoli, Carlos; Martini, Irene, Urban sprawl in the peri-urban areas of La Plata and its surroundings, Argentina, 44
th ISOCARP Congress 2008
8
The obtaining of specific indexes located in the territory allow us to evaluate the urban areas with more precision. In the energy aspects, we can know the current situation and/or size the potential demands of the residential sector from the dynamics of urban settlements. The growth would seem to be strongly influenced by the attractors denounced by the building market (land, energy and accessibility prices). In consequence, to infer the dynamics of growth would allow estimating the possible energy potential demand. 2.2. Infrastructure basic services In this point it is proposed to identify and to establish the interactions of the energy infrastructure basic services, pointing out the incidence of each one in the territory through their characteristics, their influence areas, their use and the acceptance degree of the users expressed by means of the opinion. The relationship between the ways of consumptions and its interaction with the territory allows adjusting the measurement and the localization of the energy demand. It also allows us on one hand to establish the acceptance tendencies as for the quality offered by the services and on the other hand, to define the areas with more vulnerability. As well as we know the energy use of the inhabitants, we can establish quality levels of the available sources, through their qualities, coverings and inconveniences. Their localization and geographical distribution allows us to compare the covering areas, and to settle down from the services valuation the offer state of each one in the territory. The results can be compared with the maps of energetic demand, verify imbalances, infer viable areas to implement cleaner substitute’s sources, minimize the air pollutants emission, and establish vulnerabilities from the imbalances of each service network and fundamentally in those sectors that by default use energy substitute’s sources because of the lack of access to the networks. The results in the quality offered terms by the energy services evaluated through their characteristic aspects are integrated with the energy-social ones, using as a support, the territory. This integration allows identifying with clarity the imbalances detected with its main causes. The energy services of frequent use in the study area are: a- Electric power service (Ep) To evaluate the Ep service, inherent works were developed to define the quality, by means of an analysis in which intervenes: their qualities evaluation, taking into account relative considerations and different energy sources used in the study area; the territorialization of their covering or influence area and the users´ acceptance degree through their opinion. To qualify the Ep service, valuation mechanisms are settled down by means of numeric ranges, where a series of qualities that characterize it are qualified. Valuation attributes are
Figure 12. Total energy density of the Residential sector. TEP/Ha.year.
Discoli, Carlos; Martini, Irene, Urban sprawl in the peri-urban areas of La Plata and its surroundings, Argentina, 44
th ISOCARP Congress 2008
9
used to the following qualities: accessibility, continuity, price, transfer, use risk, existence of organisms/enterprises that support technical and administratively the service and pollution. The services that implement a bigger consent among the mentioned attributes, by qualified personnel, are those that will obtain bigger qualification and in consequence they will be able to define quality tendencies as transferable information to the territory. To perfect and to complete the valuation of each service, fuzzy logic techniques are being implemented in order to being able to modulate with bigger precision and objectivity the relationship between the mentioned attributes and the obtained valuations. (Discoli, 2006). For the determination of the covering areas cartographic information is used digitized in SIG (ArcGis 9). Covering indicators are calculated for the area in study and their territorial representation in a percentage, conforming in this way covering schemes. The obtained percentages are normalized establishing a pondered value, obtaining in this way a Covering area factor. (Figure 13). In this case the covering represents 100% of the inhabited territory.
To evaluate the acceptance of the Ep service by the users, the general opinion emitted by the homes survey was considered. It was processed statistically establishing an acceptance graphic divided in five opinion categories (Very Good, Good, Regular, Bad and Very Bad). To obtain an opinion factor, the five categories are normalized assigning a numeric value whose range is from 0 to 1. The territorialization of the results by means of the localization of each valuation allows obtaining the opinion maps. (Figure 14).
Once valuated the service and established its covering and the users’ satisfaction degree, we can establish the quality profile of the Ep service. The localization in the territory of the obtained results, allows representing the map that establishes the profile of Ep Service Quality. Figure 15 shows homogeneous areas with the different tendencies that the index
Figure 13. Electric power covering. 100%. Source: UI2-IDEHAB.
Figure 14. Opinion homogeneous area. Ep network. Source: UI2-IDEHAB.
Discoli, Carlos; Martini, Irene, Urban sprawl in the peri-urban areas of La Plata and its surroundings, Argentina, 44
th ISOCARP Congress 2008
10
had registered, settling down urban areas with coincident inequities with the urban sprawl. (Discoli, 2006).
b- Natural Gas service (NG). The evaluation of this service in quality terms is carried out under the same criterion explained in the Ep service. The energy source is qualified through valuing its qualities whose result is affected with the covering factor corresponding to the network spread, and with the users’ acceptance degree. As for the NG service qualities we consider the same ones that in the Ep service, and their evaluation responds to the same criterions. With regard to the covering area, their distribution network affect at the moment to the 87% of the consolidated population. (Figures 16).
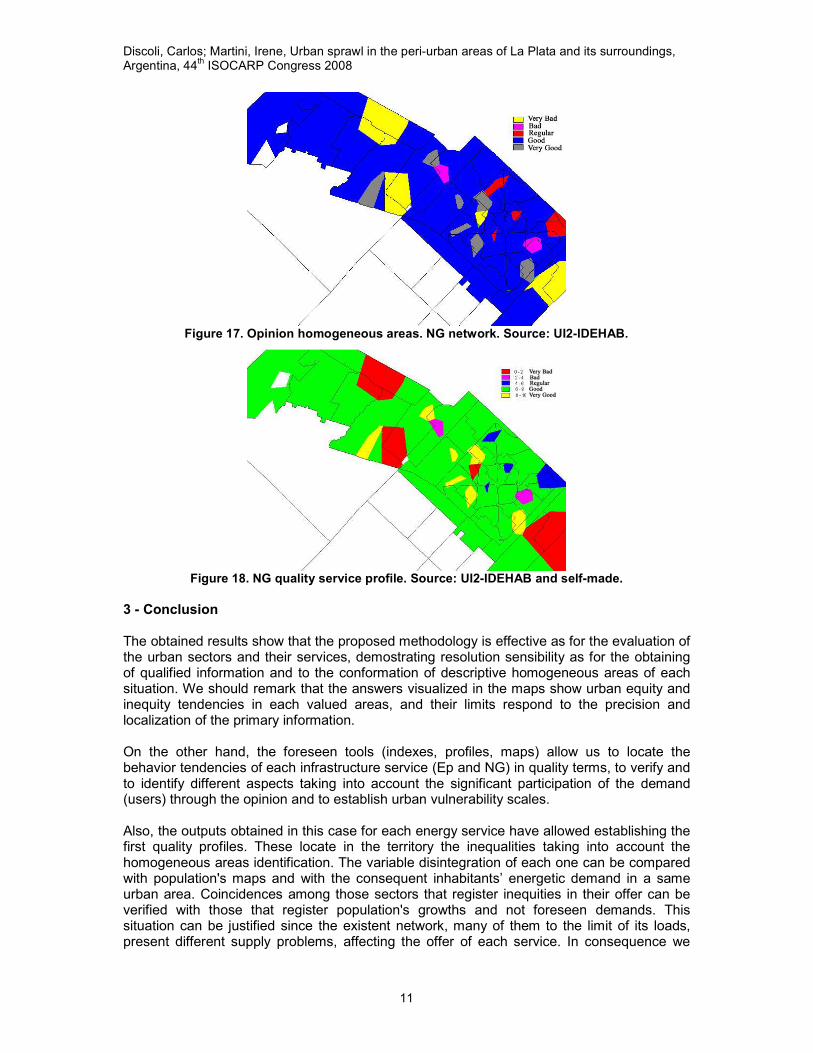
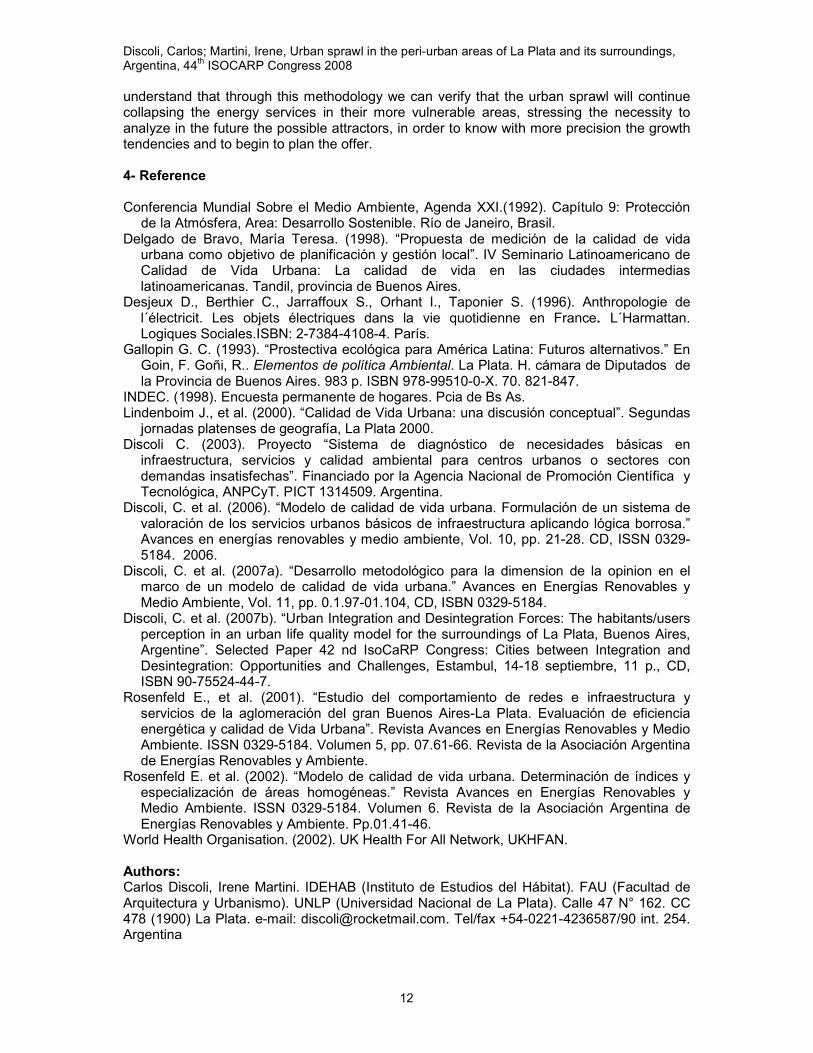
The acceptance of the NG service was evaluated through the users general opinion, the homes survey was statistically processed and the sample was expanded territorially obtaining the standard opinion factor. (Figure 17). As well as for the Ep service, the NG service quality profile was obtained. Its localization in the territory, allows representing the map that establishes the profile in terms of NG Service Quality. (Figure 18). The areas that register less services covering are coincident to the Ep service, with the population's growth areas. The obtained results show tendencies in each valued area which can be reverted through its identification.
Figure 16. NG covering. 87%. Source: UI2-IDEHAB and self-made.
Figure 15. Ep quality service profile. Source: UI2-IDEHAB and self-made.
Discoli, Carlos; Martini, Irene, Urban sprawl in the peri-urban areas of La Plata and its surroundings, Argentina, 44
th ISOCARP Congress 2008
11
Figure 18. NG quality service profile. Source: UI2-IDEHAB and self-made.
3 - Conclusion The obtained results show that the proposed methodology is effective as for the evaluation of the urban sectors and their services, demostrating resolution sensibility as for the obtaining of qualified information and to the conformation of descriptive homogeneous areas of each situation. We should remark that the answers visualized in the maps show urban equity and inequity tendencies in each valued areas, and their limits respond to the precision and localization of the primary information. On the other hand, the foreseen tools (indexes, profiles, maps) allow us to locate the behavior tendencies of each infrastructure service (Ep and NG) in quality terms, to verify and to identify different aspects taking into account the significant participation of the demand (users) through the opinion and to establish urban vulnerability scales. Also, the outputs obtained in this case for each energy service have allowed establishing the first quality profiles. These locate in the territory the inequalities taking into account the homogeneous areas identification. The variable disintegration of each one can be compared with population's maps and with the consequent inhabitants’ energetic demand in a same urban area. Coincidences among those sectors that register inequities in their offer can be verified with those that register population's growths and not foreseen demands. This situation can be justified since the existent network, many of them to the limit of its loads, present different supply problems, affecting the offer of each service. In consequence we
Figure 17. Opinion homogeneous areas. NG network. Source: UI2-IDEHAB.
Discoli, Carlos; Martini, Irene, Urban sprawl in the peri-urban areas of La Plata and its surroundings, Argentina, 44
th ISOCARP Congress 2008
12
understand that through this methodology we can verify that the urban sprawl will continue collapsing the energy services in their more vulnerable areas, stressing the necessity to analyze in the future the possible attractors, in order to know with more precision the growth tendencies and to begin to plan the offer. 4- Reference Conferencia Mundial Sobre el Medio Ambiente, Agenda XXI.(1992). Capítulo 9: Protección de la Atmósfera, Area: Desarrollo Sostenible. Río de Janeiro, Brasil.
Delgado de Bravo, María Teresa. (1998). “Propuesta de medición de la calidad de vida urbana como objetivo de planificación y gestión local”. IV Seminario Latinoamericano de Calidad de Vida Urbana: La calidad de vida en las ciudades intermedias latinoamericanas. Tandil, provincia de Buenos Aires.
Desjeux D., Berthier C., Jarraffoux S., Orhant I., Taponier S. (1996). Anthropologie de l´électricit. Les objets électriques dans la vie quotidienne en France. L´Harmattan. Logiques Sociales.ISBN: 2-7384-4108-4. París.
Gallopin G. C. (1993). “Prostectiva ecológica para América Latina: Futuros alternativos.” En Goin, F. Goñi, R.. Elementos de política Ambiental. La Plata. H. cámara de Diputados de la Provincia de Buenos Aires. 983 p. ISBN 978-99510-0-X. 70. 821-847.
INDEC. (1998). Encuesta permanente de hogares. Pcia de Bs As. Lindenboim J., et al. (2000). “Calidad de Vida Urbana: una discusión conceptual”. Segundas jornadas platenses de geografía, La Plata 2000.
Discoli C. (2003). Proyecto “Sistema de diagnóstico de necesidades básicas en infraestructura, servicios y calidad ambiental para centros urbanos o sectores con demandas insatisfechas”. Financiado por la Agencia Nacional de Promoción Científica y Tecnológica, ANPCyT. PICT 1314509. Argentina.
Discoli, C. et al. (2006). “Modelo de calidad de vida urbana. Formulación de un sistema de valoración de los servicios urbanos básicos de infraestructura aplicando lógica borrosa.” Avances en energías renovables y medio ambiente, Vol. 10, pp. 21-28. CD, ISSN 0329-5184. 2006.
Discoli, C. et al. (2007a). “Desarrollo metodológico para la dimension de la opinion en el marco de un modelo de calidad de vida urbana.” Avances en Energías Renovables y Medio Ambiente, Vol. 11, pp. 0.1.97-01.104, CD, ISBN 0329-5184.
Discoli, C. et al. (2007b). “Urban Integration and Desintegration Forces: The habitants/users perception in an urban life quality model for the surroundings of La Plata, Buenos Aires, Argentine”. Selected Paper 42 nd IsoCaRP Congress: Cities between Integration and Desintegration: Opportunities and Challenges, Estambul, 14-18 septiembre, 11 p., CD, ISBN 90-75524-44-7.
Rosenfeld E., et al. (2001). “Estudio del comportamiento de redes e infraestructura y servicios de la aglomeración del gran Buenos Aires-La Plata. Evaluación de eficiencia energética y calidad de Vida Urbana”. Revista Avances en Energías Renovables y Medio Ambiente. ISSN 0329-5184. Volumen 5, pp. 07.61-66. Revista de la Asociación Argentina de Energías Renovables y Ambiente.
Rosenfeld E. et al. (2002). “Modelo de calidad de vida urbana. Determinación de índices y especialización de áreas homogéneas.” Revista Avances en Energías Renovables y Medio Ambiente. ISSN 0329-5184. Volumen 6. Revista de la Asociación Argentina de Energías Renovables y Ambiente. Pp.01.41-46.
World Health Organisation. (2002). UK Health For All Network, UKHFAN.
Authors: Carlos Discoli, Irene Martini. IDEHAB (Instituto de Estudios del Hábitat). FAU (Facultad de Arquitectura y Urbanismo). UNLP (Universidad Nacional de La Plata). Calle 47 N° 162. CC 478 (1900) La Plata. e-mail: [email protected]. Tel/fax +54-0221-4236587/90 int. 254. Argentina


![Urban Sprawl[Date] Today I will: Know the causes, problems and solutions to Urban Sprawl](https://img.pdfslide.net/doc/110x75/568166eb550346895ddb35ac/urban-sprawldate-today-i-will-know-the-causes-problems-and-solutions-to.jpg)