Embed Size (px)
Citation preview
Urban Texture Analysis with Image ProcessingTechniques
Carlo Ratti and Paul RichensThe Martin Centre for Architectural and Urban Studies, University of Cambridge. UK
Key words: urban texture, image processing, urban environmental analysis, urbanmorphology, cellular automata.
Abstract: A new paradigm for investigating the environmental consequences of urbantexture is proposed. Using raster-based models and software algorithmsderived from image processing, efficient methods of measuring geometricparameters and predicting radiation exchange are developed. The possibilitiesof generating synthetic urban textures, and integrating cellular automata, areexplored. Results suggest the possibility of a raster-based urban model toinform planning and design.
1. INTRODUCTION
Over the past decades, many computer tools have been developed to assist in theenvironmental design of individual buildings. Heat, light, sound and especiallyenergy consumption can be analysed in many different packages.
This is not generally true for urban design, especially at the medium scale.Although it is widely assumed that urban texture - the pattern of streets, buildingheights, open spaces and so on – will determine environmental quality both in thebuildings and outside – tools for investigating the connections are sparse. The needfor medium-scale understanding is confirmed by Givoni (1989): "The outdoortemperature, wind speed and solar radiation to which an individual building isexposed is not the regional 'synoptic' climate, but the local microclimate as modifiedby the 'structure' of the city, mainly of the neighbourhood where the building islocated”.
50 CAAD futures Digital Proceedings 1999
Apart from Hillier’s (1996) Space-Syntax techniques for investigating urbanconfiguration, there is a lack of tools to connect urban texture to the resulting urbanquality. This is partly due to difficulties in describing the urban environment. Therepresentation of the city needs “a geometry of order on many scales, a geometry oforganised complexities” - state Batty and Lonely (1994), subsequently arguing forthe replacement of traditional Euclidean geometry with Fractal geometry. Extendingarchitectural analysis software to the urban scale fails because of the problems ofbuilding precise geometric models, and the difficulties of processing, as the time islikely to depend on the square of the number of geometric elements.
Our interest is in using very simple raster models of urban form. By borrowingtechniques from image processing, we have been able to develop a range ofpromising algorithms, whose processing time is independent of geometriccomplexity, and relates linearly to the area under investigation
1.1 Relation to previous work
The use of image processing for urban analysis was proposed by Richens (1997),who implemented a number of simple algorithms using the public domainMacintosh software NIH Image (available on the Internet athttp://rsb.info.nih.gov/nih-image/). This was used by Steemers et al. (1997) foranalysis of directional porosity in cities, which they related to movement ofpollution. Though NIH Image is very effective, it is restricted to a single byte ofinformation at each pixel, and its programming language, a kind of truncated Pascal,is inadequate. In the present work we extend our image processing environment toinclude Matlab, a well known package for matrix manipulation which includes anImage Processing Toolbox and begin to consider further issues, such as the problemof urban texture synthesis, and the use of cellular automaton simulations ofdiffusion-like processes.
2. IMAGE PROCESSING BASICS
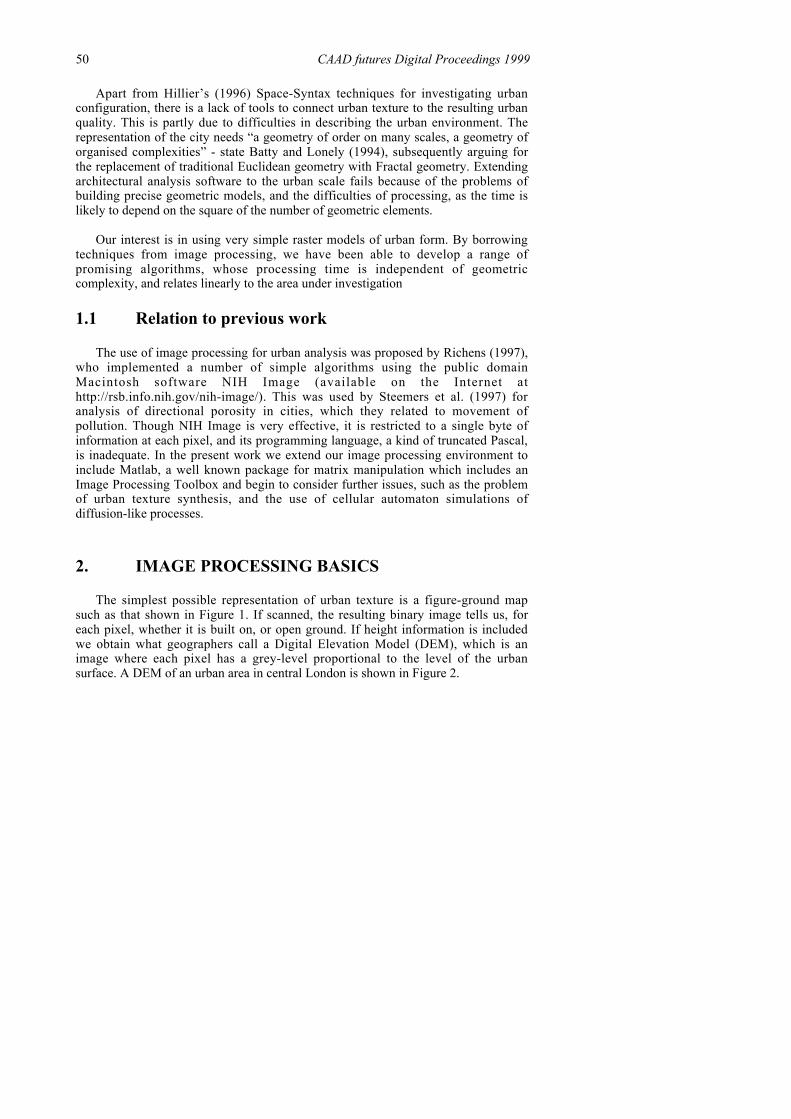
The simplest possible representation of urban texture is a figure-ground mapsuch as that shown in Figure 1. If scanned, the resulting binary image tells us, foreach pixel, whether it is built on, or open ground. If height information is includedwe obtain what geographers call a Digital Elevation Model (DEM), which is animage where each pixel has a grey-level proportional to the level of the urbansurface. A DEM of an urban area in central London is shown in Figure 2.
CAAD futures Digital Proceedings 1999 51
Figure 1,2. Urban ground map showing built and unbuilt areas (1) and urban DigitalElevation Model – DEM (2) for a selected case-study in central London
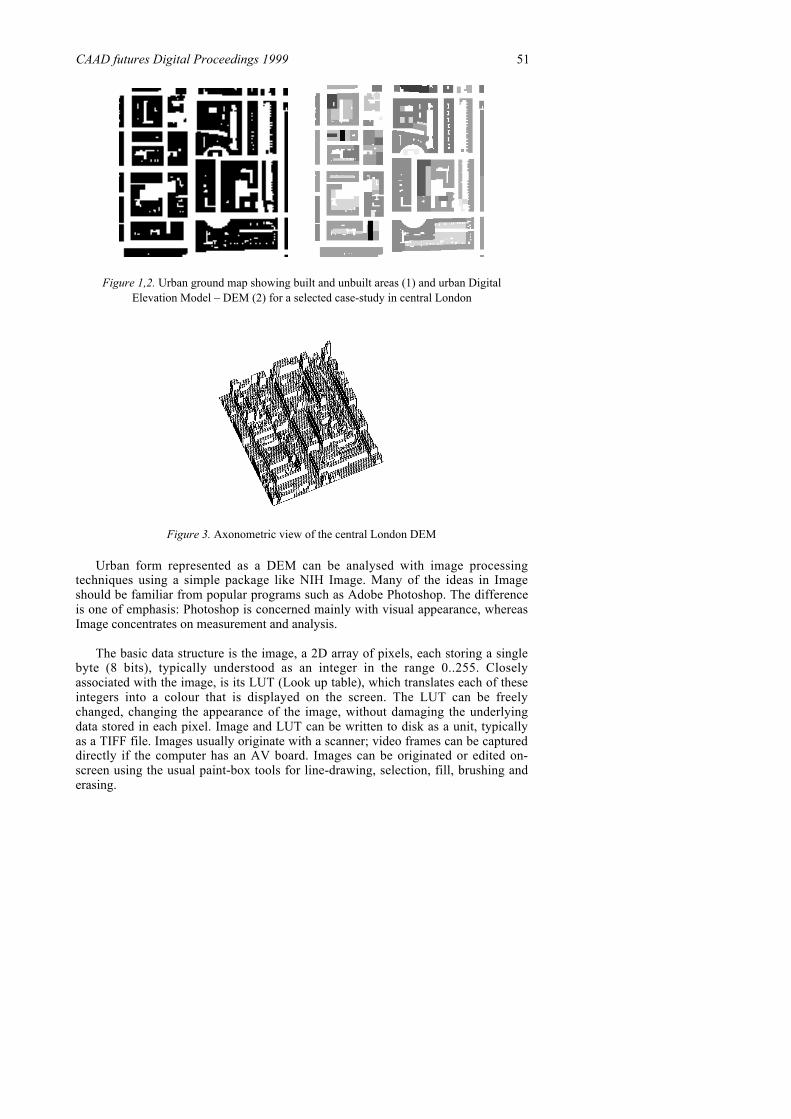
Figure 3. Axonometric view of the central London DEM
Urban form represented as a DEM can be analysed with image processingtechniques using a simple package like NIH Image. Many of the ideas in Imageshould be familiar from popular programs such as Adobe Photoshop. The differenceis one of emphasis: Photoshop is concerned mainly with visual appearance, whereasImage concentrates on measurement and analysis.
The basic data structure is the image, a 2D array of pixels, each storing a singlebyte (8 bits), typically understood as an integer in the range 0..255. Closelyassociated with the image, is its LUT (Look up table), which translates each of theseintegers into a colour that is displayed on the screen. The LUT can be freelychanged, changing the appearance of the image, without damaging the underlyingdata stored in each pixel. Image and LUT can be written to disk as a unit, typicallyas a TIFF file. Images usually originate with a scanner; video frames can be captureddirectly if the computer has an AV board. Images can be originated or edited on-screen using the usual paint-box tools for line-drawing, selection, fill, brushing anderasing.

52 CAAD futures Digital Proceedings 1999
A large part of the functionality in NIH is aimed at image enhancement, usingtwo major techniques. The first is LUT modification, which can alter the brightnessand contrast, or even apply false colour to the pixel values. For instance,thresholding or density slicing can be performed by LUT modification.Thresholding turns the grey-scale image into a black and white one, with interactivecontrol of the threshold value. Density slicing turns a narrow range of pixel valuesinto another colour, again with interactive control. Dragging the slice through therange gives a precise way of exploring the values in the image. Both thresholdingand density slicing are performed by LUT modification, but it is possible to force thechanges into the image itself, which then becomes a binary image with values of 0(false, white) and 255 (true, black) only.
The second method of image enhancement is by applying filters. Thefundamental idea behind image filters is the kernel, a small window or region ofpixels (say 3 by 3 or 5 by 5). The filter operates by centring the kernel on each pixelin the image in turn, and performing some computation on the values seen under thekernel. The central pixel is replaced by the result of the computation. So for examplethe Max filter replaces each pixel by the maximum value in its 3 by 3neighbourhood, and the Median filter replaces each pixel by the median (central)value of its neighbourhood (which is a popular way of removing noise from animage).
Convolution filters work by forming a weighted average of the pixels under thekernel; the kernel cells specify the weights. If the weights are all positive, the resultis some sort of smoothing or blurring. More sophisticated kernels, with somenegative weights, can sharpen an image, differentiate it, or detect edges.
NIH Image provides some all-important features for doing arithmetic oncomplete images, for example by adding or multiplying corresponding pixels, ortaking the maximum or minimum values. The result is a complete new image. Ingeneral these operations are computed at higher precision, scaled and offset by astated amount, and then clipped to the 0..255 range allowed in each 8-bit pixel
3. BUILT FORM STATISTICS
Given a simply constructed DEM, Image was able to measure most of the usualbuilt form statistics. Histograms of building height, arbitrary cross-sections, andaxonometric representations (Figure 3) are standard commands. A very simplemacro to measure the whole image by summing the pixel values (with suitablecalibration corrections) gives the built volume. We obtain the built area bythresholding the DEM at z > 0, and counting. This works because the ground profilein the sample areas is essentially flat, and at zero throughout. If this were not thecase we could use a background removal function to find ground level, which couldbe subtracted from the image before measuring areas and volumes. By usingthresholding to extract an image at any particular level, we can repeat areameasurements at any horizontal cross-section.
CAAD futures Digital Proceedings 1999 53
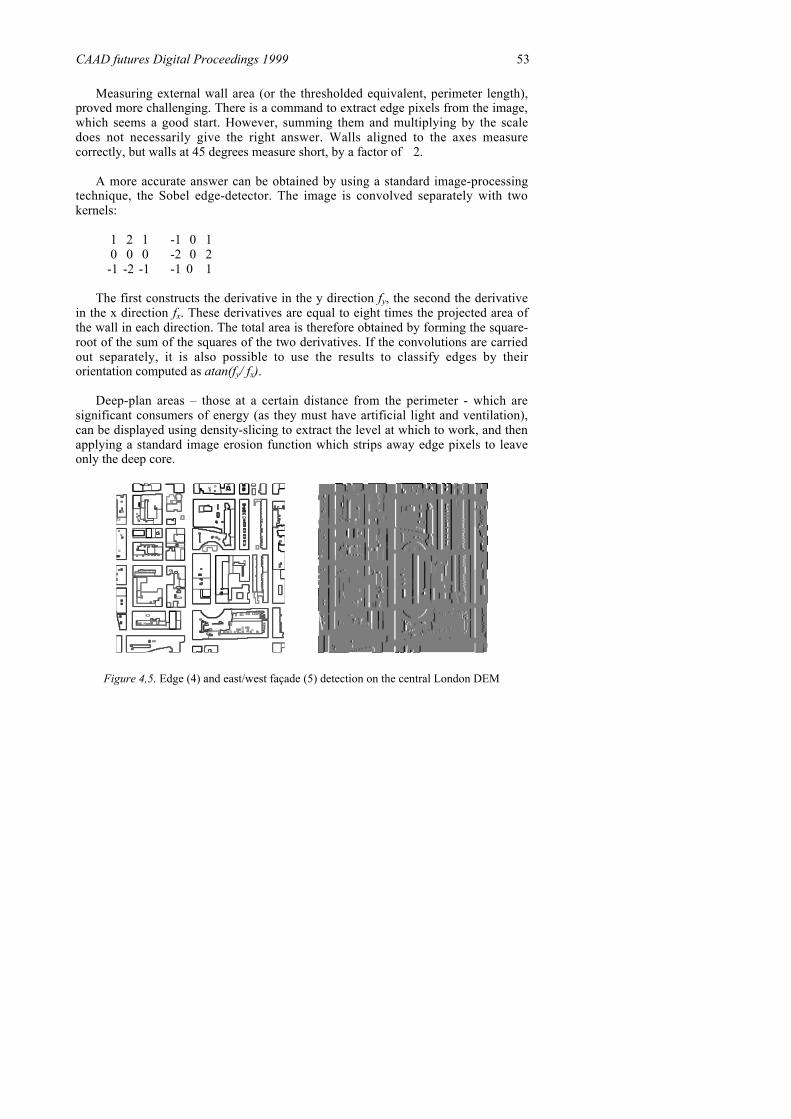
Measuring external wall area (or the thresholded equivalent, perimeter length),proved more challenging. There is a command to extract edge pixels from the image,which seems a good start. However, summing them and multiplying by the scaledoes not necessarily give the right answer. Walls aligned to the axes measurecorrectly, but walls at 45 degrees measure short, by a factor of ÷2.
A more accurate answer can be obtained by using a standard image-processingtechnique, the Sobel edge-detector. The image is convolved separately with twokernels:
1 2 1 -1 0 1 0 0 0 -2 0 2-1 -2 -1 -1 0 1
The first constructs the derivative in the y direction fy, the second the derivativein the x direction fx. These derivatives are equal to eight times the projected area ofthe wall in each direction. The total area is therefore obtained by forming the square-root of the sum of the squares of the two derivatives. If the convolutions are carriedout separately, it is also possible to use the results to classify edges by theirorientation computed as atan(fy/ fx).
Deep-plan areas – those at a certain distance from the perimeter - which aresignificant consumers of energy (as they must have artificial light and ventilation),can be displayed using density-slicing to extract the level at which to work, and thenapplying a standard image erosion function which strips away edge pixels to leaveonly the deep core.
Figure 4,5. Edge (4) and east/west façade (5) detection on the central London DEM

54 CAAD futures Digital Proceedings 1999
4. URBAN ENVIRONMENTAL ANALYSIS
4.1 Shadow casting algorithm
Daylight and sunlight are fundamental constituents of the microclimate.Surprisingly effective algorithms can be devised, using image processing macros, tocompute them from DEMs.
Our central algorithm (Richens, 1997) is one to compute shadows for anarbitrary angle of lighting. The approach taken is to compute shadow volumes as aDEM, that is, the upper surface of the volume of air that is in shadow. We start bydefining the three components of the vector pointing towards the sun. Then wecompute the components of an opposite vector, scaled so that the larger of the x andy components is just 1 pixel, and the z component is adjusted to the imagecalibration. If we translate the DEM by the x and y components, and simultaneouslyreduce its height by subtracting the z component, we get part of the shadow volume.If we continue translating and lowering by multiples of this vector, and take themaximum of this volume with that previously calculated, we build up the wholeshadow volume. The process can be stopped when all levels are zero, or thetranslation has shifted the volume right off the image. This is easily encoded as animage processing macro. The results are shown in Figure 6.
To reduce the shadow volume to an actual map of shadows on the roofs andground of the city, the original DEM is subtracted from the shadow volume. Pixelswith negative or zero value are in light, positive values are in shade.
This calculation computes shadows for an arbitrary lighting angle; it isstraightforward to add a procedure to calculate shadows from the sun for any givenlatitude, time of year, and time of day, using the usual astronomical formulae. Thenext stage is to calculate solar irradiation, the actual amount of energy received ateach pixel, from the sun, taking into account the solar altitude, angles of incidence,and shadowing. Computing the clear-beam normal surface irradiation can follow astandard method – we used that in Page (1986).
These algorithms are simple to write, and impressively fast. The running speeddepends on the number of pixels in the image, but not on the geometric complexity.So it is feasible to process acres of city at a time, something unthinkable withtraditional geometric models.

CAAD futures Digital Proceedings 1999 55
Figure 6,7. Shadow volume (6) and shadow results (7) on the central London DEM
4.2 View factors
The view factor is a geometric parameter that is related to many urbanenvironmental processes. Also called shape factor, form factor or configurationfactor, it was originally introduced in heat transfer theory to model radiant exchangebetween diffuse surfaces. Later, it has been successfully applied to urbanclimatology (Oke, 1988).
In particular, the view factor from the city to the sky, which represents theopenness of the urban texture to the sky, takes part in three major environmentalprocesses: the loss of long wave radiation from city to sky, responsible for coolingdown of the urban surface during the night; the absorption of solar short waveradiation causing daytime heating; and the illumination received on a horizontalplane from an overcast sky, which determines daylight potential.
Several methods have been suggested in urban climatology for deriving the viewfactor from the city to the sky. Glenn and Watson (1984) derived an analyticalexpression to determine the sky view factor for different urban canyonarrangements. Steyn (1980) suggested a graphical method based on fish-eye lensphotographs.
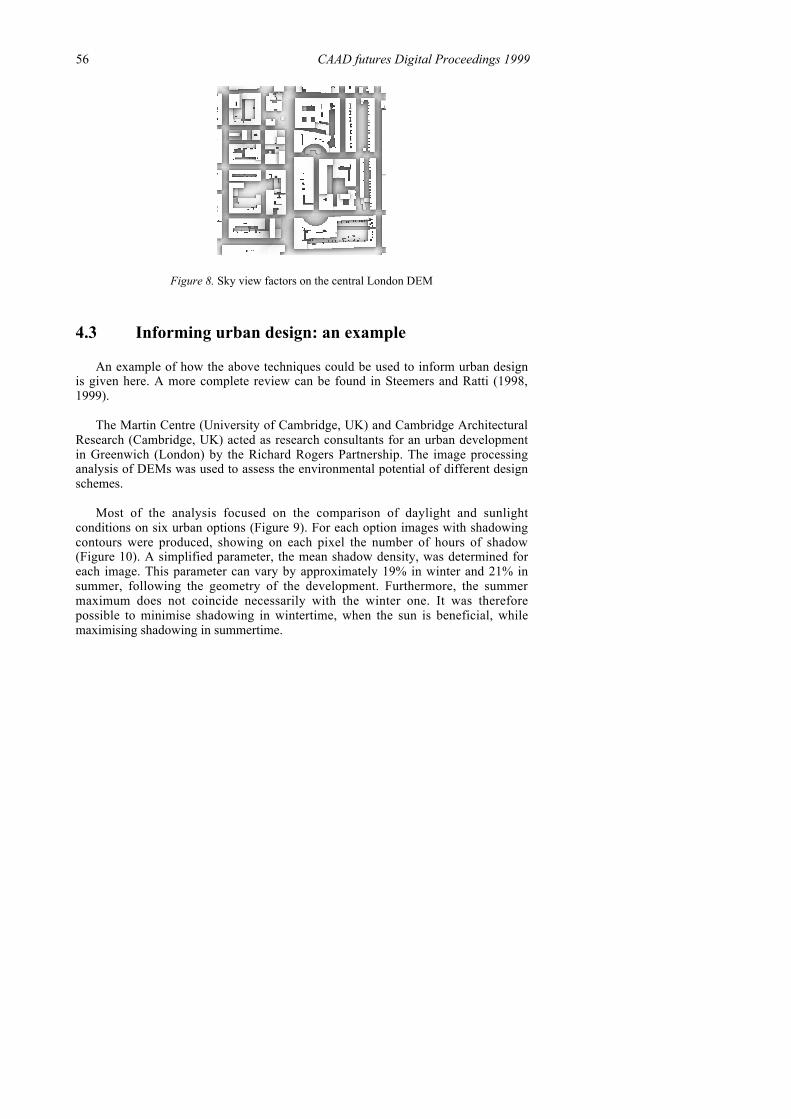
We calculate the view factor by repeated application of the shadow algorithm.We simply compute the shadows for a large number of light sources, distributedover the sky, and for each pixel count the number of times they are in light. So if weuse 255 samples, any pixel whose count is 255 can see all the sky and has a skyview factor 1, while a count of 0 means that it cannot see the sky at all.
To get meaningful results, it is necessary to distribute the sample points over thesky in the correct manner. If a uniform distribution is used, then what is measured isnot the view factor but the solid-angle of sky visible from each point. However, ifwe distribute our points evenly over a unit circle in the horizontal plane, and thenproject up to a unit hemisphere, we obtain a cosine-weighted distribution, which isthe correct distribution for computing the view factor from the city to the sky.
56 CAAD futures Digital Proceedings 1999
Figure 8. Sky view factors on the central London DEM
4.3 Informing urban design: an example
An example of how the above techniques could be used to inform urban designis given here. A more complete review can be found in Steemers and Ratti (1998,1999).
The Martin Centre (University of Cambridge, UK) and Cambridge ArchitecturalResearch (Cambridge, UK) acted as research consultants for an urban developmentin Greenwich (London) by the Richard Rogers Partnership. The image processinganalysis of DEMs was used to assess the environmental potential of different designschemes.
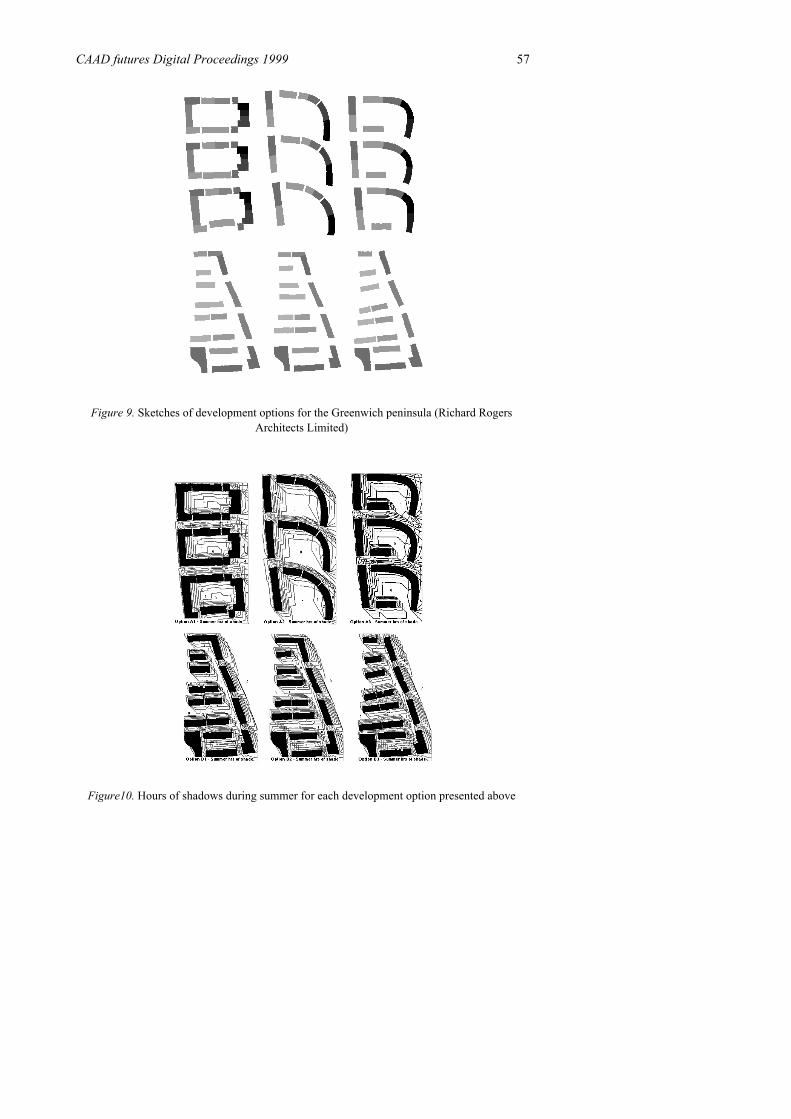
Most of the analysis focused on the comparison of daylight and sunlightconditions on six urban options (Figure 9). For each option images with shadowingcontours were produced, showing on each pixel the number of hours of shadow(Figure 10). A simplified parameter, the mean shadow density, was determined foreach image. This parameter can vary by approximately 19% in winter and 21% insummer, following the geometry of the development. Furthermore, the summermaximum does not coincide necessarily with the winter one. It was thereforepossible to minimise shadowing in wintertime, when the sun is beneficial, whilemaximising shadowing in summertime.
CAAD futures Digital Proceedings 1999 57
Figure 9. Sketches of development options for the Greenwich peninsula (Richard RogersArchitects Limited)
Figure10. Hours of shadows during summer for each development option presented above
58 CAAD futures Digital Proceedings 1999
5. MORPHOLOGICAL ANALYSIS
The simple image processing capability of NIH Image has limitations. The valueassociated with each pixel is a single byte, and the macro language, a kind ofdebased Pascal, is inflexible. For more advanced work, therefore, we have usedMatlab, which gives us a double-precision variable at each pixel, and a completematrix-oriented programming language. We find this to be much more flexible,though sometimes slower, and much more memory intensive, than Image.
5.1 Urban Ground view factor
Peponis et al. (1998) proposed an extension to the theory of Space Syntax(Hillier and Hanson 1984; Hillier 1996) analysing the visible relations between thesurfaces that bound and subdivide space. The study of plan configuration accordingto the covisibility of surfaces, and the introduction of parameters such as visualconnectivity would, they suggest, allow a more subtle investigation of spatialconfiguration than Hillier’s original Space Syntax, which is mainly based on thetopology of circulation spaces.
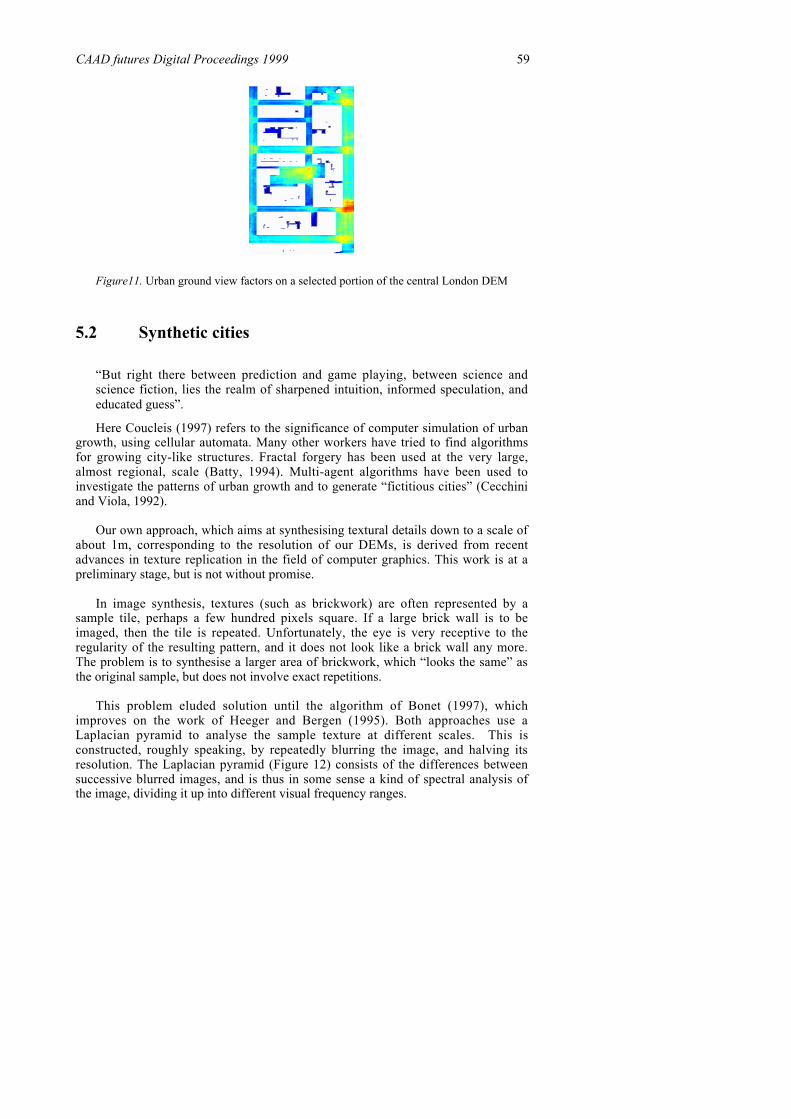
We have found DEM techniques highly adapted to the analysis of thesemeasures. We defined a parameter called the urban ground view factor andcomputed its value on each pixel by modifying the above macro for the sky viewfactor (4.2 above). The urban ground view factor is a measure of the extension of theview of the ground from each urban pixel and directly relates to the strong visibilitypolygon (O’Rourke, 1987, Peponis et al., 1998). Results on the selected Londoncase-study are shown in Figure 11.
In addition to the urban ground view factor, other configurational characteristicscan be calculated from the DEM. For instance, it is easy to write Matlab functions tocompute the following parameters suggested and applied by Batty (1999) to theanalysis of the town centre in Wolverhampton:
– the mean distance that can be seen from each point, called visibility;– the furthest distance that can be seen from each point;– the angle at which this occurs.
CAAD futures Digital Proceedings 1999 59
Figure11. Urban ground view factors on a selected portion of the central London DEM
5.2 Synthetic cities
“But right there between prediction and game playing, between science andscience fiction, lies the realm of sharpened intuition, informed speculation, andeducated guess”.
Here Coucleis (1997) refers to the significance of computer simulation of urbangrowth, using cellular automata. Many other workers have tried to find algorithmsfor growing city-like structures. Fractal forgery has been used at the very large,almost regional, scale (Batty, 1994). Multi-agent algorithms have been used toinvestigate the patterns of urban growth and to generate “fictitious cities” (Cecchiniand Viola, 1992).
Our own approach, which aims at synthesising textural details down to a scale ofabout 1m, corresponding to the resolution of our DEMs, is derived from recentadvances in texture replication in the field of computer graphics. This work is at apreliminary stage, but is not without promise.
In image synthesis, textures (such as brickwork) are often represented by asample tile, perhaps a few hundred pixels square. If a large brick wall is to beimaged, then the tile is repeated. Unfortunately, the eye is very receptive to theregularity of the resulting pattern, and it does not look like a brick wall any more.The problem is to synthesise a larger area of brickwork, which “looks the same” asthe original sample, but does not involve exact repetitions.
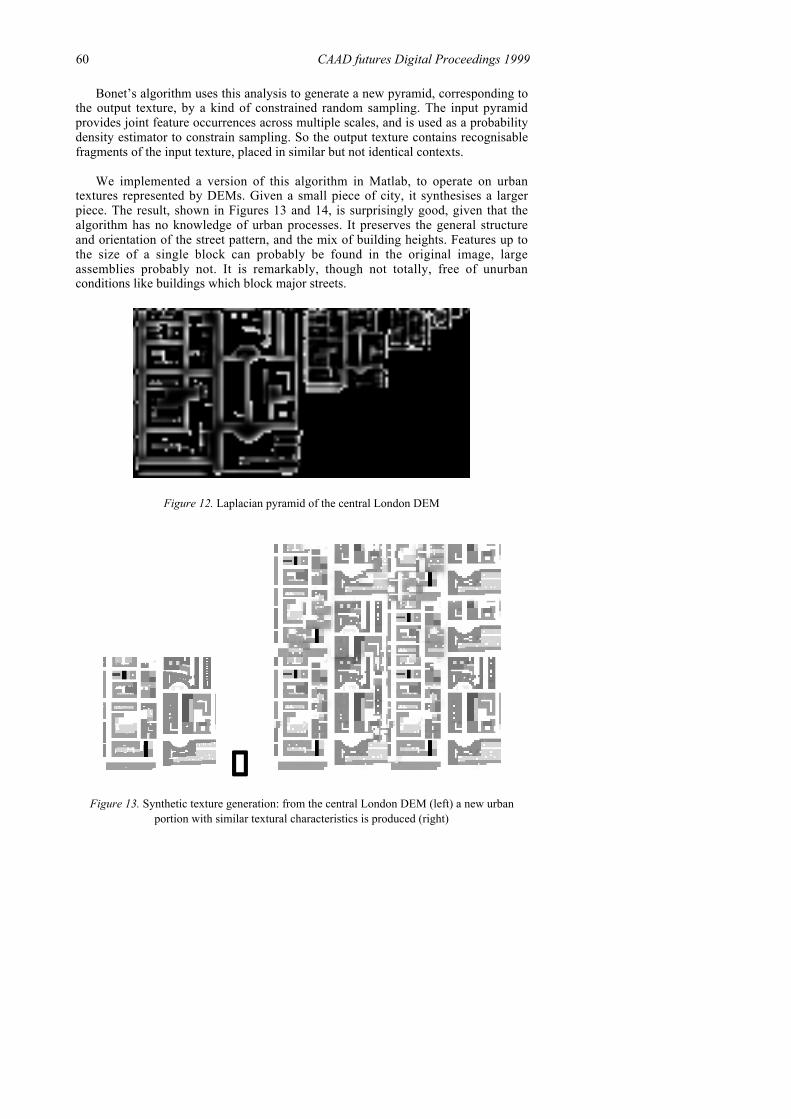
This problem eluded solution until the algorithm of Bonet (1997), whichimproves on the work of Heeger and Bergen (1995). Both approaches use aLaplacian pyramid to analyse the sample texture at different scales. This isconstructed, roughly speaking, by repeatedly blurring the image, and halving itsresolution. The Laplacian pyramid (Figure 12) consists of the differences betweensuccessive blurred images, and is thus in some sense a kind of spectral analysis ofthe image, dividing it up into different visual frequency ranges.
60 CAAD futures Digital Proceedings 1999
Bonet’s algorithm uses this analysis to generate a new pyramid, corresponding tothe output texture, by a kind of constrained random sampling. The input pyramidprovides joint feature occurrences across multiple scales, and is used as a probabilitydensity estimator to constrain sampling. So the output texture contains recognisablefragments of the input texture, placed in similar but not identical contexts.
We implemented a version of this algorithm in Matlab, to operate on urbantextures represented by DEMs. Given a small piece of city, it synthesises a largerpiece. The result, shown in Figures 13 and 14, is surprisingly good, given that thealgorithm has no knowledge of urban processes. It preserves the general structureand orientation of the street pattern, and the mix of building heights. Features up tothe size of a single block can probably be found in the original image, largeassemblies probably not. It is remarkably, though not totally, free of unurbanconditions like buildings which block major streets.
Figure 12. Laplacian pyramid of the central London DEM
fi
Figure 13. Synthetic texture generation: from the central London DEM (left) a new urbanportion with similar textural characteristics is produced (right)

CAAD futures Digital Proceedings 1999 61
fi
Figure 14. Axonometric view of Figure 8
6. DEM AND CELLULAR AUTOMATA
‘Cellular automata are mathematical idealisations of physical systems in whichspace and time are discrete, and physical quantities take on a finite set of discretevalues. A cellular automaton consists of a regular uniform lattice (or 'array'),usually infinite in extent, with a discrete variable at each site ('cell'). The state ofa cellular automaton is completely specified by the values of the variables ateach site. A cellular automaton evolves in discrete time steps, with the value ofthe variable at one site being affected by the values of variables at sites in its'neighbourhood' on the previous time step. The neighbourhood of a site istypically taken to be the site itself and all immediately adjacent sites. Thevariables at each site are updated simultaneously ('synchronously'), based on thevalues of the variables in their neighbourhood at the preceding time step, andaccording to a definite set of 'local rules'’ (Wolfram, 1983).
Although CA have mainly been used in urban studies to simulate spatialdynamics (Batty et al., 1997), we will consider here their applications in modellingsmall-scale processes within the urban texture.
The physics of pollution dispersal, wind flow and noise diffusion can be studiedby CA. CA have also been very successful in modelling complex situations forwhich traditional computer techniques are not applicable, such as flows in porousmedia, erosion and transport problems, etc. (Chopard and Droz, 1998).
In addition to the modelling of physical processes, CA have been used tosimulate the local action of individual actors or agents. Batty (1999) applied CA tomodel how pedestrians move in town centres and buildings. More generally, agent-

62 CAAD futures Digital Proceedings 1999
based models may constitute the base of built space analysis complementary toSpace Syntax.
CA techniques are highly compatible with DEMs. The DEM, a raster map, is thenatural format to input urban geometry into a CA. Operation on cells can simply beviewed as operations on pixels. Image processing and CA can therefore beintegrated into a single body of analysis techniques to work with DEMs. As anexample, a CA macro has been written in Matlab to simulate diffusion of pollutantswithin the urban texture. Results are shown in Figure 15: a steady source ispositioned at the bottom of the image, while pollutant particles migrate upwards.
Figure 25. Modelling diffusion on a selected portion of the central London case-study (left)using cellular automata (right)
7. CONCLUSIONS AND FUTURE WORK
DEMs have proved to be an unexpectedly effective format for representing thesurface of the city. The innovative use of image processing and CA techniquesallows the computation of a wide range of environmental and morphologicalparameters in urban areas.
A great deal more could be done to extend the modelling capability, usingmultiple images, rather than simply a DEM. If the ground surface is complicated,separate ground and building DEMs would be necessary. Additional channels couldbe used to classify surface types (vegetation, water, roads, buildings), and to providemore information about buildings, of which the number of stories would be mostvaluable, followed by information about glazing, albedo, and materials generally.
Raster urban data should be increasingly available at low cost in the forthcomingyears. DEM can already be produced with semi-automatic digital photogrammetryand Synthetic Aperture Radar (SAR) techniques. Additional surface data in urbanareas can easily be obtained from remote sensing. The analysis of DEMs couldconstitute the basis for an integrated image-based urban model to inform planningand design.
CAAD futures Digital Proceedings 1999 63
8. ACKNOWLEDGEMENTS
The research was partly funded by the European Commission through ProjectPRECIS (Assessing the Potential for Renewable Energy in Cities).Acknowledgements go to Dr. Nick Baker for his suggestions and many informativediscussions; to Dr. Koen Steemers for supporting the application of imageprocessing techniques to urban design; to the PRECIS team for its productiveresearch environment.
9. REFERENCES
Batty M, Longley P, 1994, Fractal Cities – A Geometry of Form and Function (AcademicPress, London)
Batty M, Coucleis H, Eichen M, 1997, “Urban Systems as Cellular Automata”, Environmentand Planning B: Planning and Design, 24 159-164
Batty M, 1999, “Visual fields”, http://www.casa.ucl.ac.uk/agent-homepage/visual-fields.htmBonet J S, 1997, "Multiresolution Sampling Procedure for Analysis and Synthesis of Texture
Images", Proceedings Computer Graphics ACM SIGGRAPH, 361-368Cecchini A, Viola F, 1992, “Ficties (fictitious cities): a Simulation for the Creation of Cities”,
paper presented at the International Seminar on Cellular Automata for Regional Analysis,Venice, Italy; copy available from A. Cecchini, Laboratorio sulla Simulazione Stratema,Istituto Universitario di Architettura di Venezia, Ca’ Tron 5, Croce 1957, 30135 Venice,Italy
Chopard B, Droz M, 1998, Cellular Automata Modelling of Physical Systems (CambridgeUniversity Press, Cambridge)
Coucleis H, 1997, “From Cellular Automata to Urban Models: New-Principles for ModelDevelopment and Implementation”, Environment and Planning B: Planning and Design,24 165-174
Glenn T J, Watson I D, 1984, “The Determination of View-Factors in Urban Canyons”,Journal of Climate and Applied Meteorology, 23 329-335
Givoni B, 1989, Urban Design in Different Climates (World Meteorological OrganisationWMO-TD n. 346, Geneva)
Heeger D J, Bergen J R, 1995, “. Pyramid based texture analysis/synthesis”, ProceedingsComputer Graphics ACM SIGGRAPH 229-238
Hillier B, 1996, Space is the Machine (Cambridge University Press, Cambridge)Hillier B., Hanson J., 1984, The Social Logic of Space (Cambridge University Press,
Cambridge)Jain A K, 1989, Fundamentals of Digital Image Processing (Prentice-Hall, London)Johnson G T, Watson I D, 1984, “The Determination of View-Factors in Urban Canyons”,
Journal of Climate and Applied Meteorology, 23 329-335Oke T, 1988, “Street Design and Urban Canopy Layer Climate”, Energy and Buildings, 11
103-113O’Rourke J, 1987, Art Gallery Theorems and Algorithms (Oxford University Press, Oxford)Page J K (ed), 1986, Prediction of Solar Radiation on Inclined Surfaces (Reidel Publishing
Company, Dordrecht)Peponis J, Wineman J, Rashid M, Bafna S, Kim S H, 1998, “Describing Plan Configuration
According to the Covisibility of Surfaces”, Environment and Planning B: Planning andDesign, 25 693-708

64 CAAD futures Digital Proceedings 1999
Richens P, 1997, “Image Processing for Urban Scale Environmental Modelling”, Proceedingsof the International Conference Building Simulation ’97 - Prague, 163-171
Steemers K, Baker N, Crowther D, Dubiel J, Nikolopoulou M, Ratti C, 1997, “City Textureand Microclimate”, Urban Design Studies, 3 25-49
Steemers K, Ratti C, 1998, “Nuovi Strumenti per la Progettazione Bioclimatica Urbana”,Housing 9 98-100
Steemers K, Ratti C, 1999, “Informing Urban Bioclimatic Design”, To appear in theproceedings of the International Conference Architecture and Engineering - Plymouth
Steyn D G, 1980, “The Calculation of View Factors from Fish-Eye Lens Photographs”,Atmosphere-Ocean 18 254-258
Wolfram S, 1983, ”The statistical mechanics of cellular automata”, Review of ModernPhysics, 55 601-643