Embed Size (px)
Citation preview
Urban Transport Planning and Development:
Issues and Challenges for India
Dr. Sanjay K. Singh
Department of Humanities and Social Sciences
Indian Institute of Technology Kanpur
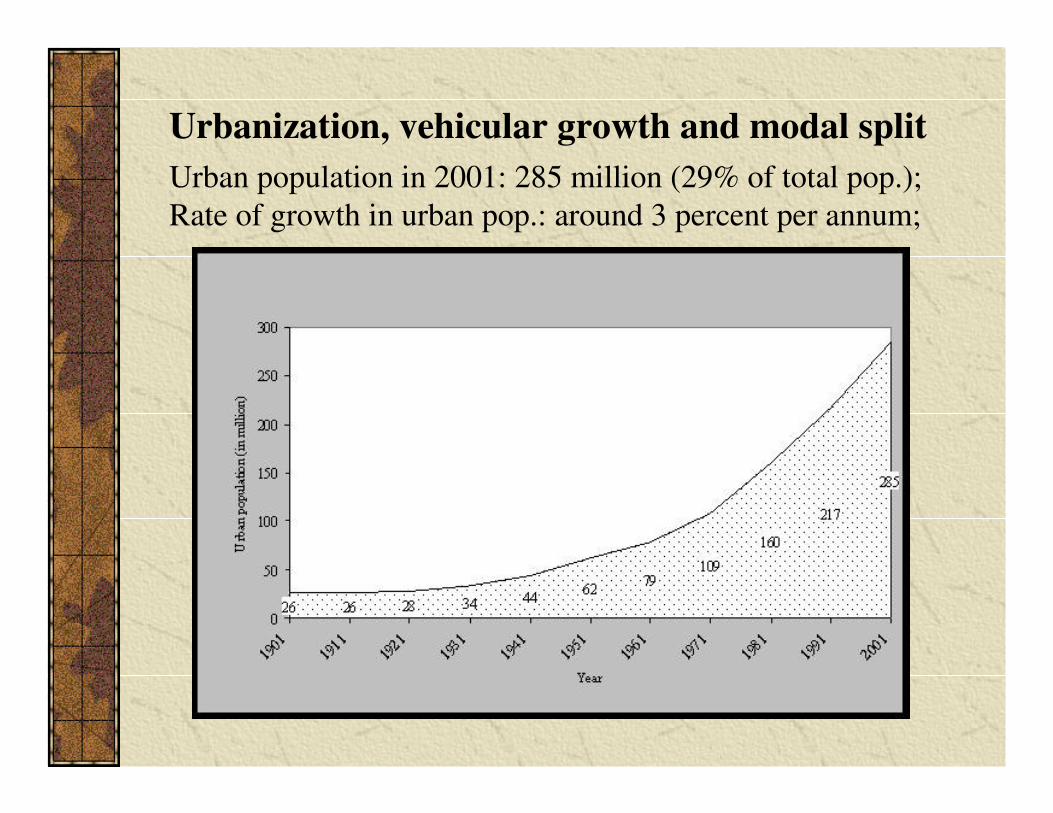
Urbanization, vehicular growth and modal split
Urban population in 2001: 285 million (29% of total pop.);
Rate of growth in urban pop.: around 3 percent per annum;
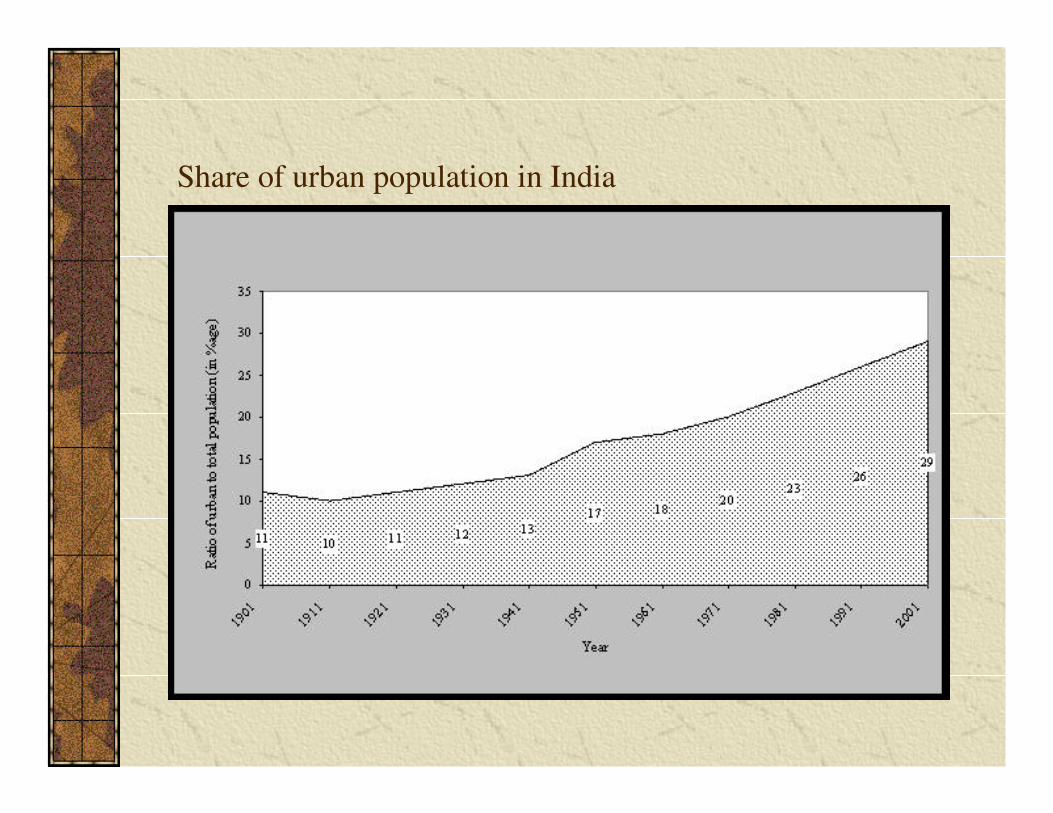
Share of urban population in India
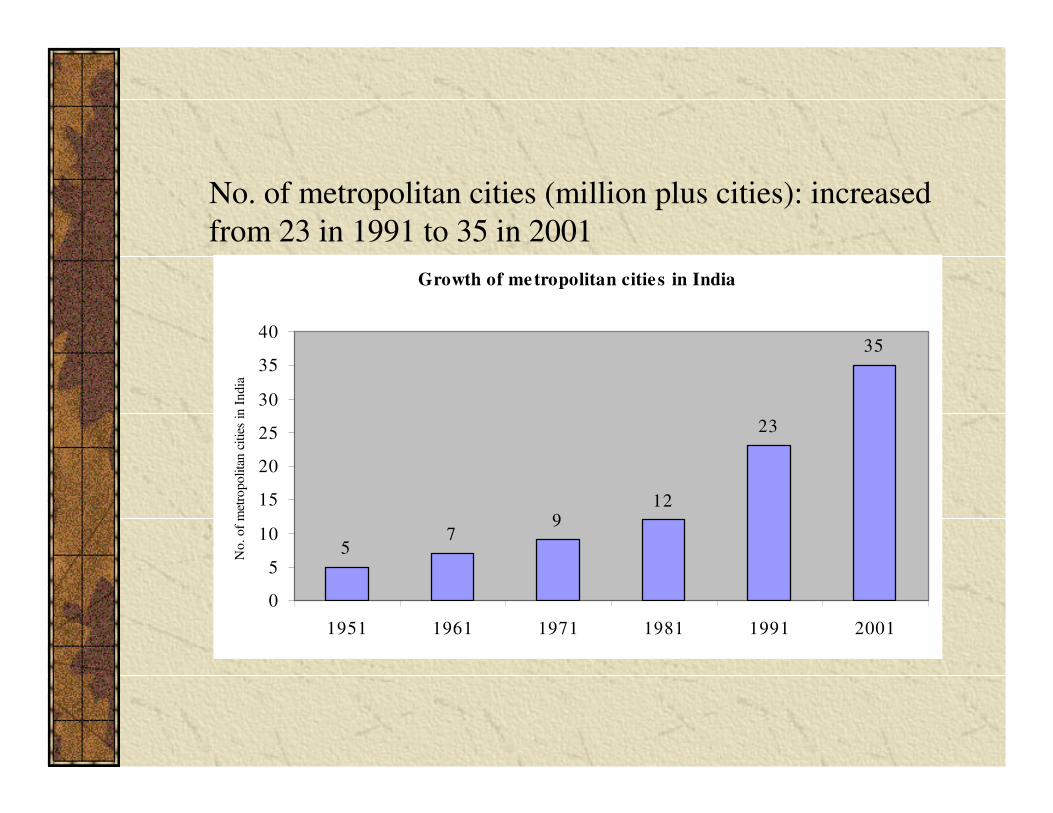
Growth of metropolitan cities in India
57
912
23
35
0
5
10
15
20
25
30
35
40
1951 1961 1971 1981 1991 2001
No
. of
met
ropolita
n c
itie
s in
India
No. of metropolitan cities (million plus cities): increased
from 23 in 1991 to 35 in 2001
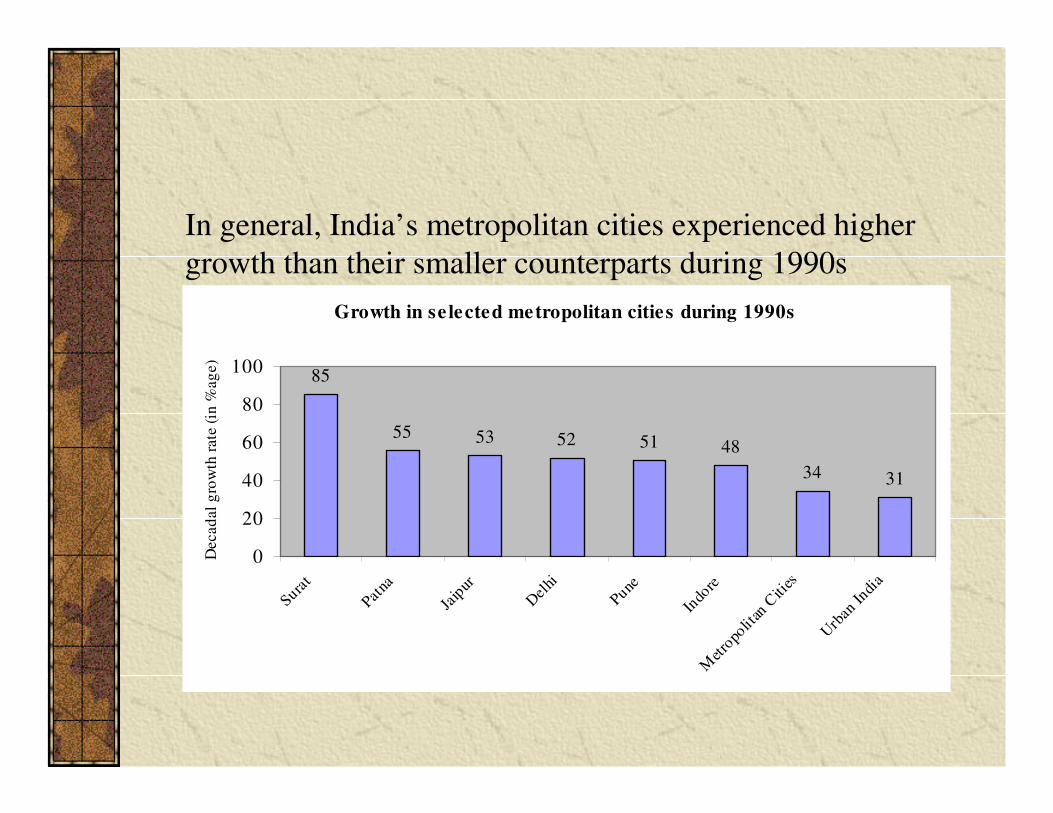
Growth in se lected metropolitan cities during 1990s
85
55 53 52 51 48
34 31
0
20
40
60
80
100
Surat
Patna
Jaip
ur
Del
hi
Pune
Indo
reM
etro
polit
an C
ities
Urb
an I
ndia
Decad
al
gro
wth
rate
(in
%ag
e)
In general, India’s metropolitan cities experienced higher
growth than their smaller counterparts during 1990s
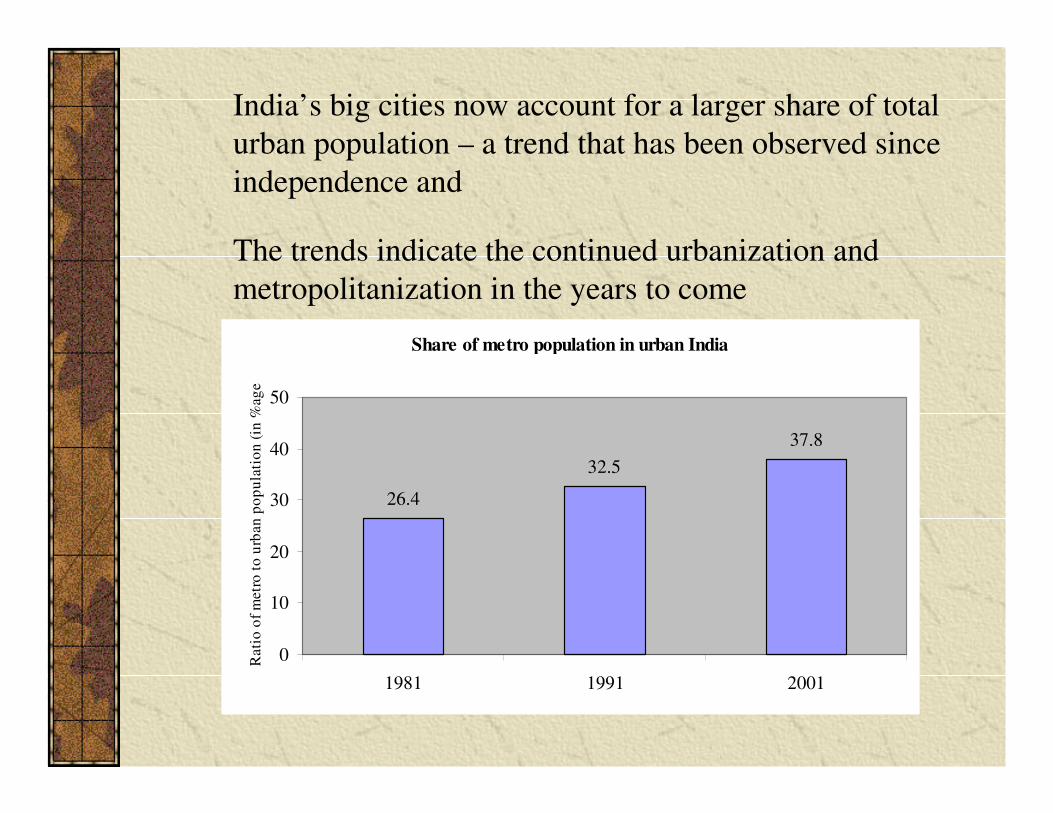
India’s big cities now account for a larger share of total
urban population – a trend that has been observed since
independence and
The trends indicate the continued urbanization and
metropolitanization in the years to come
Share of metro population in urban India
26.4
32.5
37.8
0
10
20
30
40
50
1981 1991 2001
Rati
o o
f m
etr
o t
o u
rban
po
pu
lati
on
(in
%ag
e)
Less than 1/3rd of Indians living in Urban areas contributes
2/3rd of National Income. Moreover, increase in household
income in urban areas is far higher than that in the rural areas.
Population growth, increases in household income, and
increase in commercial and industrial activities have placed
heavy demands on urban transport systems, demand that many
Indian cities have not been able to meet.
The main reason for this is inadequate transport infrastructure
and its sub-optimal use besides prevailing imbalance in modal
split.
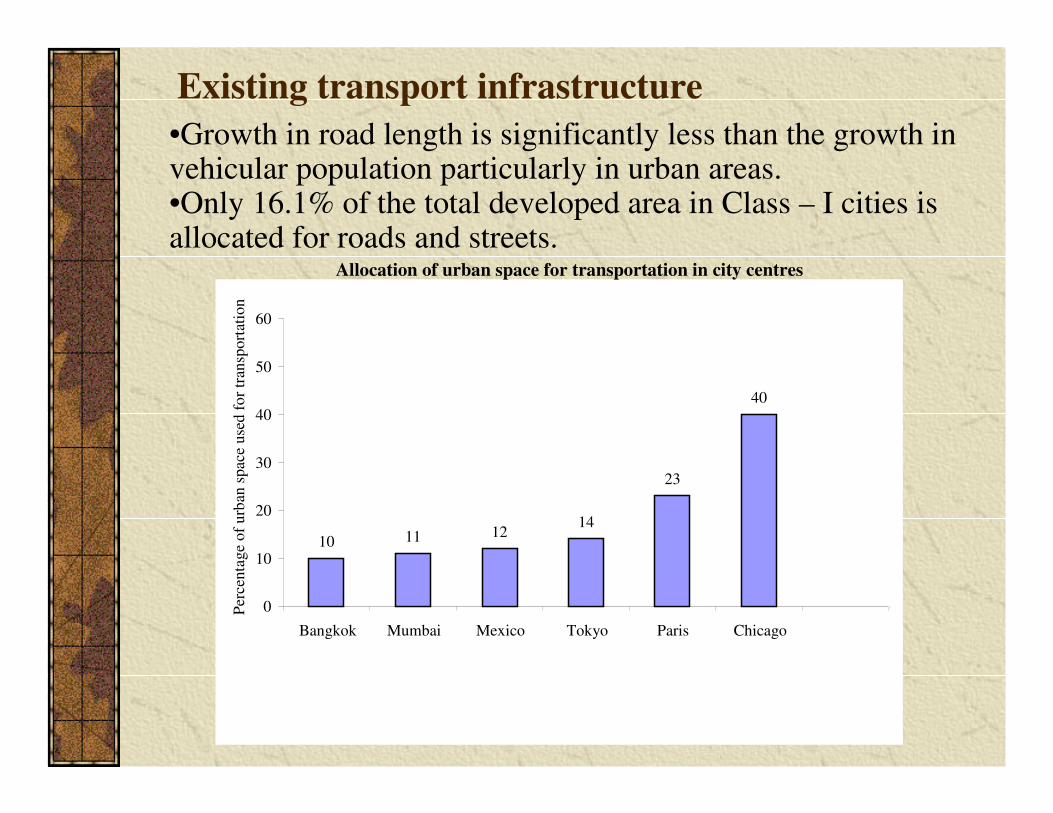
Allocation of urban space for transportation in city centres
10 11 1214
23
40
0
10
20
30
40
50
60
Bangkok Mumbai Mexico Tokyo Paris Chicago
Per
centa
ge
of
urb
an s
pac
e use
d f
or
tran
sport
atio
n
Existing transport infrastructure
•Growth in road length is significantly less than the growth in vehicular population particularly in urban areas.•Only 16.1% of the total developed area in Class – I cities is allocated for roads and streets.
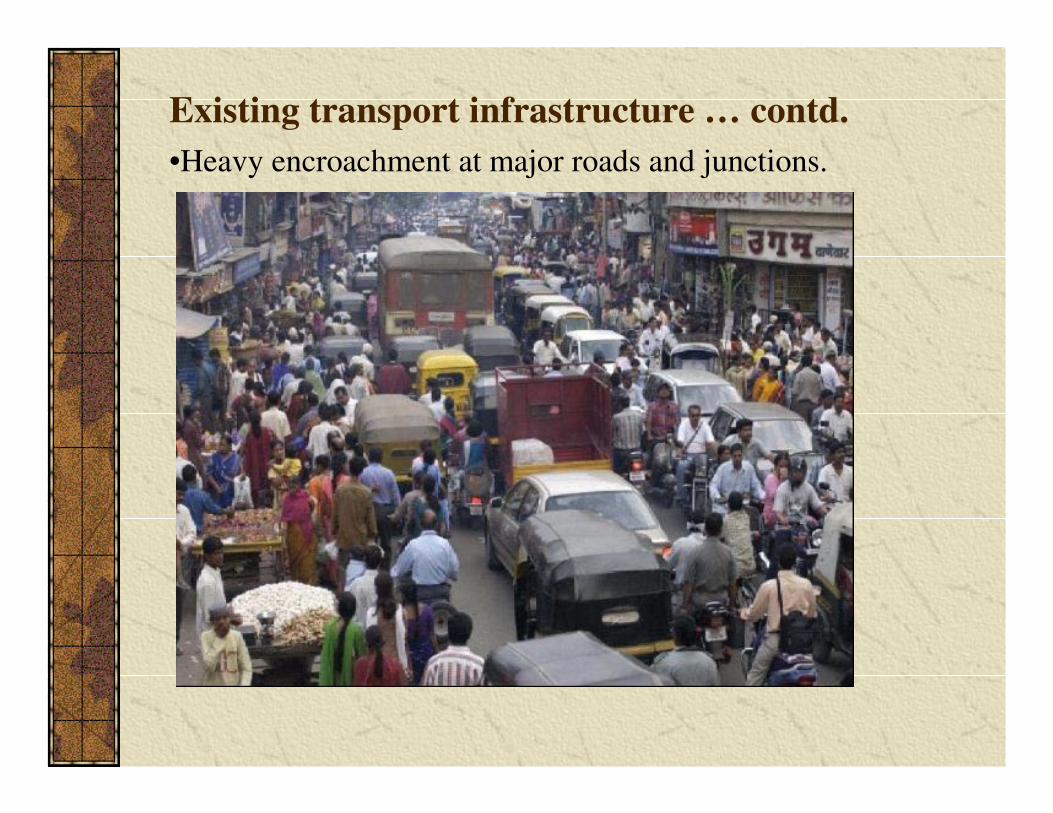
Existing transport infrastructure … contd.
•Heavy encroachment at major roads and junctions.
Existing transport infrastructure … contd.
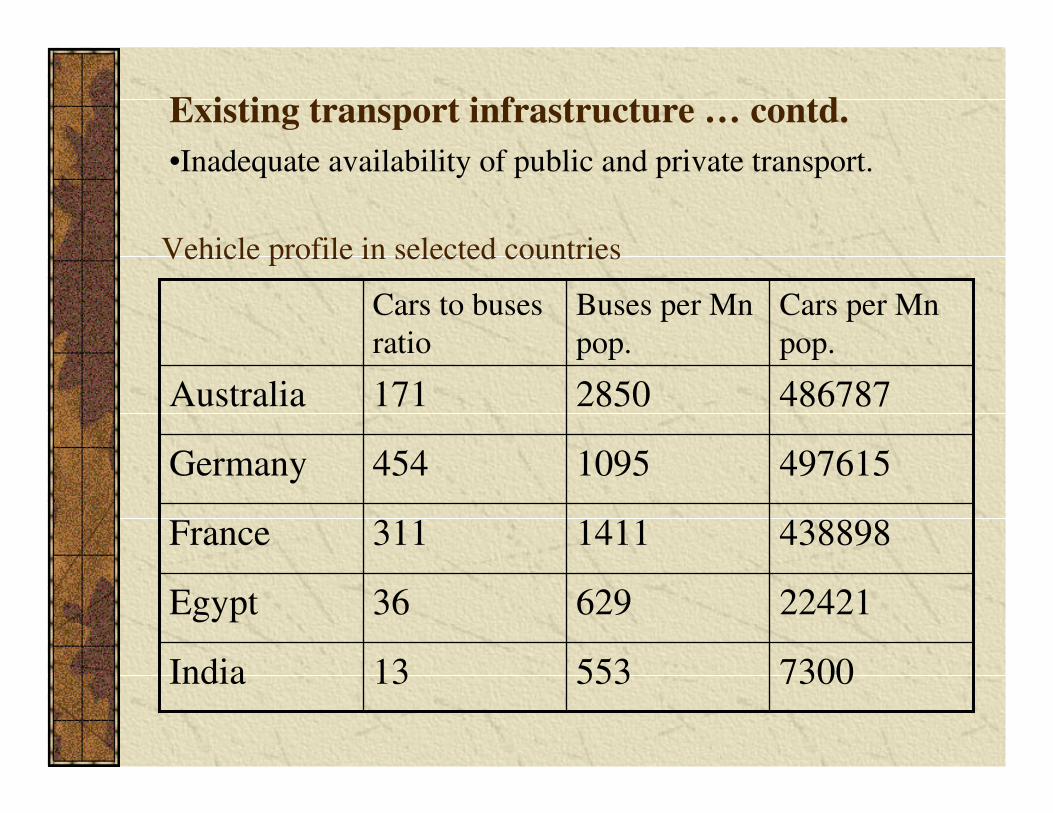
•Inadequate availability of public and private transport.
730055313India
2242162936Egypt
4388981411311France
4976151095454Germany
4867872850171Australia
Cars per Mn
pop.
Buses per Mn
pop.
Cars to buses
ratio
Vehicle profile in selected countries
Existing transport infrastructure … contd.
•Extremely limited rail services (only to Mumbai, Delhi,
Kolkata, and Chennai).
•Well-organized bus services are mainly run by MTUs/STUs
and confined only to few metropolitan cities whereas rail
services are available only in few mega cities.
•The share of buses is negligible in most Indian cities as
compared to personalized vehicles. For example, two-
wheelers and cars together constitute more than 95% in
Kanpur and 90% in both Hyderabad and Nagpur whereas in
these cities buses constitute 0.1, 0.3, and 0.8 percent
respectively.
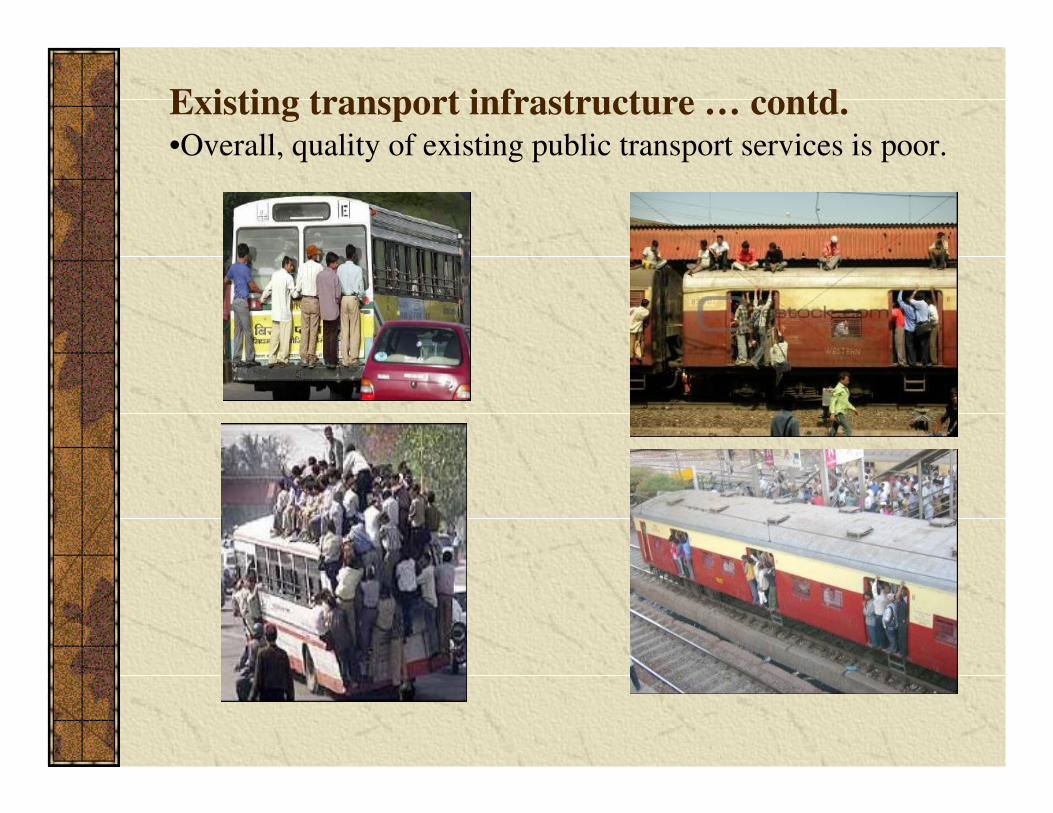
Existing transport infrastructure … contd.•Overall, quality of existing public transport services is poor.
Existing transport infrastructure … contd.
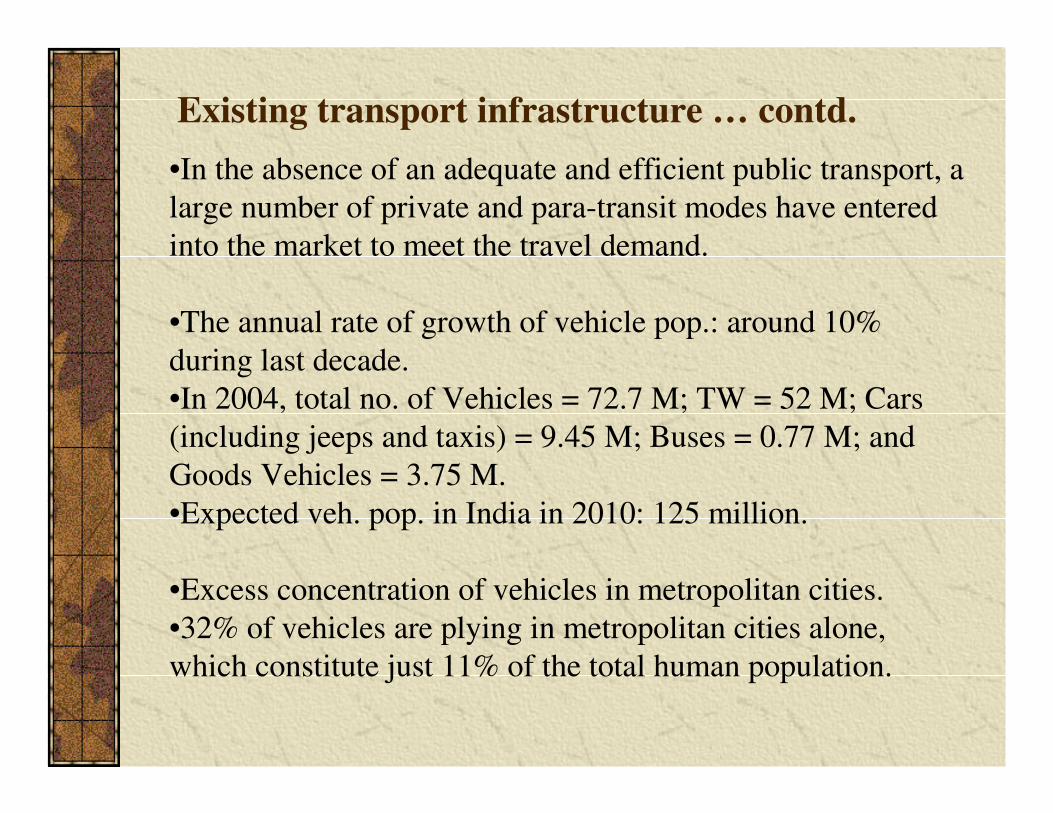
•In the absence of an adequate and efficient public transport, a
large number of private and para-transit modes have entered
into the market to meet the travel demand.
•The annual rate of growth of vehicle pop.: around 10%
during last decade.
•In 2004, total no. of Vehicles = 72.7 M; TW = 52 M; Cars
(including jeeps and taxis) = 9.45 M; Buses = 0.77 M; and
Goods Vehicles = 3.75 M.
•Expected veh. pop. in India in 2010: 125 million.
•Excess concentration of vehicles in metropolitan cities.
•32% of vehicles are plying in metropolitan cities alone,
which constitute just 11% of the total human population.
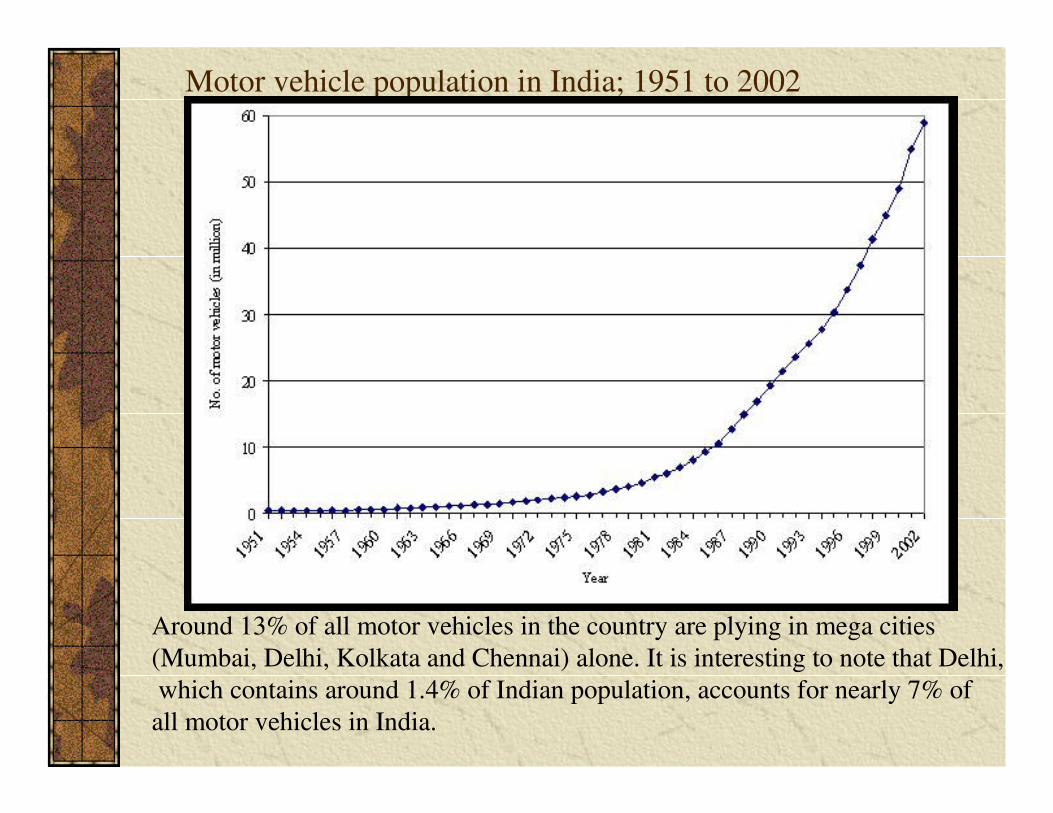
Motor vehicle population in India; 1951 to 2002
Around 13% of all motor vehicles in the country are plying in mega cities
(Mumbai, Delhi, Kolkata and Chennai) alone. It is interesting to note that Delhi,
which contains around 1.4% of Indian population, accounts for nearly 7% of
all motor vehicles in India.
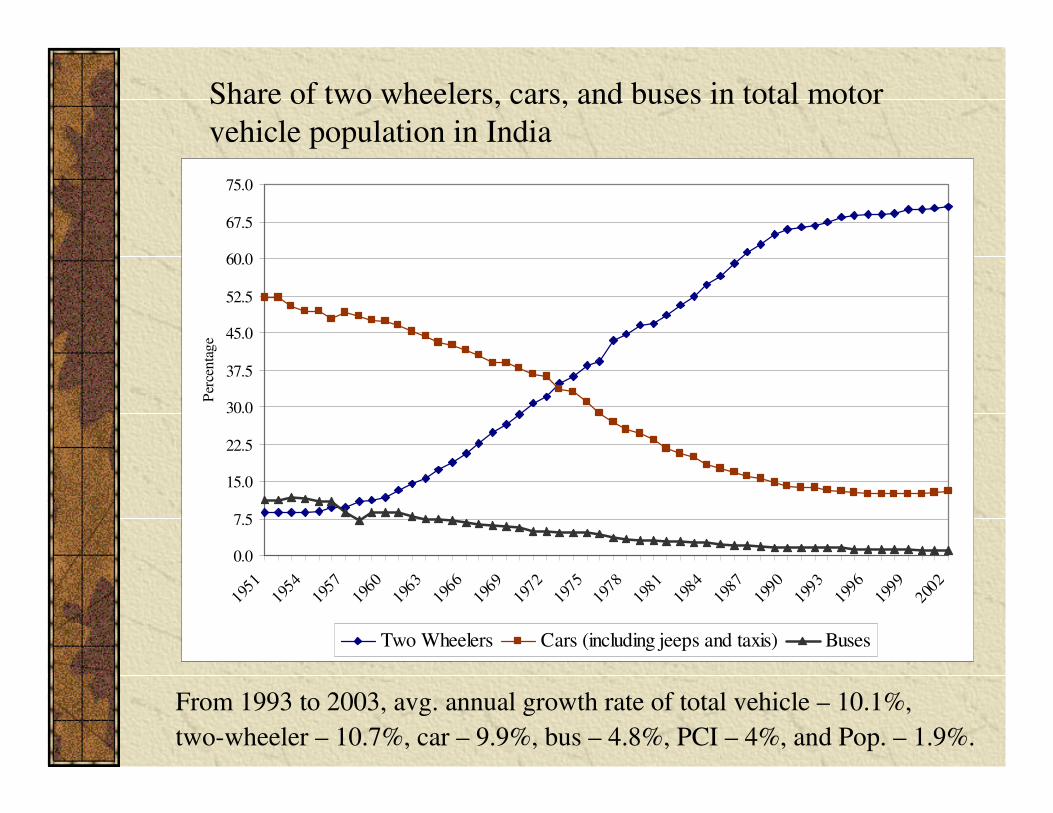
Share of two wheelers, cars, and buses in total motor
vehicle population in India
0.0
7.5
15.0
22.5
30.0
37.5
45.0
52.5
60.0
67.5
75.0
1951
1954
1957
1960
1963
1966
1969
1972
1975
1978
1981
1984
1987
1990
1993
1996
1999
2002
Per
centa
ge
Two Wheelers Cars (including jeeps and taxis) Buses
From 1993 to 2003, avg. annual growth rate of total vehicle – 10.1%,
two-wheeler – 10.7%, car – 9.9%, bus – 4.8%, PCI – 4%, and Pop. – 1.9%.
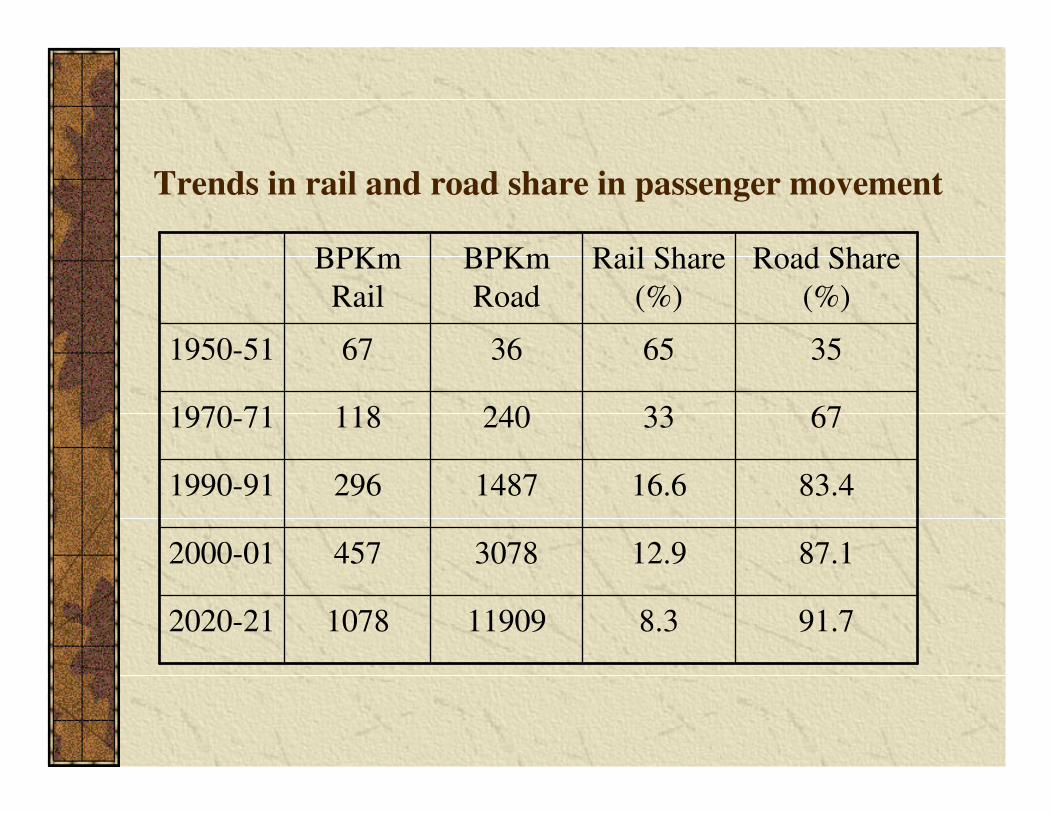
Trends in rail and road share in passenger movement
91.78.31190910782020-21
87.112.930784572000-01
83.416.614872961990-91
67332401181970-71
356536671950-51
Road Share
(%)
Rail Share
(%)
BPKm
Road
BPKm
Rail
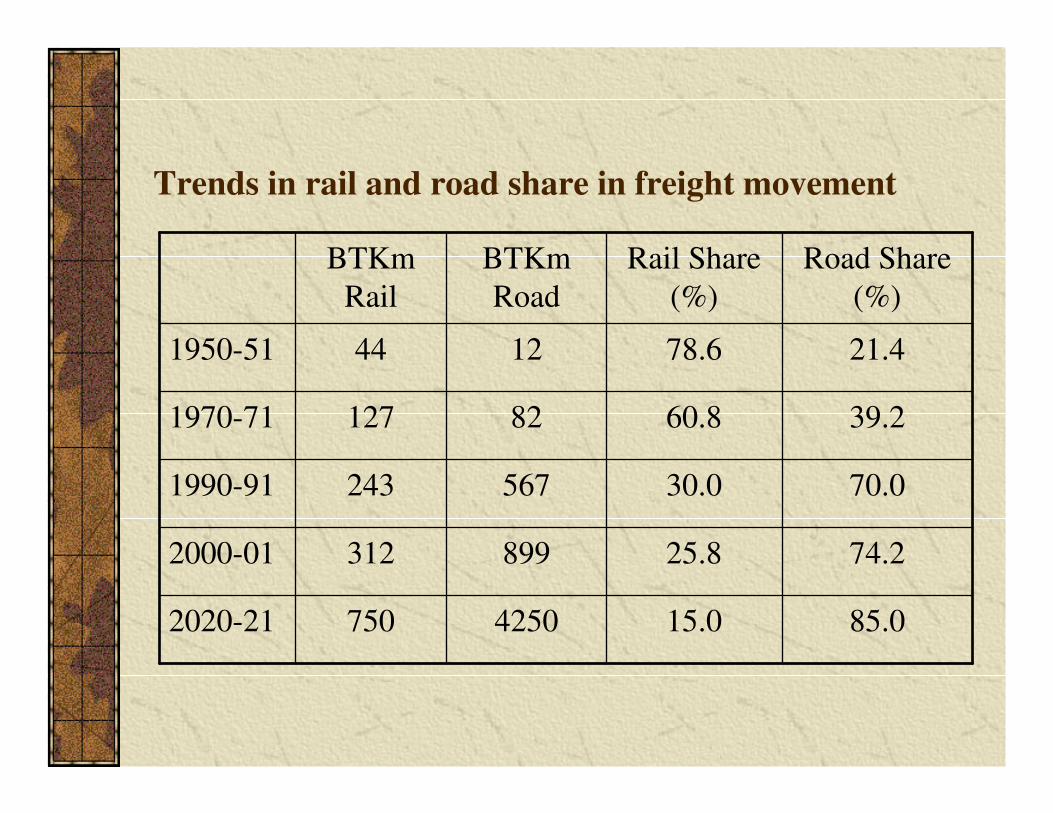
Trends in rail and road share in freight movement
85.015.042507502020-21
74.225.88993122000-01
70.030.05672431990-91
39.260.8821271970-71
21.478.612441950-51
Road Share
(%)
Rail Share
(%)
BTKm
Road
BTKm
Rail
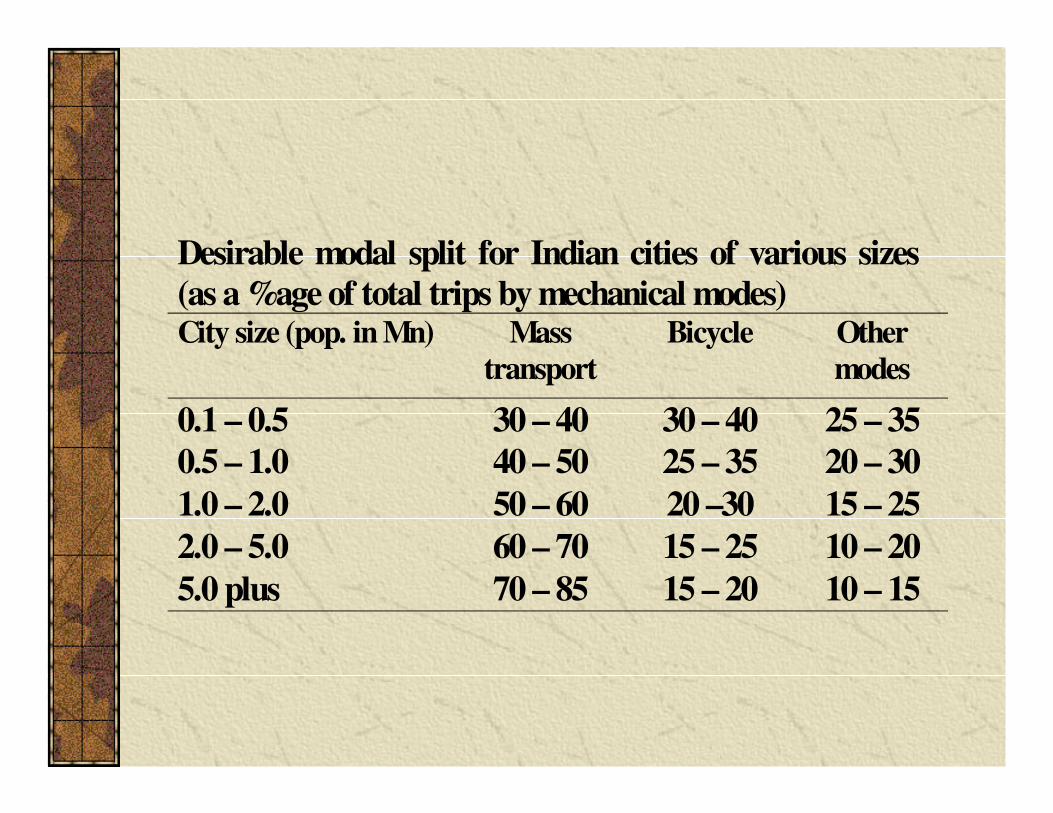
Desirable modal split for Indian cities of various sizes
(as a %age of total trips by mechanical modes) City size (pop. in Mn) Mass
transport
Bicycle Other
modes
0.1 – 0.5 30 – 40 30 – 40 25 – 35
0.5 – 1.0 40 – 50 25 – 35 20 – 30
1.0 – 2.0 50 – 60 20 –30 15 – 25
2.0 – 5.0 60 – 70 15 – 25 10 – 20
5.0 plus 70 – 85 15 – 20 10 – 15
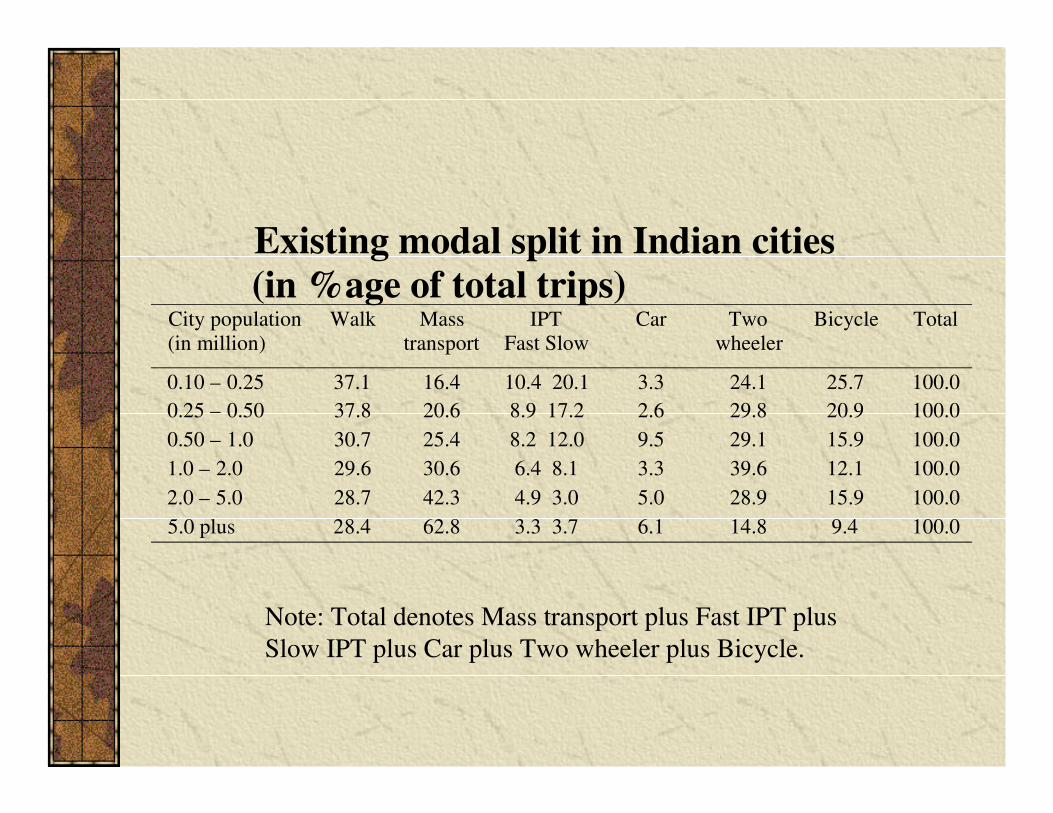
Existing modal split in Indian cities
(in %age of total trips)City population
(in million)
Walk Mass
transport
IPT
Fast Slow
Car Two
wheeler
Bicycle Total
0.10 – 0.25 37.1 16.4 10.4 20.1 3.3 24.1 25.7 100.0
0.25 – 0.50 37.8 20.6 8.9 17.2 2.6 29.8 20.9 100.0
0.50 – 1.0 30.7 25.4 8.2 12.0 9.5 29.1 15.9 100.0
1.0 – 2.0 29.6 30.6 6.4 8.1 3.3 39.6 12.1 100.0
2.0 – 5.0 28.7 42.3 4.9 3.0 5.0 28.9 15.9 100.0
5.0 plus 28.4 62.8 3.3 3.7 6.1 14.8 9.4 100.0
Note: Total denotes Mass transport plus Fast IPT plus
Slow IPT plus Car plus Two wheeler plus Bicycle.
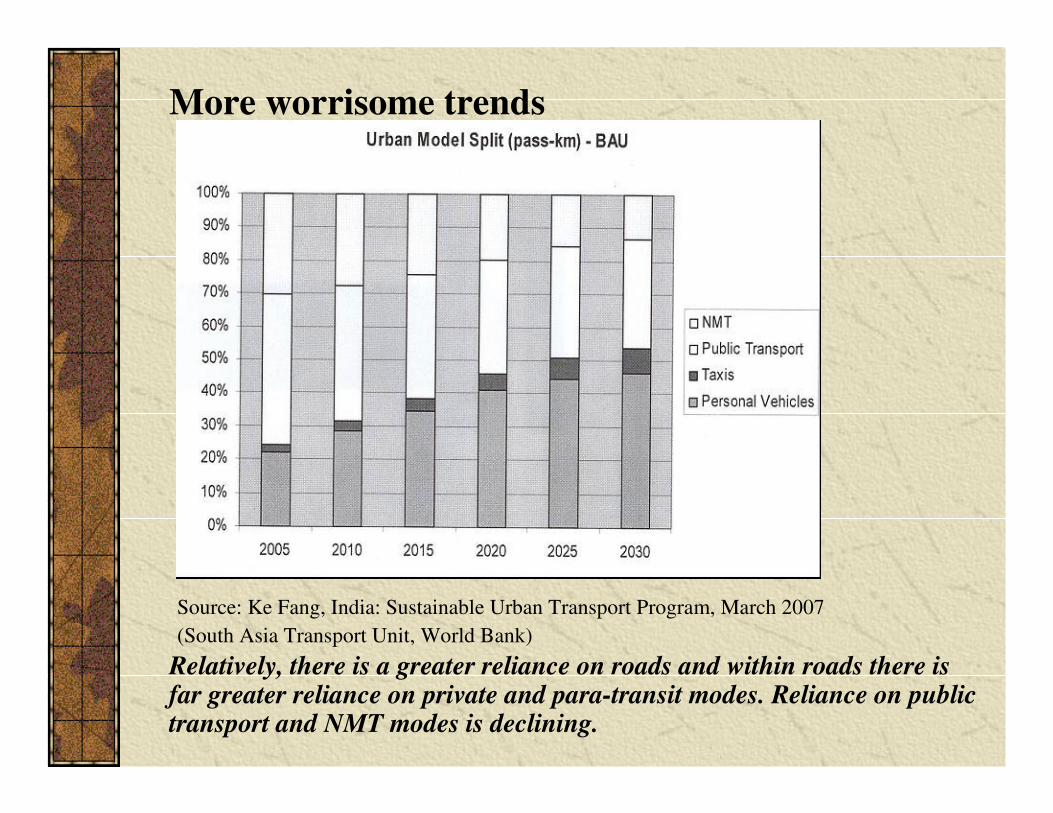
More worrisome trends
Relatively, there is a greater reliance on roads and within roads there is far greater reliance on private and para-transit modes. Reliance on public transport and NMT modes is declining.
Source: Ke Fang, India: Sustainable Urban Transport Program, March 2007
(South Asia Transport Unit, World Bank)
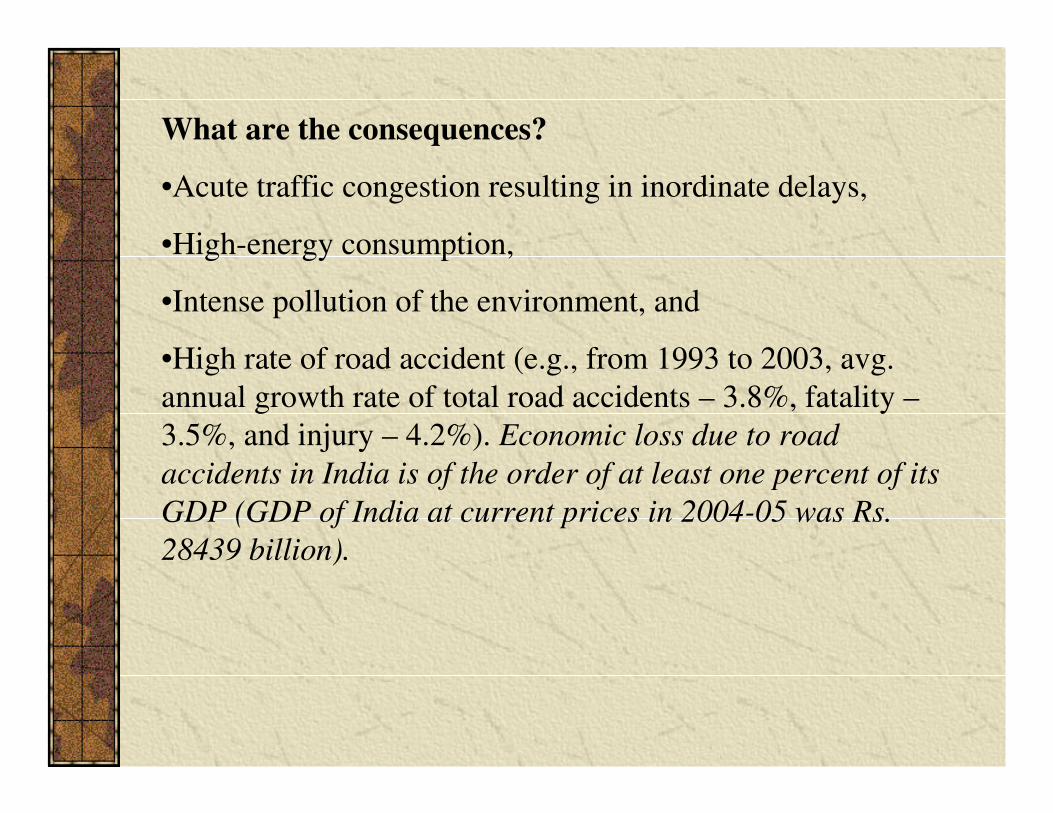
What are the consequences?
•Acute traffic congestion resulting in inordinate delays,
•High-energy consumption,
•Intense pollution of the environment, and
•High rate of road accident (e.g., from 1993 to 2003, avg.
annual growth rate of total road accidents – 3.8%, fatality –
3.5%, and injury – 4.2%). Economic loss due to road
accidents in India is of the order of at least one percent of its
GDP (GDP of India at current prices in 2004-05 was Rs.
28439 billion).
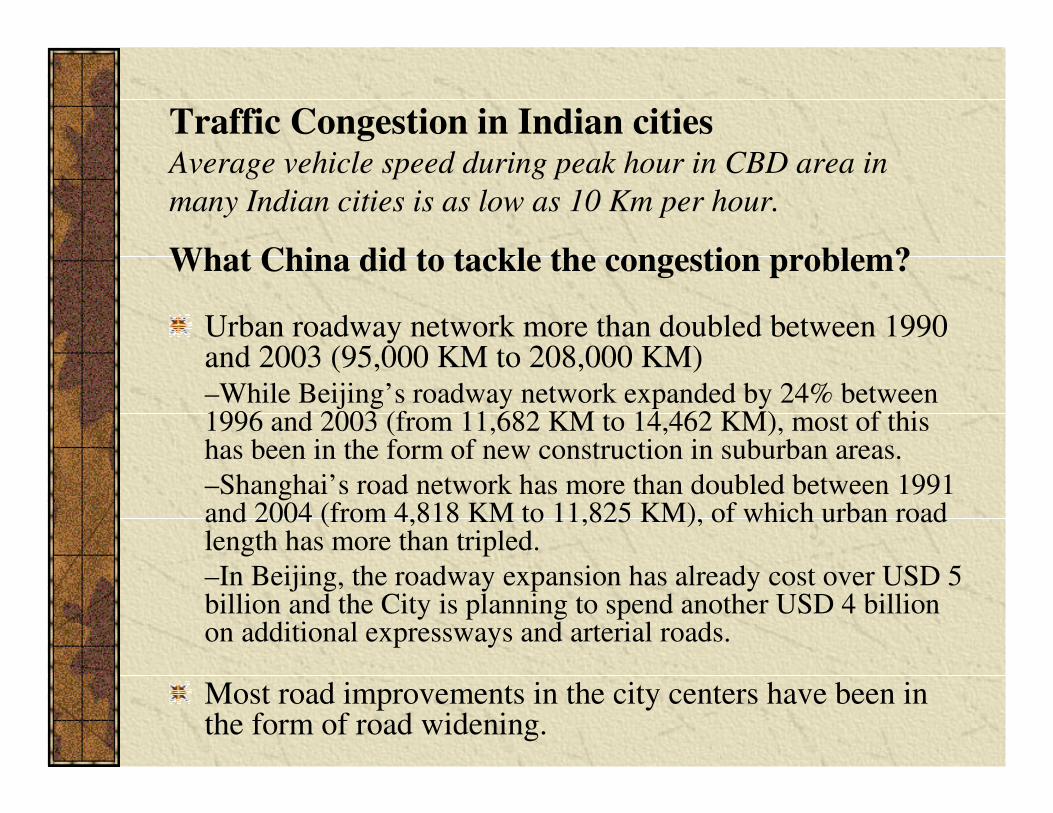
Traffic Congestion in Indian citiesAverage vehicle speed during peak hour in CBD area in
many Indian cities is as low as 10 Km per hour.
What China did to tackle the congestion problem?
Urban roadway network more than doubled between 1990 and 2003 (95,000 KM to 208,000 KM)–While Beijing’s roadway network expanded by 24% between 1996 and 2003 (from 11,682 KM to 14,462 KM), most of this has been in the form of new construction in suburban areas.
–Shanghai’s road network has more than doubled between 1991 and 2004 (from 4,818 KM to 11,825 KM), of which urban road length has more than tripled.
–In Beijing, the roadway expansion has already cost over USD 5 billion and the City is planning to spend another USD 4 billion on additional expressways and arterial roads.
Most road improvements in the city centers have been in the form of road widening.
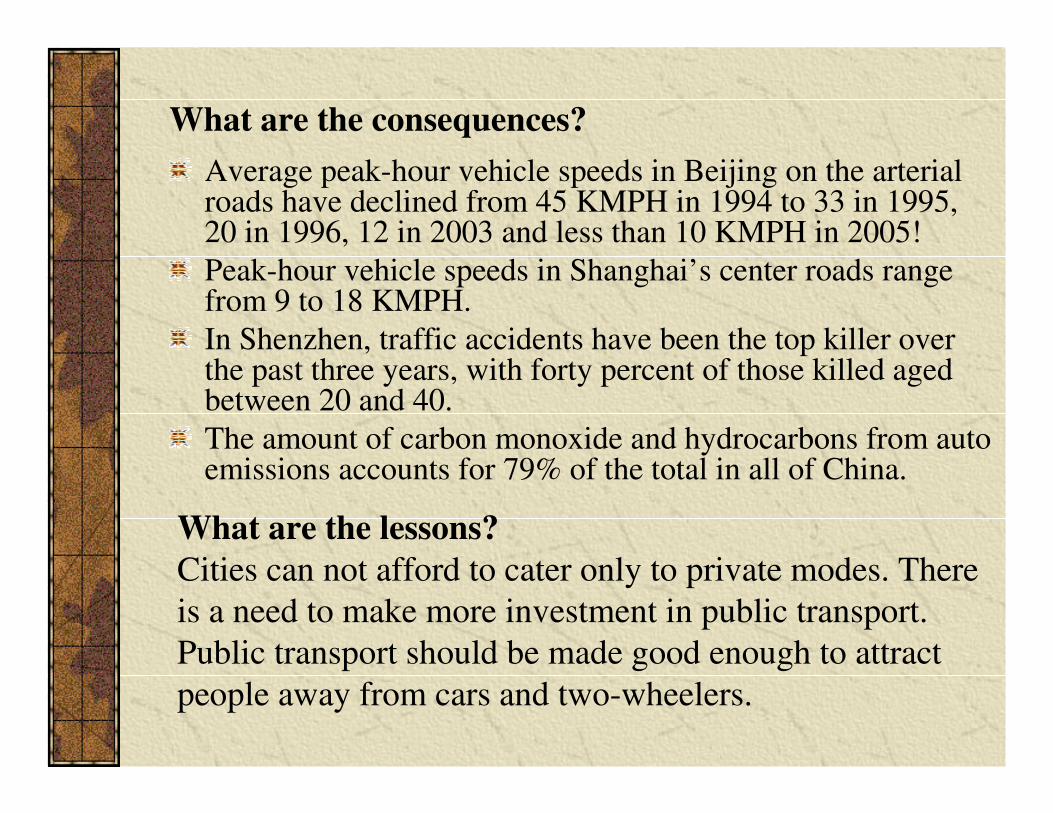
What are the consequences?
Average peak-hour vehicle speeds in Beijing on the arterial roads have declined from 45 KMPH in 1994 to 33 in 1995, 20 in 1996, 12 in 2003 and less than 10 KMPH in 2005!
Peak-hour vehicle speeds in Shanghai’s center roads range from 9 to 18 KMPH.
In Shenzhen, traffic accidents have been the top killer over the past three years, with forty percent of those killed aged between 20 and 40.
The amount of carbon monoxide and hydrocarbons from auto emissions accounts for 79% of the total in all of China.
What are the lessons?
Cities can not afford to cater only to private modes. There
is a need to make more investment in public transport.
Public transport should be made good enough to attract
people away from cars and two-wheelers.
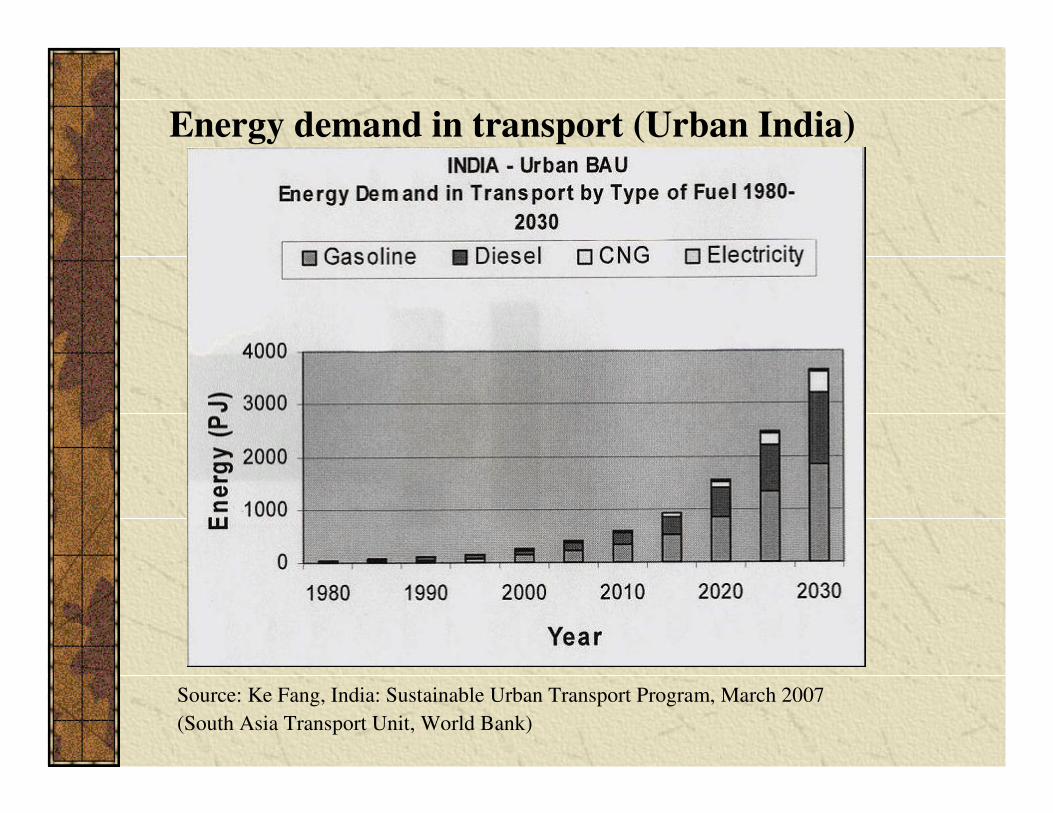
Energy demand in transport (Urban India)
Source: Ke Fang, India: Sustainable Urban Transport Program, March 2007
(South Asia Transport Unit, World Bank)
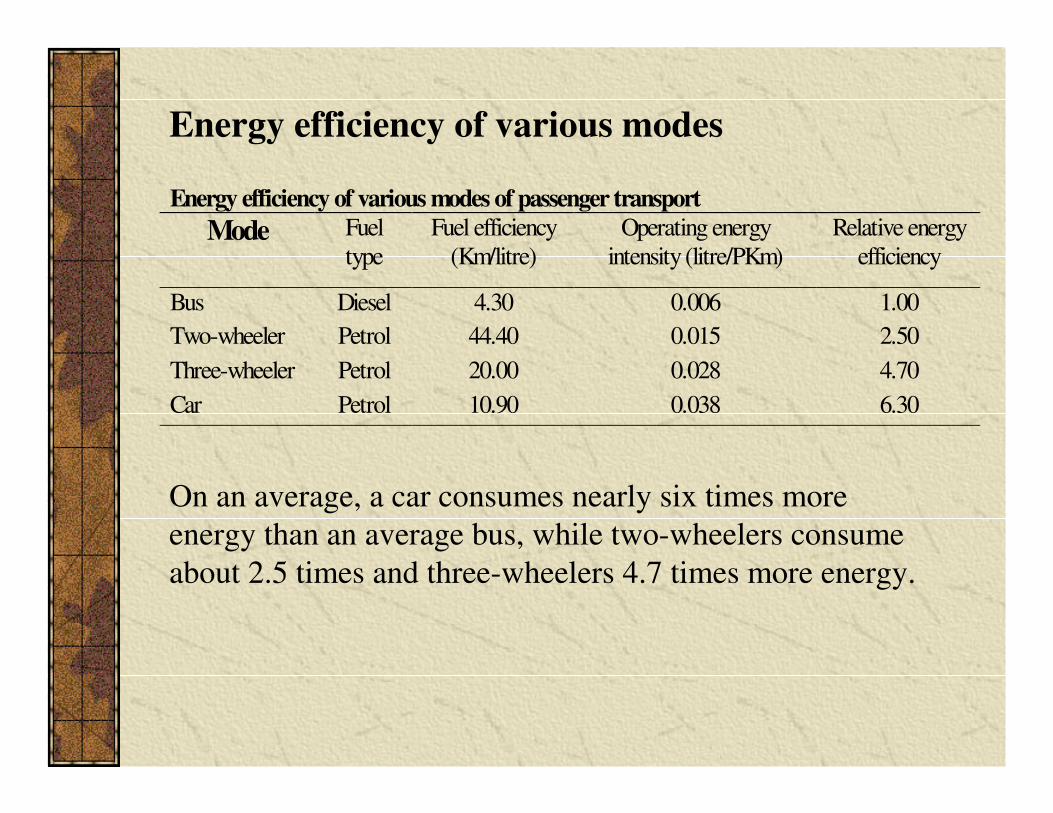
Energy efficiency of various modes of passenger transport
Mode Fuel
type
Fuel efficiency
(Km/litre)
Operating energy
intensity (litre/PKm)
Relative energy
efficiency
Bus Diesel 4.30 0.006 1.00
Two-wheeler Petrol 44.40 0.015 2.50
Three-wheeler Petrol 20.00 0.028 4.70
Car Petrol 10.90 0.038 6.30
On an average, a car consumes nearly six times more
energy than an average bus, while two-wheelers consume
about 2.5 times and three-wheelers 4.7 times more energy.
Energy efficiency of various modes
In terms of fuel cost per pass.-km, a two-wheeler is
6 times, three-wheeler 7 times, and a car is 12 times
costlier than a bus.
Furthermore, a car occupies over 38 times more road
space in comparison to a bus to provide same level of
passenger mobility (in terms of pass.-kms). The
corresponding figures for two- and three-wheelers are
54 and 15 respectively.
This shows that bus transportation is not only favorable in
terms of energy efficiency but also in terms of best
possible use of scarce road space.
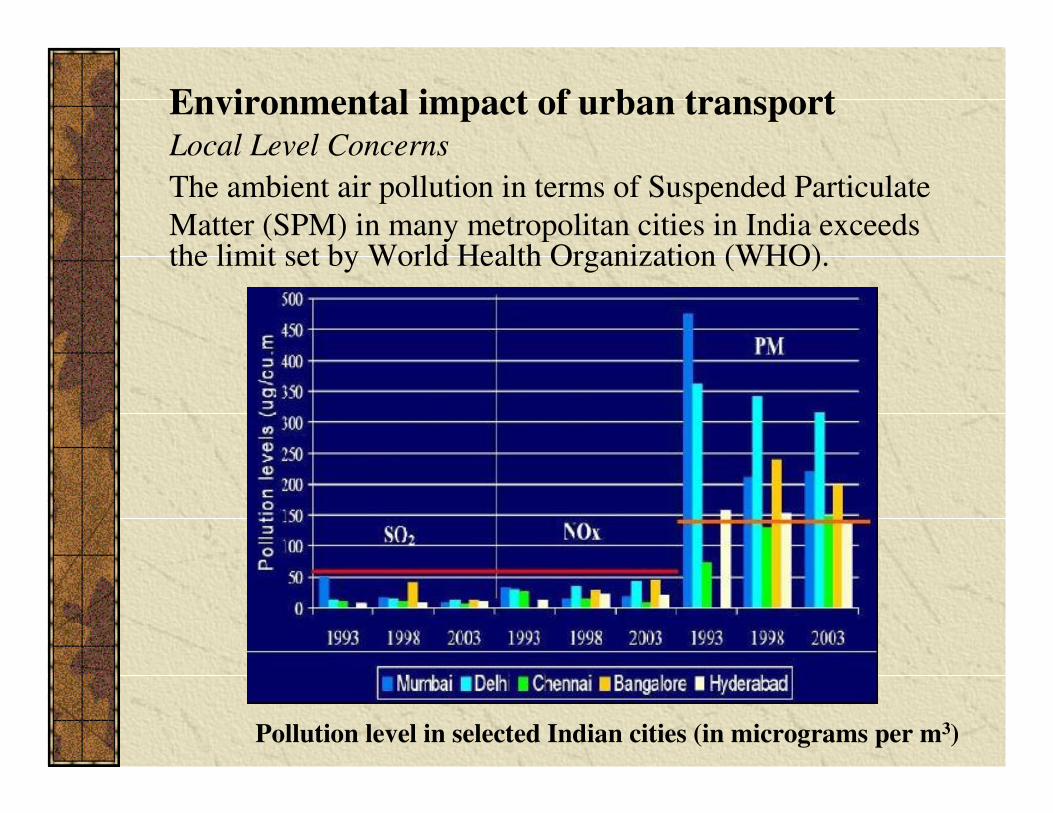
Environmental impact of urban transport
The ambient air pollution in terms of Suspended Particulate
Matter (SPM) in many metropolitan cities in India exceeds the limit set by World Health Organization (WHO).
Local Level Concerns
Pollution level in selected Indian cities (in micrograms per m3)
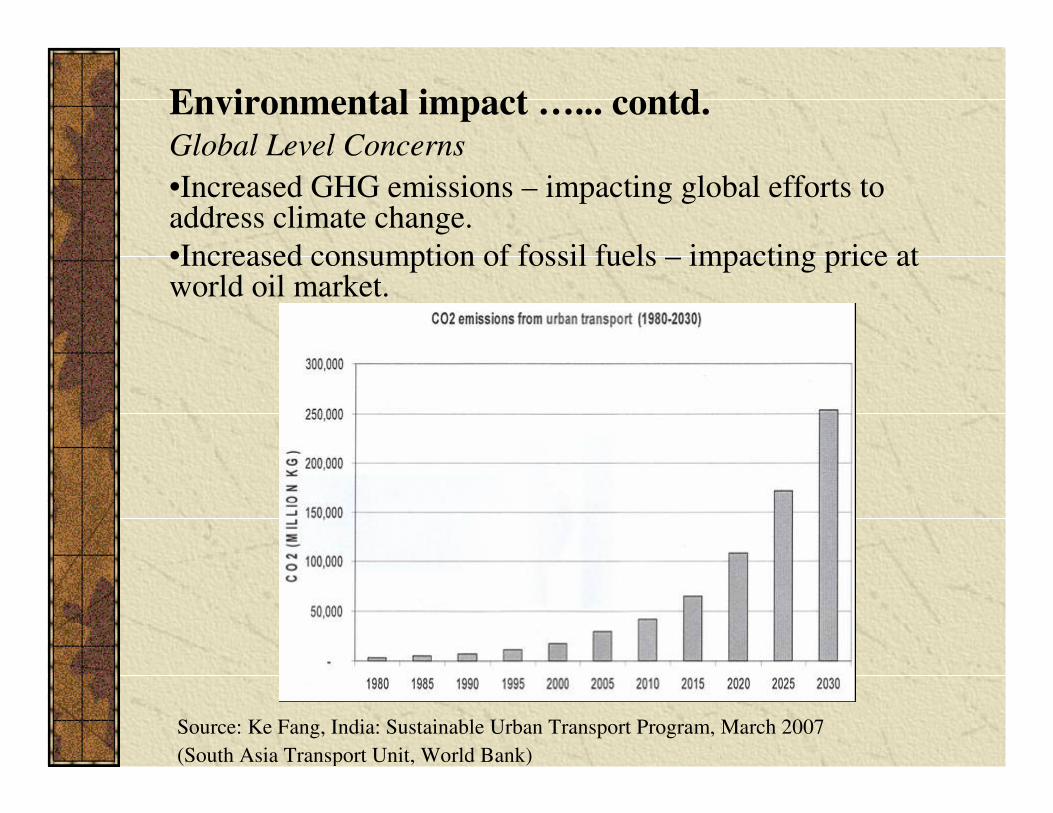
Environmental impact …... contd.
•Increased GHG emissions – impacting global efforts to address climate change.
•Increased consumption of fossil fuels – impacting price at world oil market.
Global Level Concerns
Source: Ke Fang, India: Sustainable Urban Transport Program, March 2007
(South Asia Transport Unit, World Bank)
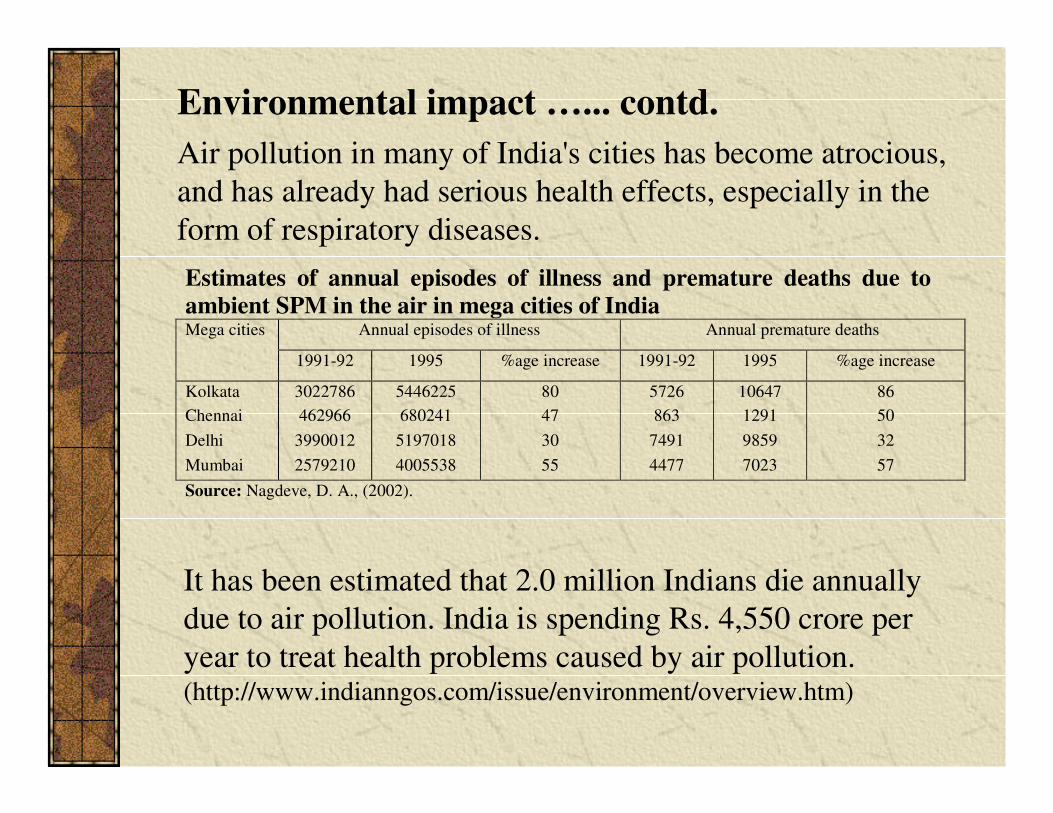
Air pollution in many of India's cities has become atrocious,
and has already had serious health effects, especially in the
form of respiratory diseases.
Estimates of annual episodes of illness and premature deaths due to
ambient SPM in the air in mega cities of India Annual episodes of illness Annual premature deaths Mega cities
1991-92 1995 %age increase 1991-92 1995 %age increase
Kolkata 3022786 5446225 80 5726 10647 86
Chennai 462966 680241 47 863 1291 50
Delhi 3990012 5197018 30 7491 9859 32
Mumbai 2579210 4005538 55 4477 7023 57
Source: Nagdeve, D. A., (2002).
It has been estimated that 2.0 million Indians die annually
due to air pollution. India is spending Rs. 4,550 crore per
year to treat health problems caused by air pollution. (http://www.indianngos.com/issue/environment/overview.htm)
Environmental impact …... contd.
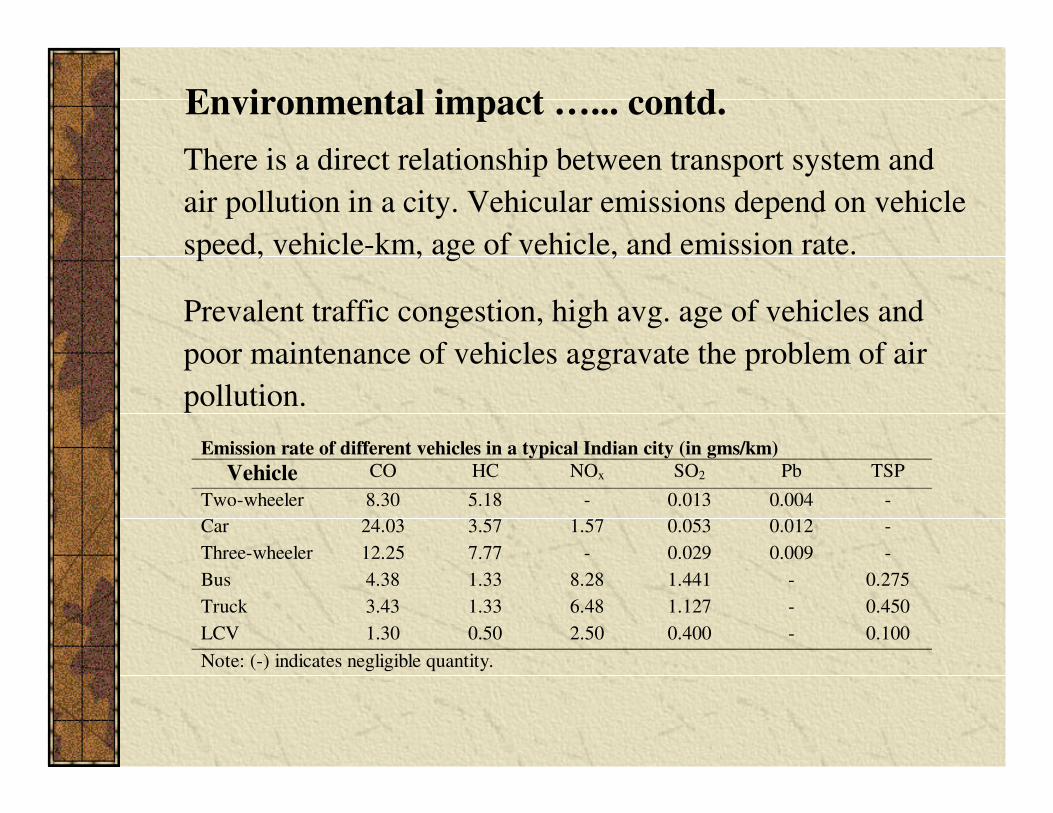
There is a direct relationship between transport system and
air pollution in a city. Vehicular emissions depend on vehicle
speed, vehicle-km, age of vehicle, and emission rate.
Prevalent traffic congestion, high avg. age of vehicles and
poor maintenance of vehicles aggravate the problem of air
pollution.
Emission rate of different vehicles in a typical Indian city (in gms/km)
Vehicle CO HC NOx SO2 Pb TSP
Two-wheeler 8.30 5.18 - 0.013 0.004 -
Car 24.03 3.57 1.57 0.053 0.012 -
Three-wheeler 12.25 7.77 - 0.029 0.009 -
Bus 4.38 1.33 8.28 1.441 - 0.275
Truck 3.43 1.33 6.48 1.127 - 0.450
LCV 1.30 0.50 2.50 0.400 - 0.100
Note: (-) indicates negligible quantity.
Environmental impact …... contd.
The average peak hour speed in Indian cities is far less than
the optimum one. According to Centre for Science and
Environment (CSE), the quantity of all the three major air
pollutants (namely, CO, hydrocarbons, and nitrogen oxides)
drastically increases with reduction in motor vehicle speeds.
For example, at a speed of 75 kmph, emission of CO is 6.4
gm/veh.-km, which increases by five times to 33.0 gm/veh.-
km at a speed of 10 kmph. Similarly, emission of
hydrocarbons, at the same speeds, increases by 4.8 times
from 0.93 to 4.47 gm/veh.-km. Thus, traffic congestion not
only increases delay but also the pollution level.
Environmental impact …... contd.
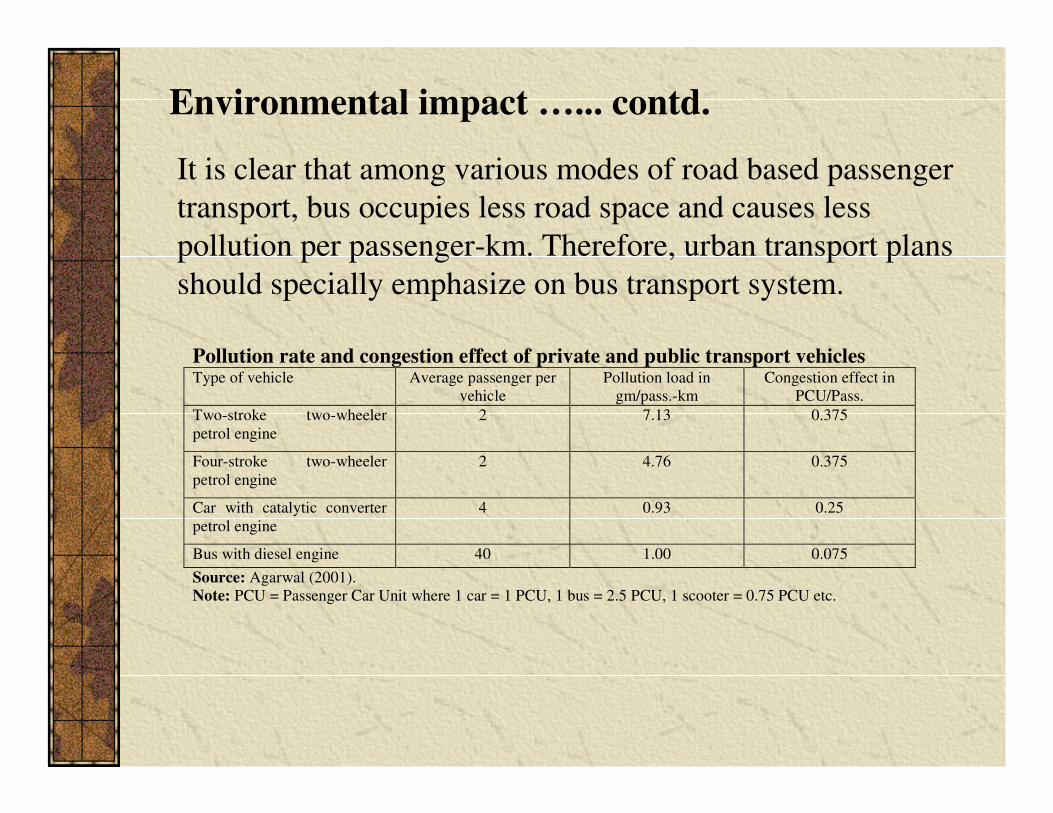
Pollution rate and congestion effect of private and public transport vehicles Type of vehicle Average passenger per
vehicle
Pollution load in
gm/pass.-km
Congestion effect in
PCU/Pass.
Two-stroke two-wheeler
petrol engine
2 7.13 0.375
Four-stroke two-wheeler
petrol engine
2 4.76 0.375
Car with catalytic converter
petrol engine
4 0.93 0.25
Bus with diesel engine 40 1.00 0.075
Source: Agarwal (2001).
Note: PCU = Passenger Car Unit where 1 car = 1 PCU, 1 bus = 2.5 PCU, 1 scooter = 0.75 PCU etc.
It is clear that among various modes of road based passenger
transport, bus occupies less road space and causes less
pollution per passenger-km. Therefore, urban transport plans
should specially emphasize on bus transport system.
Environmental impact …... contd.
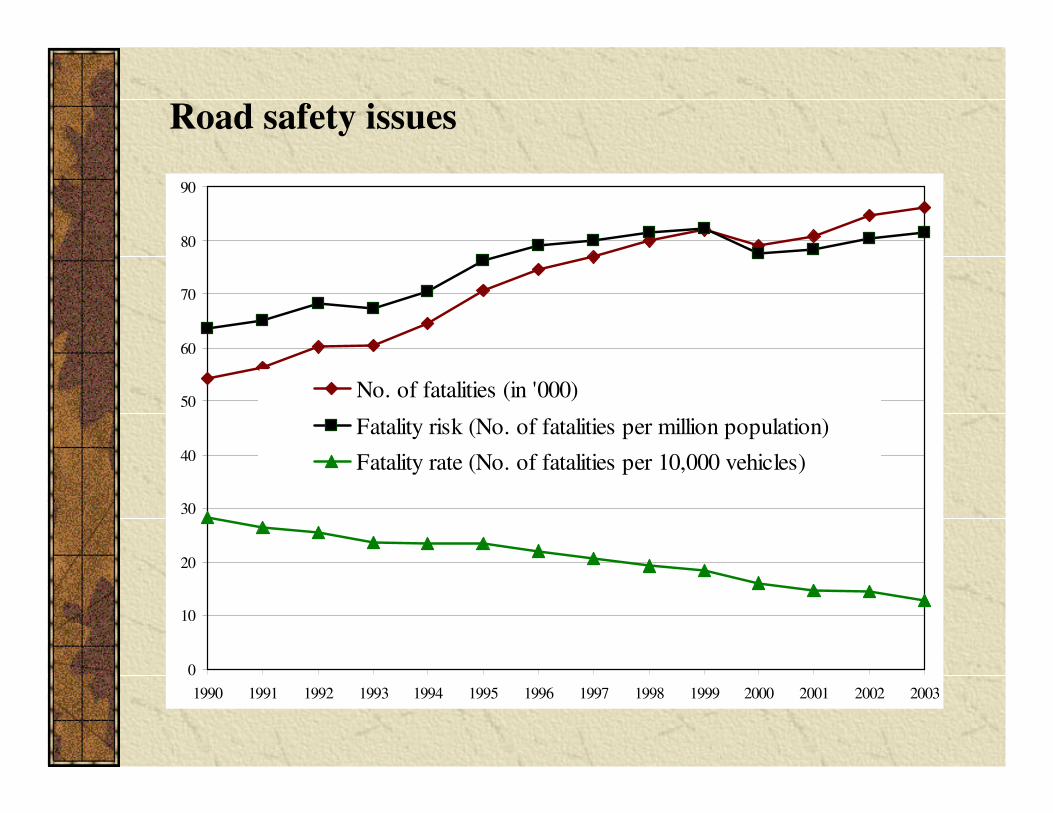
Road safety issues
0
10
20
30
40
50
60
70
80
90
1990 1991 1992 1993 1994 1995 1996 1997 1998 1999 2000 2001 2002 2003
No. of fatalities (in '000)
Fatality risk (No. of fatalities per million population)
Fatality rate (No. of fatalities per 10,000 vehicles)
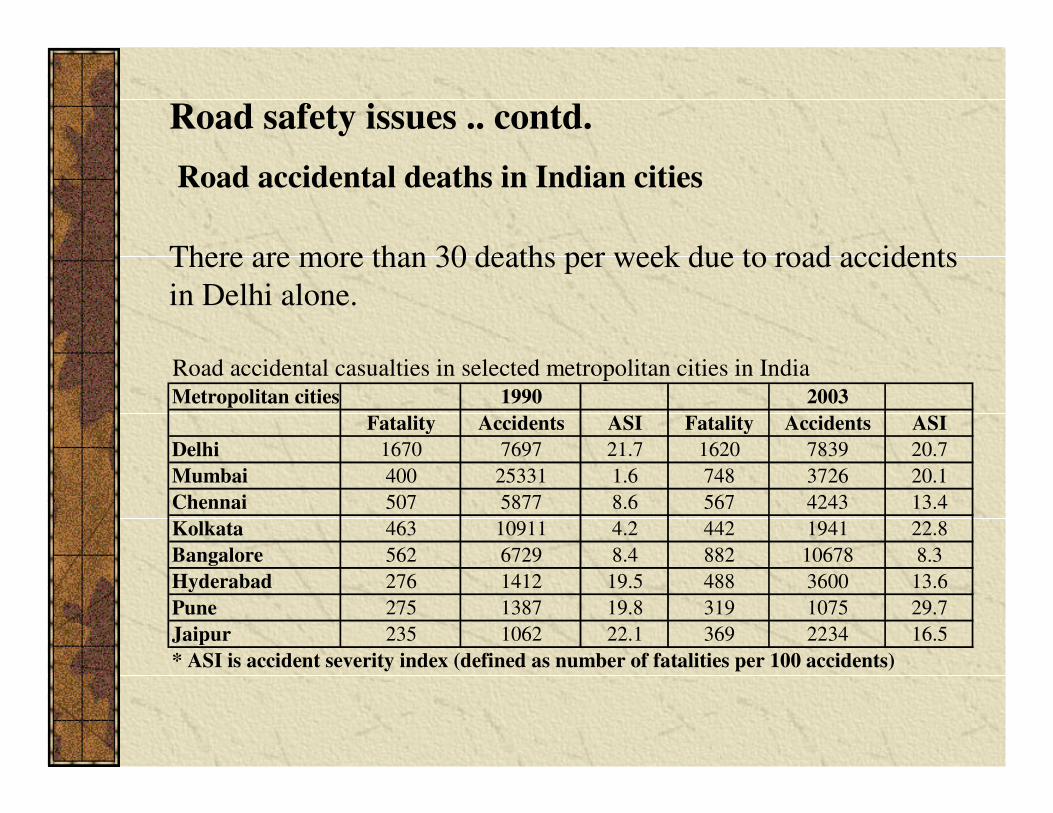
Road accidental casualties in selected metropolitan cities in India
Metropolitan cities 1990 2003
Fatality Accidents ASI Fatality Accidents ASI
Delhi 1670 7697 21.7 1620 7839 20.7
Mumbai 400 25331 1.6 748 3726 20.1
Chennai 507 5877 8.6 567 4243 13.4
Kolkata 463 10911 4.2 442 1941 22.8
Bangalore 562 6729 8.4 882 10678 8.3
Hyderabad 276 1412 19.5 488 3600 13.6
Pune 275 1387 19.8 319 1075 29.7
Jaipur 235 1062 22.1 369 2234 16.5
* ASI is accident severity index (defined as number of fatalities per 100 accidents)
Road accidental deaths in Indian cities
There are more than 30 deaths per week due to road accidents
in Delhi alone.
Road safety issues .. contd.
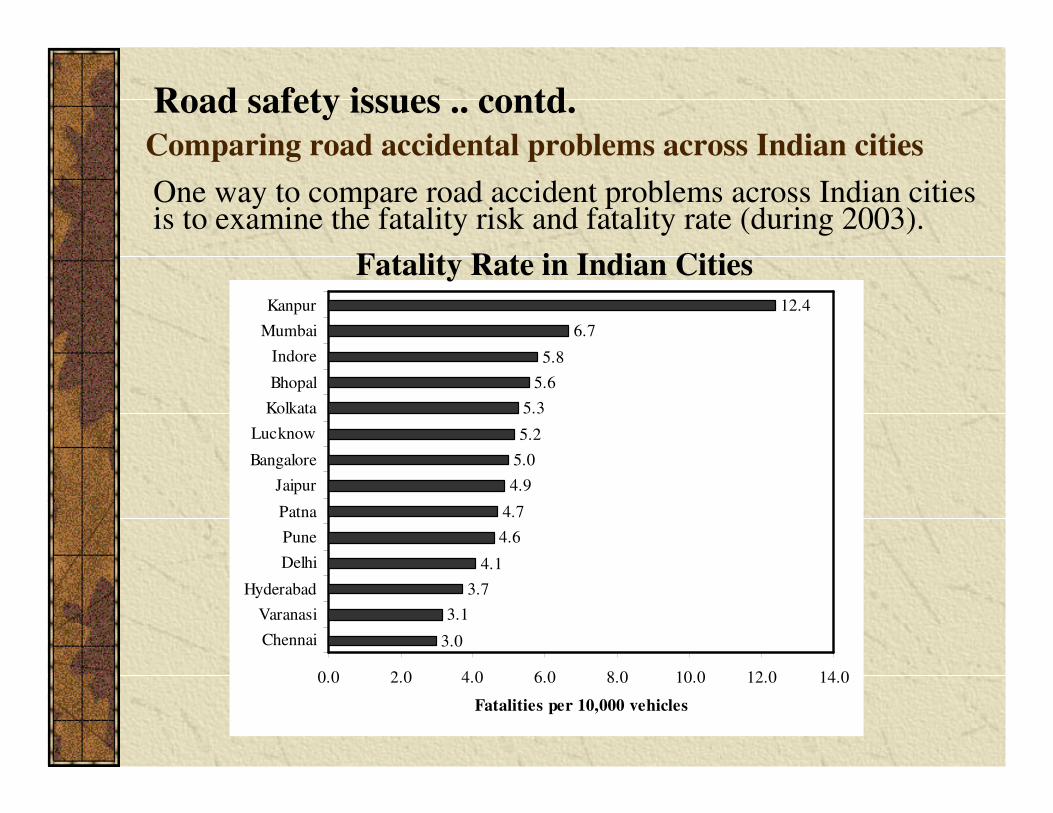
Comparing road accidental problems across Indian cities
One way to compare road accident problems across Indian cities is to examine the fatality risk and fatality rate (during 2003).
3.0
3.1
3.7
4.1
4.6
4.7
4.9
5.0
5.2
5.3
5.6
5.8
6.7
12.4
0.0 2.0 4.0 6.0 8.0 10.0 12.0 14.0
Chennai
Varanasi
Hyderabad
Delhi
Pune
Patna
Jaipur
Bangalore
Lucknow
Kolkata
Bhopal
Indore
Mumbai
Kanpur
Fatalities per 10,000 vehicles
Fatality Rate in Indian Cities
Road safety issues .. contd.
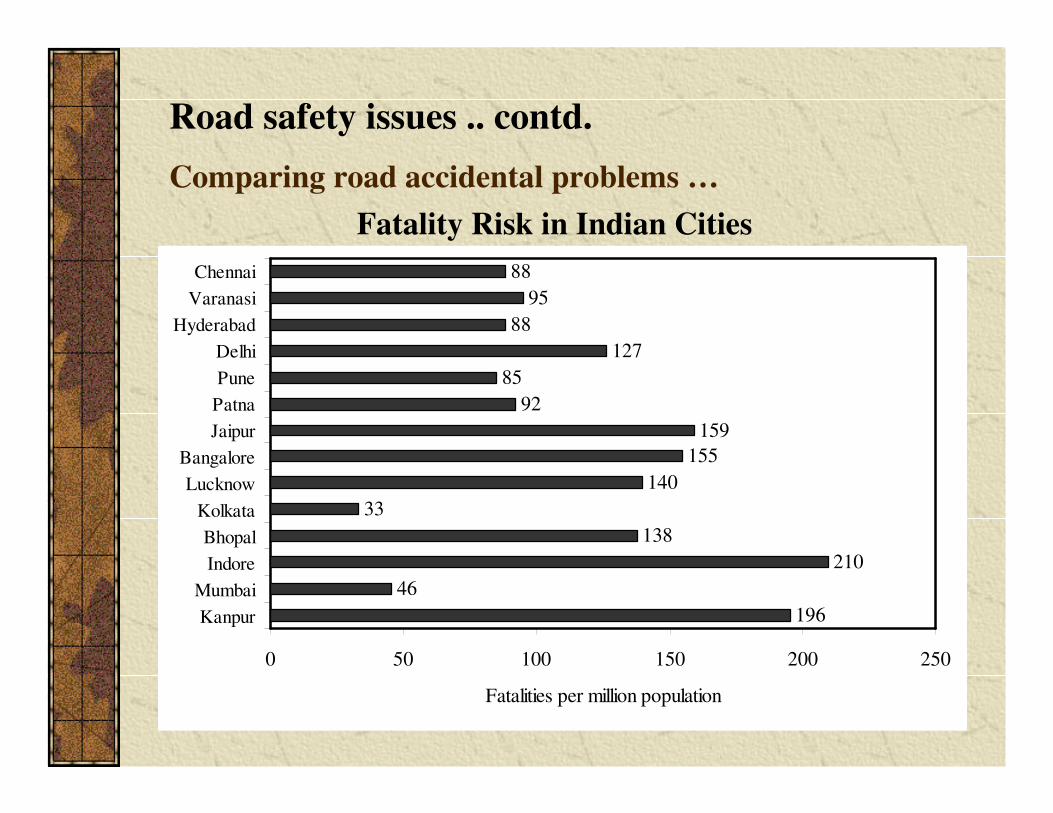
Comparing road accidental problems …
Fatality Risk in Indian Cities
196
46
210
138
33
140
155
159
92
85
127
88
95
88
0 50 100 150 200 250
Kanpur
Mumbai
Indore
Bhopal
Kolkata
Lucknow
Bangalore
Jaipur
Patna
Pune
Delhi
Hyderabad
Varanasi
Chennai
Fatalities per million population
Road safety issues .. contd.
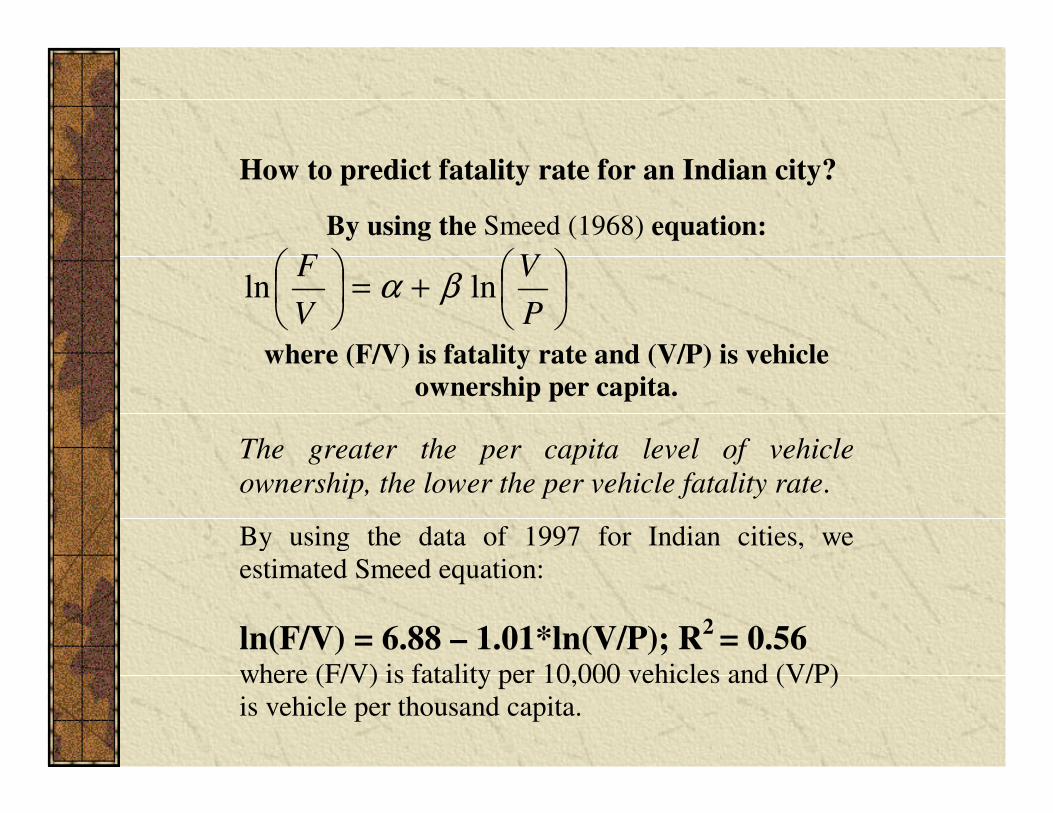
How to predict fatality rate for an Indian city?
By using the Smeed (1968) equation:
+=
P
V
V
Flnln βα
where (F/V) is fatality rate and (V/P) is vehicle
ownership per capita.
The greater the per capita level of vehicle
ownership, the lower the per vehicle fatality rate.
By using the data of 1997 for Indian cities, we
estimated Smeed equation:
ln(F/V) = 6.88 – 1.01*ln(V/P); R2 = 0.56
where (F/V) is fatality per 10,000 vehicles and (V/P)
is vehicle per thousand capita.
-1
0
1
2
3
4
5
2.8 3.3 3.8 4.3 4.8 5.3 5.8 6.3 6.8
ln(V/P)
ln(F
/V)
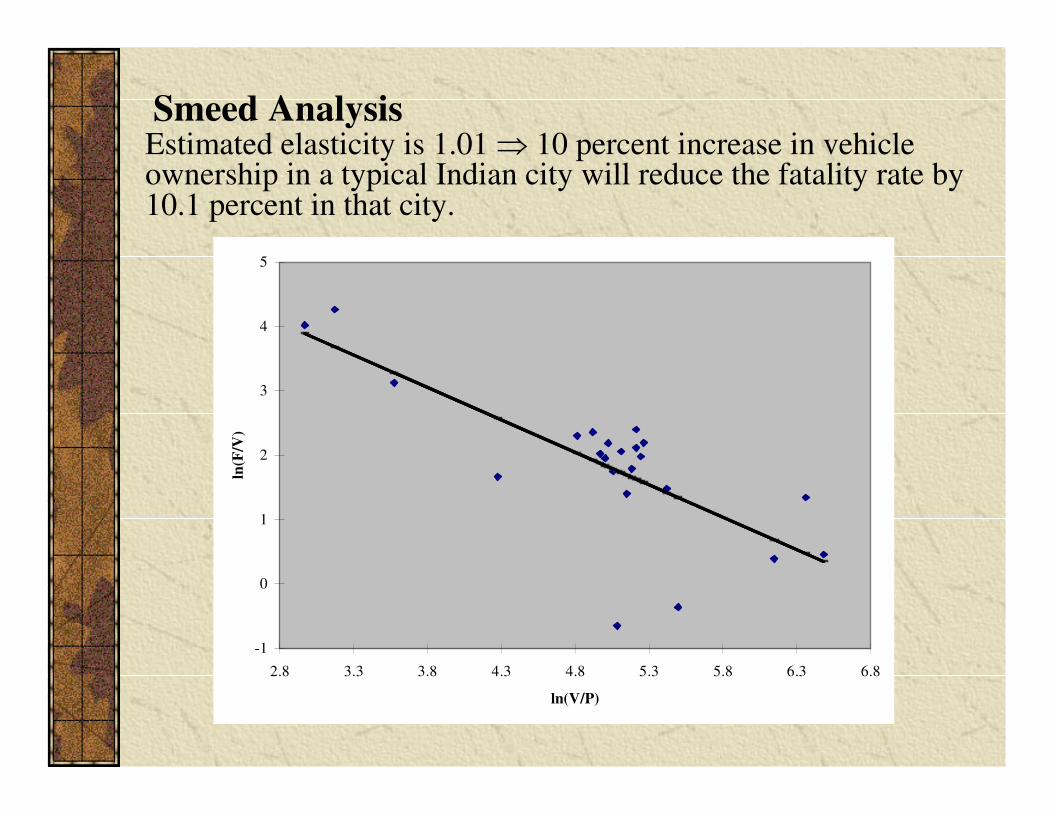
Smeed AnalysisEstimated elasticity is 1.01 ⇒ 10 percent increase in vehicle ownership in a typical Indian city will reduce the fatality rate by 10.1 percent in that city.
Nevertheless, road accidental fatality will continue to be a
serious problem in Indian cities.
Some observations
•The most productive age group (31-45 years) is the most prone to road accident fatality. The adult working age group (18 to 60 years) accounts for more than 80 percent of all casualties in many cities.
•According to the Government’s statistics, most of the accidents are caused by drivers’ fault. Bad weather, bad roads, mechanical failures, and pedestrians’ faults are other (minor) reasons for accidents. Data collection process needs improvement.
•Pedestrians, cyclists, and motor cyclists death as a percentage of all road fatalities are extremely high. Over 50% of all traffic fatalities are pedestrians.
•Focusing on public transport particularly bus transport
•Public transport has lower external costs vis-à-vis private
modes
•Promoting rail-based transport system in high density
corridors
• Focusing on bus transport throughout the country (due
to its cost effectiveness and flexibility)
•Restructuring of tax policy to promote bus transport
•Restructuring the STUs/MTUs
•Rationalizing the fare and adopting a robust
automatic fare revision formula
•Optimize scale of operations
•Introducing different variety of services
•Improving passenger information system
Policy measures
•Focusing on public … contd.
•Productivity enhancement measure
•Reducing staff to bus ratio
•Increasing bus utilization (bus-km per day)
•Using smaller capacity vehicle along low-density
routes
•Hiring of buses
•Increasing fuel efficiency through training to
drivers
•Learning lessons from success stories (such as
BMTC)
•Focusing on public … contd
•Enhancing coordination between STUs and PBOs and
encouraging PBOs in non-STU operated cities with
adequate regulatory mechanism
•Improving efficiency of operation through competitive
pressure (competitive pressure may be obtained either
through direct competition for the market or through some
form of systematic comparison with similar operators)
•Government initiative to reform the labor market so that
actual wage in urban transport undertakings is equal to
market rate (India’s employment elasticity of output
growth is declining, from 0.52 during 1983-94 to 0.16
during 1993-2000)
•Adopting optimal pricing strategies for transport services
Government should use market based instruments to
increase the (actual) marginal cost of private vehicle use
to a level where it is equal to the marginal social costs of
the same.
Publicly owned urban transport undertakings can think of
charging different (optimal) prices for different quality of
services.
Apart from this one could also envisage differential
pricing mechanism such as peak period, off-peak period,
peak-direction, off-peak direction etc. based pricing
strategy.
•Enhancing transport coordination
(e.g., buses should operate on main corridors whereas IPTs
should serve on feeder routes)
To encourage people to use public transport, there is a
need to have transportation system which is seamlessly
integrated across all modes of public transport. There is a
need to have a coordinating authority with the assigned
role of coordinating the operations of various modes.
•Promoting car sharing
Car sharing is when two or more people share a car and
travel together. It allows people to have the convenience of
the car, but at the same time helps to reduce congestion
and pollution through reduction in vehicle kilometers.
•Restraining the use of polluting vehicles and fuels
Government should use market based instruments to
promote cleaner technology and fuel. For example, a
relatively high annual motor vehicle tax, which may be
increasing with the age of vehicle, may be imposed on
two stroke two-wheelers and all vehicles that are more
than say 10 years old. Similarly, cars that use diesel
could be discouraged in million plus cities by levying
cess on diesel in those cities (Diesel cars generate not
only higher CO2 emission but also high level of
particulate matter).
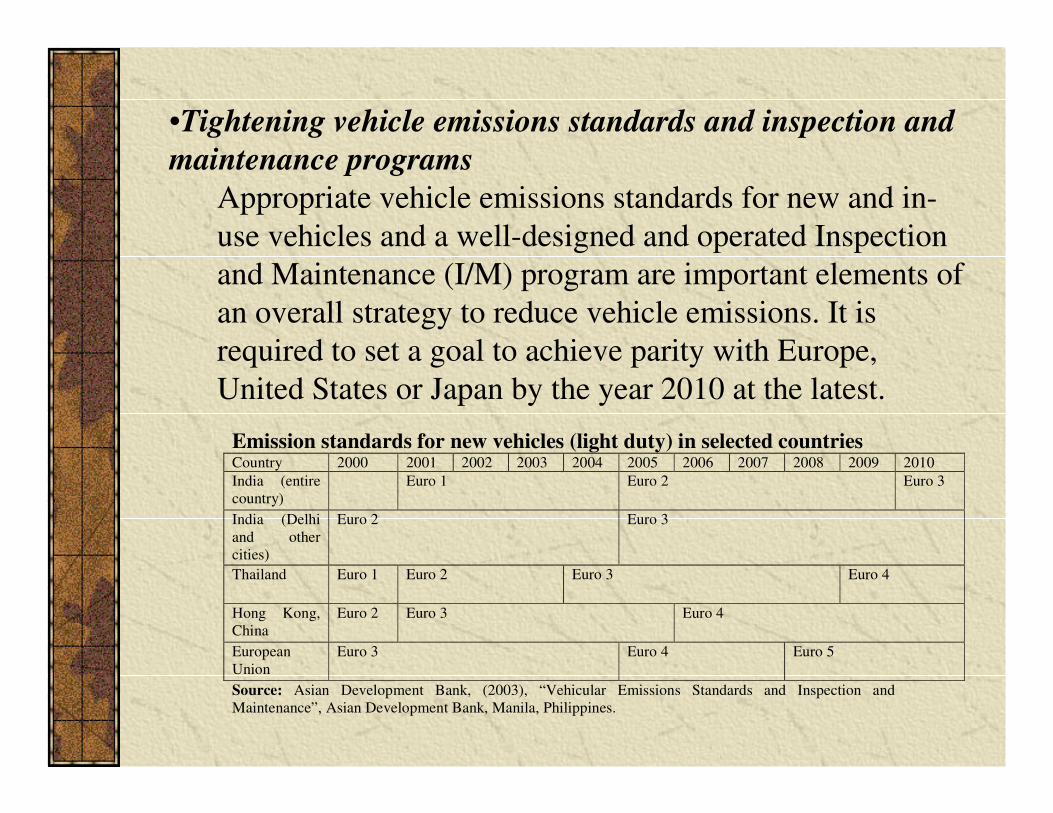
•Tightening vehicle emissions standards and inspection and
maintenance programs
Appropriate vehicle emissions standards for new and in-
use vehicles and a well-designed and operated Inspection
and Maintenance (I/M) program are important elements of
an overall strategy to reduce vehicle emissions. It is
required to set a goal to achieve parity with Europe,
United States or Japan by the year 2010 at the latest.
Emission standards for new vehicles (light duty) in selected countries Country 2000 2001 2002 2003 2004 2005 2006 2007 2008 2009 2010
India (entire
country)
Euro 1 Euro 2 Euro 3
India (Delhi
and other
cities)
Euro 2 Euro 3
Thailand Euro 1 Euro 2 Euro 3 Euro 4
Hong Kong,
China
Euro 2 Euro 3 Euro 4
European
Union
Euro 3 Euro 4 Euro 5
Source: Asian Development Bank, (2003), “Vehicular Emissions Standards and Inspection and
Maintenance”, Asian Development Bank, Manila, Philippines.
•Demand side management measures
Although policy measures that involve restraining the use
of private cars and two-wheelers are likely to be
unpopular, a gradualist approach of progressively
introducing restraints on road use, while at the same time
improving public transport, is more likely to lead to
greater acceptance. Congestion pricing, parking fee, fuel
tax, etc. could effectively be used to restrain the usage of
all personalized modes.
•Supply side management measures
There is an urgent need to use supply side management
measures also to tackle prevalent traffic congestion
problem. One way traffic system, improvement of signals,
bus priority lane, etc. could effectively be used as short-
term measures. Road infrastructure improvement
measures like new road alignments, provision of service
roads, bye passes, construction and repair of footpaths
and roads, removal of encroachments, etc. should be
introduced at least in million plus cities. These can be
considered as medium-term measures. There is a need to
have long-term measures as well, involving technology
upgradation and introduction of high speed, high capacity
public transport system particularly along high-density
traffic corridors.
•Encouraging “green” modes
An urban transport strategy should encourage the need for
developing ‘green’ modes like bicycles, cycle rickshaws,
pedestrians etc. Safety concerns of cyclists and
pedestrians must be addressed adequately. For this
purpose, there has to be a segregated right of way for
bicycles and pedestrians. Apart from improving safety,
this will help improve traffic flow, increase the average
speed of traffic and reduce emissions resulting from low
speeds.
•Introducing public awareness program
Public attitudes influence politicians and policy makers
and increase the political will to tackle problems. The
adverse health effect of air pollution due to vehicular
emission need to be better understood and communicated
as a means of influencing public attitudes. Media, NGOs
and research institutions should be encouraged to
highlight the issues, conduct independent analysis, and
advocate possible solutions to policy makers and
implementing agencies.
•Need to strengthen urban institutions
Most Indian cities have failed to address transportation
problem mainly because they are not equipped with the
appropriate institutional capacity and required financial
resources. This is because functional responsibilities for
urban transport are fragmented among central, state and
local level governments where no one seems to be in
charge of overall coordination.
There is a pressing need to empower the municipalities
so that they can raise funds for developmental projects in
urban areas by their own. Also, they may be authorized,
through legislation, for overall coordination of activities
relating to provision of transport infrastructure.
•� National Urban Renewal Mission (NURM, Nov 2005)
•National government will finance up to 50% of capital costs for urban infrastructure (including urban transport) in 63 major cities.
•Conditioned upon commitment to basic urban reforms.
• National Urban Transport Policy (April 2006)
•Develop “safe, affordable, quick, comfortable, reliable, and sustainable urban transport systems”.
•Through integrated planning, public transport and NMT, cleaner technologies, regulatory reform for public transport operations, and effective coordination.
No doubt, these are good initiatives, however, “implementation gap” is still there!
Can Government’s new initiatives work?

THANKS


![Pine Mountain State Scenic Trail, KY [Birch Knob Section 26.4 Miles]](https://img.pdfslide.net/doc/110x75/544b551aaf7959b0438b51a4/pine-mountain-state-scenic-trail-ky-birch-knob-section-264-miles.jpg)