Embed Size (px)
Citation preview
Academic Article Journal of Heat Island Institute International Vol.7-2 (2012)
Urban Vegetation Effects on the Spatial Variability of Temperature in the City Center
Minako Nabeshima*1 Masatoshi Nishioka*1 Masaki Nakao*1
Masashi Mizuno*2 Hironori Tokura*3 Shunsuke Mizutani*4
*1 Osaka City Univ., Osaka, Japan *2 Daikin Industries, Ltd., Osaka, Japan
*3 Osaka Prefectural Government, Osaka, Japan *4 Kyoto City Government, Osaka, Japan
Corresponding author email: [email protected]
ABSTRACT
This paper analyzes the present distribution of green spaces and roadside trees in Osaka City for mitigating the urban heat island phenomenon. A classification map of natural coverage was created from 1-meter resolution aerial photographs, visible images, and near-infrared images, taken in August 2006. The distribution characteristics of vegetation coverage were analyzed using three kinds of vegetation coverage index: area ratio, the entropy, and the C index. The entropy is an index of concentration and the C index is an index of continuity. The dry-bulb temperature was measured in the street using a vehicle equipped with a mobile measurement system during August 2 through 6, 2008. The dry-bulb temperature and relative humidity in urban parks were also observed at fixed points during August 2008. The results showed a relationship between temperature and continuity of vegetation coverage; the temperature was relatively lower in the street where the C index of vegetation coverage ratio was relatively higher.
Introduction Our objective in this study was to evaluate the effects of
urban vegetation on microclimate variation. The urban heat island (UHI) phenomenon significantly affects outdoor activities in summer in Osaka City. Urban parks and roadside trees can improve the thermal environment for residents. The park area per resident in Osaka City is 3.5m2, which is less than the average for other cities in Japan (i.e., 8.1m2). In comparison, the figure is 27m2 in Berlin and London, and 29m2 in New York. Osaka, especially the city center, has few parks, and it will be difficult to build new parks in the future. Therefore, it is important to maintain the existing stock of trees in parks or on roadsides and to increase the number of trees in urban parks and on roadsides for mitigation of the UHI phenomenon. In this paper we survey the current situation of vegetation coverage and temperature in Osaka City and analyze the relationship between spatial distribution of vegetation coverage and urban air temperature.
The surface-type distribution and urban-fabric makeup of four metropolitan areas were investigated to develop effective
UHI-mitigation programs (Akbari and Rose 2008). They showed that on average 29% to 41% of the area is covered with vegetation, 19% to 25% is rooftops, and 29% to 39% is a paved surface. The oasis effect of vegetation canopies on urban climate have been investigated (Taha et al. 1991). Taha et al. found the 150x307x5 m canopy was, on average, 2K cooler during daytime than were the bare and open surrounding fields. One or two rows of trees upwind of building clusters can result in savings in cooling energy.
In this paper, temperature variability in an urbanized area (e.g., small parks surrounded by buildings) is discussed from the viewpoint of urban vegetation coverage.
Method Study Area
Figure 1 shows the survey areas of Osaka City, which is roughly divided into four kinds of areas. Osaka City is located at the center of the Osaka Plain (from N34°48´ to N34°30´ and from E135°25´ to E135°38´). This area was developed in the downstream region of the Yodo River, which flows into Osaka
- 126 -
Bay. Osaka City is the second largest city in Japan and has a population of 2.63 million people in an area of 222km2. Some satellite cities on the Osaka Plain have been wholly urbanized. This study used a classification map of natural coverage, supplied by the Osaka City government. The detail maps in Figure 2 were made using GIS (geographical information system) as the basis of the classification map. Survey zone A is a traditional business area, zones B and C are modern business areas, zones D and E are urban-mixed areas, and zone R is a redeveloped commercial area. The temperature variability was observed by measurement trips around the study area (i.e., zones D and E in Figure 2) in summer 2008.
Equipment
The measurement parameters were air temperature, road-surface temperature, solar radiation from the sky, long-wave radiation from the sky, coordinated universal time (UTC), latitude, and longitude. Table 1 and Figure 3 detail the mobile measurement system. Thermocouples were set up in a radiation shield, without a ventilation device, at the position of 1,500mm from the road surface. When running at a speed of less
than 20km/h, the data were considered invalid. The measurement instruments and GPS receiver were placed on the roof of the car, and these data were stored in a data recorder (CR1000, by Campbell Scientific, Inc.) at 1-second intervals.
Index of Vegetation Coverage Area ratio. The classification map of natural coverage was used as a GIS dataset. The map was created from 1-m resolution aerial photographs, visible images, and near-infrared images taken in August 2006 by the Recreation and Tourism Bureau of the Osaka City government. The natural coverage data were classified into five types: grass field, trees or forest, productive green area, bare ground, and water surface. The vegetation coverage polygon data were created from groups of pixels, each classified as either grass field, trees or forest, or productive green area. The vegetation coverage polygon data were assigned as one of four classes, determined by coverage type at the center of gravity of the polygon: roadside trees, plants in a private site, plants in parks and public spaces, and other. The vegetation coverage ratio was counted in each 500-m2.
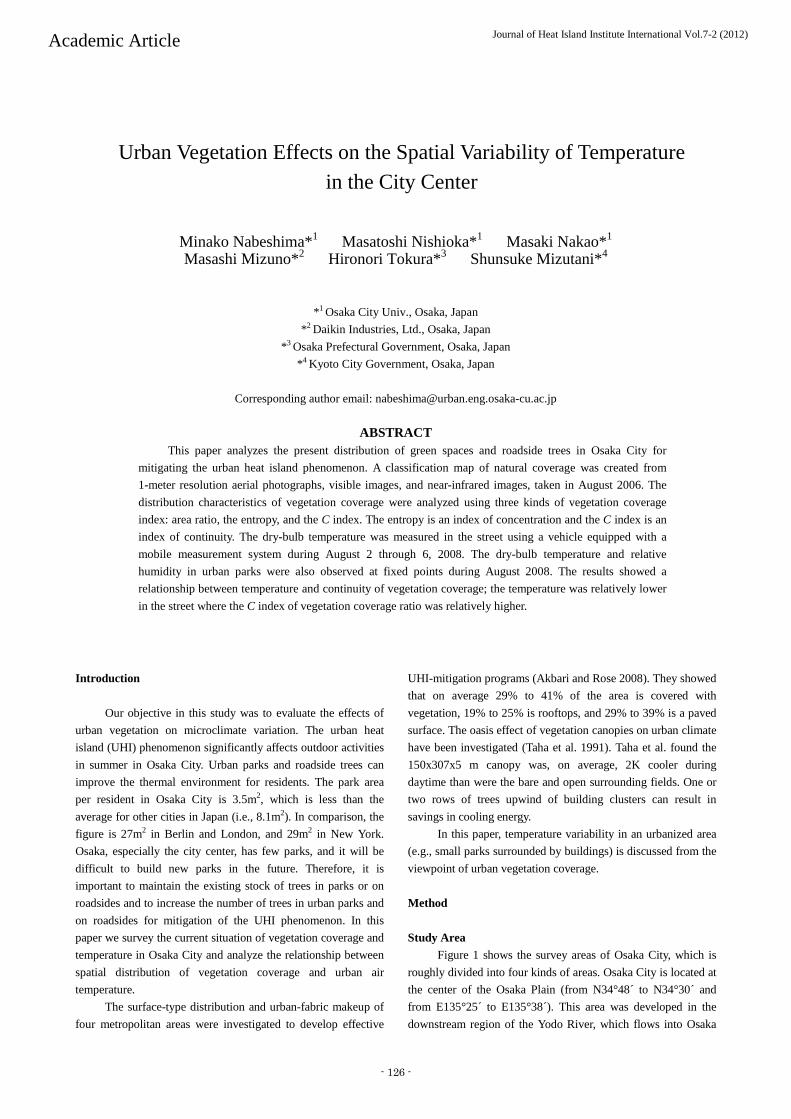
Figure 1. Map of Osaka City
The gray-shaded area shows Osaka City. Osaka City is divided into four kinds of areas: the central urban area, residential areas, the industrial coastal area, and the commercial coastal area. A, B, C, D, E, and R show the surveyed zones in detail.
Central urban area
Industrial coastal area
Commercial coastal area
Residential area
Osaka Bay
Osaka Plain
Osaka City
- 127 -
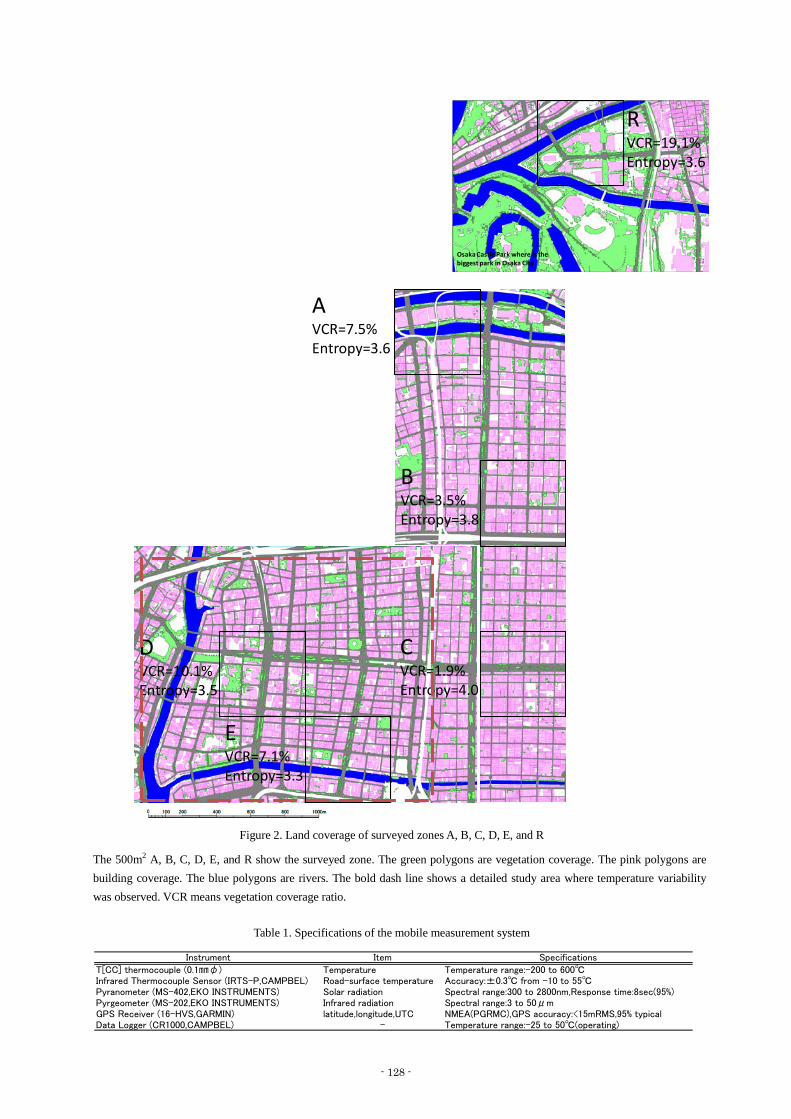
Figure 2. Land coverage of surveyed zones A, B, C, D, E, and R
The 500m2 A, B, C, D, E, and R show the surveyed zone. The green polygons are vegetation coverage. The pink polygons are building coverage. The blue polygons are rivers. The bold dash line shows a detailed study area where temperature variability was observed. VCR means vegetation coverage ratio.
Table 1. Specifications of the mobile measurement system
Instrument Item Specifications
T[CC] thermocouple (0.1㎜φ) Temperature Temperature range:-200 to 600℃Infrared Thermocouple Sensor (IRTS-P,CAMPBEL) Road-surface temperature Accuracy:±0.3℃ from -10 to 55℃Pyranometer (MS-402,EKO INSTRUMENTS) Solar radiation Spectral range:300 to 2800nm,Response time:8sec(95%)Pyrgeometer (MS-202,EKO INSTRUMENTS) Infrared radiation Spectral range:3 to 50μmGPS Receiver (16-HVS,GARMIN) latitude,longitude,UTC NMEA(PGRMC),GPS accuracy:<15mRMS,95% typicalData Logger (CR1000,CAMPBEL) - Temperature range:-25 to 50℃(operating)
RVCR=19.1%Entropy=3.6
Osaka Castle Park where is the biggest park in Osaka City
DVCR=10.1%Entropy=3.5
EVCR=7.1%Entropy=3.3
AVCR=7.5%Entropy=3.6
BVCR=3.5%Entropy=3.8
CVCR=1.9%Entropy=4.0
- 128 -
Entropy. The index of concentration and distribution entropy (Kumagai et al. 2003) was calculated in each 500-m2.
∑=
=…
=N
nnsum
N
sum
sum
XXXXX
XX
entropy121
,!!!
!log1
(1)
Where XN is the number of pixels of vegetation coverage in a polygon N; N is the number of polygons within the target area; Xsum is the total number of pixels of vegetation coverage within the target area. C index. The C index (Kobayashi et al. 2001) was suggested as an index of connectivity for the binarized-value images. The C index was applied to the continuous-value images as an index of
continuity in this study. The 2D image was composed of 10-m2 meshes, which had a cell value of vegetation ratio v.
( )90,10
1
1
1
1≤≤≤≤= ∑ ∑
+
−=
+
−=
CNvvCNx
xi
y
yjijxy
(2)
Where CNxy is a value of the cell (x,y); x is the row index of the cell; y is the column index of the cell. If vxy = 0, CNxy is set to 0. CTNxy is a sum total of CN in the area with width of K cells and length of L cells, with its center at the cell (x,y).
∑ ∑−
+
−−=
−+
−−=
=2
1
21
21
21
Kx
Kxi
Ly
Lyj
ijijxy CNCTN η
(3)
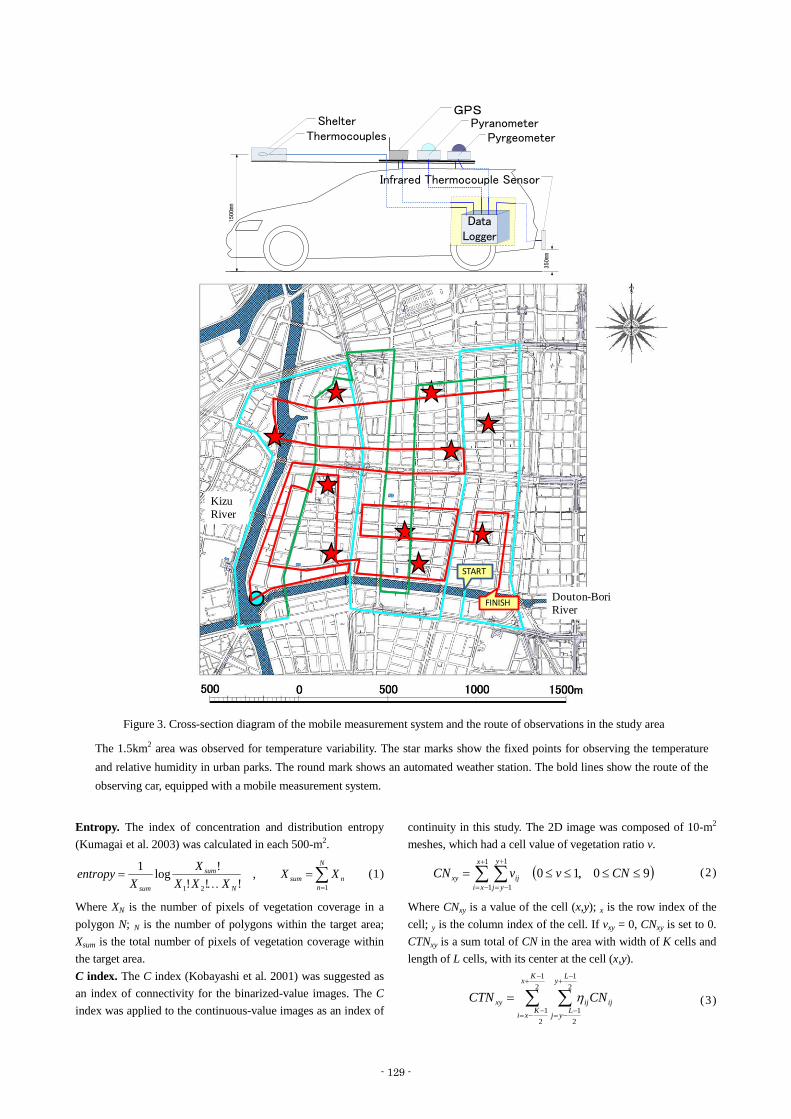
Figure 3. Cross-section diagram of the mobile measurement system and the route of observations in the study area
The 1.5km2 area was observed for temperature variability. The star marks show the fixed points for observing the temperature and relative humidity in urban parks. The round mark shows an automated weather station. The bold lines show the route of the observing car, equipped with a mobile measurement system.
Data Logger
PyrgeometerPyranometer
GPS
ThermocouplesShelter
Infrared Thermocouple Sensor
1500㎜
350㎜
Douton-BoriRiver
KizuRiver
START
FINISH
- 129 -
Where K is the number of cells in a row and L is the number of cells in a column. Both K and L are odd numbers. ηij is a dummy variable. If CNxy = 0, CTNxy is set to 0. For a cell (i,j) with CN≠0, ηij is set to 1 if a path can be traced from that cell through adjoining cells that also have CN≠0 back to the center cell (x,y) with CN≠0. If this is not possible, ηij is set to 0.
∑ ∑−
+
−−=
−+
−−=
=2
1
21
21
21
Kx
Kxi
Ly
Lyj
ij
xyxy
CTNC
η
(4)
Where the center cell (x,y) has Cxy, which is an average of CN values in the area, K times L. Results and Discussion Distribution of Vegetation Coverage
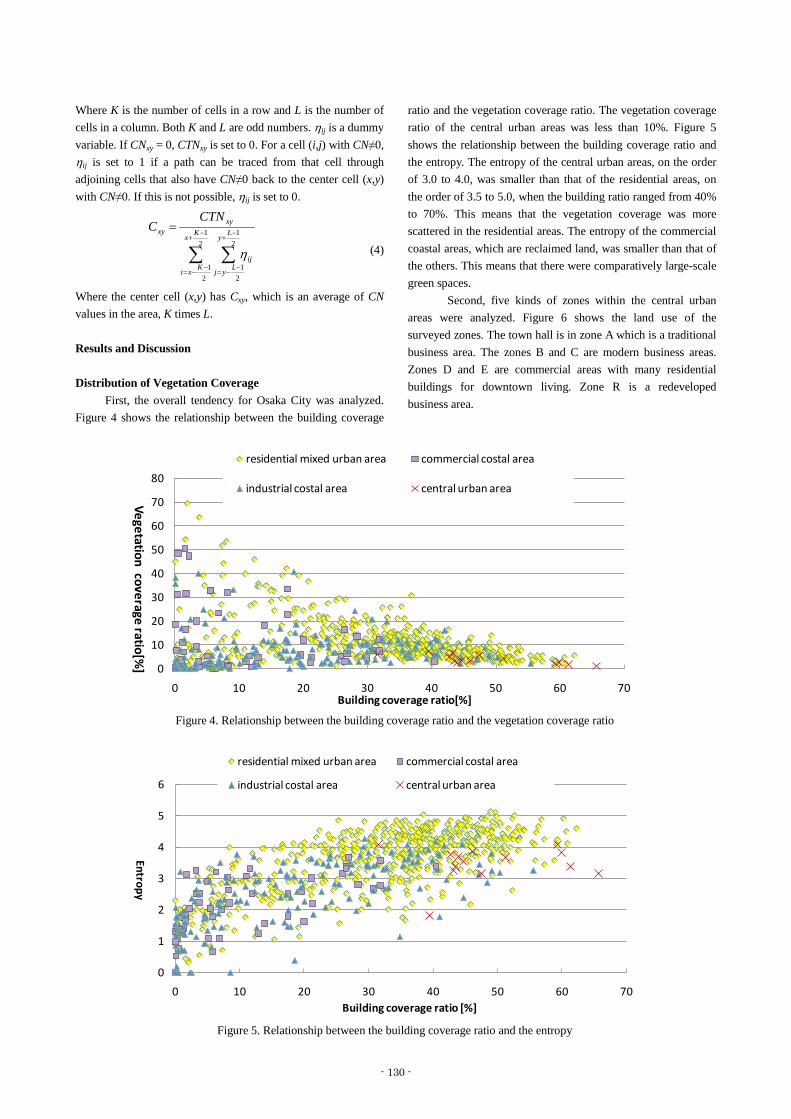
First, the overall tendency for Osaka City was analyzed. Figure 4 shows the relationship between the building coverage
ratio and the vegetation coverage ratio. The vegetation coverage ratio of the central urban areas was less than 10%. Figure 5 shows the relationship between the building coverage ratio and the entropy. The entropy of the central urban areas, on the order of 3.0 to 4.0, was smaller than that of the residential areas, on the order of 3.5 to 5.0, when the building ratio ranged from 40% to 70%. This means that the vegetation coverage was more scattered in the residential areas. The entropy of the commercial coastal areas, which are reclaimed land, was smaller than that of the others. This means that there were comparatively large-scale green spaces.
Second, five kinds of zones within the central urban areas were analyzed. Figure 6 shows the land use of the surveyed zones. The town hall is in zone A which is a traditional business area. The zones B and C are modern business areas. Zones D and E are commercial areas with many residential buildings for downtown living. Zone R is a redeveloped business area.
Figure 5. Relationship between the building coverage ratio and the entropy
Figure 4. Relationship between the building coverage ratio and the vegetation coverage ratio
0
10
20
30
40
50
60
70
80
0 10 20 30 40 50 60 70
Vegetation coverage ratio[%]
Building coverage ratio[%]
residential mixed urban area commercial costal area
industrial costal area central urban area
0
1
2
3
4
5
6
0 10 20 30 40 50 60 70
Entropy
Building coverage ratio [%]
residential mixed urban area commercial costal area
industrial costal area central urban area
- 130 -
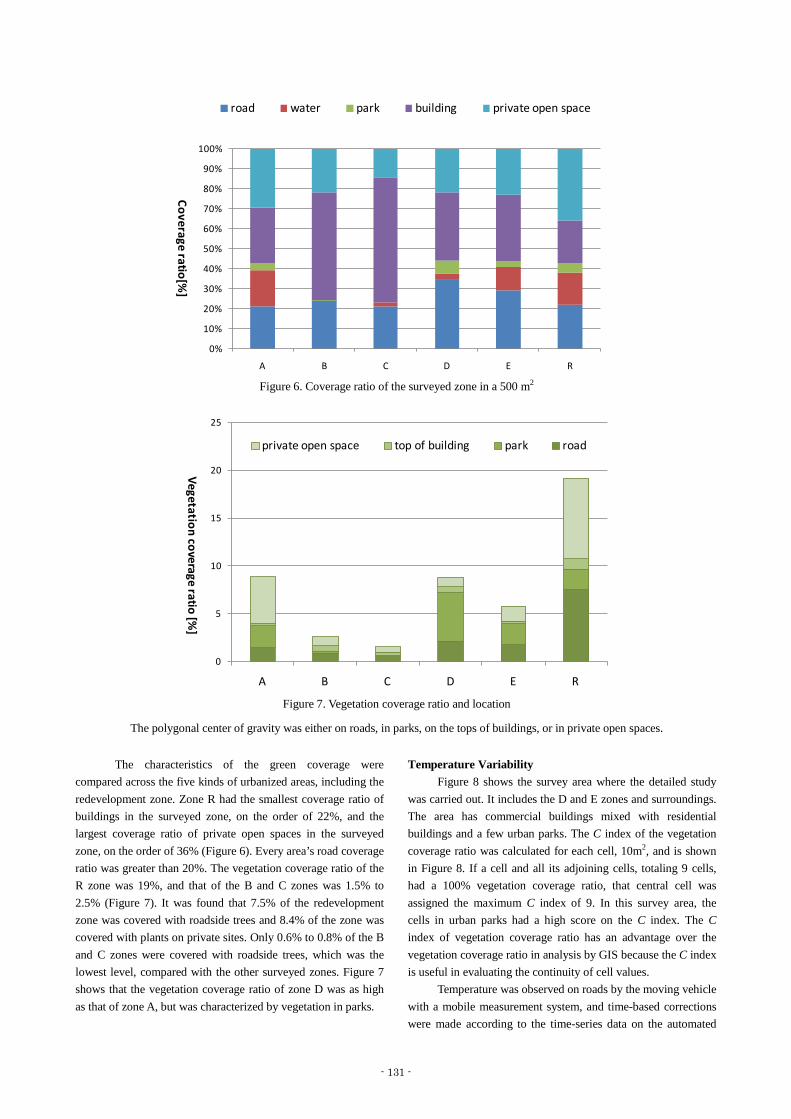
The characteristics of the green coverage were compared across the five kinds of urbanized areas, including the redevelopment zone. Zone R had the smallest coverage ratio of buildings in the surveyed zone, on the order of 22%, and the largest coverage ratio of private open spaces in the surveyed zone, on the order of 36% (Figure 6). Every area’s road coverage ratio was greater than 20%. The vegetation coverage ratio of the R zone was 19%, and that of the B and C zones was 1.5% to 2.5% (Figure 7). It was found that 7.5% of the redevelopment zone was covered with roadside trees and 8.4% of the zone was covered with plants on private sites. Only 0.6% to 0.8% of the B and C zones were covered with roadside trees, which was the lowest level, compared with the other surveyed zones. Figure 7 shows that the vegetation coverage ratio of zone D was as high as that of zone A, but was characterized by vegetation in parks.
Temperature Variability Figure 8 shows the survey area where the detailed study
was carried out. It includes the D and E zones and surroundings. The area has commercial buildings mixed with residential buildings and a few urban parks. The C index of the vegetation coverage ratio was calculated for each cell, 10m2, and is shown in Figure 8. If a cell and all its adjoining cells, totaling 9 cells, had a 100% vegetation coverage ratio, that central cell was assigned the maximum C index of 9. In this survey area, the cells in urban parks had a high score on the C index. The C index of vegetation coverage ratio has an advantage over the vegetation coverage ratio in analysis by GIS because the C index is useful in evaluating the continuity of cell values.
Temperature was observed on roads by the moving vehicle with a mobile measurement system, and time-based corrections were made according to the time-series data on the automated
Figure 6. Coverage ratio of the surveyed zone in a 500 m2
0%
10%
20%
30%
40%
50%
60%
70%
80%
90%
100%
A B C D E R
Coverage ratio[%]
road water park building private open space
Figure 7. Vegetation coverage ratio and location
The polygonal center of gravity was either on roads, in parks, on the tops of buildings, or in private open spaces.
0
5
10
15
20
25
A B C D E R
Vegetation coverage ratio [%]
private open space top of building park road
- 131 -
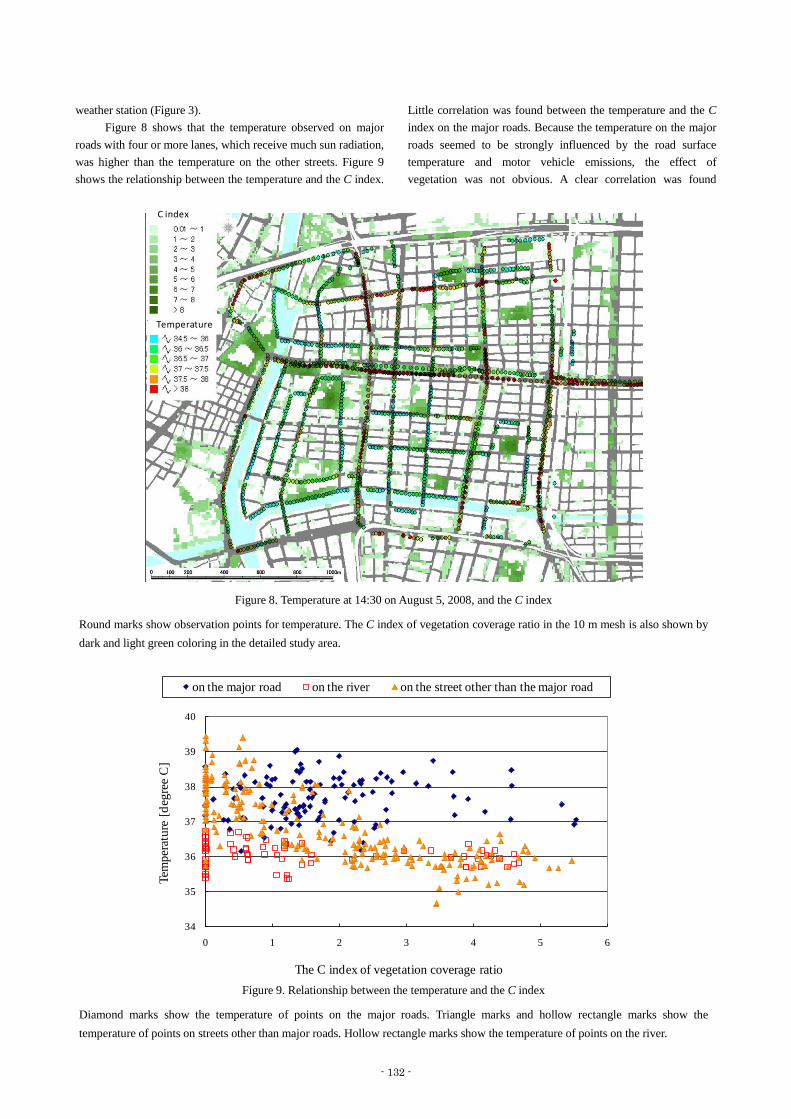
weather station (Figure 3). Figure 8 shows that the temperature observed on major
roads with four or more lanes, which receive much sun radiation, was higher than the temperature on the other streets. Figure 9 shows the relationship between the temperature and the C index.
Little correlation was found between the temperature and the C index on the major roads. Because the temperature on the major roads seemed to be strongly influenced by the road surface temperature and motor vehicle emissions, the effect of vegetation was not obvious. A clear correlation was found
Figure 8. Temperature at 14:30 on August 5, 2008, and the C index
Round marks show observation points for temperature. The C index of vegetation coverage ratio in the 10 m mesh is also shown by dark and light green coloring in the detailed study area.
C index
Temperature
Figure 9. Relationship between the temperature and the C index
Diamond marks show the temperature of points on the major roads. Triangle marks and hollow rectangle marks show the temperature of points on streets other than major roads. Hollow rectangle marks show the temperature of points on the river.
34
35
36
37
38
39
40
0 1 2 3 4 5 6
Tem
pera
ture
[deg
ree
C]
The C index of vegetation coverage ratio
on the major road on the river on the street other than the major road
- 132 -
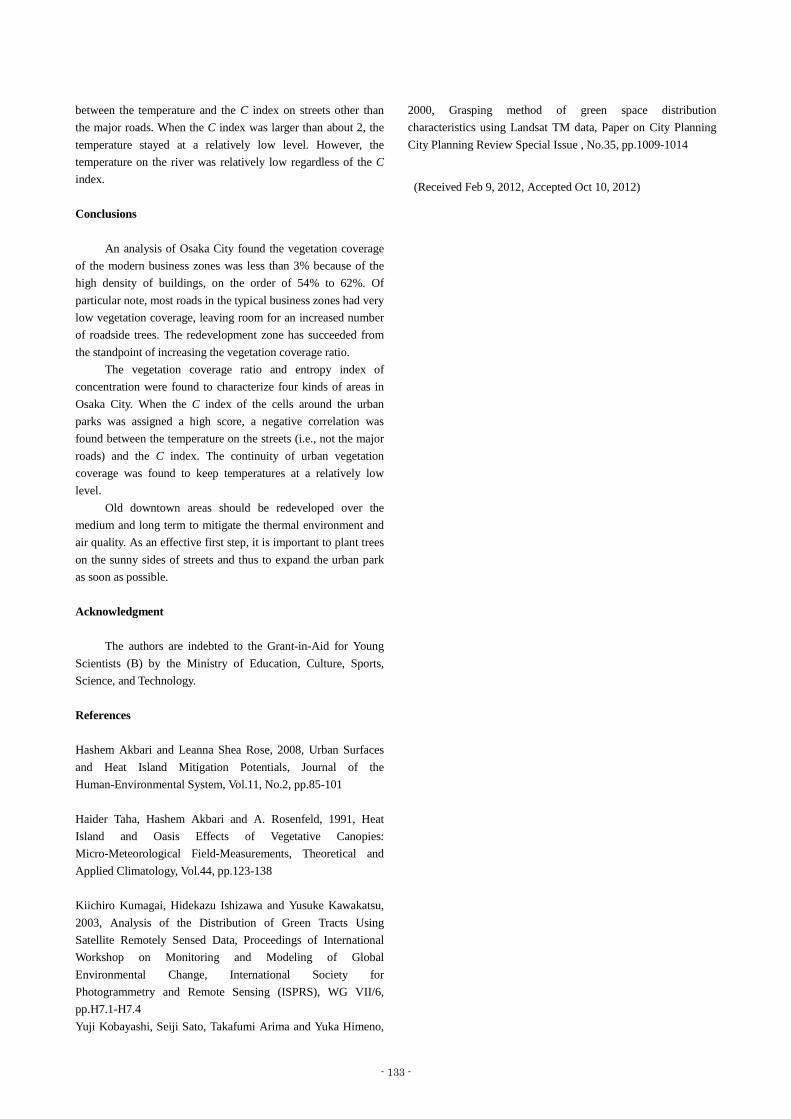
between the temperature and the C index on streets other than the major roads. When the C index was larger than about 2, the temperature stayed at a relatively low level. However, the temperature on the river was relatively low regardless of the C index. Conclusions
An analysis of Osaka City found the vegetation coverage
of the modern business zones was less than 3% because of the high density of buildings, on the order of 54% to 62%. Of particular note, most roads in the typical business zones had very low vegetation coverage, leaving room for an increased number of roadside trees. The redevelopment zone has succeeded from the standpoint of increasing the vegetation coverage ratio.
The vegetation coverage ratio and entropy index of concentration were found to characterize four kinds of areas in Osaka City. When the C index of the cells around the urban parks was assigned a high score, a negative correlation was found between the temperature on the streets (i.e., not the major roads) and the C index. The continuity of urban vegetation coverage was found to keep temperatures at a relatively low level.
Old downtown areas should be redeveloped over the medium and long term to mitigate the thermal environment and air quality. As an effective first step, it is important to plant trees on the sunny sides of streets and thus to expand the urban park as soon as possible.
Acknowledgment
The authors are indebted to the Grant-in-Aid for Young
Scientists (B) by the Ministry of Education, Culture, Sports, Science, and Technology.
References
Hashem Akbari and Leanna Shea Rose, 2008, Urban Surfaces and Heat Island Mitigation Potentials, Journal of the Human-Environmental System, Vol.11, No.2, pp.85-101 Haider Taha, Hashem Akbari and A. Rosenfeld, 1991, Heat Island and Oasis Effects of Vegetative Canopies: Micro-Meteorological Field-Measurements, Theoretical and Applied Climatology, Vol.44, pp.123-138 Kiichiro Kumagai, Hidekazu Ishizawa and Yusuke Kawakatsu, 2003, Analysis of the Distribution of Green Tracts Using Satellite Remotely Sensed Data, Proceedings of International Workshop on Monitoring and Modeling of Global Environmental Change, International Society for Photogrammetry and Remote Sensing (ISPRS), WG VII/6, pp.H7.1-H7.4 Yuji Kobayashi, Seiji Sato, Takafumi Arima and Yuka Himeno,
2000, Grasping method of green space distribution characteristics using Landsat TM data, Paper on City Planning City Planning Review Special Issue , No.35, pp.1009-1014
- 133 -
(Received Feb 9, 2012, Accepted Oct 10, 2012)