Embed Size (px)
Citation preview
Journal of Analytical Toxicology, Vol. 27, October 2003
Urine Testing for Cocaine Abuse: Metabolic and Excretion Patterns following Different Routes of Administration and Methods for Detection of False-Negative Results
Edward J. Cone 1,*, Angela H. Sampson.Cone 1, Wi l l i am D. Da rw in 2, Mar i l yn A. Huest is 2, and Jonathan M. Oy le r 2
IConeChem Research, LLC, Severna Park, Maryland 21146 and 2Chemistry and Drug Metabolism Section, Intramural Research Program, National Institute on Drug Abuse, National Institutes of Health, 5500 Nathan Shock Drive, Baltimore, Maryland 21224
I Abstract I
Although cocaine is typically the second-most identified drug of abuse in drug-testing programs, there is surprisingly little quantitative information on excretion patterns following different routes of administration. This report details the urinary excretion and terminal elimination kinetics for cocaine and eight metabolites [benzoylecgonine (BZE), ecgonine methylester (EME), norcocaine (NCOC), benzoylnorecgonine (BNE), m-hydroxy-BZE (m-HO-BZE), p-hydroxy-BZE (p-HO-BZE), m-hydroxy-COC (m-HO-COC), and p- hydroxy-COC (p-HO-COC)]. Six healthy males were administered approximately equipotent doses of cocaine by the intravenous (IV), smoking (SM), and inhalation (IN) routes of administration. Urine specimens were collected for a minimum of three days after drug administration, screened by immunoassay (EMIT and TDX, 300 ng/mL), and analyzed by GC-MS. Mean Cmax values were generally as follows: BZE > EME > COC > BNE = p-HO-BZE > m- HO-BZE > m-HO-COC > NCOC > p-HO-COC. Elimination half- lives for cocaine and metabolites were generally shorter following SM, intermediate after IV, and longest following IN administration. m-HO-BZE demonstrated the longest half-life (mean range 7.0-8.9 h), and cocaine displayed the shortest (2.4-4.0 h). Mean detection times were extended progressively by lowering cutoff concentrations. The maximum increases were approximately 55% at 50 ng/mL for the TDx assay (e.g., the detection time for the last consecutive positive changed from 32.8 h to 50.6 h for IV cocaine) and up to 39% for GC-MS at a cutoff concentration of 40 ng/ml. (e.g., the detection time for the last consecutive positive changed from 34.8 h to 48.1 h for IV cocaine). Sensitivity, specificity, and predictive values for EMIT and TDx were comparable at the 300- ng/mL cutoff concentration; but at lower cutoff concentrations, predictive values of positive results for TDx were diminished indicating a higher risk of false-positive results, that is, positive
�9 Author to whom reprint requests should be addressed: Edward J. Cone, ConeChem Research, I.LC, 441 Fairtree Drive, Severna Park, MD 21146. E-mail: [email protected].
results that failed to meet administrative cutoff criteria. Detection of positive results was significantly enhanced through the use of the "Zero Threshold Criteria Method", a method developed by the authors to differentiate false-negatives from true-negatives. The method was based on establishing mean immunoassay response (MIR) baselines and variance (SD) in assays of drug-free specimens. Arbitrary thresholds (MIR + 0.5 SD, MIR + 1 SD, MIR + 2 SD) were utilized to evaluate all negative specimens. Apparent true positives were identified by the presence of BZE at or above 40% GC-MS cutoff concentrations. With these criteria, up to 111 false-negative specimens were confirmed as true-positive specimens; this was in addition to the 208 true positives detected at recommended cutoff concentrations. This represents a 50% increase in positive detection rates through the use of this methodology. Such methodology is recommended for further evaluation by drug- testing programs for enhancement of positive detection rates and as an alternative to creatinine testing for dealing with dilute specimens that test negative by initial tests, but contain quantifiable concentrations of drugs of abuse.
I n t r oduc t i on
A major contributing factor in the spread of the cocaine epi- demic over the last two decades was the introduction of "crack" cocaine, a smokeable form of cocaine. The greater volatility of crack compared with cocaine salt (e.g., hydrochloride) facili- tated administration by the smoking route. Further, smoked co- caine results in extremely rapid drug delivery to the blood stream without the use of needles. The smoked route has gen- erally become the preferred route of administration for co- caine, but some individuals continue to prefer intravenous administration and others prefer the intranasal route. Oral ad- ministration of cocaine is less commonly encountered, but is of interest because of "doping claims" in which individuals claim
386 Reproduction (photocopying) of editorial content of this journal is prohibited without publisher's permission.
Journal of Analytical Toxicology, Vol. 27, October 2003
to have ingested cocaine unknowingly in a drink or food product. These different routes of drug administration could lead to route-dependent differences in absorption, metabolism and excretion rates. Such differences could be reflected in urine drug-testing results.
Concurrently with the spread of the cocaine epidemic over the last two decades, a "cottage industry" has emerged on the Internet that promotes the sale and use of in vivo and in vitro adulterants, substitution products, and other paraphernalia that are designed to produce false-negative urine testing results. Many of the in vitro products are effective by relying upon in- gestion of excess amounts of water along with the product as a means of"beating the drug test". Indeed, Cone et al. (1) demon- strated that consuming 2 quarts of water over a period of 2 h could be effective in converting true-positive cocaine urine re- suits to false-negative tests.
Despite the growing prevalence of dilution, adulteration, and substitution products, urine testing for drugs of abuse remains a critical component of treatment (2-4) and workplace pro- grams (5). Most laboratories now routinely test creatinine and specific gravity for evidence of excessive dilution of urine spec- imens. Other suggestions have been made for improvements in urine testing methodology that would enhance detection of drug use, especially for those individuals who attempt in vivo or in vitro specimen dilution. One approach to the problem of ex- cessive dilution involves lowering both the initial and confir- matory test cutoff concentrations. Such an approach is now under consideration by DHHS. The most recent guideline re- vision draft (Draft #4), released to the public in September 2001, proposes lowering the respective cocaine screening and confirmation cutoff concentrations for urine testing to 150 ng/mL (cocaine metabolite) and 100 ng/mL (benzoylecgonine, BZE). Others have proposed use of a "preconcentration step" for dilute specimens that would enhance detection (6), but this ap- proach is not feasible for use in large-scale drug testing labo- ratories. Clearly, there is currently a need for improved and enhanced drug-testing methodologies, considering the ease and rapidity with which individuals can manipulate urine co- caine metabolite concentrations.
To facilitate changes in drug-testing technology, a thorough knowledge of excretion patterns for cocaine and metabolites is needed. However, there is surprisingly little quantitative in- formation available on excretion patterns of cocaine in urine by different routes of administration. To better understand the effect of the administration route, we studied the excretion patterns of cocaine and metabolites following intravenous, smoked, and intranasal administration. Six human subjects were administered cocaine under controlled dosing conditions in a closed-research unit. All urine specimens were collected and analyzed by conventional screening and confirmation methods. A preliminary report describing the metabolites iden- tified in this study has been published (7). The purpose of the current report was to provide a detailed description of the ex- cretion patterns and pharmacokinetics of cocaine and eight metabolites following three routes of administration. The effect of lower cutoff concentrations on detection times was also eval- uated. In addition, immunoassay results of urine specimens that tested negative (below conventional cutoff concentrations)
were evaluated to determine if false-negative specimens con- taining BZE could be distinguished reliably from negative spec- imens that were drug-free or contained metabolite at or below 40% of the confirmation assay threshold cutoff concentrations.
Materials and Methods
Research subjects and study protocol The participants were six healthy adult males who provided
written informed consent and were paid for their participation. The protocol was approved by the Francis Scott Key Medical Center Institutional Review Board and adhered to Federal guide- lines for the conduct of research with human subjects. All sub- jects had a history of intravenous and smoked cocaine use. Subjects participated in four experimental sessions in which cocaine or placebo was administered in a randomized, crossover design. Each session was separated by a minimum of three days. The design of the study and detailed procedures have been de- scribed (7). Four cocaine/placebo (partial) combinations were administered as follows: (1) 25 mg cocaine hydrochloride (in- travenous, IV), 32 mg lactose (intranasal, IN); (2) 32 mg cocaine hydrochloride (IN), saline (IV); (3) 42 mg cocaine base (smoked, SM), saline (IV), 32 mg lactose (IN); and (4) saline (IV), 32 mg lactose (IN). No placebo was included for the SM route.
Collection and analysis of urine specimens Urine specimens were collected before and ad libitum for a
minimum of three days after each drug administration. After collection, the volume of each specimen was measured, and an aliquot was removed for determination of creatinine (Jaffe method), and for immunoassay monitoring of cocaine metabo- lite by Emit II TM (EMIT, Behring Diagnostics Corporation, Deerfield, IL) and TDX (Abbott Laboratories, Chicago, IL). The immunoassays used a 300-ng/mL cutoff concentration as rec- ommended by DHHS. Specimens were frozen at -20~ until the time of analysis by gas chromatography-mass spectrometry (GC-MS). Specimens were analyzed by GC-MS over the sub- sequent year following completion of the study according to published procedures (7) for cocaine (COC), BZE, ecgonine methylester (EME), benzoylnorecgonine (BNE), norcocaine (NCOC), m-hydroxy-BZE (m-HO-BZE), p-hydroxy-BZE (p-HO- BZE), m-hydroxy-COC (m-HO-COC), p-hydroxy-COC (p-HO- COC), and anhydroecgonine methyl ester (AEME). The limit of detection (LOD) of this assay for all analytes was approximately 1 ng/mL. The concentration range of the calibration curves for cocaine, BZE and EME was 3.1-1000, and the range for all other analytes was 1.6-500 ng/mL.
Pharmacokinetic estimates of terminal elimination half-lives The terminal elimination rates for cocaine and metabolites
were calculated by the amount-remaining-to-be-excreted (ARE) method, also known as the sigma-minus method. This method requires complete collection of urine specimens during the monitoring period. The amount excreted is the product of the urine volume and analyte concentration. The amount excreted is summed over the entire period. The logarithm of the ARE is
387

plotted on a semilogarithmic scale versus the time of urine collection. The slope of this line is -k/2.3 (where k is the elim- ination rate). The elimination half-lives for cocaine and metabo- lites were determined as 0.693/k.
Sensitivity, specificity, predictive value, and Receiver Operator Characteristic (ROC) assessments
Immunoassay performance was assessed by comparison of EMIT and TDX results to GC-MS quantitative results for BZE at different cutoff concentrations. Sensitivity, specificity, effi- ciency, predictive value (probability, based on sensitivity, speci- ficity, and incidence of cocaine abuse in the population, that the result is a true positive or a true negative), and ROC were cal- culated according to published procedures (8,9).
Methods for detection of false-negative cocaine specimens Specimen test results (immunoassay and GC-MS) were com-
pared in order to determine if those specimens that tested neg- ative by immunoassay at DHHS recommended and suggested cutoff concentrations contained BZE concentrations equal to or above 60 and 40 ng/mL by GC-MS. These cutoff concentrations were chosen to represent the 40% threshold in current use by DHHS for "retest" specimens and the corresponding threshold that would be used if the confirmation cutoff concentration for BZE were lowered to 100 ng/mL, respectively. The purpose of this evaluation was to determine if methodology could be de- veloped that would reliably distinguish negative specimens, that is, specimens containing BZE below 40% cutoff concen- tration from apparent false-negative specimens that contained BZE at or above the 40% cutoff concentration thresholds.
Threshold criteria were arbitrarily set as the mean im- munoassay responses (MIR) of drug-free specimens (specimens that contained < I ng/mL BZE by GC-MS) plus the variance (standard deviation, SD) of the immunoassay with drug-free specimens. This methodology is referred to as the "Zero Threshold Criteria Method". Three immunoassay threshold criteria for EMIT and TDX were utilized in the assessment as follows:
�9 MIR + 0.5 SD
�9 MIR + 1 SD
�9 MIR + 2 SD
Addition of 0.5 SD to the MIR includes approximately 38.3% of the variance in assay response with negative (drug-free spec- imens). Addition of 1 SD and 2 SD includes approximately 68.3% and 95.5% of the variance, respectively. All specimens that screened negative by immunoassay at the 300-ng/mL cutoff concentration were evaluated to determine if response rates were less than, equal to, or greater than these criteria. Specimens that tested below these arbitrary immunoassay threshold criteria were grouped into those specimens that con- tained < 60 ng/mL or < 40 ng/mL BZE by GC-MS [these spec- imens were designated as apparent true-negative specimens ("TN')] and those specimens that contained > 60 ng/mL or > 40 ng/mL BZE [designated as apparent false-negative specimens ("FN')]. Specimens that tested above the arbitrary immuno- assay threshold criteria were grouped into those specimens
388
Journal of Analytical Toxicology, Vol. 27, October 2003
that contained < 60 ng/mL or < 40 ng/mL BZE by GC-MS [these specimens were designated as apparent false-positive specimens CFP')] and those specimens that contained > 60 ng/mL or > 40 ng/mL BZE [designated as apparent true-positive specimens ("TP')]. It should be noted that false-positive and false-negative results were defined by whether specimens met administrative cutoff concentration criteria and not by whether there was true presence or absence of drug in the specimen.
Results
Urinary excretion patterns and pharmacokinetics of cocaine and metabolites in urine following different routes of administration
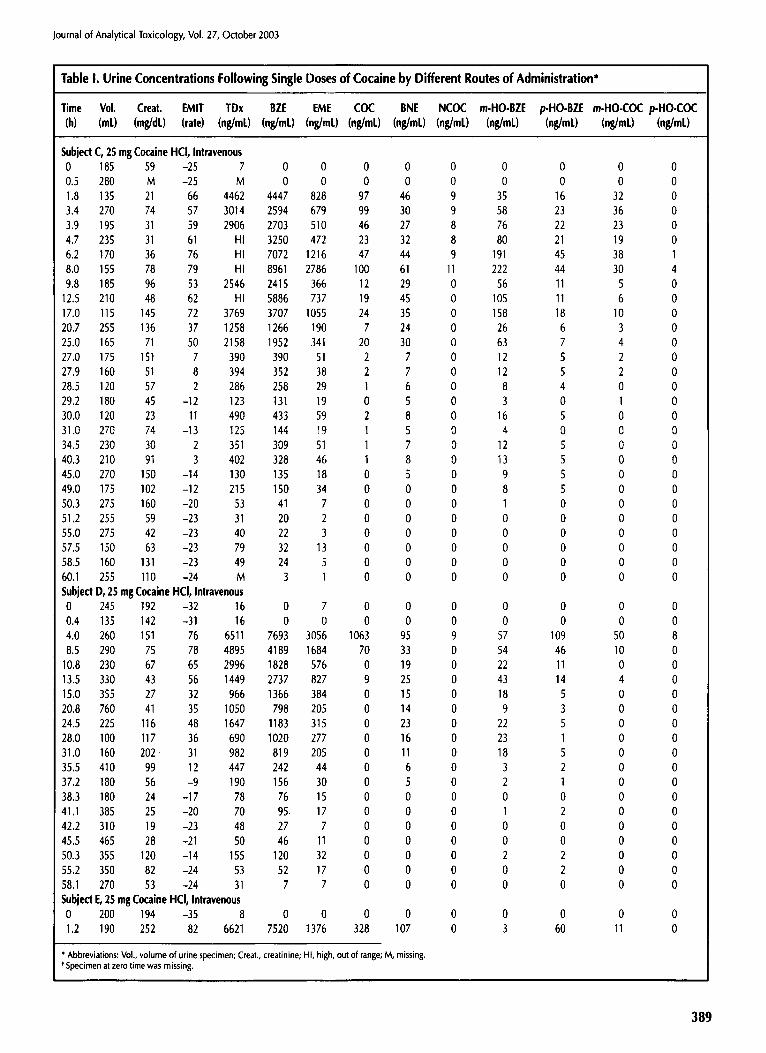
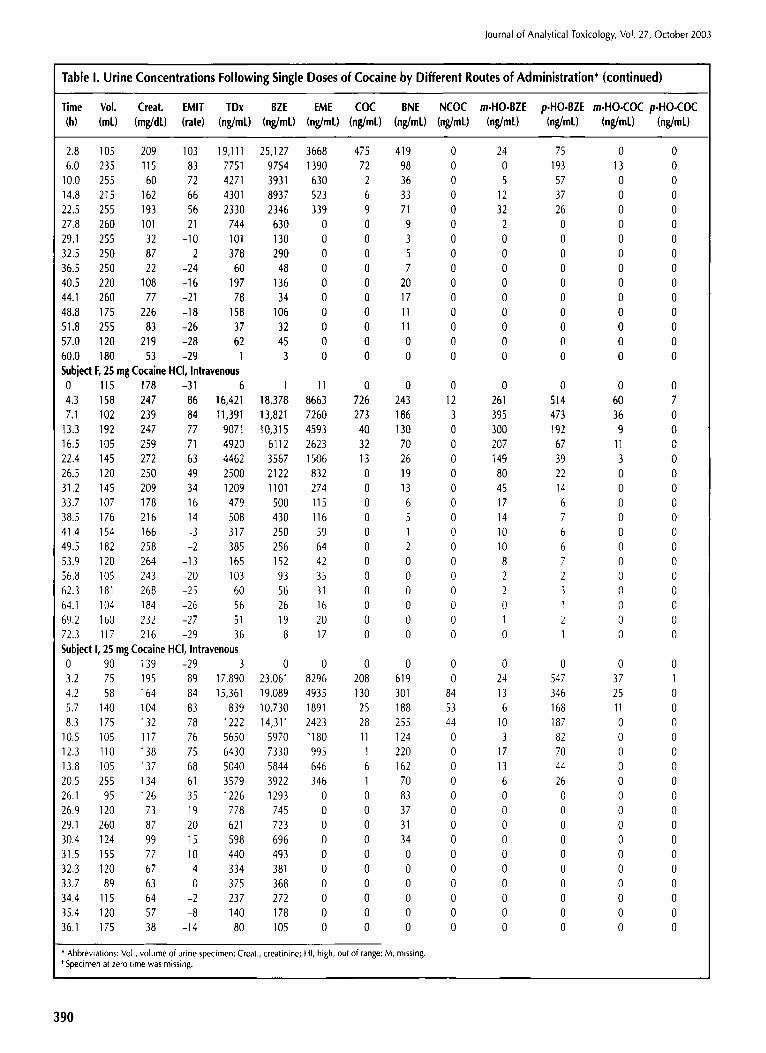
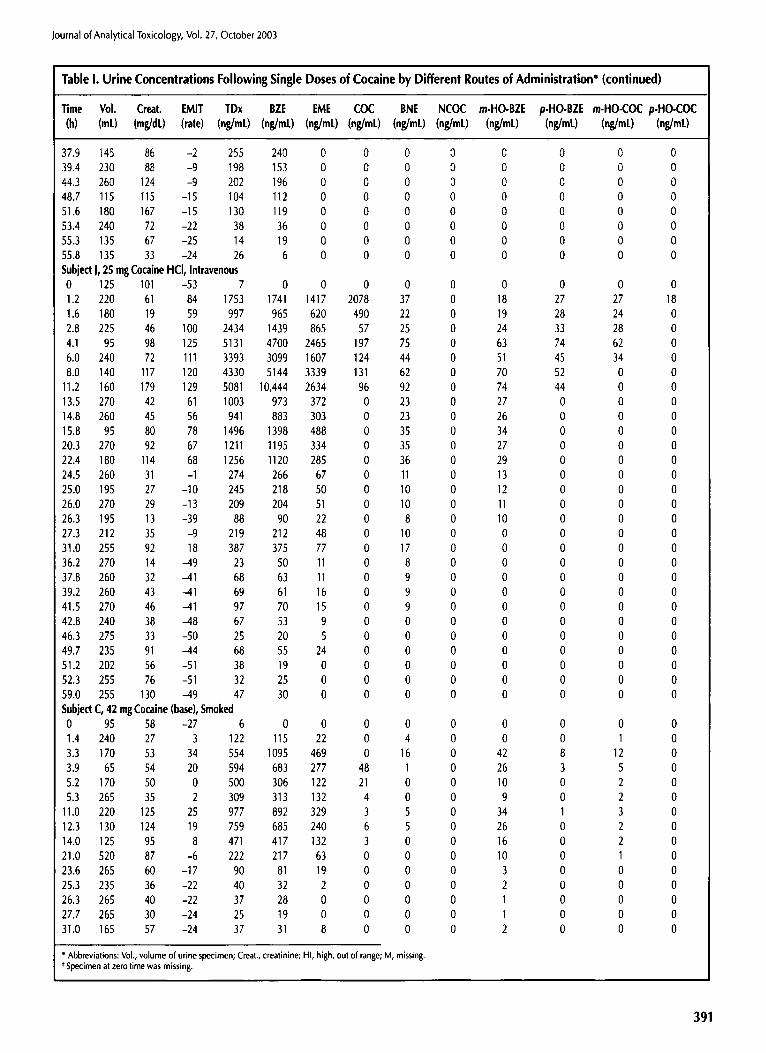
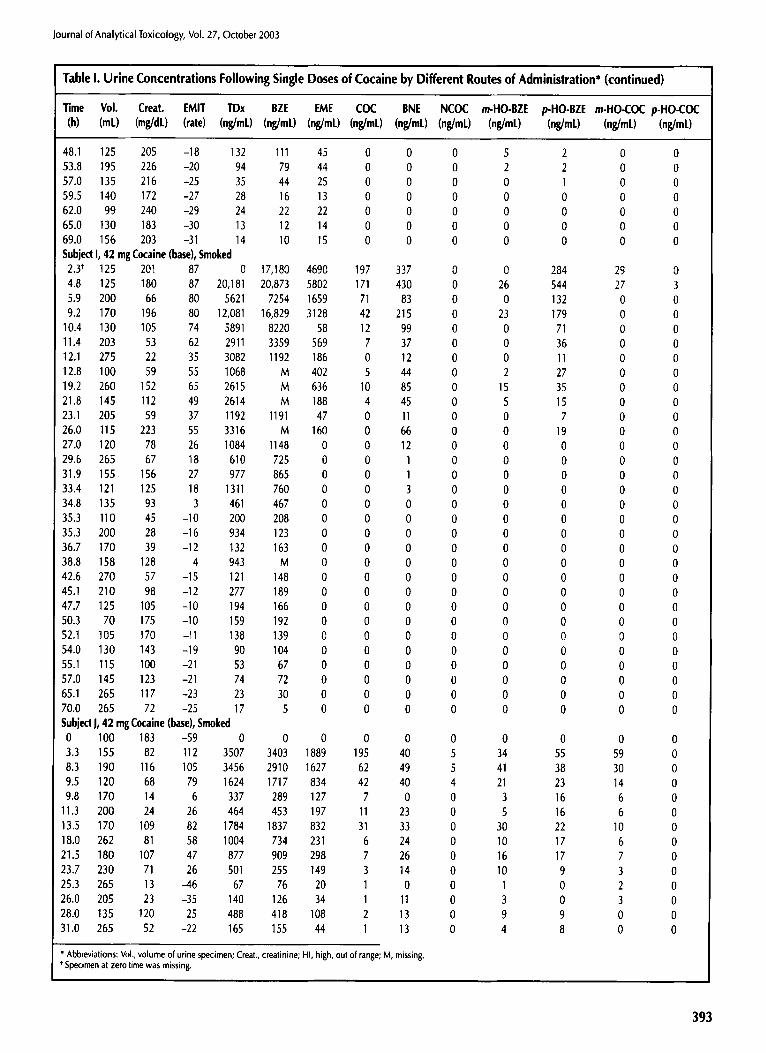
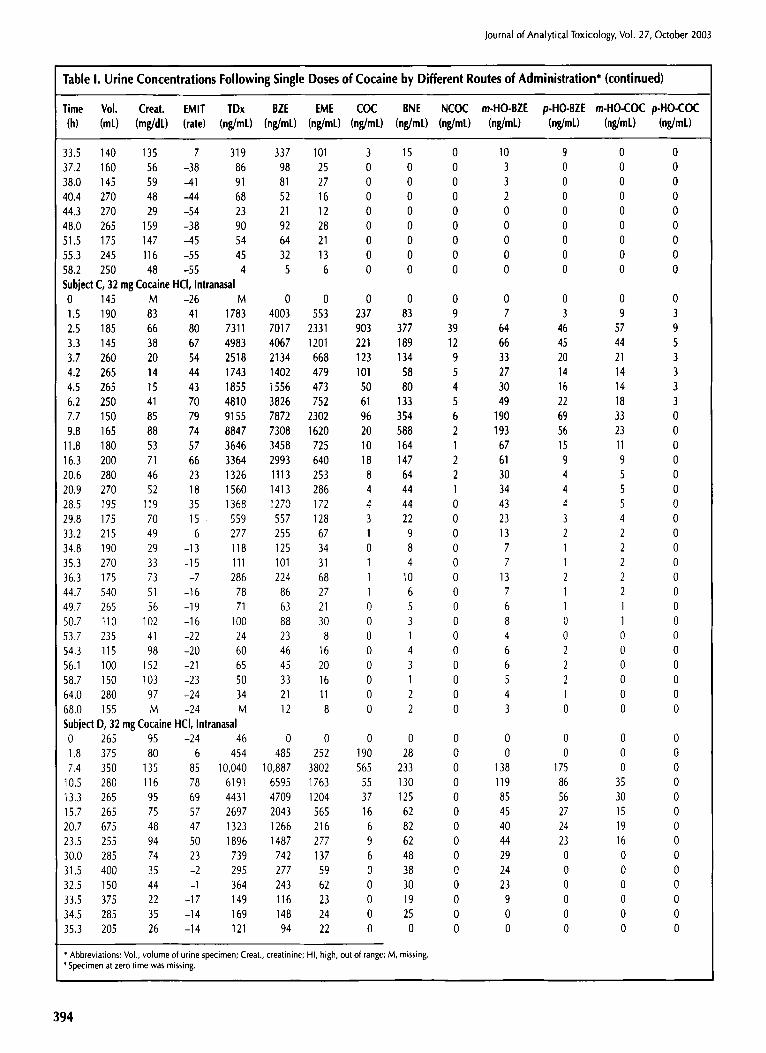
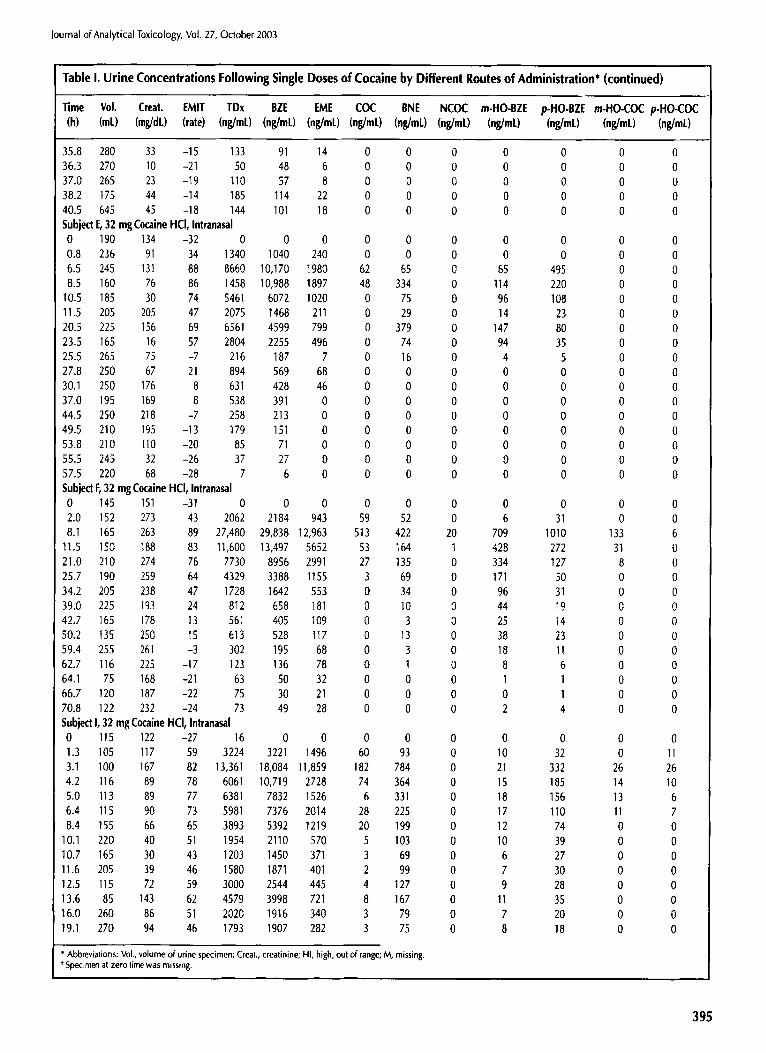
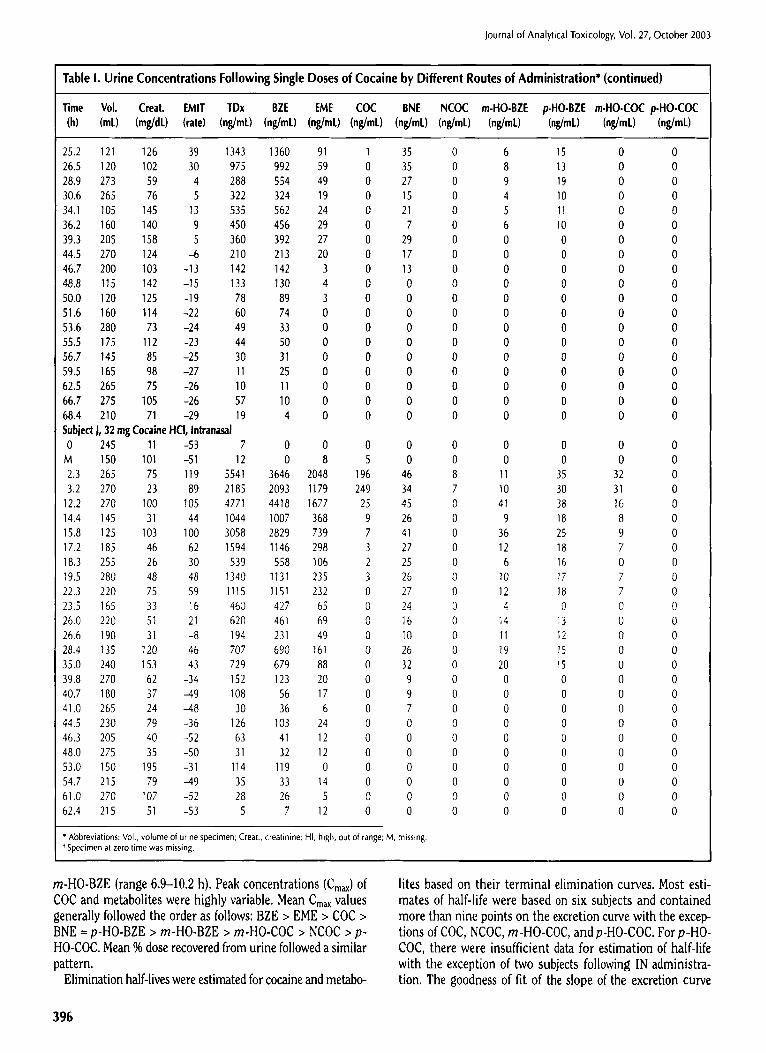
COC and eight metabolites were measured in individual urine specimens by GC-MS following administration of single doses of cocaine by the IV, SM, and IN routes of administration. The doses selected for administration were considered approxi- mately equipotent. The chemical structures and metabolic pat- tern for cocaine and the eight metabolites are illustrated in Figure 1. Concentrations of COC and the eight metabolites are listed in Table I. For completeness, related measures (urine volume, creatinine concentration, immunoassay results) were also included. AEME, a pyrolysis product of cocaine, was also identified in a limited number of specimens following COC ad- ministration by the SM route. Details of specimens [subject, time of collection, AEME concentration (ng/mL)] containing AEME were as follows: E, 2.0 h, 76.9; F, 1.42 h, 27.5; J, 3.33 h, 8.0; J, 8.25 h, 7.0; and J, 9.5 h, 6.0.
Generally, urine specimens collected within ] h of cocaine ad- ministration contained cocaine and metabolite concentrations at less than peak concentrations or were negative. Peak con- centrations of cocaine and metabolites occurred at variable times according to the nature of the metabolite and route of administration (see Table II). A summary of Cm~, Tm~, and % dose for these metabolites has been published (7). Generally, the mean time to peak concentration (Tmax) in urine was shortest for COC and NCOC (range 2.6-5.1 h) and longest for
/H /H
p - I . h ~ r o x ' ~ a ~ l r ~ ~ H ~ r o x ~ o ~ o c g o n l n o
Figure I . Metabolism of cocaine.
Journal of Analytical Toxicology, Vol. 27, October 2003
Table I. Urine Concentrations Following Single Doses of Cocaine by Different Routes of Administration"
Time Vol. Creat. EMIT TDx BZE EME COC BNE NCOC m-HO-BZE p-HO-BZE m-HO-COC p-HO-COC (h) (mE) (mg/dL) (rate) (ng/mL) (ng/mC) (n~/mL)(n~/mC) (ng/mC) (ng/mt) (ng/mC) (ng/mt) (ng/mL) (ng/mL)
Subject C, 25 mg Cocaine HCI, Intravenous 0 185 59 -25 7 0 0 0 0 0 0 0 0 0 0.5 280 M -25 M 0 0 0 0 0 0 0 0 0 1.8 135 21 66 4462 4447 828 97 46 9 35 16 32 0 3.4 270 74 57 3014 2594 679 99 30 9 58 23 36 0 3.9 195 31 59 2906 2703 510 46 27 8 76 22 23 0 4.7 235 31 61 HI 3250 472 23 32 8 80 21 19 0 6.2 170 36 76 HI 7072 1216 47 44 9 191 45 38 1 8.0 155 78 79 HI 8961 2786 100 61 11 222 44 30 4 9.8 185 96 53 2546 2415 366 12 29 0 56 11 5 0
12.5 210 48 62 HI 5886 737 19 45 0 105 11 6 0 17,0 115 145 72 3769 3707 1055 24 35 0 158 18 10 0 20.7 255 136 37 1258 1266 190 7 24 0 26 6 3 0 25.0 165 71 50 2158 1952 341 20 30 0 63 7 4 0 27.0 175 151 7 390 390 51 2 7 0 12 5 2 0 27.9 160 51 8 394 352 38 2 7 0 12 5 2 0 28.5 120 57 2 286 258 29 1 6 0 8 4 0 0 29.2 180 45 -12 123 131 19 0 5 0 3 0 1 0 30.0 120 23 11 490 433 59 2 8 0 16 5 0 0 31.0 270 74 -13 125 144 19 1 5 0 4 0 0 0 34,5 230 30 2 351 309 51 1 7 0 12 5 0 0 40,3 210 91 3 402 328 46 1 8 0 13 5 0 0 45,0 270 150 -14 130 135 18 0 5 0 9 5 0 0 49.0 175 102 -12 2t5 150 34 0 0 0 8 5 0 0 50.3 275 160 -20 53 41 7 0 0 0 1 0 0 0 51.2 255 59 -23 31 20 2 0 0 0 0 0 0 0 55.0 275 42 -23 40 22 3 0 0 0 0 0 0 0 57.5 150 63 -23 79 32 13 0 0 0 0 0 0 0 58.5 160 131 -23 49 24 5 0 0 0 0 0 0 0 60.1 255 110 -24 M 3 1 0 0 0 0 0 0 0 Subject D,25 mgCocaine HCl, lntravenous 0 245 192 -32 16 0 7 0 0 0 0 0 0 0 0.4 135 142 -31 16 0 0 0 0 0 0 0 0 0 4.0 260 151 76 6511 7693 3056 1063 95 9 57 109 50 8 8.5 290 75 78 4895 4189 1684 70 33 0 54 46 10 0
10.8 230 67 65 2996 1828 576 0 19 0 22 11 0 0 13.5 330 43 56 1449 2737 827 9 25 0 43 14 4 0 15.0 355 27 32 966 1366 384 0 15 0 18 5 0 0 20.8 760 41 35 1050 798 205 0 14 0 9 3 0 0 24.5 225 116 48 1647 1183 315 0 23 0 22 5 0 0 28.0 100 117 36 690 1020 277 0 16 0 23 1 0 0 31.0 160 202 31 982 819 205 0 11 0 18 5 0 0 35.5 410 99 12 447 242 44 0 6 0 3 2 0 0 37.2 180 56 -9 190 156 30 0 5 0 2 1 0 0 38.3 180 24 -17 78 76 15 0 0 0 0 0 0 0 41.1 385 25 -20 70 95. 17 0 0 0 1 2 0 0 42.2 310 19 -23 48 27 7 0 0 0 0 0 0 0 45.5 465 28 -21 50 46 11 0 0 0 0 0 0 0 50.3 355 120 -14 155 120 32 0 0 0 2 2 0 0 55.2 350 82 -24 53 52 17 0 0 0 0 2 0 0 58.1 270 53 -24 31 7 7 0 0 0 0 0 0 0 Subject E,25mgCocaine HCl, lntravenous 0 200 194 -35 8 0 0 0 0 0 0 0 0 0 1.2 190 252 82 6621 7520 1376 328 107 0 3 60 11 0
~ Abbreviations: Vol., volume of urine specimen; Creat., creatinine; HI, high, out of range, M, missing. t Specimen at zero time was missing.
389
Journal of Analytical Toxicology, Vol. 27, October 2003
Table I. Urine Concentrations Following Single Doses of Cocaine by Different Routes of Administration* (continued)
Time Vol. Creat. EMIT TDx BZE EME COC BNE NCOC m-HO-BZE p-HO-BZE m-HO-COC p-HO-COC (h) (mL) (mg/dL) (rate) (ng/mL) (ng/mL) (ng/mL) (ng/mL) (ng/mL) (ng/mL) (ng/mL) (ng/mL) (ng/mL) (ng/mL)
2.8 105 209 103 19,111 25,127 3668 475 419 0 24 75 0 0 6.0 235 115 83 7751 9754 1390 72 98 0 0 193 13 0
10.0 255 60 72 4271 3931 630 2 36 0 5 57 0 0 14.8 215 162 66 4301 8937 523 6 33 0 12 37 0 0 22.5 255 193 56 2330 2346 339 9 71 0 32 26 0 0 27.8 260 101 21 744 630 0 0 9 0 2 0 0 0 29.1 255 32 -10 101 130 0 0 3 0 0 0 0 0 32.5 250 87 2 378 290 0 0 5 0 0 0 0 0 36.5 250 22 -24 60 48 0 0 7 0 0 0 0 0 40.5 220 108 -16 197 136 0 0 20 0 0 0 0 0 44.1 260 77 -21 78 34 0 0 17 0 0 0 0 0 48.8 175 226 -18 158 106 0 0 11 0 0 0 0 0 51.8 255 83 -26 37 32 0 0 11 0 0 0 0 0 57.0 120 219 -28 62 45 0 0 0 0 0 0 0 0 60.0 180 53 -29 1 3 0 0 0 0 0 0 0 0 Subject F, 25 mg Cocaine HCI, Intravenous 0 115 178 -31 6 1 11 0 0 0 0 0 0 0 4.3 158 247 86 16,421 18,378 8663 726 243 12 261 514 60 7 73 102 239 84 11,391 13,821 7260 273 186 3 395 473 36 0
13,3 192 247 77 907t 10,315 4593 40 130 0 300 192 9 0 16.5 105 259 71 4920 6112 2623 32 70 0 207 67 11 0 22.4 145 272 63 4462 3567 1506 13 26 0 149 39 3 0 26.5 120 250 49 2500 2122 832 0 19 0 80 22 0 0 31.2 145 209 34 1209 1101 274 0 13 0 45 14 0 0 33.7 107 178 16 479 500 115 0 6 0 17 6 0 0 38.5 176 216 14 508 430 116 0 5 0 14 7 0 0 41.4 154 166 -3 317 250 59 0 1 0 10 6 0 0 49.5 182 258 -2 385 256 64 0 2 0 10 6 0 0 53.9 120 264 -13 165 152 42 0 0 0 8 7 0 0 56.8 105 243 -20 103 93 35 0 0 0 2 2 0 0 62.3 181 268 -25 60 56 31 0 0 0 2 3 0 0 64.1 104 184 -26 56 26 16 0 0 0 0 1 0 0 69.2 160 232 -27 51 19 20 0 0 0 1 2 0 0 72.3 117 216 -29 36 8 17 0 0 0 0 1 0 0 Subject I, 25 mg Cocaine HCI, Inlravenous 0 90 139 -29 3 0 0 0 0 0 0 0 0 0 3.2 75 195 89 17,890 23,061 8296 208 619 0 24 547 37 1 4.2 58 164 84 15,361 19,089 4935 130 301 84 13 346 25 0 5.7 140 104 83 839 10,730 1891 25 188 53 6 168 11 0 8.3 175 132 78 1222 14,311 2423 28 255 44 10 187 0 0
10.5 105 117 76 5650 5970 1180 11 124 0 3 82 0 0 12.3 110 138 75 6430 7330 995 1 220 0 17 70 0 0 13.8 105 137 68 5040 5844 646 6 162 0 13 44 0 0 20.5 255 134 61 3579 3922 346 1 70 0 6 26 0 0 26.1 95 126 35 1226 1293 0 0 83 0 0 0 0 0 26.9 120 73 19 778 745 0 0 37 0 0 0 0 0 29.1 260 87 20 621 723 0 0 31 0 0 0 0 0 30.4 124 99 15 598 696 0 0 34 0 0 0 0 0 31.5 155 77 10 440 493 0 0 0 0 0 0 0 0 32.3 120 67 4 334 381 0 0 0 0 0 0 0 0 33.7 89 63 0 375 368 0 0 0 0 0 0 0 0 34.4 115 64 -2 237 272 0 0 0 0 0 0 0 0 35.4 120 57 -8 140 178 0 0 0 0 0 0 0 0 36.1 175 38 -14 80 105 0 0 0 0 0 0 0 0
* Abbreviations: Vol., volume of urine specimen; Creat., creatinine; HI, high, out of range; M, missing. Specimen at zero time was missing.
390
Journal of Analytical Toxicology, Vol. 27, October 2003
Table I. Urine Concentrations Following Single Doses of Cocaine by Different Routes of Administration* (continued)
Time %'ol. Creat. EMIT TDx BZE EME COC BNE NCOC m-HO-BZE p-HO-BZE m-HO-COC p-HO-COC (h) (mL) (mg/dL) (rate) (ng/mL) (ng/mL) (ng/mL)(ng/mL) (ng/mL) (ng/mL) (ng/mL) (ng/ml.) (n~/mL) (ng/mL)
37.9 145 86 -2 255 240 0 0 0 0 0 0 0 0 39.4 230 88 -9 198 153 0 0 0 0 0 0 0 0 44.3 260 124 -9 202 196 0 0 0 0 0 0 0 0 48.7 115 115 -15 104 112 0 0 0 0 0 0 0 0 51.6 180 167 -15 130 119 0 0 0 0 0 0 0 0 53.4 240 72 -22 38 36 0 0 0 0 0 0 0 0 55.3 135 67 -25 14 19 0 0 0 0 0 0 0 0 55.8 135 33 -24 26 6 0 0 0 0 0 0 0 0 Subjedl, 25 mgCocaine HCl, lntravenous 0 125 101 -53 7 0 0 0 0 0 0 0 0 0 1.2 220 61 84 1753 1741 1417 2078 37 0 18 27 27 18 1.6 180 19 59 997 965 620 490 22 0 19 28 24 0 2.8 225 46 100 2434 1439 865 57 25 0 24 33 28 0 4.1 95 98 125 5131 4700 2465 197 75 0 63 74 62 0 6.0 240 72 111 3393 3099 1607 124 44 0 51 45 34 0 8.0 140 117 120 4330 5144 3339 131 62 0 70 52 0 0
11.2 160 179 129 5081 10,444 2634 96 92 0 74 44 0 0 13.5 270 42 61 1003 973 372 0 23 0 27 0 0 0 14.8 260 45 56 941 883 303 0 23 0 26 0 0 0 15.8 95 80 78 1496 1398 488 0 35 0 34 0 0 0 20.3 270 92 67 1211 1195 334 0 35 0 27 0 0 0 22.4 180 114 68 1256 1120 285 0 36 0 29 0 0 0 24.5 260 31 -1 274 266 67 0 11 0 13 0 0 0 25.0 195 27 -10 245 218 50 0 10 0 12 0 0 0 26.0 270 29 -13 209 204 51 0 10 0 11 0 0 0 26.3 195 13 -39 88 90 22 0 8 0 10 0 0 0 27.3 212 35 -9 219 212 48 0 10 0 0 0 0 0 31.0 255 92 18 387 375 77 0 17 0 0 0 0 0 36.2 270 14 -49 23 50 11 0 8 0 0 0 0 0 37.8 260 32 -41 68 63 11 0 9 0 0 0 0 0 39.2 260 43 -41 69 61 16 0 9 0 0 0 0 0 41.5 270 46 -41 97 70 15 0 9 0 0 0 0 0 42.8 240 38 -48 67 53 9 0 0 0 0 0 0 0 46.3 275 33 -50 25 20 5 0 0 0 0 0 0 0 49.7 235 91 -44 68 55 24 0 0 0 0 0 0 0 51.2 202 56 -51 38 19 0 0 0 0 0 0 0 0 52.3 255 76 -51 32 25 0 0 0 0 0 0 0 0 59.0 255 130 -49 47 30 0 0 0 0 0 0 0 0 SubjedC,42 mgCocaine (base),gmoked 0 95 58 -27 6 0 0 0 0 0 0 0 0 0 1.4 240 27 3 122 115 22 0 4 0 0 0 1 0 3.3 170 53 34 554 1095 469 0 16 0 42 8 12 0 3.9 65 54 20 594 683 277 48 1 0 26 3 5 0 5.2 170 50 0 500 306 122 21 0 0 10 0 2 0 5.3 265 35 2 309 313 132 4 0 0 9 0 2 0
11.0 220 125 25 977 892 329 3 5 0 34 I 3 0 12.3 130 124 19 759 685 240 6 5 0 26 0 2 0 14.0 125 95 8 471 417 132 3 0 0 16 0 2 0 21.0 520 87 -6 222 217 63 0 0 0 10 0 1 0 23.6 265 60 -17 90 81 19 0 0 0 3 0 0 0 25.3 235 36 -22 40 32 2 0 0 0 2 0 0 0 26.3 265 40 -22 37 28 0 0 0 0 1 0 0 0 27.7 265 30 -24 25 19 0 0 0 0 1 0 0 0 31.0 165 57 -24 37 31 8 0 0 0 2 0 0 0
"Abbreviations: Vol., volume of urine specimen; Creat., creatinine; HI, high, out of range; M, missing. f Specimen at zero time was missing.
391

Journal of Analytical Toxicology, Vol. 27, October 2003
Table I. Urine Concentrations Following Single Doses of Cocaine by Different Routes of Administration* (continued)
Time Vol. Creat. EMIT TDx BZE Ek4E COC BNE NCOC m-HO-BZE p-HO-BZE m-HO-COC p-HO-COC (h) (mr) (mg/dC) (rate) (ng/mC) (ng/mt) (ng/mt)(ng/ml.) (ng/mL) (ng/mC) (ng/mL) (ng/mt) (ng/mr) (ng/mC)
31.7 220 M -24 M 19 3 0 0 0 1 0 0 0 33.6 175 M -25 M 15 3 0 0 0 1 0 0 0 37.2 185 M -24 M 15 4 0 0 0 1 0 0 0 38.7 180 M -24 M 10 1 0 0 0 0 0 0 0 44.7 270 M -28 M 7 2 0 0 0 0 0 0 0 Subject D,42 mgCocaine(base),Smoked 0 280 118 -31 10 0 0 0 0 0 0 0 0 0 1.0 260 116 48 1861 2187 986 700 0 0 0 26 15 0 3.9 250 80 83 7940 9258 3569 767 22 0 65 100 61 0 8.2 350 111 81 7540 8297 3489 243 18 0 92 69 33 0
11.5 230 154 76 6030 5887 2454 97 19 0 84 39 17 0 14.5 220 79 65 3213 2707 952 41 14 0 38 16 9 0 15.5 275 28 38 1145 1052 334 11 0 0 11 11 0 0 16.5 445 31 29 1118 982 308 10 0 0 10 11 0 0 20.2 495 68 51 1905 1731 329 9 13 0 23 13 0 0 27.0 275 194 56 2452 2255 693 16 0 0 48 15 0 0 33.5 310 166 32 1050 1100 278 0 0 0 24 12 0 0 38.6 250 108 10 467 564 124 0 0 0 13 0 0 0 44.0 550 75 -4 215 194 27 0 0 0 0 0 0 0 51.5 280 223 -5 275 127 19 0 0 0 0 0 0 0 54.5 245 137 -19 118 87 8 0 0 0 0 0 0 0 56.5 140 196 -21 113 45 0 0 0 0 0 0 0 0 Subject E, 42 mg Cocaine (base), Smoked 0 M 186 -34 3 0 0 0 0 0 0 0 0 0 2.0 250 155 39 1348 1453 359 88 27 0 0 0 0 0 2.8 240 61 63 2930 2613 740 42 52 0 15 105 20 0 3.7 245 27 36 1151 1183 255 0 9 0 8 45 0 0 7.1 225 91 58 2581 2546 540 0 29 0 27 62 0 0 8.8 255 30 21 1086 660 107 0 13 0 2 14 0 0
11.8 255 131 35 1039 1087 174 0 17 0 10 15 0 0 14.5 195 51 42 1067 1481 116 0 18 0 21 13 0 0 20.t 245 54 16 161 591 51 0 8 0 10 6 0 0 24.8 225 28 17 738 505 63 0 8 0 12 0 0 0 26.7 240 216 -16 29 183 11 0 14 0 4 6 0 0 34.0 120 64 -13 129 140 27 0 0 0 4 0 0 0 37.0 245 53 -21 16 76 0 0 0 0 5 0 0 0 41.1 210 32 -23 19 39 0 0 0 0 0 0 0 0 44.5 265 49 -26 13 18 0 0 0 0 0 0 0 0 46.5 230 31 -25 13 27 0 0 0 0 0 0 0 0 51.1 235 78 -27 8 7 0 0 0 0 0 0 0 0 Subjed ~ 42 mgCocaine(base),Smoked 0 124 284 -34 1 0 0 0 0 0 0 0 0 0 1.4 125 169 58 3264 3149 1484 2289 36 16 31 59 0 0 6.0 165 220 81 10,981 10,828 3965 801 245 7 469 487 72 0
10.1 195 230 73 6000 6382 1678 37 58 0 274 122 22 0 14.8 125 190 59 3086 2734 1266 26 38 2 152 30 17 0 18.0 146 155 52 2934 1863 800 8 26 0 98 17 12 0 24.0 120 284 54 2758 2169 1042 6 6 0 128 26 8 0 28.2 150 197 37 1439 985 361 0 4 0 48 2 1 0 31.0 186 122 12 503 341 127 0 0 0 11 3 0 0 35.1 226 155 5 393 301 115 0 0 0 15 4 0 0 37.4 152 153 -7 224 197 84 0 0 0 8 2 0 0 41.0 166 177 -9 239 157 68 0 0 0 7 3 0 0 45.0 107 226 -12 235 163 61 0 0 0 7 2 0 0
"Abbreviations: Vol., volume of urine specimen; Creat., creatinine; HI, high, out of range; M, missing. t Specimen at zero time was missing.
392
Journal of Analytical Toxicology, Vol. 27, October 2003
Table I. Urine Concentrations Following Single Doses of Cocaine by Different Routes of Administration* (continued)
Time Vol. Creat. EMIT TDx BZE EME COC BNE NCOC m-HO-BZE p-HO-BZE m-HO.COC p-HO-COC (h) (mL) (mg/dL) (rate) (ng/mC) (n#mt) (ng/mC)(ng/mC) (ng/mL) (ng/mC) (ng/mL) (n~/mL) (ng/mC) (ng/mt)
48.1 125 205 -18 132 111 45 0 0 0 5 2 0 0 53.8 195 226 -20 94 79 44 0 0 0 2 2 0 0 57.0 135 216 -25 35 44 25 0 0 0 0 1 0 0 59.5 140 172 -27 28 16 13 0 0 0 0 0 0 0 62.0 99 240 -29 24 22 22 0 0 0 0 0 0 0 65.0 130 183 -30 13 12 14 0 0 0 0 0 0 0 69.0 156 203 -31 14 10 15 0 0 0 0 0 0 0 Subject 1,42 mgCocaine(base),Smoked 2.3 t 125 201 87 0 17,180 4690 197 337 0 0 284 29 0 4.8 125 180 87 20,181 20,873 5802 171 430 0 26 544 27 3 5.9 200 66 80 5621 7254 1659 71 83 0 0 132 0 0 9.2 170 196 80 12,081 16,829 3128 42 215 0 23 179 0 0
10.4 130 105 74 5891 8220 58 12 99 0 0 71 0 0 11.4 203 53 62 2911 3359 569 7 37 0 0 36 0 0 12.1 275 22 35 3082 1192 186 0 12 0 0 11 0 0 12.8 100 59 55 1068 M 402 5 44 0 2 27 0 0 19.2 260 152 65 2615 M 636 10 85 0 15 35 0 0 21.8 145 112 49 2614 M 188 4 45 0 5 15 0 0 23.1 205 59 37 1192 1191 47 0 11 0 0 7 0 0 26.0 115 223 55 3316 M 160 0 66 0 0 19 0 0 27.0 120 78 26 1084 1148 0 0 12 0 0 0 0 0 29.6 265 67 18 610 725 0 0 1 0 0 0 0 0 31.9 155 156 27 977 865 0 0 1 0 0 0 0 0 33.4 121 125 18 1311 760 0 0 3 0 0 0 0 0 34.8 135 93 3 461 467 0 0 0 0 0 0 0 0 35.3 110 45 -10 200 208 0 0 0 0 0 0 0 0 35.3 200 28 -16 934 123 0 0 0 0 0 0 0 0 36.7 170 39 -12 132 163 0 0 0 0 0 0 0 0 38.8 158 128 4 943 M 0 0 0 0 0 0 0 0 42.6 270 57 -15 121 148 0 0 0 0 0 0 0 0 45.1 210 98 -12 277 189 0 0 0 0 0 0 0 0 47.7 125 105 -10 194 166 0 0 0 0 0 0 0 0 50.3 70 175 -10 159 192 0 0 0 0 0 0 0 0 52.1 105 170 -11 138 139 0 0 0 0 0 0 0 0 54.0 130 143 -19 90 104 0 0 0 0 0 0 0 0 55.1 115 100 -21 53 67 0 0 0 0 0 0 0 0 57.0 145 123 -21 74 72 0 0 0 0 0 0 0 0 65.1 265 117 -23 23 30 0 0 0 0 0 0 0 0 70.0 265 72 -25 17 5 0 0 0 0 0 0 0 0 Subject J, 42 mg Cocaine (base), Smoked 0 100 183 -59 0 0 0 0 0 0 0 0 0 0 3.3 155 82 112 3507 3403 1889 195 40 5 34 55 59 0 8.3 190 116 105 3456 2910 1627 62 49 5 41 38 30 0 9.5 120 68 79 1624 1717 834 42 40 4 21 23 14 0 9.8 170 14 6 337 289 127 7 0 0 3 16 6 0
11.3 200 24 26 464 453 197 11 23 0 5 16 6 0 13.5 170 109 82 1784 1837 832 31 33 0 30 22 10 0 18.0 262 81 58 1004 734 231 6 24 0 10 17 6 0 21.5 180 107 47 877 909 298 7 26 0 16 17 7 0 23.7 230 71 26 501 255 149 3 14 0 10 9 3 0 25.3 265 13 --46 67 76 20 1 0 0 1 0 2 0 26.0 205 23 -35 140 126 34 1 11 0 3 0 3 0 28.0 135 120 25 488 418 108 2 13 0 9 9 0 0 31.0 265 52 -22 165 155 44 1 13 0 4 8 0 0
�9 Abbreviations: Vol., volume of urine specimen; Creat., creatinine; HI, high, out of range; M, missing. t Specimen at zero lime was missing.
393
Journal of Analytical Toxicology, Vol. 27, October 2003
Table I. Urine Concentrations Following Single Doses of Cocaine by Different Routes of Administration* (continued)
Time Vol. Creat. EMIT TDx BZE EME COC BNE NCOC m.HO-BZE p-HO-BZE m-HO-COC p-HO-COC (h) (mL) (mg/dL) (rate) (ng/mL) (ng/mL) (ng/mL)(ng/mL) (ng/mL) (ng/mL) (ng/mL) (ng/mL) (ng/mL) (ng/mL)
33.5 140 37.2 160 38.0 145 40.4 270 44.3 270 48.0 265 51.5 175 55.3 245 58.2 250 Subjed C, 32 0 145 1.5 190 2.5 185 3.3 145 3.7 260 4.2 265 4.5 265 6.2 250 7.7 150 9.8 165
11.8 180 16.3 200 20.6 280 20.9 270 28.5 195 29.8 175 33.2 215 34.8 190 35.3 270 36.3 175 44.7 540 49.7 265 50.7 110 53.7 235 54.3 115 56.1 100 58.7 150 64.0 280 68.0 155 Subject D, 32 0 265 1.8 375 7.4 350
10.5 280 13.3 265 15.7 265 20.7 675 23.5 255 30.0 285 31.5 400 32.5 150 33.5 375 34.5 285 35.3 205
135 7 319 337 101 3 15 0 10 9 0 0 56 -38 86 98 25 0 0 0 3 0 0 0 59 -41 91 81 27 0 0 0 3 0 0 0 48 -44 68 52 16 0 0 0 2 0 0 0 29 -54 23 21 12 0 0 0 0 0 0 0
159 -38 90 92 28 0 0 0 0 0 0 0 147 -45 54 64 21 0 0 0 0 0 0 0 116 -55 45 32 13 0 0 0 0 0 0 0 48 -55 4 5 6 0 0 0 0 0 0 0
mg Cocaine HCl, Intranasal M -26 M 0 0 0 0 0 0 0 0 0 83 41 1783 4003 553 237 83 9 7 3 9 3 66 80 7311 7017 2331 903 377 39 64 46 57 9 38 67 4983 4067 1201 221 189 12 66 45 44 5 20 54 2518 2134 668 123 134 9 33 20 21 3 14 44 1743 1402 479 101 58 5 27 14 14 3 15 43 1855 1556 473 50 80 4 30 16 14 3 41 70 4810 3826 752 61 133 5 49 22 18 3 85 79 9155 7872 2302 96 354 6 190 69 33 0 88 74 8847 7308 1620 20 588 2 193 56 23 0 53 57 3646 3458 725 10 164 1 67 15 11 0 71 66 3364 2993 640 18 147 2 61 9 9 0 46 23 1326 1113 253 8 64 2 30 4 5 0 52 18 1560 1413 286 4 44 1 34 4 5 0
119 35 1368 1270 172 4 44 0 43 4 5 0 70 15 559 557 128 3 22 0 23 3 4 0 49 6 277 255 67 1 9 0 13 2 2 0 29 -13 1t8 125 34 0 8 0 7 1 2 0 33 -15 111 101 31 1 4 0 7 1 2 0 73 -7 286 224 68 1 10 0 13 2 2 0 51 -16 78 86 27 I 6 0 7 I 2 0 56 -19 71 63 21 0 5 0 6 1 1 0
102 -16 100 88 30 0 3 0 8 0 1 0 41 -22 24 23 8 0 I 0 4 0 0 0 98 -20 60 46 16 0 4 0 6 2 0 0
152 -21 65 45 20 0 3 0 6 2 0 0 103 -23 50 33 16 0 1 0 5 2 0 0 97 -24 34 21 11 0 2 0 4 1 0 0 M -24 M 12 8 0 2 0 3 0 0 0
mgCocaine HCl, lntranasal 95 -24 46 0 0 0 0 0 0 0 0 0 80 6 454 485 252 190 28 0 0 0 0 0
135 85 10,040 10,887 3802 565 233 0 138 175 0 0 116 78 6191 6595 1763 55 130 0 119 86 35 0 95 69 4431 4709 1204 37 125 0 85 56 30 0 75 57 2697 2043 565 16 62 0 45 27 15 0 48 47 1323 1266 216 6 82 0 40 24 19 0 94 50 1896 1487 277 9 62 0 44 23 16 0 74 23 739 742 137 6 48 0 29 0 0 0 35 -2 295 277 59 0 38 0 24 0 0 0 44 -I 364 243 62 0 30 0 23 0 0 0 22 -17 149 116 23 0 19 0 9 0 0 0 35 -14 169 148 24 0 25 0 0 0 0 0 26 -14 121 94 22 0 0 0 0 0 0 0
"Abbreviations: Vol., volume of urine specimen; Creat., creatinine; HI, high, out of range; M, missing. Specimen at zero time was missing.
394
Journal of Analytical Toxicology, Vol. 27, October 2003
Table I. Urine Concentrations Following Single Doses of Cocaine by Different Routes of Administration* (continued)
Time Vol. Creat. EMIT TDx BZE EME COC BNE NCOC m-HO-BZE p-HO-BZE m-HO-COC p-HO-COC (h) (mL) (mg/dL) (rate) (ng/mL) (ng/mL) (ng/mL)(ng/mL) (ng/mL) (ng/mL) (ng/mL) (ng/mL) (ng/mL) (ng/mL)
35.8 280 36.3 270 37.0 265 38.2 175 40.5 645 Subject E, 32 0 190 0.8 236 6.5 245 8.5 160
10.5 185 11.5 205 20.5 225 23.5 165 25.5 265 27.8 250 30.1 250 37.0 195 44.5 250 49.5 210 53.8 210 55.5 245 57.5 220 Subject F, 32 0 145 2.0 152 8.1 165
11.5 I50 21.0 210 25.7 190 34.2 205 39.0 225 42.7 165 50.2 135 59.4 255 62.7 116 64.1 75 66.7 120 70.8 122 Subject 0 1.3 3.1 4.2 5.0 6.4 8.4
10.1 10.7 11.6 12.5 13.6 16.0 19.1
33 -15 133 91 14 0 0 0 0 0 0 0 10 -21 50 48 6 0 0 0 0 0 0 0 23 -19 110 57 8 0 0 0 0 0 0 0 44 -14 185 114 22 0 0 0 0 0 0 0 45 -18 144 101 18 0 0 0 0 0 0 0
mgCocaine HCl, lntranasal 134 -32 0 0 0 0 0 0 0 0 0 0 91 34 1340 1040 240 0 0 0 0 0 0 0
131 88 8660 10,170 1980 62 65 0 65 495 0 0 76 86 1458 10,988 1897 48 334 0 114 220 0 0 30 74 5461 6072 1020 0 75 0 96 108 0 0
205 47 2075 1468 211 0 29 0 14 23 0 0 156 69 6561 4599 799 0 379 0 147 80 0 0 16 57 2804 2255 496 0 74 0 94 35 0 0 75 -7 216 187 7 0 16 0 4 5 0 0 67 21 894 569 68 0 0 0 0 0 0 0
176 8 631 428 46 0 0 0 0 0 0 0 169 8 538 391 0 0 0 0 0 0 0 0 218 -7 258 213 0 0 0 0 0 0 0 0 195 -13 179 151 0 0 0 0 0 0 0 0 110 -20 85 71 0 0 0 0 0 0 0 0 32 -26 37 27 0 0 0 0 0 0 0 0 68 -28 7 6 0 0 0 0 0 0 0 0
mgCocaine HCl, lntranasal 151 -31 0 0 0 0 0 0 0 0 0 0 273 43 2062 2184 943 59 52 0 6 31 0 0 263 89 27,480 29,838 12,963 513 422 20 709 1010 133 6 188 83 11,600 13,497 5652 53 164 I 428 272 31 0 274 76 7730 8956 2991 27 135 0 334 127 8 0 259 64 4329 3388 1155 3 69 0 171 50 0 0 238 47 1728 1642 553 0 34 0 96 31 0 0 I93 24 812 658 18I 0 10 0 44 19 0 0 178 13 561 405 109 0 3 0 25 14 0 0 250 T5 613 528 117 0 13 0 38 23 0 0 261 -3 302 195 68 0 3 0 18 11 0 0 225 -17 123 136 78 0 1 0 8 6 0 0 168 -21 63 50 32 0 0 0 1 1 0 0 187 -22 75 30 21 0 0 0 0 1 0 0 232 -24 73 49 28 0 0 0 2 4 0 0
I, 32 mg Cocaine HCI, Intranasal 115 122 -27 16 0 0 0 0 0 0 0 0 0 105 117 59 3224 3221 1496 60 93 0 10 32 0 11 100 167 82 13,361 18,084 11,859 182 784 0 21 332 26 26 116 89 78 6061 10,719 2728 74 364 0 15 185 14 10 113 89 77 6381 7832 1526 6 331 0 18 156 13 6 115 90 73 5981 7376 2014 28 225 0 17 110 11 7 155 66 65 3893 5392 1219 20 199 0 12 74 0 0 220 40 51 1954 2110 570 5 103 0 10 39 0 0 165 30 43 1203 1450 371 3 69 0 6 27 0 0 205 39 46 1580 1871 401 2 99 0 7 30 0 0 115 72 59 3000 2544 445 4 127 0 9 28 0 0 85 143 62 4579 3998 721 8 167 0 11 35 0 0
260 86 51 2020 1916 340 3 79 0 7 20 0 0 270 94 46 1793 1907 282 3 75 0 8 18 0 0
* Abbrevialions: Vol., volume of urine specimen; Creal., creatinine; HI. high, out of range; M, missing. t Specimen at zero lime was missing.
395
Journal of Analytical Toxicology, Vol. 27, October 2003
Table I. Urine Concentrations Following Single Doses of Cocaine by Different Routes of Administration* (continued)
Time Vol. Creat. EMIT TDx BZE EME CO(: BNE NCOC m-HO-BZE p-HO-BZE m-HO-COC p-HO-COC (h) (mL) (mg/dL) (rate) (ng/mL) (ng/mL) (ng/mt)(ng/mt) (ng/mt) (ng/mL) (ng/mL) (ng/mL) (ng/mL) (ng/mL)
25.2 121 126 39 1343 1360 91 1 35 0 6 15 0 0 26.5 120 102 30 975 992 59 0 35 0 8 13 0 0 28.9 273 59 4 288 554 49 0 27 0 9 19 0 0 30.6 265 76 5 322 324 19 0 15 0 4 10 0 0 34.1 105 145 13 535 562 24 0 21 0 5 11 0 0 36.2 160 140 9 450 456 29 0 7 0 6 10 0 0 39.3 205 158 5 360 392 27 0 29 0 0 0 0 0 44.5 270 124 --6 210 213 20 0 17 0 0 0 0 0 46.7 200 103 -13 142 142 3 0 13 0 0 0 0 0 48.8 115 142 -15 133 130 4 0 0 0 0 0 0 0 50.0 120 125 -19 78 89 3 0 0 0 0 0 0 0 51.6 160 114 -22 60 74 0 0 0 0 0 0 0 0 53.6 280 73 -24 49 33 0 0 0 0 0 0 0 0 55.5 175 112 -23 44 50 0 0 0 0 0 0 0 0 56.7 145 85 -25 30 31 0 0 0 0 0 0 0 0 59.5 165 98 -27 11 25 0 0 0 0 0 0 0 0 62.5 265 75 -26 10 11 0 0 0 0 0 0 0 0 66.7 275 105 -26 57 10 0 0 0 0 0 0 0 0 68.4 210 71 -29 19 4 0 0 0 0 0 0 0 0 Su~eclJ, 32mgCocaine HCl, lntranasal 0 245 11 -53 7 0 0 0 0 0 0 0 0 0
M 150 101 -51 12 0 8 5 0 0 0 0 0 0 2.3 265 75 119 5541 3646 2048 196 46 8 11 35 32 0 3.2 270 23 89 2185 2093 1179 249 34 7 I0 30 31 0
12.2 270 100 t05 4771 4418 1677 25 45 0 41 38 16 0 14.4 145 31 44 1044 1007 368 9 26 0 9 18 8 0 15.8 125 103 100 3058 2829 739 7 41 0 36 25 9 0 17.2 185 46 62 1594 1146 298 3 27 0 12 18 7 0 18.3 255 26 30 539 558 106 2 25 0 6 16 0 0 19.5 280 48 48 1340 1131 235 3 26 0 10 17 7 0 22.3 220 75 59 11t5 1151 232 0 27 0 12 18 7 0 23.5 165 33 16 460 427 65 0 24 0 4 0 0 0 26.0 220 51 21 620 461 69 0 16 0 14 13 0 0 26.6 190 31 -8 194 231 49 0 10 0 11 t2 0 0 28.4 135 120 46 707 690 16t 0 26 0 19 15 0 0 35.0 240 153 43 729 679 88 0 32 0 20 15 0 0 39.8 270 62 -34 152 123 20 0 9 0 0 0 0 0 40.7 180 37 -49 108 56 17 0 9 0 0 0 0 0 41.0 265 24 -48 30 36 6 0 7 0 0 0 0 0 44.5 230 79 -36 126 103 24 0 0 0 0 0 0 0 46.3 205 40 -52 63 41 12 0 0 0 0 0 0 0 48.0 275 35 -S0 31 32 12 0 0 0 0 0 0 0 53.0 150 195 -31 114 119 0 0 0 0 0 0 0 0 54.7 215 79 -49 35 33 14 0 0 0 0 0 0 0 61.0 270 107 -52 28 26 5 0 0 0 0 0 0 0 62.4 215 51 -53 5 7 12 0 0 0 0 0 0 0
* Abbreviations: Vol., volume of urine specimen; Creat., creatinine; HI, high, out of range; M, t Specimen at zero time was missing.
missing.
rn-HO-BZE (range 6.9-10.2 h). Peak concentrations (Cmax) of COC and metabolites were highly variable. Mean Cm~ values generally followed the order as follows: BZE > EME > COC > BNE = p-HO-BZE > m-HO-BZE > m-HO-COC > NCOC > p- HO-COC. Mean % dose recovered from urine followed a similar pattern.
Elimination half-lives were estimated for cocaine and metabo-
lites based on their terminal elimination curves. Most esti- mates of half-life were based on six subjects and contained more than nine points on the excretion curve with the excep- tions of COC, NCOC, m-HO-COC, and p-HO-COC. For p-HO- COC, there were insufficient data for estimation of half-life with the exception of two subjects following IN administra- tion. The goodness of fit of the slope of the excretion curve
396
Journal of Analytical Toxicology, Vol, 27, October 2003
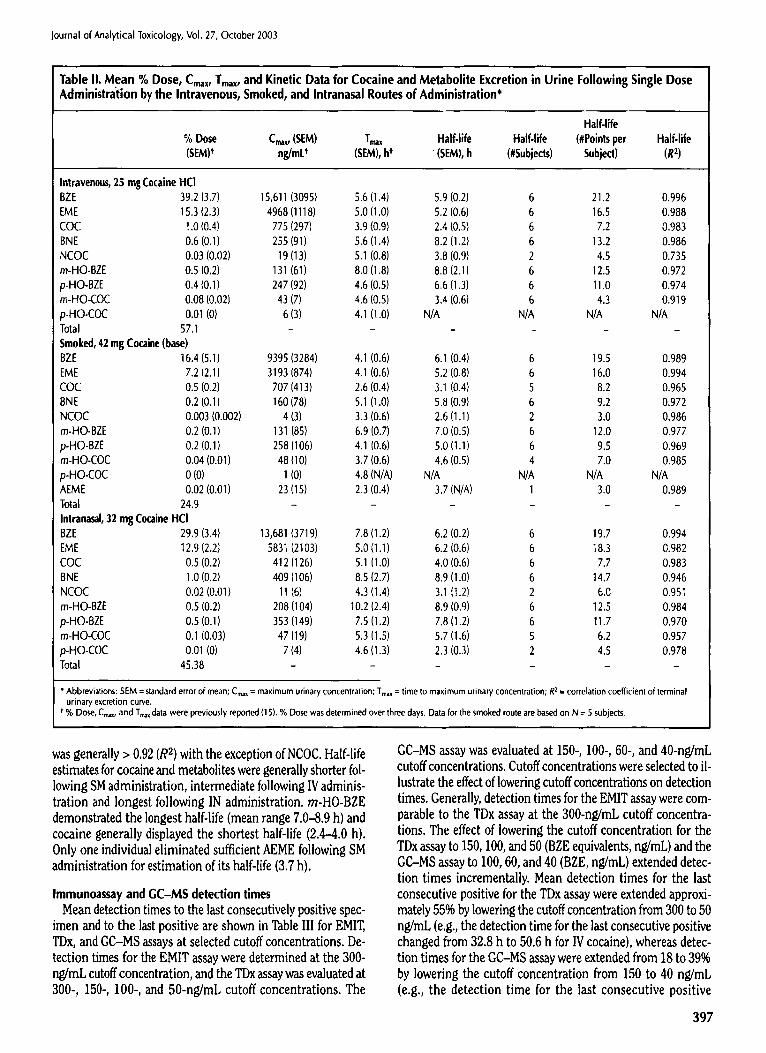
Table II. Mean % Dose, Cmax, Tmax, and Kinetic Data for Cocaine and Metabolite Excretion in Urine Following Single Dose Administration by the Intravenous, Smoked, and Intranasal Routes of Administration*
Half-life % Dose Crux, (SEM) Tmax Half-life Half-life (#Points per Half-life (SEM) t ng/mU (SEM), h t (SEM), h (#Subjects) Subject) (R 2)
Intravenous, 25 mg Cocaine HCI BZE 39.2 (3.7) 15,611 (3095) 5.6 (1.4) 5.9 (0.2) 6 21.2 0.996 EME 15.3 (2.3) 4968 (1118) 5.0 (1.0) 5.2 (0.6) 6 16.5 0.988 COC t.0 (0,4) 775 (297) 3.9 (0.9) 2.4 (0.5) 6 7.2 0.983 BNE 0.6 (0.1) 255 (91) 5.6 (1.4) 8.2 (1.2) 6 13.2 0.986 Ns 0.03 (0.02) 19 (13) 5.1 (0.8) 3.8 (0.9) 2 4.5 0.735 m-HO-BZE 0.5 (0.2) 131 (61) 8.0 (1.8) 8.8 (2.1) 6 12.5 0.972 p-HO-BZE 0.4 (0.1) 247 (92) 4,6 (0.5) 6,6 (13) 6 11.0 0.974 m-HO-COC 0,08 (0.02) 43 (7) 4.6 (0.5) 3,4 (0.6) 6 4.3 0.919 p-HO-COC 0.01 (0) 6 (3) 4.1 (1.0) N/A N/A N/A N/A Total 57.1 . . . . Smoked, 42 mg Cocaine (base) BZE 16.4 (5.1) 9395 (3284) 4.1 (0.6) 6.1 (0.4) 6 19.5 0.989 EME 7.2 (2.1) 3193 (874) 4.1 (0.6) 5.2 (0.8) 6 16.0 0.994 COC 0.5 (0.2) 707 (413) 2.6 (0.4) 3.1 (0.4) 5 8.2 0.965 8NE 0.2 (0.1) 160 (78) 5.1 (1.0) 5.8 (0.9) 6 9.2 0.972 NCOC 0.003 (0.002) 4 (3) 3.3 (0.6) 2.6 (1.1) 2 3.0 0.986 m-HO-BZE 0.2 (0.1) 131 (85) 6.9 (0.7) 7.0 (0.5) 6 12.0 0.977 p-HO-BZE 0.2 (0.1) 258 (106) 4.1 (0.6) 5.0 (1.1) 6 9.5 0.969 m-HO-COC 0.04 (0.01) 48 (10) 3.7 (0.6) 4.6 {0.5) 4 7.0 0.985 p-HO-COC 0 (0) 1 (0) 4.8 (N/A) N/A N/A N/A N/A AEME 0.02 (0.01) 23 (15) 2.3 (0.4) 3.7 (N/A) 1 3.0 0.989 Total 2 4 . 9 . . . . . . Intrana,~l, 32 mg Cocaine HCI BZE 29.9 (3.4) 13,681 (3719) 7.8 (1.2) 6.2 (0.2) 6 19.7 0.994 EME 12.9 t2.2) 583t (2103) 5.0 (1.1) 6.2 (0.6) 6 18.3 0.982 COC 0.5 (0.2) 412 (126) 5.1 (1.0) 4.0 (0.6) 6 7.7 0.983 8NE 1.0 (0.2) 409 (106) 8.5 (2.7) 8.9 (1.0) 6 14.7 0.946 NCOC 0.02 (0.01) 11 (6) 4.3 (1.4) 3.1 (t.2) 2 6.0 0.951 m-HO-BZE 0.5 (0.2) 208 (104) 10.2 (2.4) 8.9 (0.9) 6 12.5 0.984 p-HO-BZE 0.5 (0.1) 353 (149) 7.5 (1.2) 7.8 (1.2) 6 11.7 0.970 m-HO-COC 0.1 (0.03) 47 (19) 5.3 (1.5) 5.7 (1.6) 5 6.2 0.957 p-HO-COC 0.01 (0) 7 (4) 4.6 (1.3) 2.3 (0.3) 2 4.5 0.978 Total 45.38 . . . . .
* Abbreviations: SEM = standard error of mean; C~x = maximum urinary concentration; Trnax = time to maximum urinary concentration; R z = correlation coefficient of terminal urinary excretion curve.
t % Dose, Cmax, and Tmax data were previously reported (15). % Dose was determined over three days. Data for the smoked route are based on N = 5 subjects.
was generally > 0.92 (R 2) with the exception of NCOC. Half-life estimates for cocaine and metabolites were generally shorter fol- lowing SM administration, intermediate following IV adminis- tration and longest following IN administration, ra-HO-BZE demonstrated the longest half-life (mean range 7.0--8.9 h) and cocaine generally displayed the shortest half-life (2.4-4.0 h). Only one individual eliminated sufficient AEME following SM administration for estimation of its half-life (3.7 h).
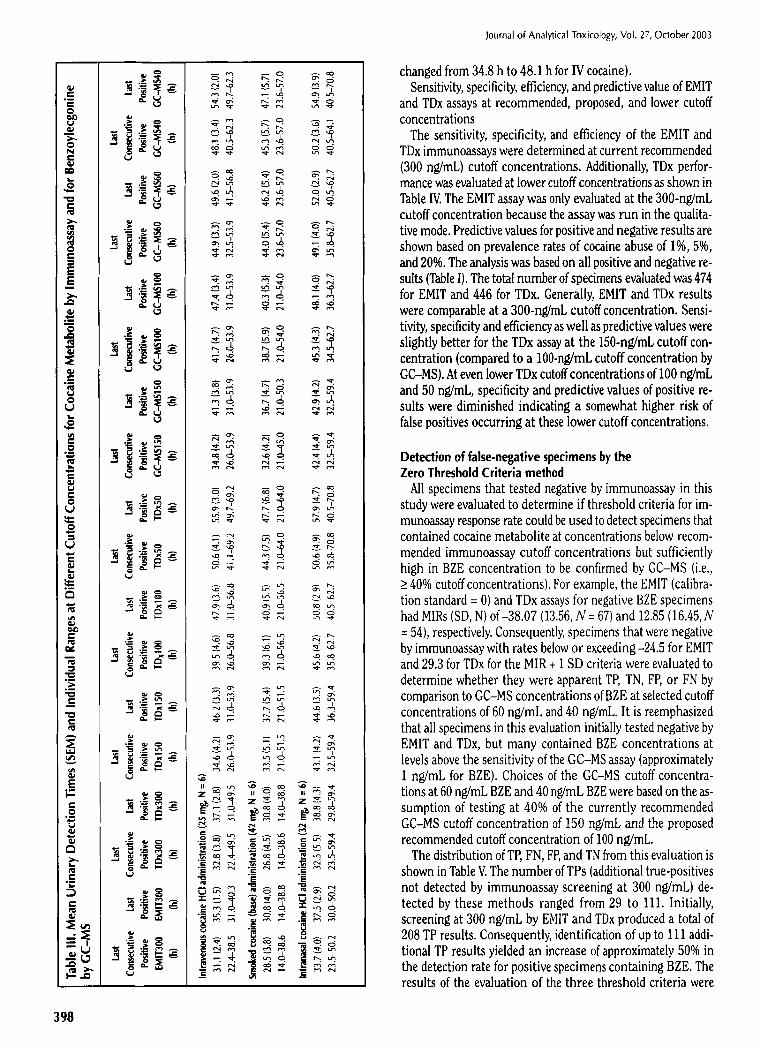
Immunoassay and GC-MS detection times Mean detection times to the last consecutively positive spec-
imen and to the last positive are shown in Table III for EMIT, TDx, and GC-MS assays at selected cutoff concentrations. De- tection times for the EMIT assay were determined at the 300- ng/mL cutoff concentration, and the TDx assay was evaluated at 300-, 150-, 100-, and 50-ng/mL cutoff concentrations. The
GC-MS assay was evaluated at 150-, 100-, 60-, and 40-ng/mL cutoff concentrations. Cutoff concentrations were selected to il- lustrate the effect of lowering cutoff concentrations on detection times. Generally, detection times for the EMIT assay were com- parable to the TDx assay at the 300-ng/mL cutoff concentra- tions. The effect of lowering the cutoff concentration for the TDx assay to 150, 100, and 50 (BZE equivalents, ng/mL) and the GC-MS assay to 100, 60, and 40 (BZE, ng/mL) extended detec- tion times incrementally. Mean detection times for the last consecutive positive for the TDx assay were extended approxi- mately 55% by lowering the cutoff concentration from 300 to 50 ng/mL (e.g., the detection time for the last consecutive positive changed from 32.8 h to 50.6 h for IV cocaine), whereas detec- tion times for the GC-MS assay were extended from 18 to 39% by lowering the cutoff concentration from 150 to 40 ng/mL (e.g., the detection time for the last consecutive positive
397
t .
|
I , .
o
398
0
3
~ :--- ~" ~
~ . ~4 "
m ~
~.,~ ~ �9 ~,~
m ~
'~. ~ ~ �9 c~. ,... 4
�9 ~ , . Z
~ . ~ ~ . ~ . �9
Le~
�9 -: ' ~" ~ ~. c~
,,.=
.~ ,~ - .
~ m
�9 , . ~/ , ~
I I ~ L ~ ~ ~ r ~ ~ ~ l " r " Z ~ ~ , ~ . ~ 04
~ 1 ~ Z Z ~ ~-~ Z ~- u~
C L Q ~ , . ~ ~ ~
" V -
r ,
~. .
Journal o f Analyt ical Toxicology, Vol. 27, O c t o b e r 2003
changed from 34.8 h to 48.1 h for IV cocaine). Sensitivity, specificity, efficiency, and predictive value of EMIT
and TDx assays at recommended, proposed, and lower cutoff concentrations
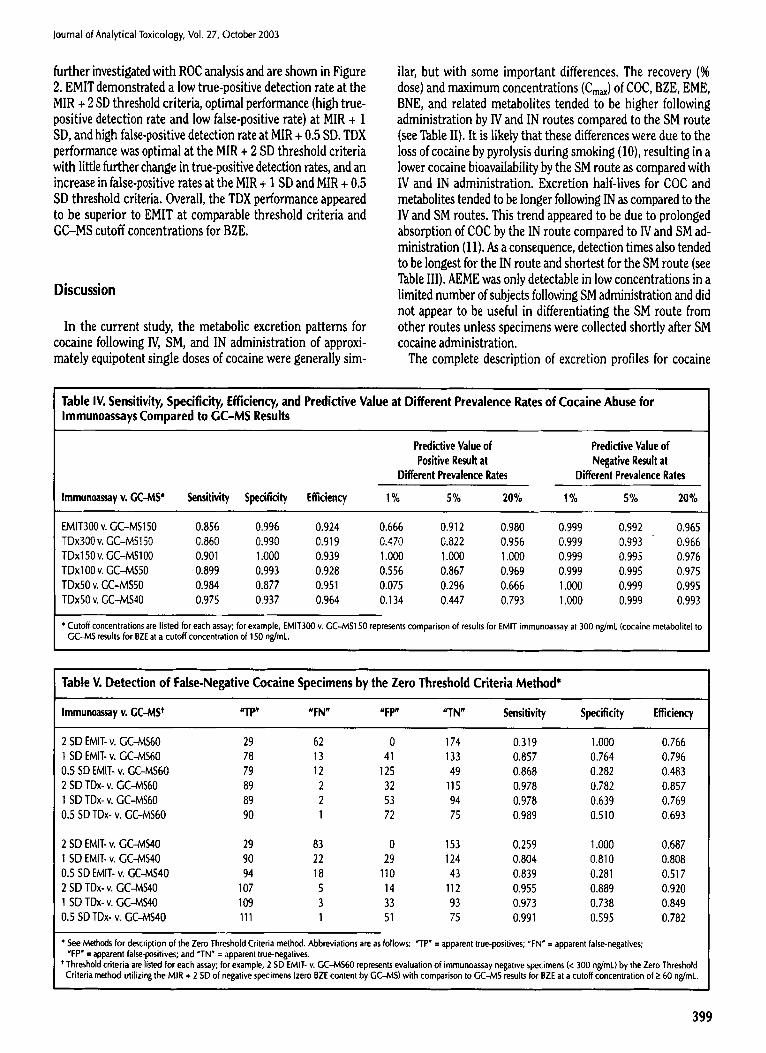
The sensitivity, specificity, and efficiency of the EMIT and TDx immunoassays were determined at current recommended (300 ng/mL) cutoff concentrations. Additionally, TDx perfor- mance was evaluated at lower cutoff concentrations as shown in Table IV. The EMIT assay was only evaluated at the 300-ng/mL cutoff concentration because the assay was run in the qualita- tive mode. Predictive values for positive and negative results are shown based on prevalence rates of cocaine abuse of 1%, 5%, and 20%. The analysis was based on all positive and negative re- suits (Table I). The total number of specimens evaluated was 474 for EMIT and 446 for TDx. Generally, EMIT and TDx results were comparable at a 300-ng/mL cutoff concentration. Semi- tivity, specificity and efficiency as well as predictive values were slightly better for the TDx assay at the 150-ng/mL cutoff con- centration (compared to a 100-ng/mL cutoff concentration by GC-MS). At even lower TDx cutoff concentrations of 100 ng/mL and 50 ng/mL, specificity and predictive values of positive re- suits were diminished indicating a somewhat higher risk of false positives occurring at these lower cutoff concentrations.
Detection of false-negative specimens by the Zero Threshold Criteria method
All specimens that tested negative by immunoassay in this study were evaluated to determine if threshold criteria for im- munoassay response rate could be used to detect specimens that contained cocaine metabolite at concentrations below recom- mended immunoassay cutoff concentrations but sufficiently high in BZE concentration to be confirmed by GC-MS (i.e.,
40% cutoff concentrations). For example, the EMIT (calibra- tion standard = 0) and TDx assays for negative BZE specimens had MIRs (SD, N) of-38.07 (13.56, N = 67) and 12.85 (16.45, N = 54), respectively. Consequently, specimens that were negative by immunoassay with rates below or exceeding -24.5 for EMIT and 29.3 for TDx for the MIR + 1 SD criteria were evaluated to determine whether they were apparent TP, TN, FP, or FN by comparison to GC-MS concentrations of BZE at selected cutoff concentrations of 60 ng/mL and 40 ng/mL. It is reemphasized that all specimens in this evaluation initially tested negative by EMIT and TDx, but many contained BZE concentrations at levels above the sensitivity of the GC-M8 assay (approximately 1 ng/mL for BZE). Choices of the GC-MS cutoff concentra- tions at 60 ng/mL BZE and 40 ng/mL BZE were based on the as- sumption of testing at 40% of the currently recommended GC-MS cutoff concentration of 150 ng/mL and the proposed recommended cutoff concentration of 100 ng/mL.
The distribution of TP, FN, FP, and TN from this evaluation is shown in Table V. The number of TPs (additional true-positives not detected by immunoassay screening at 300 ng/mL) de- tected by these methods ranged from 29 to 111. Initially, screening at 300 ng/mL by EMIT and TDx produced a total of 208 TP results. Consequently, identification of up to 111 addi- tional TP results yielded an increase of approximately 50% in the detection rate for positive specimens containing BZE. The results of the evaluation of the three threshold criteria were
Journal of Analytical Toxicology, Vol. 27, October 2003
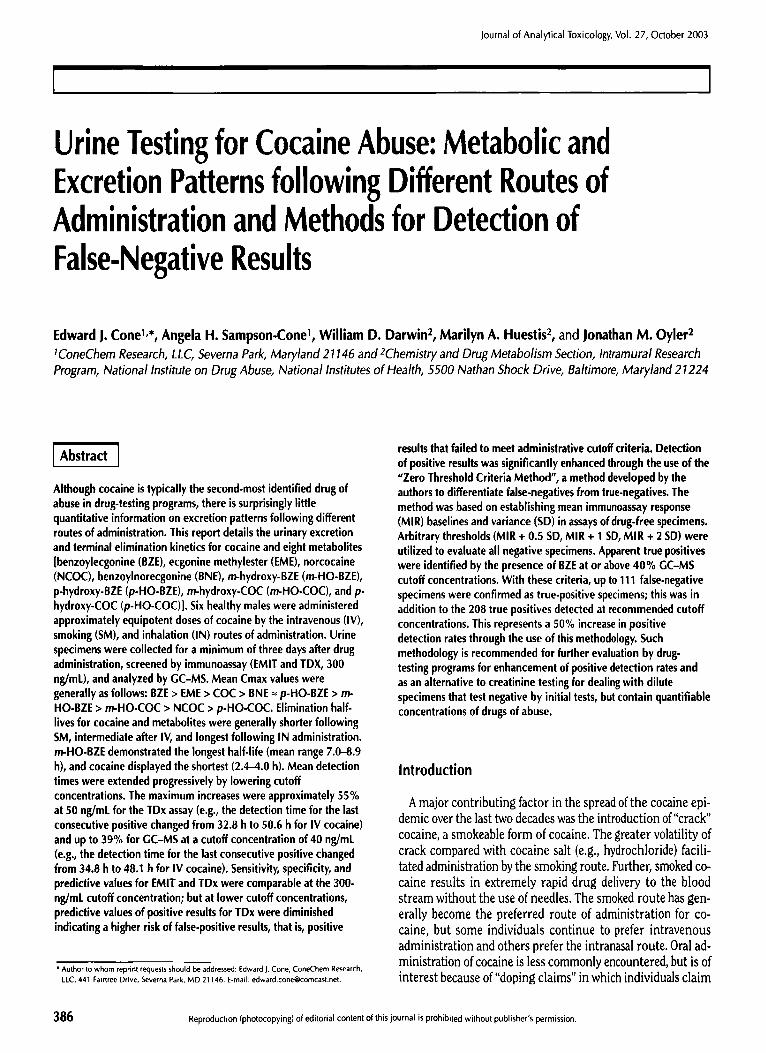
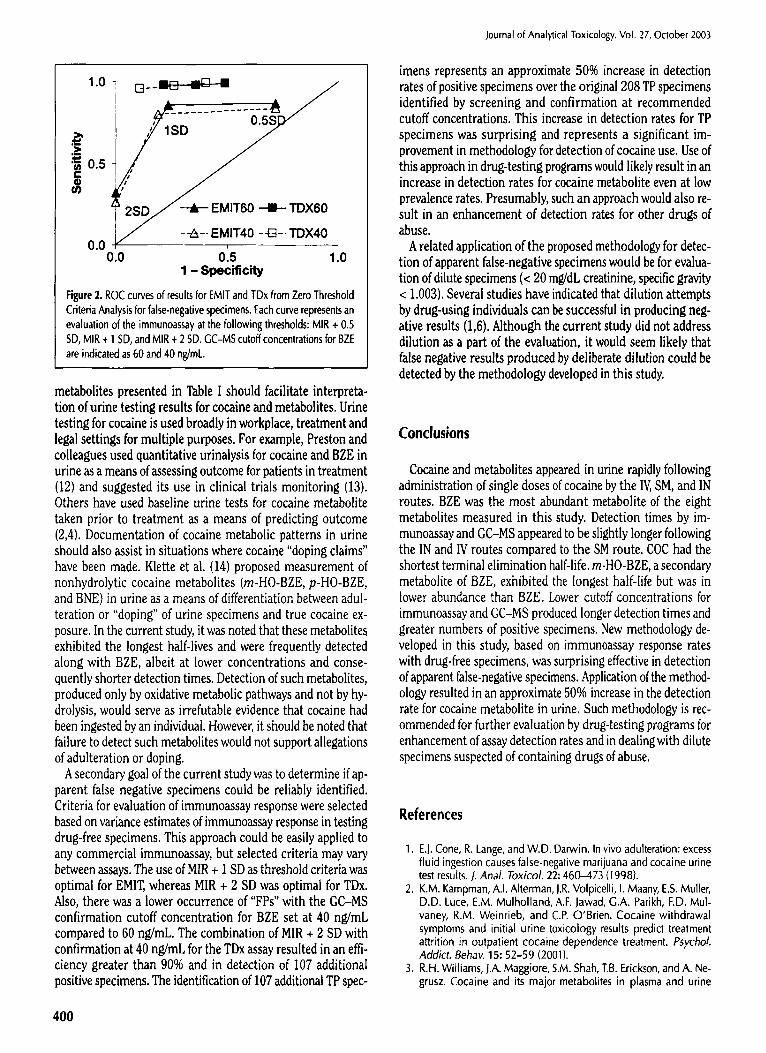
further investigated with ROC analysis and are shown in Figure 2. EMIT demonstrated a low true-positive detection rate at the MIR + 2 SD threshold criteria, optimal performance (high true- positive detection rate and low false-positive rate) at MIR + 1 SD, and high false-positive detection rate at MIR + 0.5 SD. TDX performance was optimal at the MIR + 2 SD threshold criteria with little further change in true-positive detection rates, and an increase in false-positive rates at the MIR + 1 SD and MIR + 0.5 SD threshold criteria. Overall, the TDX performance appeared to be superior to EMIT at comparable threshold criteria and GC-MS cutoff concentrations for BZE.
Discussion
In the current study, the metabolic excretion patterns for cocaine following IV, SM, and IN administration of approxi- mately equipotent single doses of cocaine were generally sire-
ilar, but with some important differences. The recovery (% dose) and maximum concentrations (Cmax) of COC, BZE, EME, BNE, and related rnetabolites tended to be higher following administration by IV and IN routes compared to the SM route (see Table II). It is likely that these differences were due to the loss of cocaine by pyrolysis during smoking (10), resulting in a lower cocaine bioavailability by the SM route as compared with IV and IN administration. Excretion half-lives for COC and metabolites tended to be longer following IN as compared to the IV and SM routes. This trend appeared to be due to prolonged absorption of COC by the IN route compared to IV and SM ad- ministration (11). As a consequence, detection times also tended to be longest for the IN route and shortest for the SM route (see Table III). AEME was only detectable in low concentrations in a limited number of subjects following SM administration and did not appear to be useful in differentiating the SM route from other routes unless specimens were collected shortly after SM cocaine administration.
The complete description of excretion profiles for cocaine
Table IV. Sensitivity, Specificity, Efficiency, and Predictive Value at Different Prevalence Rates of Cocaine Abuse for Immunoassays Compared to GC-MS Results
Predictive Value of Positive Result at
Different Prevalence Rates
Predictive Value of Negative Result at
Different Prevalence Rates
Immun0assay v. GC-MS ~ Sensitivity Specificity Efficiency 1% 5% 20% 1% 5% 20%
EMIT300 v. GC-MS150 0.856 0.996 0.924 0.666 0.912 0.980 0.999 0.992 0.965 TDx300 v. GC-MS150 0.860 0.990 0.919 0.470 0.822 0.956 0.999 0.993 0.966 TDx150 v. GC-MSI00 0.901 1.000 0.939 1.000 1.000 1.000 0.999 0.995 0.976 TDxI00 v. GC-MSS0 0.899 0.993 0,928 0.556 0.867 0.969 0,999 0.99S 0.975 TDx50 v. GC-MS50 0.984 0.877 0.951 0.075 0.296 0.666 1.000 0.999 0.995 TDx50 v. GC-MS40 0.975 0.937 0.964 0.134 0.447 0.793 1.000 0~999 0.993
"Cutoff concentrations are listed for each assay; for example, EMIT300 v. GC--MS150 represents comparison of results for EMIT immunoassay at 300 ng/mL (cocaine metabolite) to GC-MS results for BZE at a cutoff concentration of 150 ng/mL
Table V. Detection of False-Negative Cocaine Specimens by the Zero Threshold Criteria Method*
Immunoassay v. GC-MS t 'q'P" "FN" "FP" "I'N" Sensi t iv i ty Speci f ic i ty Efficiency
2 SD EMIT- v. GC-MS60 29 62 0 174 0.319 1.000 0.766 1 5D EMIT- v. GC-MS60 78 13 41 133 0.857 0.764 0.796 0.5 5D EMIT- v. GC--MS60 79 12 125 49 0.868 0.282 0.483 2 SD TDx-v. GC-MS60 89 2 32 115 0.978 0.782 0.857 1 SD TDx- v. GC-MS60 89 2 53 94 0.978 0.639 0.769 0.5 SD TDx- v. GC-MS60 90 1 72 75 0.989 0.510 0.693
2 SD EMIT- v. GC-MS40 29 83 0 153 0.259 1,000 0.687 1 SD EMIT. v. GC-MS40 90 22 29 124 0,804 0.810 0,808 0.5 SD EMIT- v. GC-MS40 94 18 110 43 0.839 0.281 0.517 2 SD TDx- v. GC-MS40 107 5 14 112 0.955 0.889 0.920 1 SD TOx- v. GC--MS40 109 3 33 93 0.973 0.738 0,849 0.5 SD TDx-v. GC-MS40 111 1 51 75 0.991 0.595 0.782
* See Methods for description of the Zero Threshold Criteria method. Abbreviations are as follows: "TP" = apparent true-positives; "FN" = apparent false-negatives; "FP" = apparent false-positives; and "TN" = apparent true-negatives,
*Threshold criteria are listed for each assay; for example, 2 SD EMIT- v. GC-MS60 represents evaluation of immunoassay negative specimens (< 300 ng/mL) by the Zero Threshold Criteria method utilizing the MIR + 2 SD of negative specimens (zero BZE content by GC--/viS) with comparison to GC-MS results for BZE at a cutoff concentration of ~ 60 ng/mL.
399
1.0
._> o.s e-
0.0 0.0
!S~ ,,,/" �9 EMIT60 - I I - TDX60
7 --~-- EMIT40 -43--TDX40
o'.s I'.o 1 - Specificity
Figure 2. ROC curves of results for EMIT and TDx from Zero Threshold Criteria Analysis for false-negative specimens. Each curve represents an evaluation of the immunoassay at the following thresholds: MIR + 0.5 SD, MIR + 1 SD, and MIR + 2 SD. GC-MS cutoff concentrations for BZE are indicated as 60 and 40 ng/mL.
metabolites presented in Table I should facilitate interpreta- tion of urine testing results for cocaine and metabolites. Urine testing for cocaine is used broadly in workplace, treatment and legal settings for multiple purposes. For example, Preston and colleagues used quantitative urinalysis for cocaine and BZE in urine as a means of assessing outcome for patients in treatment (12) and suggested its use in clinical trials monitoring (13). Others have used baseline urine tests for cocaine metabolite taken prior to treatment as a means of predicting outcome (2,4). Documentation of cocaine metabolic patterns in urine should also assist in situations where cocaine "doping claims" have been made. Klette et al. (14) proposed measurement of nonhydrolytic cocaine metabolites (m-HO-BZE, p-HO-BZE, and BNE) in urine as a means of differentiation between adul- teration or "doping" of urine specimens and true cocaine ex- posure. In the current study, it was noted that these metabolite~ exhibited the longest half-lives and were frequently detected along with BZE, albeit at lower concentrations and conse- quently shorter detection times. Detection of such metabolites, produced only by oxidative metabolic pathways and not by hy- drolysis, would serve as irrefutable evidence that cocaine had been ingested by an individual. However, it should be noted that failure to detect such metabolites would not support allegations of adulteration or doping.
A secondary goal of the current study was to determine if ap- parent false negative specimens could be reliably identified. Criteria for evaluation of immunoassay response were selected based on variance estimates of immunoassay response in testing drug-free specimens. This approach could be easily applied to any commercial immunoassay, but selected criteria may vary between assays. The use of MIR + 1 SD as threshold criteria was optimal for EMIT, whereas MIR + 2 SD was optimal for TDx. Also, there was a lower occurrence of "FPs" with the GC-MS confirmation cutoff concentration for BZE set at 40 ng/mL compared to 60 ng/mL. The combination of MIR + 2 SD with confirmation at 40 ng/mL for the TDx assay resulted in an effi- ciency greater than 90% and in detection of 107 additional positive specimens. The identification of 107 additional TP spec-
400
Journal of Analytical Toxicology, Vol. 27, Oclober 2003
linens represents an approximate 50% increase in detection rates of positive specimens over the original 208 TP specimens identified by screening and confirmation at recommended cutoff concentrations. This increase in detection rates for TP specimens was surprising and represents a significant im- provement in methodology for detection of cocaine use. Use of this approach in drug-testing programs would likely result in an increase in detection rates for cocaine metabolite even at low prevalence rates. Presumably, such an approach would also re- sult in an enhancement of detection rates for other drugs of abuse.
A related application of the proposed methodology for detec- tion of apparent false-negative specimens would be for evalua- tion of dilute specimens (< 20 mg/dL creatinine, specific gravity < 1.003). Several studies have indicated that dilution attempts by drug-using individuals can be successful in producing neg- ative results (1,6). Although the current study did not address dilution as a part of the evaluation, it would seem likely that false negative results produced by deliberate dilution could be detected by the methodology developed in this study.
Conclusions
Cocaine and metabolites appeared in urine rapidly following administration of single doses of cocaine by the IV, SM, and IN routes. BZE was the most abundant metabolite of the eight metabolites measured in this study. Detection times by im- munoassay and GC-MS appeared to be slightly longer following the IN and IV routes compared to the SM route. COC had the shortest terminal elimination half-life, m-HO-BZE, a secondary metabolite of BZE, exhibited the longest half-life but was in lower abundance than BZE. Lower cutoff concentrations for immunoassay and GC-MS produced longer detection times and greater numbers of positive specimens. New methodology de- veloped in this study, based on immunoassay response rates with drug-free specimens, was surprising effective in detection of apparent false-negative specimens. Application of the method- ology resulted in an approximate 50% increase in the detection rate for cocaine metabolite in urine. Such methodology is rec- ommended for further evaluation by drug-testing programs for enhancement of assay detection rates and in dealing with dilute specimens suspected of containing drugs of abuse.
References
1. E.J. Cone, R. Lange, and W.D. Darwin. In vivo adulteration: excess fluid ingestion causes false-negative marijuana and cocaine urine test results. J. AnaL Toxicol. 22:460-473 (1998).
2. K.M. Kampman, A.I. Alterman, J.R. Volpicelli, I. Maany, E.S. Muller, D.D. Luce, E.M. Mulholland, A.F. Jawad, G.A. Parikh, F.D. Mul- vaney, R.M. Weinrieb, and C.P. O'Brien. Cocaine withdrawal symptoms and initial urine toxicology results predict treatment attrition in outpatient cocaine dependence treatment. PsychoL Addict. Behav. 15:52-59 (2001).
3. R.H. Williams, J.A. Maggiore, S.M. Shah, T.B. Erickson, and A. Ne- grusz. Cocaine and its major metabolites in plasma and urine
Journal of Analytical Toxicology, Vol. 27, October 2003
samples from patients in an urban emergency medicine setting. J. Anal. Toxicol. 24:478-481 (2000).
4. R.N. Ehrman, S.J. Robbins, and J.W. Cornish. Results of a baseline urine test predicl levels of cocaine use during treatment. Drug Alcohol Depend. 62: I -7 (2001).
5. C. Zwerling, J. Ryan, and E.J. Orav. The efficacy of preemployment drug screening for marijuana and cocaine in predicting employ- ment outcome. J. Am. Med. Assoc. 264:2639-2643 (I 990).
6. P. Lafolie, O. Beck, G. Blennow, L. Boreus, S. Borg, C.E. Elwin, L. Karlsson, G. Odelius, and P. Hjemdahl. Importance of creatinine analyses of urine when screening for abused drugs. C/in. Chem. 37: 1927-1931 (1991).
7. E.J. Cone, A. Tsadik, J. Oyler, and W.D. Darwin. Cocaine metabolism and urinary excretion after different routes of admin- istration. Ther. Drug Monit. 20:556-560 (1998).
8. V.R. Spiehler, C.M. O'Donnell, and D.V. Gokhale. Confirmation and certainty in toxicology screening. Clin. Chem. 34:1535-I 539 (I 988).
9. J.R. Beck and E.K. Shultz. The use of relative operating character- istic (ROC) curves in test performance evaluation. Arch. Pathol. Lab. Meal. 110:13-20 (1986).
10. C.E. Cook. Pyrolytic characteristics, pharmacokinetics, and bioavailability of smoked heroin, cocaine, phencyclidine, and methamphetamine. NIDA Research Monograph, Rockville, MD, 1995.
11. E.J. Cone. Pharmacokinetics and pharmacodynamics of cocaine. J. Anal. ToxicoL 19:459-478 (1995).
12. K.L. Preston, M.A. Huestis, C.J. Wong, A. Urnbricht, B.A. Gold- berger, and E.J. Cone. Monitoring cocaine use in substance-abuse- treatment patients by sweat and urine testing. J. Anal. Toxicol. 23: 313-322 (1999).
13. K.L. Preston, K. Silverman, C.R. Schuster, and E.J. Cone. Assessment of cocaine use with quantitative urinalysis and estimation of new uses. Addiction 92:717-727 (1997).
14. K.L. Klette, G.K. Poch, R. Czamy, and C.O. Lau. Simultaneous GC-MS analysis of meta- and para-hydroxybenzoylecgonine and norbenzoylecgonine: a secondary method to corroborate cocaine ingestion using nonhydrolytic metabolites. ]. Anal Toxicol. 24: 482-488 (2000).
15. E.J. Cone, J. Oyler, and W.D. Darwin. Cocaine disposition in saliva following intravenous, intranasal, and smoked administration. J. Anal. Toxicol. 21:465-475 (I 997).
401