Embed Size (px)
Citation preview

UUSS 22//NNoorrtthh WWiilllliissttoonn RRooaadd IInntteerrsseeccttiioonn –– IInniittiiaall
SSccooppiinngg RReeppoorrtt WWiilllliissttoonn,, VVeerrmmoonntt
PLA
NNIN
G
ENGIN
EERIN
G
DESIG
N
October
2009
55 Ra i l r oa d Row , Wh i t e Ri ve r Jun c t io n , Ve rmont 05001 T E L 802 .2 95 . 4 999 F AX 802 .2 95 .1 006 www . rs g i n c . com

Acknowledgements: This report was funded in part through grant[s] from the Federal Highway Administration [and Federal Transit Administration], U.S. Department of Transportation. The views and opinions of the authors [or agency] expressed herein do not necessarily state or reflect those of the U. S. Department of Transportation. Report Prepared by:
Report Prepared for:
Town of Williston

US 2/North Williston Road Scoping Report Page i
TABLE OF CONTENTS
1.0 INTRODUCTION .......................................................................................1 1.1 Project Background..................................................................................................................................1 1.2 Project Study Area ...................................................................................................................................2
2.0 PURPOSE & NEED ....................................................................................3 2.1 Purpose ....................................................................................................................................................3 2.2 Need ......................................................................................................................................................3
3.0 PUBLIC PARTICIPATION .............................................................................4
4.0 EXISTING & FUTURE CONDITIONS ...............................................................5 4.1 Recommended Design Standards ............................................................................................................5 4.2 Drainage/Hydraulics.................................................................................................................................5 4.3 Roadway Alignment .................................................................................................................................6 4.4 Bicycle/Pedestrian Facilities..................................................................................................................... 6 4.5 Parking .....................................................................................................................................................7 4.6 Utilities .....................................................................................................................................................7 4.7 Right‐of‐Way Widths................................................................................................................................8 4.8 Access Management ................................................................................................................................8 4.9 Existing Traffic Volumes ...........................................................................................................................9 4.10 Future Traffic Volumes.............................................................................................................................9 4.11 Signal Warrant Analysis..........................................................................................................................10 4.12 Turn Lane Warrant Analysis ...................................................................................................................11 4.13 Congestion Analysis ...............................................................................................................................12 4.13.1 Level of Service and Queue Analysis Results.....................................................................................13 4.14 Safety Assessment .................................................................................................................................15 4.14.1 High Crash Locations ........................................................................................................................17 4.15 Sight Distances .......................................................................................................................................17 4.16 Environmental and Cultural Resources..................................................................................................18 4.16.1 Flood Zones.......................................................................................................................................18 4.16.2 Wetlands ..........................................................................................................................................18 4.16.3 Historic and Archaeological Resources.............................................................................................19 4.16.4 Hazardous Waste Sites.....................................................................................................................19 4.16.5 Prime Agricultural Soils ....................................................................................................................20 4.16.6 Rare, Threatened or Endangered Species and Significant Communities ..........................................21 4.16.7 Public Lands / LWCF Grant Sites.......................................................................................................21
5.0 ALTERNATIVE INVESTIGATION ..................................................................22 5.1 Development of Alternatives .................................................................................................................22 5.2 Description of Alternatives ....................................................................................................................22

1 October 2009 Page ii
5.2.1 No Build Alternative......................................................................................................................... 22 5.2.2 Signalized Alternative ...................................................................................................................... 22 5.2.3 Signalized Alternative with EB Left Turn Lane ................................................................................. 22 5.2.4 Roundabout Alternative................................................................................................................... 23 5.2.5 Modified Roundabout ...................................................................................................................... 24 5.3 Evaluation of Alternatives ..................................................................................................................... 25
6.0 PREFERRED ALTERNATIVE ....................................................................... 27
LIST OF FIGURES
Figure 1: Project Study Area .................................................................................................................................. 2 Figure 2: Design Criteria......................................................................................................................................... 5 Figure 3: Drainage Features within Project Area................................................................................................... 6 Figure 4: Utilities along VT 2A in the Study Area ................................................................................................... 7 Figure 5: GIS Parcel Mapping within Project Area................................................................................................. 8 Figure 6: AM Peak Hour Turning Movement Volumes .......................................................................................... 9 Figure 7: PM Peak Hour Turning Movement Volumes .......................................................................................... 9 Figure 8: 2010 Design Hour Volumes................................................................................................................... 10 Figure 9: 2020 Design Hour Volumes................................................................................................................... 10 Figure 10: Turn Lane Warrants Summary ............................................................................................................ 12 Figure 11: Level‐of‐Service Criteria for Signalized, Roundabout and Unsignalized Intersections ....................... 12 Figure 12: 2010 LOS Results................................................................................................................................. 14 Figure 13: 2020 LOS Results................................................................................................................................. 14 Figure 14: Contributing Circumstances of Crashes at Study Intersection ........................................................... 15 Figure 15: Direction of Collisions at Study Intersection....................................................................................... 16 Figure 16: VTrans Collision Diagram (2003‐2005 Reported Crashes) .................................................................. 16 Figure 17: High Crash Location Analysis Results.................................................................................................. 17 Figure 18: Wetlands Identified in Project Area by 2002 DH Report .................................................................... 19 Figure 19: Hazardous Waste Sites within Project Area........................................................................................ 20 Figure 20: VT ANR Underground Storage Tank Site List ...................................................................................... 20 Figure 21: Agricultural Soils ................................................................................................................................. 20 Figure 22: Signalized Intersection with Eastbound Left Turn Lane...................................................................... 23 Figure 23: Roundabout Alternative ..................................................................................................................... 24 Figure 24: Modified Roundabout Alternative...................................................................................................... 25 Figure 25: Evaluation Matrix................................................................................................................................ 26

US 2/North Williston Road Scoping Report Page iii
APPENDICES
Appendix A Base Map of Project Area
Appendix B Development of Traffic Volumes
Appendix C Signal Warrant Analysis
Appendix D Crash Data and Analysis
Appendix E VTrans Highway Safety Improvement Program Documentation
Appendix F Turn Lane Warrant Analyses
Appendix G Public Input: Newspaper Articles Regarding Project


US 2/North Williston Road – Scoping Report Page 1
1.0 INTRODUCTION
1.1 Project Background The US 2 / North Williston Road Intersection Scoping Report was commissioned by the Chittenden County Metropolitan Planning Organization (CCMPO) to determine feasible improvement alternatives which address apparent traffic and safety concerns at this location. This intersection is in a historic district of the Village of Williston.
The following is a timeline of events leading up to this study:
Prior to 2001, this intersection was a 2‐way stop controlled intersection (stop controlled for North Williston Road and Oak Hill Road). This intersection became 4‐way stop controlled in 2001. According to a report by Dufresne Henry in 2002 (2002 DH Report), this modification significantly reduced delays for motorists on North Williston and Oak Hill Roads.
A Project Definition Report was conducted by Dufresne‐Henry in 2002 (2002 DH Report). This Report focused on this intersection as well as the US 2/Industrial Avenue/Mountain View Drive intersection. The catalyst for the 2002 DH Report was “a proposal by IBM for expansion of their nearby facilities, which threatened to worsen already poor traffic performance and safety concerns at these two intersections”.
Due to being one of the 50 worst high crash intersections in the state in 2007, this intersection was evaluated by the Vermont Agency of Transportation (VTrans) through the Highway Safety Improvement Program (HSIP). Through this effort and the nature of the accidents at this intersection, VTrans recommended for short term improvements to install a flashing red beacon on the stop sign for the eastbound US 2 approach. This improvement was implemented in the summer of 2008. VTrans then installed a flashing red beacon on the stop sign for the westbound US 2 approach in the Summer of 2009.
RSG is working in collaboration with a project Steering Committee, which was established to oversee the progression of this project. This committee includes the CCMPO, Vermont Agency of Transportation (VTrans), the Town of Williston Public Works and the Town Administration.
The final step in the Project Definition process is the description and evaluation of alternatives. This report provides a technical evaluation of alternatives designed to address the project’s purpose and need. There was significant public input throughout this project.
This study relies upon design standards and analysis procedures documented in the 2000 Highway Capacity Manual,1 Trip Generation,2 A Policy on Geometric Design of Highways and Streets,3 Manual on Uniform Traffic Control Devices (MUTCD),4 Traffic Impact Study Guidelines5 and the Vermont State Design Standards.6
1 Transportation Research Board, National Research Council, Highway Capacity Manual (Washington, DC: National Academy of Sciences, 2000).
2 Institute of Transportation Engineers, Trip Generation 7th Edition (Washington, D.C.: Institute of Transportation Engineers, 2003). 3 American Association of State Highway and Transportation Officials (AASHTO), A Policy on Geometric Design of Highways and Streets, 4th Edition (Washington DC: AASHTO, 2004).
4 American Traffic Safety Services Association (ATSSA), ITE, and AASHTO, Manual on Uniform Traffic Control Devices, 2003 Edition (Washington DC: FHWA, 2003).
5 Vermont Agency of Transportation, Policy and Planning Division, Traffic Research Unit, Traffic Impact Study Guidelines (October 2008). 6 State of Vermont Agency of Transportation, Vermont State Standards (Montpelier: VTrans, 1 July 1997).
1 October 2009 Page 2
1.2 Project Study Area The study area is defined as the intersection of US 2, North Williston Road, and Oak Hill Road and their approaches within stopping sight distance of the intersection.1 US 2 comprises the east/west approaches of this intersection. North Williston Road is the southbound approach, and Oak Hill Road is the northbound approach. All approaches are single lane with stop control on the north and southbound approaches. No curbing is present except along the frontage of the adjacent gas station, the Korner Kwik Stop, on the northwest quadrant.
Land use in the area is a moderately dense mix of residential, institutional, and commercial uses. The Korner Kwik Stop has one access on North Williston Road approximately 70 feet from the intersection and one on US 2 approximately 45 feet west of the intersection (Figure 1). A church is located in the northeast quadrant of the intersection. Gravel drives for church parking are located off both sides of North Williston Road approximately 250 feet north of the intersection. Both southern quadrants are residential. A basemap based on a topographic survey conducted for the 2002 DH Report and revised with recent field observations is included in Appendix A.
Figure 1: Project Study Area
1 Based on A Policy on the Geometric Design of Highways and Streets, 2001. Stopping sight distance is defined as “the distance required for a vehicle, traveling at the design speed, to stop before reaching a stationary object in its path, such as a stopped vehicle.”
US 2/North Williston Road – Scoping Report Page 3
2.0 PURPOSE & NEED Articulating a clear Purpose and Need Statement is a critical step in the project development process. The Purpose and Need Statement provides a summary of the issues related to the project and facilitates the selection of a reasonable, prudent, and practicable alternative. To focus the direction of this project and with input from the project steering committee, the following purpose and need statement was developed.
2.1 Purpose The purpose of this project is to develop intersection improvements which will improve the safety and mobility for all modes of transportation, including motor vehicles, bicycles, and pedestrians. These improvements must address the needs identified below.
2.2 Need During peak hours this intersection operates under congested conditions and there are
significant queues on the side approaches. Current traffic volumes meet multiple signal warrants, indicating that a more comprehensive traffic solution should be evaluated.
This intersection has been classified by VTrans as a High Crash Location indicating the need to address safety concerns in this location.
The intersection is located in historic Williston Village. There are a number of pedestrian destinations in proximity to the intersection resulting in the need to maintain pedestrian access and safety in this location.

1 October 2009 Page 4
3.0 PUBLIC PARTICIPATION Guided by significant public interest, a number of meetings were held during the development of this Scoping Report. The following is a summary of meetings held for this project. Appendix G includes meeting agenda, meeting notes, and newspaper articles regarding these meetings.
1. Alternatives Presentation Public Meeting #1 January 12, 2009
This meeting presented alternatives for the intersection. There were proponents of all alternatives, therefore it was determined more public input be gathered.
2. Historic & Architectural Advisory Committee February 2, 2009
Project presented to Historical and Architectural Advisory Committee to gather comments, particularly as it pertains to the historic setting of the intersection.
3. Planning Commission Meeting February 17, 2009
Project details discussed with the Planning Commission.
4. Selectboard Meeting #2 February 23, 2009
Project alternatives and input from Historic and Architectural Committee and Planning Commission meetings were presented to the Selectboard. Based on completed surveys, public sentiment was in favor of the No‐Build alternative.
5. Selectboard Meeting # 3 March 23, 2009
Based on the technical assessment and public sentiment, the Town Selectboard suggested the Roundabout alternative be selected as the preferred alternative. Following this meeting, a petition was circulated in opposition of this alternative.
6. Neighborhood Meeting at Williston Federated Church April 28, 2009
Meeting where local residents discussed the project.
7. Public informational Meeting May 11, 2009
Due to the perception of roundabouts not being perceived as a safe alternative, this meeting gave background information on roundabouts and documentation regarding national research and studies on roundabouts, as well as specific information on the roundabout alternative for the US 2/North Williston Road intersection.

US 2/North Williston Road – Scoping Report Page 5
4.0 EXISTING & FUTURE CONDITIONS
4.1 Recommended Design Standards Figure 2 identifies design parameters which have been established for designing transportation alternatives for this intersection1.
Figure 2: Design Criteria US2 North Williston Rd Oak Hill Rd Source
Functional Classification Urban Minor Arterial Urban Collector Urban CollectorJurisdiction State Class II town highway Class II town highway
AADT 4100 to east, 11500 to west (yr 2006) 4400 (yr 2005) 2900 (yr 2005)Design Vehicle WB-67 WB-50 WB-50Posted Speed 35 mph 35 mph 40 mph Design Speed 40 mph 40 mph 45 mph
Stopping Sight Distance 275-325 ft 275 ft 325 ft 1Corner Sight Distance 440 ft 440 ft 495 ft 1
Roadway Slope approximately +2% headed west of intersection relatively flat approximately -6.5%
toward intersection
Travel Lane Width Minimum 10-12 ft 9-11 ft 9-11 ft 2Existing 12 ft 12 ft 12 ft
Shoulder Width Existing 1-4 ft 2-4 ft 3-5 ft
Minimum w/ Bicycles 4 ft 4 ft 4 ft 3Minimum w/o Bicycles 2 ft 2 ft 2 ft 2
Minimum unpaved 1 ft 1 ft 1 ft 2
Clear Zone With Vertical Curb
(horizontal offset from curb face)1.5 ft.* 1.5 ft.* 1.5 ft.* 4
Without Vertical Curb 12-14 ft to east, 14-16 ft to west 12-14 ft 12-14 ft 4*3 ft. at intersection
4.2 Drainage/Hydraulics The project area is served by a closed storm drain system as well as some surface flow. Water from the project area flows to a tributary of the Allen Brook, northwest of the intersection, which is listed by the Agency of Natural Resources as an impaired watershed. An impaired watershed is one that does not meet one or more of Vermont’s Water Quality Standards. The delineation of impaired watersheds assists State agencies’ ability to focus efforts on higher risk areas of impaired watersheds.
The need for a stormwater permit will depend on the selected alternative. Because the project area is within an impaired watershed, there will be special rules that may need to be complied with in regards to determining the level of stormwater permitting. For example, if an operational stormwater permit is needed, an
1 Based on information contained within the VTrans Vermont State Design Standards. Chapter 4 and Chapter 6, 1997 and from AASHTO, A Policy on Geometric Design of Highways and Streets, 2004, and the Vermont State Design Standards (October 1997). Assume terrain is rolling within the project area.
Looking north from southwest corner of intersection. Note headwall in depression, bottom‐right of photo.

1 October 2009 Page 6
individual permit will likely be needed (versus a general permit) because the project area is within an impaired watershed. The assessment for determining the type of construction permit, if needed, will take this into consideration as well. In addition, treatment requirements may need to be incorporated into the project. Once a preferred alternative is selected and the design phase is implemented, VT ANR should be contacted to discuss the project.
There is a small depression at the southwest corner of the intersection, at the inlet of the culvert crossing Oak Hill Road. Figure 3 shows drainage features within the project area. To the west of the area shown in Figure 3, there is a 36‐inch concrete box culvert under US 2, which outlets to the wetland to the northwest of the intersection.
Figure 3: Drainage Features within Project Area
4.3 Roadway Alignment All approaches to the project intersection are generally straight. The Oak Hill Road and North Williston Road approaches are skewed approximately 17 degrees from perpendicular to US 2. Vertically, US 2 and North Williston Road are relatively flat. Oak Hill Road has gently rolling terrain.
4.4 Bicycle/Pedestrian Facilities There is a sidewalk on the north side of US 2 within the project area. Approximately 380 feet west of the intersection there is a sidewalk continuing west on the southern side of US 2. The 2002 DH Report states that the Town intends to extend the sidewalk on the southern side of US 2 east to this intersection and then down Oak Hill Road. This extension has not been completed at this time.
There is also a sidewalk on the east side of North Williston Road for approximately 180 feet. North of the Korner Kwik Stop entrance, there is a sidewalk continuing north on the western side of North Williston Road.

US 2/North Williston Road – Scoping Report Page 7
4.5 Parking There is no on‐street parking within the study area.
4.6 Utilities The following utilities were identified within the study area:
Overhead power, telephone, and cable on the southern side of US 2 and the eastern sides of North Williston Road and Oak Hill Road;
Storm drainage includes culverts, headwalls, and a catch basin as shown below in Figure 4.
Underground gas, sanitary sewer, and water lines. Two fire hydrants are located along US 2, one to the east of the intersection and one to the west. There are a number of water valves, gas valves, and “cp test” stations (valves installed on varying utilities in order to protect certain underground structures against corrosion) in and around the intersection, as well as gas tanks and related materials at the Korner Kwik Stop.
The identification and location of these utilities is based on field observations and a topographic survey. As a number of the utilities could be affected during the construction of any planned improvements, additional investigation may be required to precisely locate the affected utilities and/or to proceed with necessary permitting.
Figure 4: Utilities along VT 2A in the Study Area
Overhead utilities are prevalent within the project area.

1 October 2009 Page 8
4.7 Right‐of‐Way Widths The 2002 DH Report identified US 2 as having a 4‐rod (66 foot) right‐of‐way, and side roads having a 3‐rod (49.5 foot) right‐of‐way, with tax maps showing a flared section of right‐of‐way on the southeast quadrant near the telephone utility structure. Based on GIS 2005 parcel maps, US 2 does appear to have a 4‐rod right‐of‐way, North Williston Road appears to have a 3‐rod (49.5 foot) right‐of‐way, and Oak Hill Road appears to have a 5‐rod (82.5 foot) right‐of‐way in this area, likely a remnant of the I‐89 overpass construction. As shown on Figure 5, the Oak Hill Road right‐of‐way flares in width as it approaches the intersection with US 2.
Figure 5: GIS Parcel Mapping within Project Area
4.8 Access Management The VTrans Access Management Guidelines were reviewed in reference to the locations of the Korner Kwik Stop driveways. These guidelines state that 30 to 40 feet of width shall be used for any two‐way access when single unit vehicles volume exceeds 5 in the peak hour. The two Korner Kwik Stop entrances are each wider than this, at approximately 55 feet in width each. The distance between the intersection and access drive for “isolated corner properties” (i.e. properties which cannot meet standard corner clearance due to conflicting land use or other factors as listed in the guidelines) for intersections without restrictive medians should be 230 feet for full access movements based on these guidelines. There is currently only 45‐70 feet between the intersection and drives for the Korner Kwik Stop. Therefore, the current width and location of the two Korner Kwik Stop driveways do not meet current access management guidelines.

US 2/North Williston Road – Scoping Report Page 9
4.9 Existing Traffic Volumes A 12‐hour turning movement count was conducted by VTrans at the study intersection on August 27 and August 28, 2007. Figure 6 and Figure 7 show unadjusted traffic volumes for the AM and PM peak hours during this count.
Figure 6: AM Peak Hour Turning Movement Volumes
AM Peak Hr7:15 AM - 8:15 AM 193 101 46
53 2987 15549 16
142 134 29
US2
North Williston Road
Oak Hill Road pedestrians
US2
Figure 7: PM Peak Hour Turning Movement Volumes
PM Peak Hr4:45 PM - 5:45 PM 74 118 59
214 42205 113131 25
87 109 16
US2
US2
North Williston Road
Oak Hill Road
4.10 Future Traffic Volumes Vermont Agency of Transportation (VTrans) August 27 and August 28, 2007 turning movement counts were obtained for the project intersection and adjusted to determine Design Hour Volumes (DHV1) for the 2010 and 2020 weekday AM and PM peak hours. Counts were adjusted based on nearby continuous counter data from station P6D061, located on US 2 in Williston 0.2 miles east of the Industrial Avenue intersection. Stations P6D129 on I‐189 in South Burlington, P6D129 on VT2A in Williston, and P6D091 on I‐89 in South Burlington were also taken into consideration in determining the adjustment factor. The adjustment factor to convert the peak hour turning movement count to a DHV was found to be 1.18. A yearly growth factor of 0.56% was assumed, based on historical traffic data of continuous counter P6D061.
The AM and PM peak hour volumes were found to occur between 7:15‐8:15AM and 4:45‐5:45PM, respectively. The following figures show 2010 and 2020 AM and PM design hour volumes. Detailed volumes and adjustments can be found in Appendix B.
1 The DHV is the 30th highest hour of traffic for the year and is typically used as the design standard in Vermont.

1 October 2009 Page 10
Figure 8: 2010 Design Hour Volumes
231 121 55 88 141 70
63 35 256 50
104 c11 185 245 j11 135
59 19 157 30
170 160 35 104 130 19
Oak Hill Road Oak Hill Road
US
2
North Williston Road
US
2
PM 2010
US
2
US
2
North Williston Road
AM 2010
Figure 9: 2020 Design Hour Volumes
244 128 58 93 149 75
67 37 270 53
110 c11 196 259 j11 143
62 20 166 32
179 169 37 110 138 20
Oak Hill Road Oak Hill Road
US
2
North Williston Road
US
2
PM 2020
US
2
US
2
North Williston Road
AM 2020
4.11 Signal Warrant Analysis A signal warrant analysis is a set of tests that are performed to determine whether a traffic signal would significantly improve operations, mobility, and safety at an intersection. There are a total of 8 warrants:
1) Eight‐Hour Vehicular Traffic Warrant: when a large amount of intersecting traffic occurring over an 8‐hour period is the principal reason for installing a traffic signal, or where excessive delays occur on minor approaches to an intersection.
2) Four‐Hour Vehicular Traffic Warrant: when a large amount of intersecting traffic occurring over a 4‐hour period is the principal reason for installing a traffic signal.
3) Peak Hour Warrant: when the minor‐street traffic suffers unduly delay when entering or crossing the major‐street during the average peak hour is the principal reason for installing a traffic signal.
4) Pedestrian Volume Warrant: when the traffic volumes on a major street are so heavy that pedestrians experience excessive delays.
5) School Crossing Warrant: when school children crossing a major street are the principal reason for installing a traffic signal.
6) Coordinated Signal System Warrant: when maintaining proper platooning of vehicles is the principal reason for installing a traffic signal.
7) Crash Experience Warrant: when the severity and frequency of accidents is the principal reason for installing a traffic signal.

US 2/North Williston Road – Scoping Report Page 11
8) Roadway Network Warrant: when the concentration and organization of traffic flow is the principal reason for installing a traffic signal.
Warrants were analyzed using a 12‐hour turning movement count at the project area intersection conducted on August 27 and August 28, 2007 by VTrans. Traffic volumes from other permitted but not yet built developments were not included.
Based on the information gathered for this traffic study, the following warrants are met:
Eight‐Hour Vehicular Traffic Warrant
Four‐Hour Vehicular Traffic Warrant
Peak Hour Warrant (However, this signal warrant shall be applied only in unusual cases. Such cases include, but are not limited to, office complexes, manufacturing plants, industrial complexes, or high‐occupancy vehicle facilities that attract or discharge large numbers of vehicles over a short time.)
A signal warrant analysis is considered advisory only. This means that simply meeting a warrant may not be sufficient cause for installing a traffic signal. For example, meeting the peak hour warrant is usually not sufficient in and of itself to warrant installing a traffic signal. Typical experience in Vermont shows that more than one warrant should be met to justify investment in a traffic signal. This condition is met at the US 2/North Williston Road/Oak Hill Road intersection.
A 2007 memo summarizing an investigation by the VTrans Traffic Operations, Highway Safety Improvement Program also confirmed that the 8‐hour vehicular traffic warrant, 4‐hour vehicular volume, peak hour volume, and crash experience warrants are met.
It is important to note that this analysis assumed that the intersection lies in a built‐up area of an isolated community having a population of less than 10,000. This assumption affects the outcome of the results. If this assumption was not made, the eight hour and four hour warrants would not be met and the peak hour warrant may be met with further analysis.
The details of the signal warrant analysis are provided in Appendix C.
4.12 Turn Lane Warrant Analysis Using the scenario volumes, we conducted a turn lane warrant analysis to establish the necessity of adding turn lane(s) at the intersection. Using Harmelink’s methodology for unsignalized intersections, we found that a northbound left turn lane is warranted in all PM peak hour scenarios (Figure 10).

1 October 2009 Page 12
Figure 10: Turn Lane Warrants Summary
Eastbound Westbound Eastbound WestboundAM Peak Hour
2010 N N N N2020 N N N N
PM Peak Hour2010 Y N N N2020 Y N N N
US2 / North Williston Road / Oak Hill Rd
Left Turn Lane Right Turn LaneIs a turn lane warranted?
Turn warrants were further verified by also using a second method developed by Kikuchi and Chakroborty (1991), which modifies the Harmelink equation to correct errors in its application of queuing theory.1 This method provided identical results to the Harmelink method.
The VTrans methodology as defined in the Pavement Marking Placement Guide2 was used for calculating the required storage lengths for the warranted eastbound turn lane. At an unsignalized intersection, the northbound left turn lane should have 225 feet of storage. 3
The detailed turn warrant analysis is included in Appendix F.
4.13 Congestion Analysis Level‐of‐service (LOS) is a qualitative measure describing the operating conditions as perceived by motorists driving in a traffic stream. LOS is estimated using the procedures outlined in the 2000 Highway Capacity Manual. In addition to traffic volumes, key inputs include the number of lanes at each intersection and the traffic signal timing plans. The LOS results are based on the existing lane configurations and control types (signalized or unsignalized) at each study intersection.
The 2000 Highway Capacity Manual defines six qualitative grades to describe the level of service at an intersection. Level‐of‐Service is based on the average control delay per vehicle. Figure 11 shows the various LOS grades and descriptions for signalized, roundabout, and unsignalized intersections.
Figure 11: Level‐of‐Service Criteria for Signalized, Roundabout and Unsignalized Intersections
Unsignalized Signalized/Roundabout LOS Characteristics Total Delay (sec) Total Delay (sec) A Little or no delay ≤ 10.0 ≤ 10.0 B Short delays 10.1‐15.0 10.1‐20.0 C Average delays 15.1‐25.0 20.1‐35.0 D Long delays 25.1‐35.0 35.1‐55.0 E Very long delays 35.1‐50.0 55.1‐80.0 F Extreme delays > 50.0 > 80.0

US 2/North Williston Road – Scoping Report Page 13
The delay thresholds for LOS at signalized and unsignalized intersections differ because of the driver’s expectations of the operating efficiency for the respective traffic control conditions. According to HCM procedures, an overall LOS cannot be calculated for two‐way stop‐controlled intersections because not all movements experience delay. In signalized and all‐way stop‐controlled intersections, all movements experience delay and an overall LOS can be calculated.
The VTrans policy on level of service is:
Overall LOS C should be maintained for state‐maintained highways and other streets accessing the state’s facilities
Reduced LOS may be acceptable on a case‐by‐case basis when considering, at minimum, current and future traffic volumes, Essential Emergency Response routing and maintenance accessibility, delays, volume to capacity ratios, crash rates, negative impacts as a result of improvement necessary to achieve LOS C, and the effects of economic suppression due to inadequate infrastructure and subsequent displaced development.
LOS D should be maintained for side roads with volumes exceeding 100 vehicles/hour for a single lane approach (150 vehicles/hour for a two‐lane approach) at two‐way stop‐controlled intersections. No LOS criteria are in effect for volumes less than these.
4.13.1 Level of Service and Queue Analysis Results The Highway Capacity Manual congestion reports within Synchro (v6), a traffic analysis software package from Trafficware, were used to assess congestion of the unsignalized and signalized alternatives at the project intersection. SimTraffic was used to asses queuing at the intersection for the unsignalized and signalized alternatives. SIDRA (v3) was used for all roundabout analyses.
Figure 12 and Figure 13 present the LOS and queue results during the AM and PM weekday peak hours, respectively, for the following scenarios:
No Build
Signalized
Signalized with additional eastbound US 2 left turn lane
Single‐lane roundabout
1 Larson, Larry & Fred L. Mannering, Method for Prioritizing Intersection Improvements, January 1997, Washington State Transportation Commission, Department of Transportation and U.S. Department of Transportation, Federal Highway Administration, 2 June 2003, <http://www.wsdot.wa.gov/PPSC/Research/CompleteReports/WARD413_1IntersectionImprove.pdf>.
2 Department of Planning and Preconstruction, Traffic and Safety Division, Pavement Marking Placement Guide (Vermont Agency of Transportation: October 1991) 20.
3 The following equation was used to calculate the required storage lengths: Storage Length = Volume of Left Turns per hour / 60 cycles per hour * 2 * 25’ vehicle length. This is the storage lane length and does not include the taper or centerline shift distances.

1 October 2009 Page 14
Figure 12: 2010 LOS Results
LOSdegree utiliz.
Avg. Queue (veh.)
LOSDelay (sec)
v/cAvg. Queue (veh.)
LOSDelay (sec)
v/cAvg. Queue (veh.)
LOSDelay (sec)
v/cAvg. Queue (veh.)
Overall C 0.823 ‐ A 9 0.5 ‐ B 13 0.6 ‐ A 10 ‐ ‐EB Left ‐ ‐ ‐ ‐ ‐ ‐ ‐ B 11 0.2 1 ‐ 8 ‐ ‐EB C 0.4 7 B 13 0.5 5 A 10 0.2 3 A 8 0.3 <1WB C 0.5 8 B 13 0.5 6 C 23 0.7 5 A 9 0.3 1NB C 0.7 15 A 6 0.5 10 B 13 0.6 10 B 10 0.4 2SB C 0.7 20 A 6 0.4 6 A 10 0.5 6 B 12 0.6 3
LOSdegree utiliz.
Avg. Queue (veh.)
LOSDelay (sec)
v/cAvg. Queue (veh.)
LOSDelay (sec)
v/cAvg. Queue (veh.)
LOSDelay (sec)
v/cAvg. Queue (veh.)
Overall F 0.8 ‐ B 14 0.8 ‐ A 10 0.5 ‐ B 12 ‐ ‐EB Left ‐ ‐ ‐ ‐ ‐ ‐ ‐ A 7 0.5 4 ‐ 13 ‐ ‐EB F 1.2 >100 B 15 0.8 24 A 7 0.4 5 B 13 0.8 7WB C 0.4 4.3 A 6 0.2 5 B 13 0.5 5 B 10 0.3 1NB C 0.5 5 B 19 0.7 9 B 12 0.6 5 B 15 0.5 2SB C 0.6 5 B 16 0.6 7 B 12 0.5 5 A 9 0.4 1
No Build
Signal & EB LT TL RoundaboutNo Build
2010 AM Peak HourSignal & EB LT TL RoundaboutSignal
2010 PM Peak HourSignal
Figure 13: 2020 LOS Results
LOSDelay (sec)
degree utiliz.
Avg. Queue (veh.)
LOSDelay (sec)
v/cAvg. Queue (veh.)
LOSDelay (sec)
v/cAvg. Queue (veh.)
LOSDelay (sec)
v/cAvg. Queue (veh.)
Overall C ‐ ‐ ‐ A 9 0.5 ‐ B 13 0.6 ‐ B ‐ ‐EB Left C 18 0.5 4 B 14 0.5 5 B 13 0.3 1 A 0.3 <1EB ‐ ‐ ‐ ‐ ‐ ‐ ‐ ‐ B 12 0.2 3 ‐ ‐ ‐WB C 18 0.5 6 B 14 0.5 8 C 27 0.7 7 A 0.4 1NB D 27 0.7 9 A 7 0.5 12 A 10 0.6 9 B 0.5 2SB D 29 0.8 11 A 6 0.4 6 A 8 0.4 6 B 0.6 3
LOSDelay (sec)
degree utiliz.
Avg. Queue (veh.)
LOSDelay (sec)
v/cAvg. Queue (veh.)
LOSDelay (sec)
v/cAvg. Queue (veh.)
LOSDelay (sec)
v/cAvg. Queue (veh.)
Overall F 89.3 0.9 ‐ B 17 0.8 ‐ B 10 0.5 ‐ B ‐ ‐EB Left ‐ 170 ‐ ‐ ‐ 16 ‐ ‐ A 8 0.5 4 ‐ ‐ ‐EB F 170 1.3 >100 B 16 0.8 37 A 7 0.4 6 B 0.8 7WB C 17 0.5 4 A 5 0.2 5 B 14 0.5 5 B 0.4 1NB C 20 0.6 5 C 26 0.8 22 B 13 0.6 6 B 0.5 2SB C 22 0.6 5 B 20 0.7 11 B 12 0.6 6 A 0.4 1
No Build Signal & EB LT TL Roundabout
2020 AM Peak HourSignal Signal & EB LT TL Roundabout
2020 PM Peak Hour
No Build
Signal
In summary, based on our traffic congestion analyses of the US 2/North Williston Road/Oak Hill Road intersection, the following are key notes regarding the LOS and queuing results for the various scenarios:
No Build: For the 2020 AM peak hour, the northbound and southbound approaches are expected to operate at LOS D. For the 2010 and 2020 PM peak hour, the overall and eastbound approach is expected to operate at LOS F, with very significant queues on the eastbound approach.

US 2/North Williston Road – Scoping Report Page 15
The signalization alternative (no eastbound left turn lane) operates at LOS C or better for all approaches. The expected queues for the eastbound approach during the PM peak hour are significant (greater than 20 vehicles) for both 2010 and 2020.
The signalization with eastbound left turn lane alternative operates at LOS C or better for all scenarios for all approaches, with shorter queues (less than 10 vehicles) than the signalization alternative without turn lanes.
The roundabout alternative operates at LOS B or better for all scenarios with relatively minor queuing for all approaches.
4.14 Safety Assessment VTrans maintains a statewide database of all reported crashes along all state highways and federal aid road segments.1 A reportable crash is a collision which results in either: property damage exceeding $1,000, personal injury, or a fatality. Crash histories were collected from VTrans (2003‐2007) for the roads that comprise the study intersection.
Based on VTrans records, 25 crashes occurred between 2003 and 2007 within the stopping sight distances of the study intersection. Crash data and analysis are provided in Appendix D. Figure 14 and Figure 15 indicate circumstances and direction of accidents. The following are a few key notes about these accidents:
44% of crashes involved through movements only (broadside).
40% disregarded traffic signs or markings.
Inclement weather does not appear to be a significant factor in crashes along this road segment as 84% of crashes occurred when the weather was clear or cloudy.
All but one of the crashes are located at the exact milemarker of the intersection. This implies possible safety issues associated with the intersection.
Figure 14: Contributing Circumstances of Crashes at Study Intersection
Contributing Circumstance to Crashes No. of AccidentsDisregarded traffic signs/signals/markings 10Driving too fast for conditions 5Inattention 5Failed to yield right of way 4Followed too closely 2Other improper action 2Fatigued/asleep 1Exceeded speed limit 1Note: an accident may have >1 circumstance
1 This data is exempt from Discovery or Admission under 23 U.S.C. 409.

1 October 2009 Page 16
Figure 15: Direction of Collisions at Study Intersection
Direction of Accident No. of AccidentsNo turns, through moves only, broadside 11Rear end 4Single vehicle crash 3Unknown/other 3Turn and thru, same direction 2Same direction sideswipe 2
Figure 16 below shows a collision diagram prepared by VTrans staff for reported crashes between 2003 and 2005. The diagram visually depicts the location and nature of each crash and shows that a majority of the crashes shown (38%) involve collisions between eastbound and southbound vehicles.
Figure 16: VTrans Collision Diagram (2003‐2005 Reported Crashes)

US 2/North Williston Road – Scoping Report Page 17
4.14.1 High Crash Locations In order to be classified as a High Crash Location (HCL), an intersection or road section (0.3 mile section) must meet the following two conditions:
It must have at least 5 crashes over a 5‐year period.
The actual crash rate must exceed the critical crash rate.
RSG analyzed the US 2/North Williston Road/Oak Hill Road intersection to determine if it was a high crash location. Roadway sections were not evaluated. Based on 2003‐2007 VTrans crash data, this intersection is an HCL. Results of analysis are shown in Figure 17.
Figure 17: High Crash Location Analysis Results
US2 / North Williston Rd / Oak Hill RdAnalysis Type: IntersectionRoad Classification: Minor Arterial (u)/Urban Collector (u)Years of data: 2002‐2006Total Crashes: 25Total AADT of all approaches: 22900Actual Rate: 1.20Critical Rate: 0.77Actual/Critical Ratio: 1.55High Crash Location: Yes
As previously stated, this intersection was investigated by VTrans through the HSIP. A memo from VTrans, included in Appendix E, stated accident patterns show that a majority of 2003‐2005 crashes were right angle crashes. In addition, a number of crashes within this timeframe indicated that a number of vehicle drivers did not stop for stop signs.
As a result of VTrans investigations it was recommended that for short term improvements a flashing beacon be installed on the US 2 eastbound stop sign, and then a year later this same recommendation was made for the US 2 westbound stop sign. Both these have now been implemented and will hopefully improve safety at this intersection by making the intersection and stop sign more visible to eastbound and westbound vehicles.
4.15 Sight Distances Stopping sight distance is the distance required for a vehicle, traveling at the design speed, to stop before reaching a stationary object in its path, such as a stopped vehicle. Intersection (or corner) sight distance is the distance required for drivers to stop or adjust their speed, as appropriate, to avoid colliding with a potentially conflicting vehicle leaving an intersection.
The provision of adequate stopping sight distance is critical for safe operations. The 2004 Policy on Geometric Design of Highways and Streets1 states that, “[i]f the available sight distance for an entering or crossing vehicle is at least equal to the appropriate stopping sight distance for the major road, then drivers have sufficient sight distance to anticipate and avoid collisions.” The 2004 Policy on Geometric
1 American Association of State Highway and Transportation Officials, A Policy on Geometric Design of Highways and Streets, Fifth Edition (Washington D.C.: American Association of State Highway and Transportation Officials, 2004), pg. 651.

1 October 2009 Page 18
Design of Highways and Streets1 goes on to state that, “intersection sight distances that exceed stopping sight distances are desirable along the major road.”
In the field, the available stopping sight distance is measured from a point 3.5 feet above the road surface of the major road approach lanes to a point 2.0 feet above the road surface at the stop bar of the minor street approach. 2 The available intersection sight distance is measured from a point 3.5 feet above the road surface at a point on the minor road approach 14.5 feet from the stop bar to a point 3.5 feet above the road surface of the major road approach lanes. 3 The minimum stopping sight distances are calculated based on factors such as design speed, response times, and grades.
As indicated in the 2002 DH Report and confirmed in the field, this intersection meets the criteria for minimum stopping sight distance. However, due to the vertical rise west of the intersection, pavement markings at the intersection are difficult to see in advance of the intersection for eastbound vehicles. In addition, a number of accidents listed in the HSIP investigations indicate vehicle drivers not stopping for stop signs. Therefore, the location of the stop signs should be evaluated to determine if there are more appropriate locations for these signs at all approaches to make them more visible.
4.16 Environmental and Cultural Resources The study area was examined for potential environmental, natural, and cultural resource impacts based on site assessments, existing GIS resource mapping, and previous site investigations. This preliminary resource assessment should be revisited during the preliminary and final design stage.
4.16.1 Flood Zones The study intersection is not within a 100‐year or 500‐year floodplain, according to CCRPC flood hazard data which is based on FEMA Digital Flood Insurance Rate Map data. However, there is a 100‐year floodplain approximately 500 feet to the north and east of the intersection.
4.16.2 Wetlands There are no identified Class 1 or Class 2 wetlands identified on GIS mapping available from the Vermont ANR. However, the 2002 DH Report states that William D. Countryman identified wetlands which are contiguous to a larger Class 2 wetland (see Figure 18 below). Because the field‐identified wetlands are contiguous to a Class 1 or Class 2 wetland, they should be considered during the assessment of alternatives.
1 ibid, pg. 651. 2 ibid, pg. 127. 3 ibid pg. 653,657, 659.

US 2/North Williston Road – Scoping Report Page 19
Figure 18: Wetlands Identified in Project Area by 2002 DH Report
4.16.3 Historic and Archaeological Resources Werner Archaeological Consulting (WAC) provided a historic and archeological assessment for the 2002 DH Report summarizing potential impacts to historical and archaeological resources. This report states that this intersection is located in a State‐designated Historic District. In the immediate project area, the historic structures include the Williston Federated Church and the Bradish House on the southwest quadrant. Depending on geometries of possible alternatives, any impacted yards of historic structures will need to be investigated further.
4.16.4 Hazardous Waste Sites According to the Vermont Agency of Natural Resources’ Environmental Interest Locator (EIL) the following is a summary of hazardous sites within the project area. House number 779 referred to in Figure 19 is approximately 300 feet east of the project area. Figure 20 provides a summary of underground storage tanks located within the study area site, based on the Vermont Agency of Natural Resources Environmental Interest Locator.

1 October 2009 Page 20
Figure 19: Hazardous Waste Sites within Project Area
Location Hazardous Description Site Number or Facility ID (SN or F ID) Korner Kwik Stop Hazardous waste site 880188, 951822 (SN) House No. 779 Underground storage tank 130 (F ID)
Figure 20: VT ANR Underground Storage Tank Site List
Facility ID Facility Name Facility Address Permit Issued Permit Expires
130 Korner Kwik Stop 765 Williston Road 06‐05‐2007 04‐01‐2012
4.16.5 Prime Agricultural Soils The soils within the project area are not identified by the Natural Resource Conservation Service as prime agricultural soils. However, the soils at the study area are considered to be either statewide or statewide (b). Statewide indicates that these soils are of statewide importance for the production of food, feed, fiber, forage, and oilseed crops. Soils identified as Statewide (b) have a wetness limitation that may be difficult or unfeasible to overcome. Areas of this soil map unit don’t qualify as Statewide if artificial drainage is not feasible.
Figure 21: Agricultural Soils

US 2/North Williston Road – Scoping Report Page 21
4.16.6 Rare, Threatened or Endangered Species and Significant Communities Based on the latest assessment released by the Vermont Department of Fish and Wildlife (2006), there are no rare, threatened or endangered species in the study area. There are no Natural Communities or rare animal communities within or adjacent to the study area.
4.16.7 Public Lands / LWCF Grant Sites There are no public land areas within or adjacent to the study area according to the 2004 Public Lands Extract from the Vermont Conserved Lands Database. The latest list of Land and Water Conservation Fund Program (LWCF) grant sites was also reviewed. No such sites are listed in or near the project area.

1 October 2009 Page 22
5.0 ALTERNATIVE INVESTIGATION
5.1 Development of Alternatives Through the course of the scoping process, input was gathered from the public, the project Steering Committee, Town officials, and VTrans. Based on this input, the following alternatives were evaluated in this Study:
No Build
Signalized intersection with eastbound left turn lane
Single‐lane Roundabout
Single‐lane Roundabout with limited truck turning movements (see description below)
Signalization without an eastbound left turn lane was evaluated, but due to the resulting significant eastbound queues described in the previous section, this alternative is not included for evaluation.
5.2 Description of Alternatives
5.2.1 No Build Alternative The No Build scenario assumes that no changes would be made to the US 2/North Williston Road intersection. As a result, existing roadway and circulation conditions continue, subject to increased background traffic. If this alternative is chosen as the preferred alternative, further investigation in this study area would come to an end. See Figure 1 for an illustration of existing/No Build alternative.
5.2.2 Signalized Alternative This alternative involves installing a traffic signal at this intersection. Incidental work would also include additional signage and pavement markings. Signalization without an eastbound left turn lane was evaluated, but due to the resulting significant eastbound queues described in the previous section, this alternative is not included for evaluation.
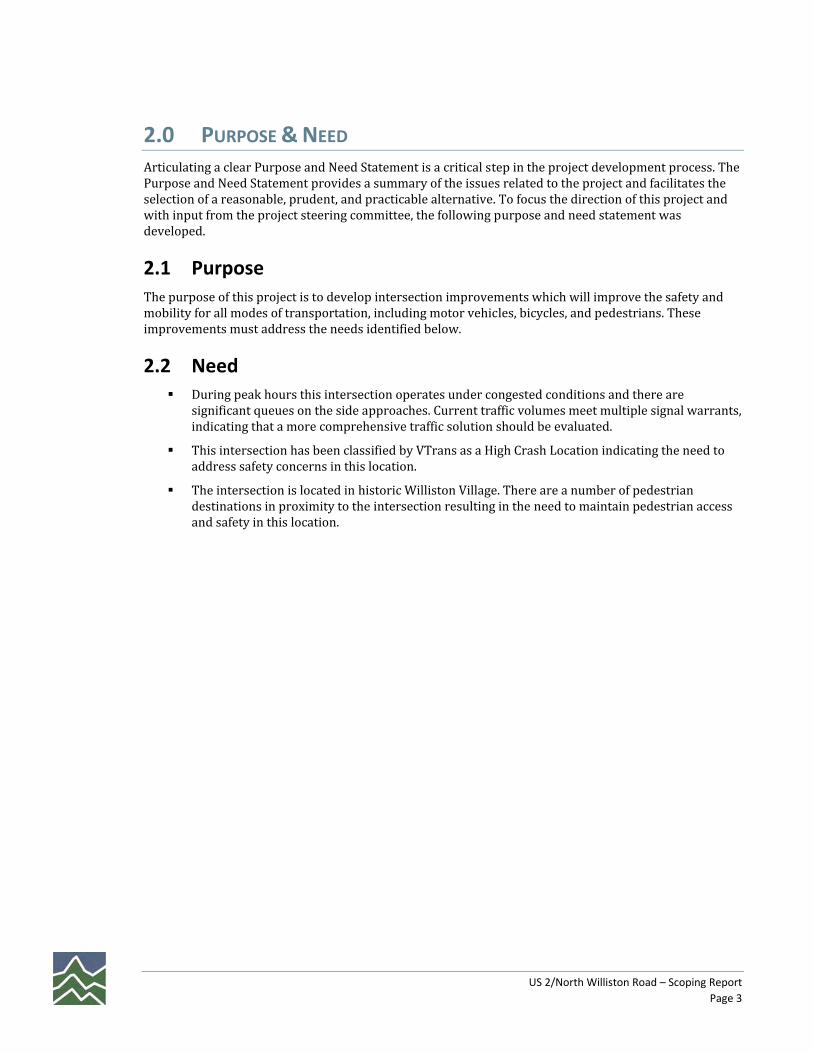
5.2.3 Signalized Alternative with EB Left Turn Lane This alternative involves installing a traffic signal at this intersection and constructing an eastbound left turn lane, as shown in Figure 22. A left turn lane warrant analysis and resulting queues from analysis of this intersection as a signalized alternative indicate an eastbound left turn lane is warranted and would result in a significantly shorter eastbound queue.
US 2/North Williston Road – Scoping Report Page 23
Figure 22: Signalized Intersection with Eastbound Left Turn Lane
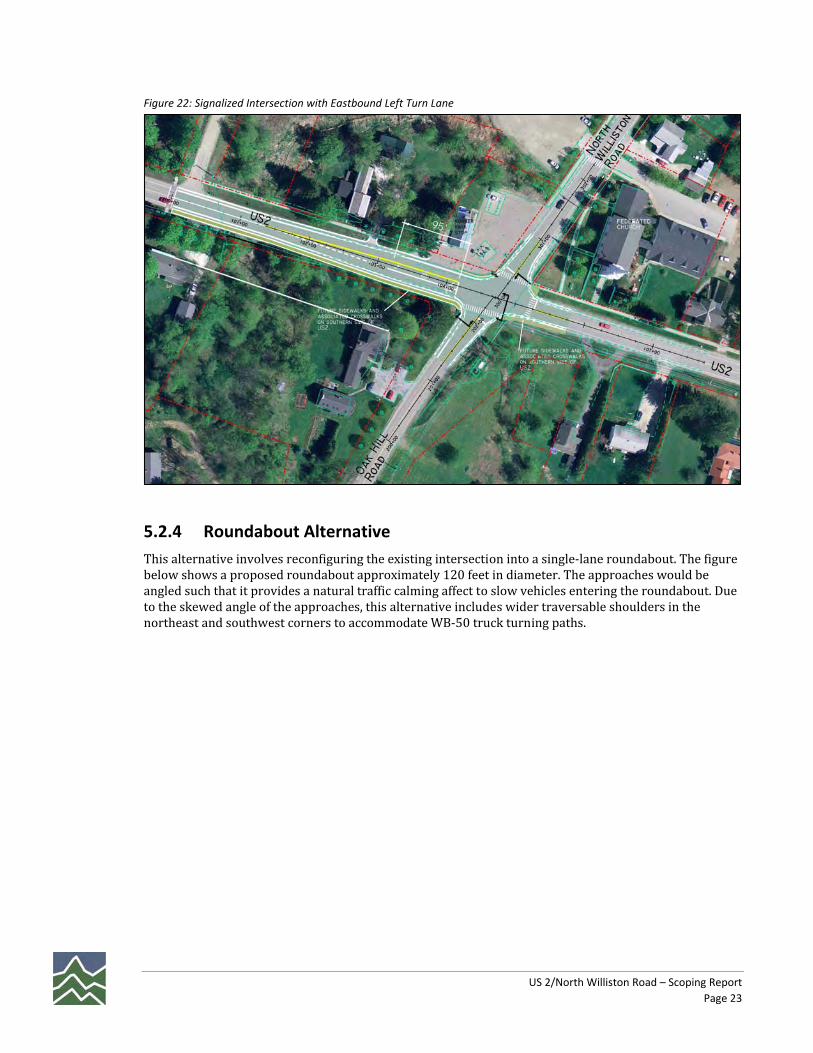
5.2.4 Roundabout Alternative This alternative involves reconfiguring the existing intersection into a single‐lane roundabout. The figure below shows a proposed roundabout approximately 120 feet in diameter. The approaches would be angled such that it provides a natural traffic calming affect to slow vehicles entering the roundabout. Due to the skewed angle of the approaches, this alternative includes wider traversable shoulders in the northeast and southwest corners to accommodate WB‐50 truck turning paths.

1 October 2009 Page 24
Figure 23: Roundabout Alternative
5.2.5 Modified Roundabout The Modified Roundabout alternative is similar to the alternative above; except that trucks on US 2 turning right must turn from inside the roundabout. That is, a westbound US 2 truck would need to circle ¾ of the way around the roundabout to turn right onto North Williston Road. The arrows shown on the figure below show this particular movement. The objective of this modification is to reduce the amount of area consumed by the roundabout. In order to ensure that trucks move in the intended manner for this alternative, additional signing would be needed to alert truck drivers of this condition since this is not a typical condition of roundabouts.

US 2/North Williston Road – Scoping Report Page 25
Figure 24: Modified Roundabout Alternative
5.3 Evaluation of Alternatives Each alternative is evaluated across a matrix of performance measures. Many performance measures are suggested by VTrans as part of a typical project, and include such things as project cost, environmental impact, and permitting requirements, and are summarized in Figure 25 below. This figure also identifies the Benefit to Cost ratio (B/C) for the signalized intersection with eastbound left turn lane and the roundabout. A similar analysis was conducted previously by VTrans in December 2007, resulting in a B/C ratio of 1.00 for both of these alternatives. The variation in results is due to more refined costs of the two analyses.

1 October 2009 Page 26
Figure 25: Evaluation Matrix
Improvement: No Build SignalizationSignalization w/
eastbound left turn lane
RoundaboutRoundabout (limited US2 Right Turns)
Conceptual Cost Estimate - $195,000 $265,000 $960,000 $935,000
Properties Affected - 0 0 1 (minimal impacts) 1 (minimal impacts)B/C Ratio - 0.83 0.97 1.02 1.04Typical Section (total road width) - - - - -Alignment/Geometric Changes - - Yes Yes YesBike/Ped Impacts - Improved Improved Improved ImprovedUnderground Utilities - No Change No Change Yes YesOverhead Utilities - No Change No Change Possible PossibleRight of Way Impacts - No No Possible PossibleLOS 2010 (AM/PM) Overall C/F A/B B/A A/B A/BLOS 2020 (AM/PM) Overall C/F A/B B/B B/B B/BAgricultural Lands No No No Yes YesArchaeological No No Unlikely Unlikely UnlikelyHistoric Structures/Sites No No Not Likely Possible PossibleFloodplain No No No No NoFish and Wildlife No No No No NoRare, Threatened & Endangered No No No No NoPublic Lands No No No No NoNoise No No No No NoWetlands No No No Possible PossibleHazardous Waste Sites No No No Possible PossibleSatisfies Purpose & Need - Yes Yes Yes YesCommunity Character - - - - -Economic Impacts - - - - -Conformance to Regional Plan - Yes Yes Yes YesAct 250 No No No Unlikely Unlikely401 Water Quality No No No Possible Possible404 Corps of Engineers Permit No No No Possible PossibleStream Alteration No No No No NoConditional Use Determination No No No Possible PossibleStorm Water Discharge No No Unlikely Likely LikelyShoreland Encroachment No No No No NoEnd./Threat. Species No No No No NoVTrans ROW Permit No Yes Yes Yes YesSHPO Clearance No Possible Yes Yes YesNEPA Process Required No Possible Yes (CE) Yes (CE) Yes (CE)
POSS
IBLE
PER
MIT
SEN
VIR
ON
MEN
TAL
RES
OU
RC
ESC
OST
LOC
AL
&
REG
ION
AL
ISSU
ESEN
GIN
EER
ING
Based on the results above, the two alternatives which should be considered by the Town are the signalization with eastbound left turn lane or a roundabout. The following is a summary of the analyses above.
The No Build alternative results in an overall LOS F and LOS F for the eastbound approach during the PM peak hour. There are also very significant eastbound queues.
For the Signalized alternative, the resulting LOS are anticipated to be C or better. Queues for the eastbound approach are significant (37 vehicles for the 2020 PM peak hour).
For the Signalized with Eastbound Left Turn Lane alternative, the resulting LOS are anticipated to be LOS C or better. Queues for the eastbound approach are significantly reduced. The maximum anticipated queue for the intersection is 10 vehicles. A left turn lane for this approach was found to be warranted based on current afternoon peak hour volumes.
The Roundabout alternative has the best anticipated LOS and lowest delays and queuing. However, this alternative is also the most expensive and has the most potential for environmental impacts, due to the larger area of disturbance and the need for improvements to the existing stormwater collection system. There will likely be minor right‐of‐way impacts with the Roundabout alternative.

US 2/North Williston Road – Scoping Report Page 27
Benefit to cost results show the Signalized alternative has a B/C ratio of 0.83. The B/C ratio for the Signalized with Eastbound Left Turn Lane and two Roundabout alternatives are 0.97 and 1.02‐1.04, respectively. Funding for projects through the Highway Safety Improvement Program must, as a minimum requirement, have a B/C ratio of 1 or greater. Therefore, the signalized without eastbound left turn lane would not be eligible for funding through the HSIP program.
Limiting US 2 right turns for large trucks in the roundabout alternative results in a slightly smaller shoulder at the northeast and southwest quadrants of the intersection. This results in a slightly lower construction cost, but will be slightly more inconvenient for large trucks. In addition, signing for such condition may be confusing to drivers.
6.0 PREFERRED ALTERNATIVE The findings from this report were presented to the Williston Selectboard and the public at a series of meetings, summarized previously in Section 3.0 . The recommendation of the Selectboard, at their 23 March 2009 meeting, was the Roundabout Alternative.