Embed Size (px)
Citation preview

U.S.
Auto Sales Chartbook
January 2020

2BBVA Research - U.S. Auto Sales Outlook. January 2020
New vehicle sales were 16.9 million in 2019, 1.7% less than in 2018
Although still solid, 2019 sales were the lowest since 2014
We expect new car sales to slow down further in 2020, due to slower
economic growth and less affordable vehicles
Stable interest rates should provide some relief to dealers and consumers
A robust supply of “off-leasing” units, high prices of new vehicles, and
access to credit will continue supporting sales of used units
PHEV and BEV sales declined to 319,554 in 2019 from 349,688 in 2018.
Electric pickup models may start production this year
The battle for CAFE targets, affordability and the phase out of the federal
tax credit for some companies could limit prospects for EVs
Main messages

3BBVA Research - U.S. Auto Sales Outlook. January 2020
Sales
U.S. TOTAL LIGHT WEIGHT VEHICLE SALES(SAAR, MILLION UNITS)
0
2
4
6
8
10
12
14
16
18
20
2005 2006 2007 2008 2009 2010 2011 2012 2013 2014 2015 2016 2017 2018 2019
Total Domestic Imported
Source: BBVA Research and Haver Analytics
4BBVA Research - U.S. Auto Sales Outlook. January 2020
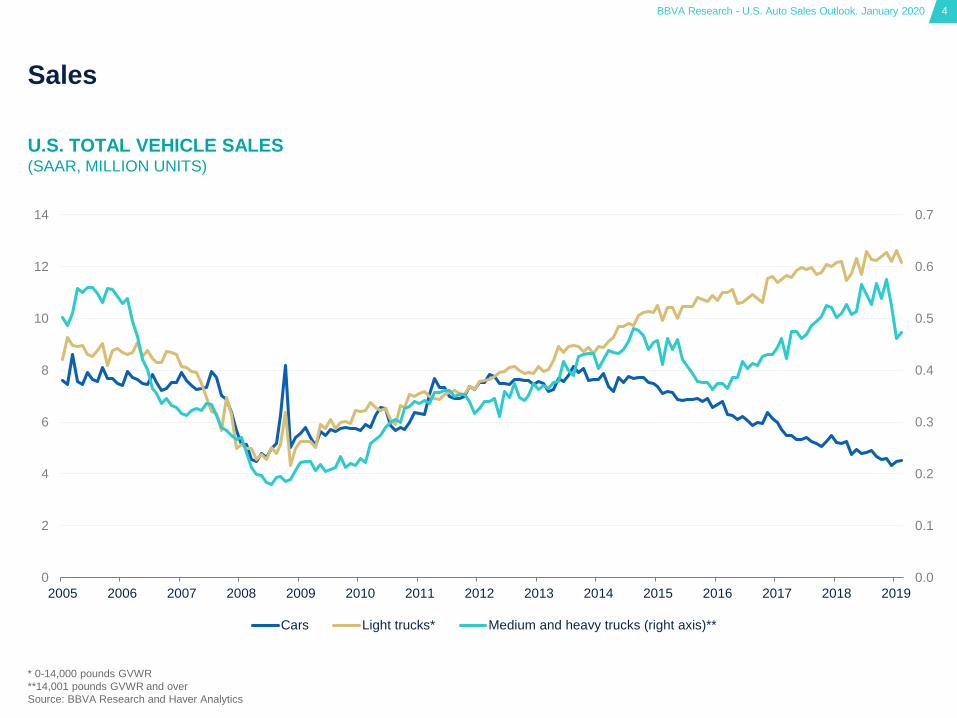
Sales
U.S. TOTAL VEHICLE SALES(SAAR, MILLION UNITS)
0.0
0.1
0.2
0.3
0.4
0.5
0.6
0.7
0
2
4
6
8
10
12
14
2005 2006 2007 2008 2009 2010 2011 2012 2013 2014 2015 2016 2017 2018 2019
Cars Light trucks* Medium and heavy trucks (right axis)**
* 0-14,000 pounds GVWR
**14,001 pounds GVWR and over
Source: BBVA Research and Haver Analytics

5BBVA Research - U.S. Auto Sales Outlook. January 2020
Sales
U.S. TOTAL VEHICLE SALES(SHARE OF TOTAL)
0%
10%
20%
30%
40%
50%
60%
70%
80%
2005 2006 2007 2008 2009 2010 2011 2012 2013 2014 2015 2016 2017 2018 2019
Trucks Cars
Source: BBVA Research and Haver Analytics
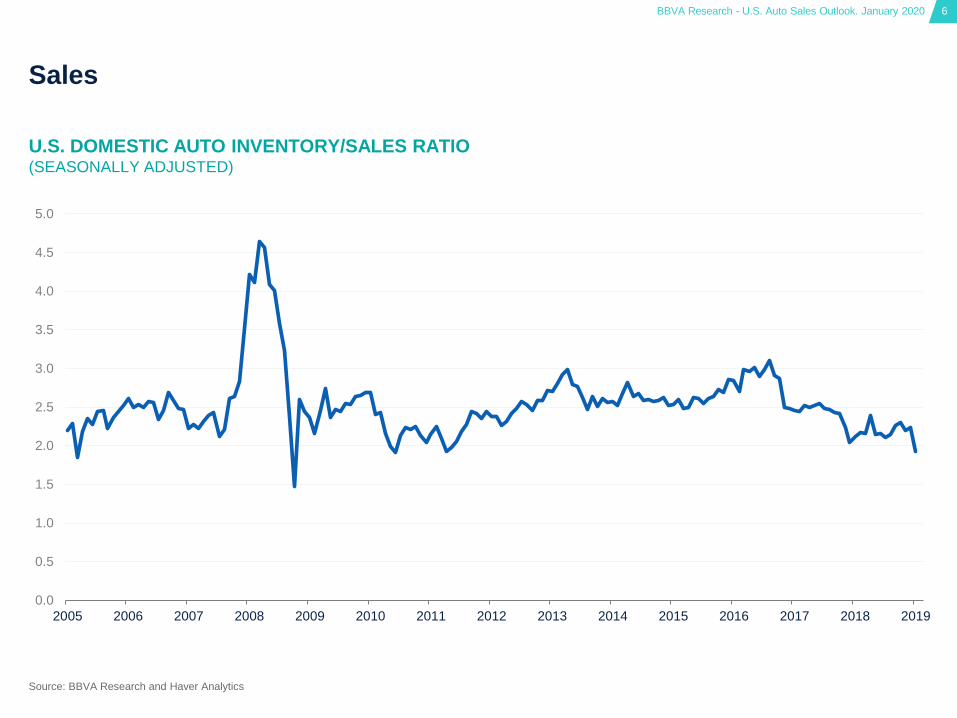
6BBVA Research - U.S. Auto Sales Outlook. January 2020
Sales
0.0
0.5
1.0
1.5
2.0
2.5
3.0
3.5
4.0
4.5
5.0
2005 2006 2007 2008 2009 2010 2011 2012 2013 2014 2015 2016 2017 2018 2019
U.S. DOMESTIC AUTO INVENTORY/SALES RATIO(SEASONALLY ADJUSTED)
Source: BBVA Research and Haver Analytics
7BBVA Research - U.S. Auto Sales Outlook. January 2020
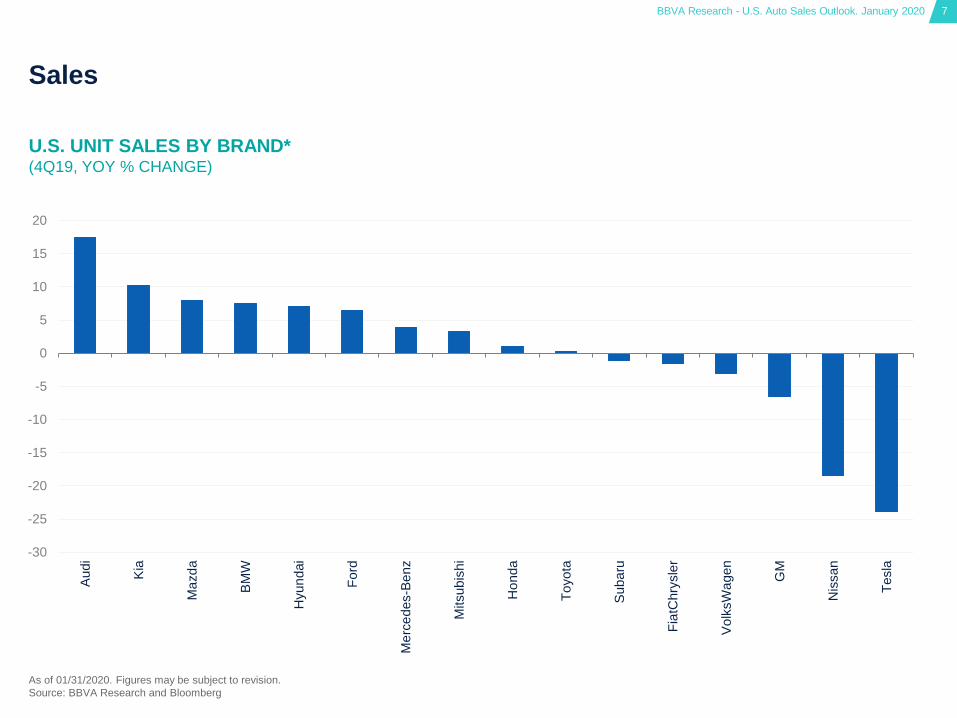
Sales
U.S. UNIT SALES BY BRAND*(4Q19, YOY % CHANGE)
As of 01/31/2020. Figures may be subject to revision.
Source: BBVA Research and Bloomberg
-30
-25
-20
-15
-10
-5
0
5
10
15
20
Audi
Kia
Ma
zd
a
BM
W
Hyun
dai
Ford
Me
rce
des-B
enz
Mitsubis
hi
Ho
nda
Toyota
Suba
ru
Fia
tChry
sle
r
Volk
sW
agen
GM
Nis
san
Tesla

8BBVA Research - U.S. Auto Sales Outlook. January 2020
Stock market
STOCK MARKET INDICATORS(INDEX, 1/1/2018 = 100)
*Fiat Chrysler Automobiles, Ford Motor Co., Tesla Inc., General Motors Co.
Source: BBVA Research and Bloomberg
60
80
100
120
140
160
180
200
01
/01
/201
8
22
/01
/201
8
12
/02
/201
8
05
/03
/201
8
26
/03
/201
8
16
/04
/201
8
07
/05
/201
8
28
/05
/201
8
18
/06
/201
8
09
/07
/201
8
30
/07
/201
8
20
/08
/201
8
10
/09
/201
8
01
/10
/201
8
22
/10
/201
8
12
/11
/201
8
03
/12
/201
8
24
/12
/201
8
14
/01
/201
9
04
/02
/201
9
25
/02
/201
9
18
/03
/201
9
08
/04
/201
9
29
/04
/201
9
20
/05
/201
9
10
/06
/201
9
01
/07
/201
9
22
/07
/201
9
12
/08
/201
9
02
/09
/201
9
23
/09
/201
9
14
/10
/201
9
04
/11
/201
9
25
/11
/201
9
16
/12
/201
9
06
/01
/202
0
27
/01
/202
0
S&P 500 North America Automobiles Valuation Peers* AutoNation CarMax Sonic Automotive Lithia Motors
9BBVA Research - U.S. Auto Sales Outlook. January 2020
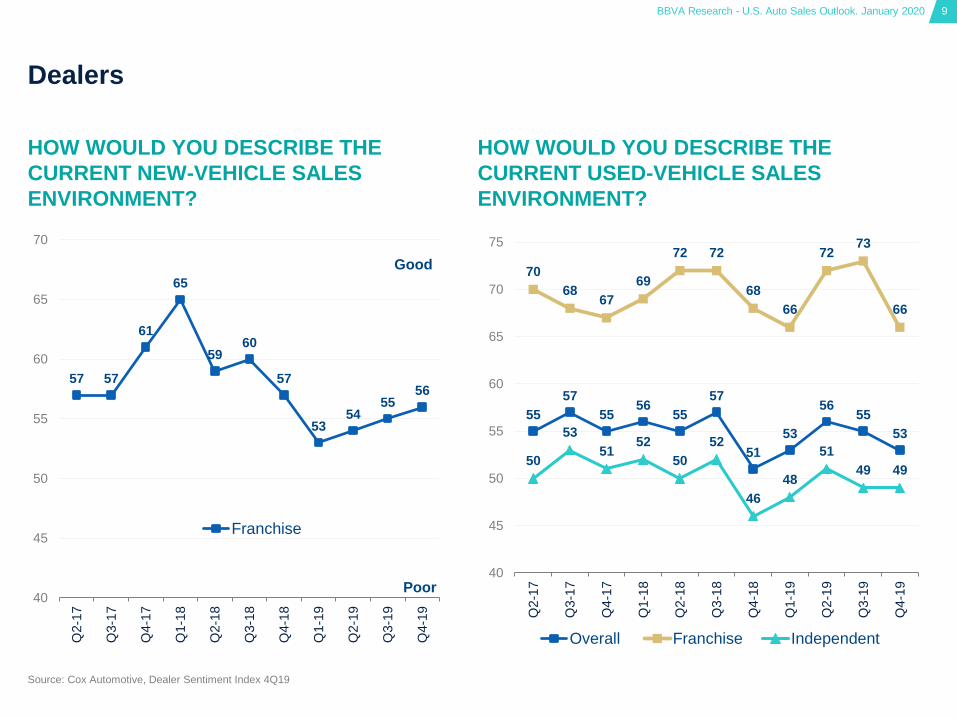
Dealers
57 57
61
65
5960
57
5354
5556
40
45
50
55
60
65
70
Q2-1
7
Q3-1
7
Q4-1
7
Q1-1
8
Q2-1
8
Q3-1
8
Q4-1
8
Q1-1
9
Q2-1
9
Q3-1
9
Q4-1
9
Franchise
55
57
5556
55
57
51
53
5655
53
70
6867
69
72 72
68
66
7273
66
50
53
5152
50
52
46
48
51
49 49
40
45
50
55
60
65
70
75
Q2-1
7
Q3-1
7
Q4-1
7
Q1-1
8
Q2-1
8
Q3-1
8
Q4-1
8
Q1-1
9
Q2-1
9
Q3-1
9
Q4-1
9
Overall Franchise Independent
HOW WOULD YOU DESCRIBE THE
CURRENT USED-VEHICLE SALES
ENVIRONMENT?
HOW WOULD YOU DESCRIBE THE
CURRENT NEW-VEHICLE SALES
ENVIRONMENT?
Source: Cox Automotive, Dealer Sentiment Index 4Q19
Good
Poor
10BBVA Research - U.S. Auto Sales Outlook. January 2020
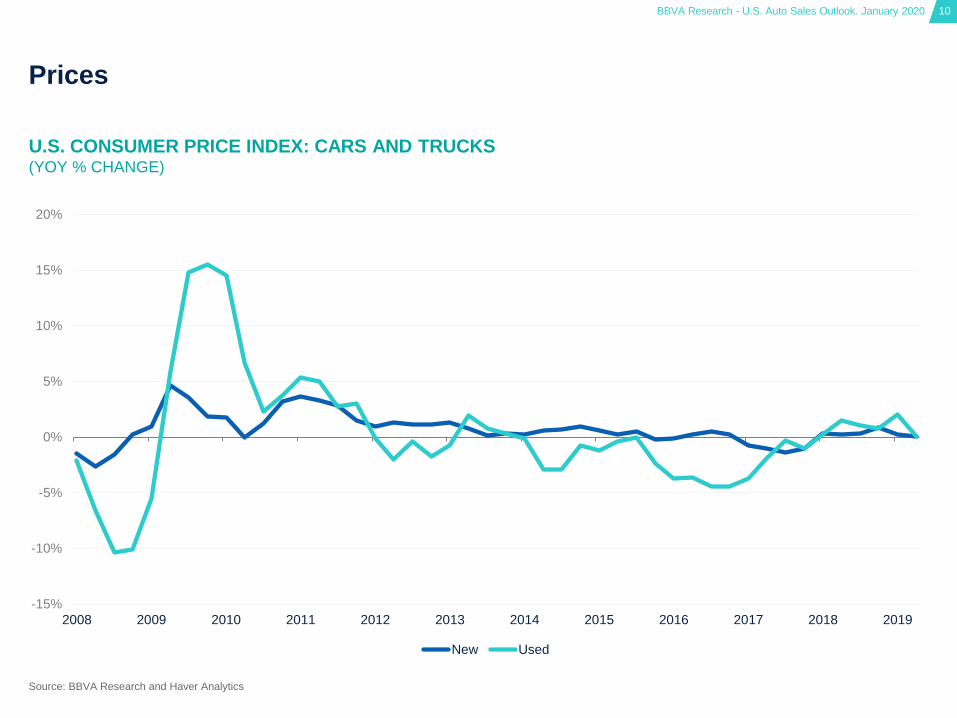
Prices
U.S. CONSUMER PRICE INDEX: CARS AND TRUCKS(YOY % CHANGE)
-15%
-10%
-5%
0%
5%
10%
15%
20%
2008 2009 2010 2011 2012 2013 2014 2015 2016 2017 2018 2019
New Used
Source: BBVA Research and Haver Analytics

11BBVA Research - U.S. Auto Sales Outlook. January 2020
Prices
U.S. AUTO PRICES
(INDEX, 2009 = 100)
80
90
100
110
120
130
140
150
2009 2010 2011 2012 2013 2014 2015 2016 2017 2018 2019
Manheim Used Vehicle Value Index Edmunds Vehicle True Market Value
Source: BBVA Research, Haver Analytics and Bloomberg

12BBVA Research - U.S. Auto Sales Outlook. January 2020
Financial conditions
U.S. INTEREST RATES(%)
Source: BBVA Research and Haver Analytics
0%
1%
2%
3%
4%
5%
6%
2011 2012 2013 2014 2015 2016 2017 2018 2019
48-month new car loan
36-month used car loan
60-month new car loan
Federal Open Market Committee: Fed Funds Target Rate: Upper Limit (%)

13BBVA Research - U.S. Auto Sales Outlook. January 2020
Financial conditions
0
20
40
60
80
100
120
140
160
2008 2009 2010 2011 2012 2013 2014 2015 2016 2017 2018 2019
Source: BBVA Research and Haver Analytics
U.S. NEWLY ORIGINATED INSTALLMENT AUTO LOANS($ BILLION, EOP, 4-QTR MOVING AVG.)

14BBVA Research - U.S. Auto Sales Outlook. January 2020
Financial conditions
0%
1%
2%
3%
4%
5%
6%
2008 2009 2010 2011 2012 2013 2014 2015 2016 2017 2018 2019
U.S. AUTO LOAN 90+ DAYS DELINQUENT(% OF BALANCE)
Source: BBVA Research and Haver Analytics

15BBVA Research - U.S. Auto Sales Outlook. January 2020
Leasing
U.S. LEASING PENETRATION RATE(%, 3-MONTH MOVING AVERAGE)
0
5
10
15
20
25
30
35
2006 2007 2008 2009 2010 2011 2012 2013 2014 2015 2016 2017 2018 2019
Source: BBVA Research and Haver Analytics

16BBVA Research - U.S. Auto Sales Outlook. January 2020
Leasing
OFF-LEASE RETURNS AND SUPPLY* (MILLIONS UNITS)
*Assumes 36-month lease terms
Source: Bloomberg and BBVA Research
2.532.77
3.24
4.09
4.48
5.075.34
5.13 5.19
0
1
2
3
4
5
6
2014 2015 2016 2017 2018 2019 2020 2021 2022

17BBVA Research - U.S. Auto Sales Outlook. January 2020
Gasoline
U.S. RETAIL GASOLINE PRICE(AVERAGE CENTS PER GALLON)
0
50
100
150
200
250
300
350
400
450
2008 2009 2010 2011 2012 2013 2014 2015 2016 2017 2018 2019
Source: BBVA Research and Haver Analytics

02Consumers

19BBVA Research - U.S. Auto Sales Outlook. January 2020
Consumers
Source: BBVA Research and Haver Analytics
UNIVERSITY OF MICHIGAN: CONSUMER SENTIMENT INDEX
0
20
40
60
80
100
120
140
2008 2009 2010 2011 2012 2013 2014 2015 2016 2017 2018 2019
Current economic conditions Consumer expectations

20BBVA Research - U.S. Auto Sales Outlook. January 2020
CONFERENCE BOARD: CONSUMER PLANS TO BUY A CAR WITHIN 6 MONTHS(% OF RESPONDENTS)
Source: BBVA Research and Haver Analytics
Consumers
8%
9%
10%
11%
12%
13%
14%
2009 2010 2011 2012 2013 2014 2015 2016 2017 2018 2019

21BBVA Research - U.S. Auto Sales Outlook. January 2020
Consumers
U.S. UNEMPLOYMENT RATE(%)
Source: BBVA Research and Haver Analytics
0%
2%
4%
6%
8%
10%
12%
2008 2009 2010 2011 2012 2013 2014 2015 2016 2017 2018 2019

22BBVA Research - U.S. Auto Sales Outlook. January 2020
Consumers
-2500
-2000
-1500
-1000
-500
0
500
1000
2008 2009 2010 2011 2012 2013 2014 2015 2016 2017 2018 2019
U.S. NONFARM PAYROLL(QUARTERLY CHANGE, THOUSAND)
23BBVA Research - U.S. Auto Sales Outlook. January 2020
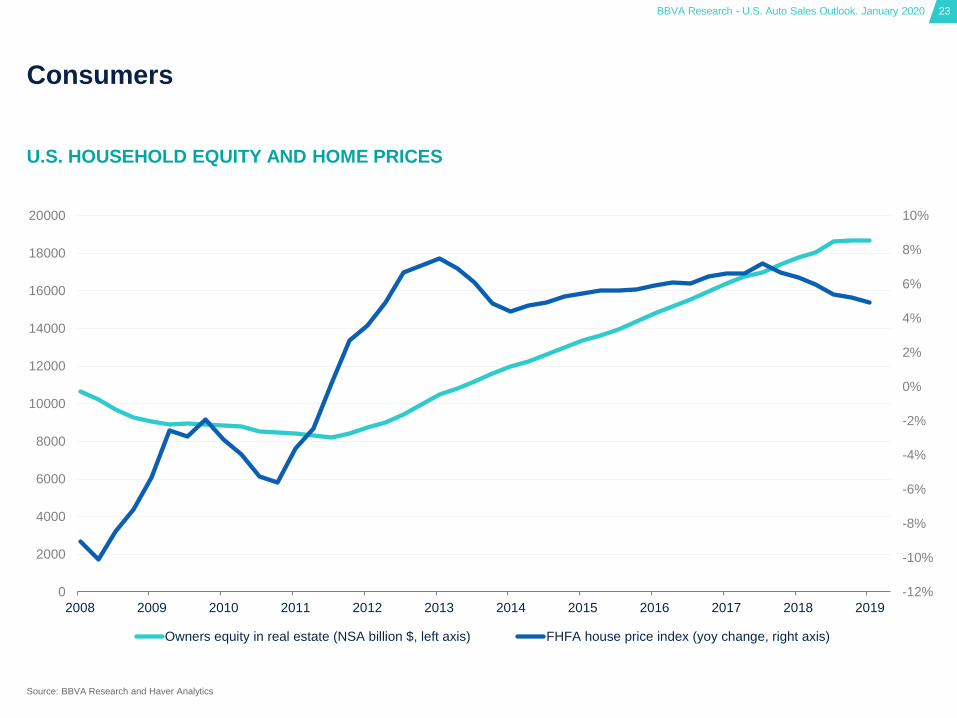
U.S. HOUSEHOLD EQUITY AND HOME PRICES
Source: BBVA Research and Haver Analytics
Consumers
-12%
-10%
-8%
-6%
-4%
-2%
0%
2%
4%
6%
8%
10%
0
2000
4000
6000
8000
10000
12000
14000
16000
18000
20000
2008 2009 2010 2011 2012 2013 2014 2015 2016 2017 2018 2019
Owners equity in real estate (NSA billion $, left axis) FHFA house price index (yoy change, right axis)

03Production
25BBVA Research - U.S. Auto Sales Outlook. January 2020
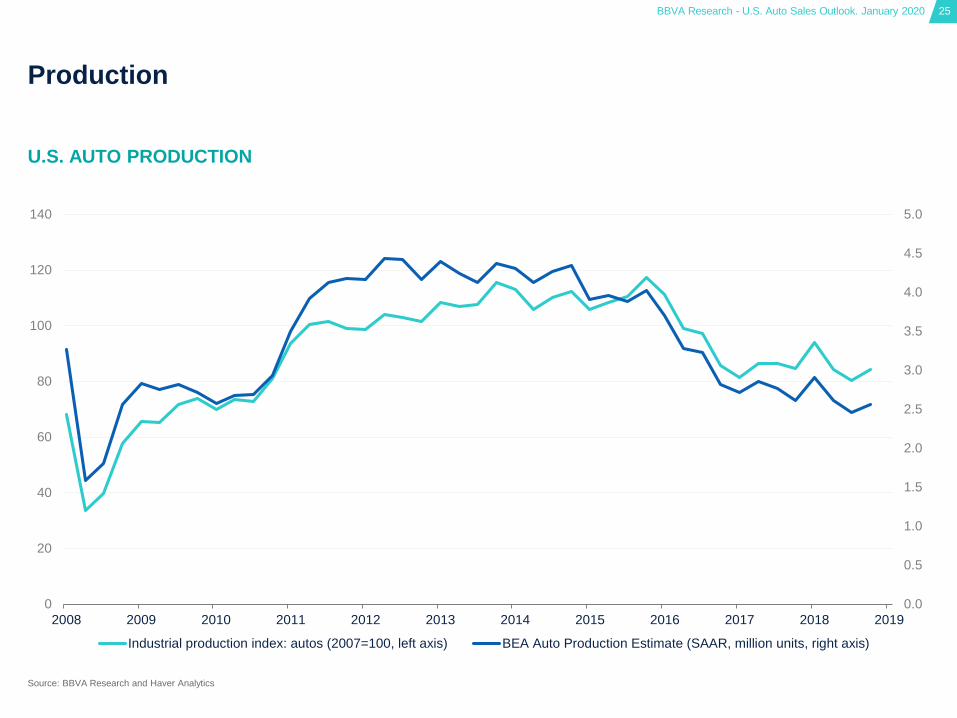
U.S. AUTO PRODUCTION
Source: BBVA Research and Haver Analytics
Production
0.0
0.5
1.0
1.5
2.0
2.5
3.0
3.5
4.0
4.5
5.0
0
20
40
60
80
100
120
140
2008 2009 2010 2011 2012 2013 2014 2015 2016 2017 2018 2019
Industrial production index: autos (2007=100, left axis) BEA Auto Production Estimate (SAAR, million units, right axis)

04Structural

27BBVA Research - U.S. Auto Sales Outlook. January 2020
MEAN AGE OF PASSENGER CARS IN
OPERATION (YEARS)
Source: BBVA Research and Haver Analytics
Fundamentals
VEHICLE MILES OF TRAVEL(TOTAL AND ADJUSTED BY POPULATION)
8.0
8.5
9.0
9.5
10.0
10.5
11.0
11.5
12.0
20
04
20
05
20
06
20
07
20
08
20
09
20
10
20
11
20
12
20
13
20
14
20
15
20
16
20
17
20
18
0
500000
1000000
1500000
2000000
2500000
3000000
3500000
0
2000
4000
6000
8000
10000
12000
14000
19
82
19
84
19
86
19
88
19
90
19
92
19
94
19
96
19
98
20
00
20
02
20
04
20
06
20
08
20
10
20
12
20
14
20
16
20
18
Millio
n m
iles
Miles p
er
cap
ita
Population adjusted (left axis) Total (right axis)

28BBVA Research - U.S. Auto Sales Outlook. January 2020
U.S. POPULATION PROJECTIONS BY AGE(SHARE OF 16 & ABOVE)
Source: BBVA Research and Haver Analytics
Demographics
29% 28% 25% 24% 24%
51%47%
46% 46% 45%
20% 25% 29% 31% 31%
0%
10%
20%
30%
40%
50%
60%
70%
80%
90%
100%
2010 2020 2030 2040 2050
16-29 years 30-54 years 65 years and over

29BBVA Research - U.S. Auto Sales Outlook. January 2020
U.S. ELECTRIC VEHICLE SALES*(UNITS)
Figures may be subjected to revision. Includes PHEV and BEV
Source: BBVA Research and Bloomberg New Energy Finance
Electric vehicles
0
20000
40000
60000
80000
100000
120000
140000
Q1 2
011
Q2 2
011
Q3 2
011
Q4 2
011
Q1 2
012
Q2 2
012
Q3 2
012
Q4 2
012
Q1 2
013
Q2 2
013
Q3 2
013
Q4 2
013
Q1 2
014
Q2 2
014
Q3 2
014
Q4 2
014
Q1 2
015
Q2 2
015
Q3 2
015
Q4 2
015
Q1 2
016
Q2 2
016
Q3 2
016
Q4 2
016
Q1 2
017
Q2 2
017
Q3 2
017
Q4 2
017
Q1 2
018
Q2 2
018
Q3 2
018
Q4 2
018
Q1 2
019
Q2 2
019
Q3 2
019
Q4 2
019

05Forecasts
31BBVA Research - U.S. Auto Sales Outlook. January 2020
Source: BBVA Research
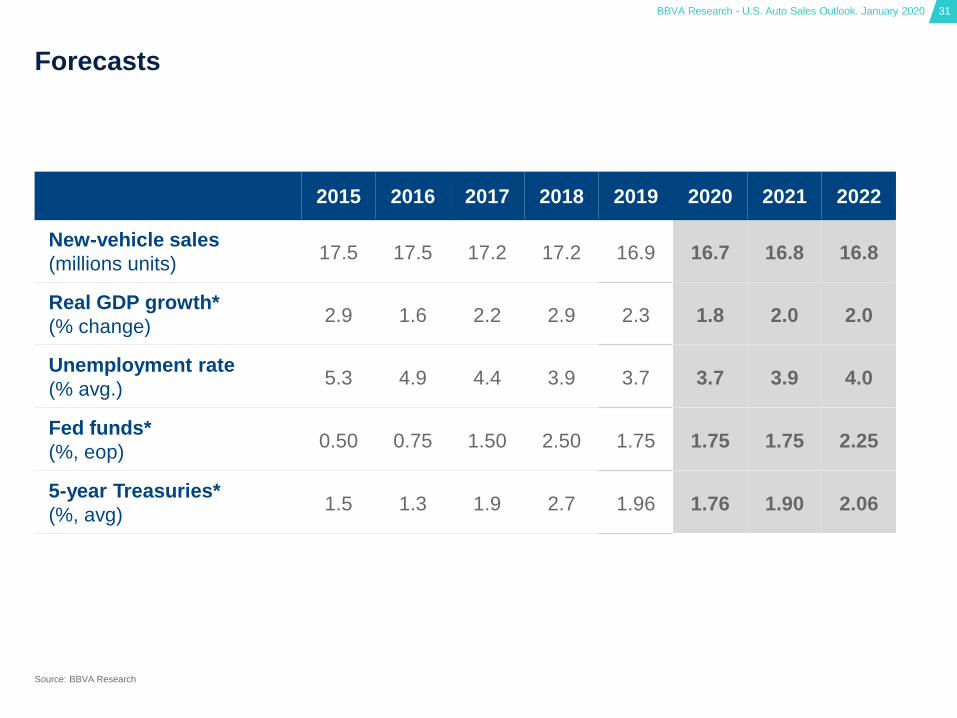
Forecasts
2015 2016 2017 2018 2019 2020 2021 2022
New-vehicle sales
(millions units)17.5 17.5 17.2 17.2 16.9 16.7 16.8 16.8
Real GDP growth*
(% change)2.9 1.6 2.2 2.9 2.3 1.8 2.0 2.0
Unemployment rate
(% avg.)5.3 4.9 4.4 3.9 3.7 3.7 3.9 4.0
Fed funds*
(%, eop)0.50 0.75 1.50 2.50 1.75 1.75 1.75 2.25
5-year Treasuries*
(%, avg)1.5 1.3 1.9 2.7 1.96 1.76 1.90 2.06

U.S.
Auto Sales Chartbook
January 2020


![Sales Tax Auto Saved]](https://img.pdfslide.net/doc/110x75/577d22d61a28ab4e1e985dc6/sales-tax-auto-saved.jpg)