Embed Size (px)
Citation preview

U.S. Background Information Prepared for the OECD Postsecondary Vocational Education and Training “Skills
Beyond School” Study
April 2012
The views expressed in this document do not reflect the views of the U.S. Department of Education. The included website links and references to programs, institutions, or products do not reflect endorsement of these sites, programs, institutions, or products by the U.S. Department of Education.

This paper provides background information on the United States’ postsecondary vocational education and training (VET) system to support the Organization for Economic Cooperation and Development’s (OECD’s) “Skills Beyond Schools” study. Based on the goals of the OECD study, the remainder of this report focuses almost exclusively on postsecondary VET provided in formal education institutions. Before delving into a description of this U.S. postsecondary vocational education system, we start with an overview of U.S. postsecondary education in general. There is no national qualifications framework in the U.S., but the credentials awarded by postsecondary institutions fall into these standard categories:
• Postsecondary certificates: These are short-term awards that focus on occupational skills. Their length can vary, but most range from 3-months to just under 2 years in length.
• Associate’s degrees: These are 2-year degrees that are of two types. The first are academic associate’s degrees, which are designed mainly as a stepping-stone to a 4-year bachelor’s degree. The second is the occupational—or VET—associate’s degree, which is designed as a terminal degree to prepare students for work, and accounts for about 60% of all associate’s degrees.
• Bachelor’s degrees: These are four-year degrees that can be awarded in academic or occupationally related fields (e.g., engineering, education, business administration).
• Master’s degrees: These are 2-year post-baccalaureate degrees. • Doctorate degrees: These are 4-year post-baccalaureate degrees and are typically
intended to prepare students to be researchers and/or postsecondary instructors. • First professional degrees: These post-baccalaureate degrees are usually of 4-6 years in
duration and prepare students for professional practice (most commonly in law or medicine).
A diverse array of postsecondary education institutions awards these credentials. One way in which these institutions vary is on which type of credential they focus, with 4-year institutions focusing on bachelor’s degrees, 2-year institutions focusing on associate’s degrees, and less-than-2-year institutions focusing on certificates. Institutions also vary in terms of their funding mechanisms; public institutions are state-subsidized and private institutions are not. Private institutions include non-profit institutions, which are typically endowed 4-year schools (e.g., Harvard University) and for-profit or proprietary institutions that range from non-degree granting institutions or “trade schools” (e.g., Staunton School of Cosmetology) to large, publicly traded institutions (e.g. ITT Tech, DeVry Incorporated).
These types of institutions are highly diversified in the programs and credentials they offer. State or private universities typically offer programs in a wide range of subject fields at both the baccalaureate and graduate (post-baccalaureate) levels, with sub-baccalaureate and non-credit offerings also often available, but on a relatively small scale. Single-purpose trade schools offer one or more certificate programs in a specific occupational area, such as acupuncture or cosmetology. Community colleges vary in their focus, with some concentrating on preparation for transfer to 4-year colleges, and others concentrating more on workforce preparation, but
2

virtually all offer at least some VET. Generally speaking, community colleges focus more on “education” while their private counterparts focus on “training.”1 Community colleges also tend to offer a wider range of programs than do private VET schools; the latter tend to specialize.
Another important way in which institutions vary is in admissions selectivity (table 1). Generally, admissions requirements tend to be set higher in the non-profit private sector, and in 4-year institutions compared with less-than-4-year institutions. Open admissions is a hallmark of community colleges.
Table 1. Percentage of degree-granting institutions that have open admissions: 2009-10 Type of institution Percent Public 4-year 17 Public 2-year 96 Private non-profit 4-year 13 Private non-profit 2-year 46 For-profit 4-year 48 For-profit 2-year 62 Source: Snyder and Dillow, 2010. Original source: U.S. Department of Education, National Center for Education Statistics, 2009-10 Integrated Postsecondary Education Data System.
1 Some analysts have noted that this distinction is not as clear as it used to be, as federal legislation has tightened the requirements for institutions to participate in federal student aid programs, resulting in many private VET schools increasing their academic offerings (Bailey, Badway, and Gumport, 2001). Nonetheless, the private for-profit sector is heavily weighted toward less-than-2-year institutions and certificate awards, which involve less academic instruction. For example, in 2010, 48% of for-profit institutions were less-than-2-year institutions, compared to 11% of public institutions (see table 4 below).
3

DEFINITION OF POSTSECONDARY VET
In the U.S. context, postsecondary VET mainly encompasses both certificate programs and terminal associate’s degree programs. However, whether an associate’s degree in a specific subject is terminal or transfer will vary depending on how a particular institution structures its offerings. In fact, even a specific associate’s degree at one institution can serve both purposes, as when, for example, a nursing associate’s degree can serve for either job entry or transfer into a 4-year nursing program.
Thus, when compiling data at the national level—where only the level of the degree and its subject field are available—we are forced to approximate an academic-vocational distinction based on the subject field of the associate’s degree. Unfortunately, how to make this subject-field distinction is not standardized within the federal government. Table 2 provides examples of the three most relevant taxonomies for making this distinction; these taxonomies are used by the National Center for Education Statistics (NCES) and the Office of Vocational and Adult Education (OVAE), both within the U.S. Department of Education.2 A fourth taxonomy was recently developed by the American Association of Community Colleges for use with its newly developed accountability framework (discussed below under “Policy and Other Initiatives”); that taxonomy is similar to the CTE Statistics taxonomy in table 2, except that it includes the visual and performing arts.
Each of the 50 states and the District of Columbia is likely to have its own definition of VET. Many states have been moving toward adopting some variation of the Career Clusters taxonomy listed in table 2, in part because OVAE encourages use of the Career Clusters for state reporting of VET data to the federal government. (See sidebar on the Career Clusters.) So although this report will refer consistently to “VET”—or to the U.S.-equivalent term, career and technical education (CTE)—this term may have different meanings in different studies or states.
2 The NCES data used in this report are mainly based on the taxonomy used by the CTE Statistics program. Aside from differences in terminology and aggregation, this taxonomy is almost identical to the taxonomy the U.S. uses in its UOE submissions. The two taxonomies do differ, however, in three classifications: The CTE Statistics taxonomy counts programs in design, social work, and engineering as VET, while the UOE submissions do not.
4

Regardless of the taxonomy used, the intention is to capture formal educational preparation for semi-skilled and skilled jobs that require education below the baccalaureate level, such as licensed practical nurse, automotive technician, and IT technical support specialist. These jobs often involve some type of professional certification or state licensure in addition to education, but that is not the defining feature of VET, as such external credentialing occurs at all education levels (e.g., registered nurses typically have bachelor’s degrees, and licensed doctors have advanced medical degrees). That said, some vocational education and training does occur outside of formal credit-bearing postsecondary education: Students may enroll in continuing education or non-credit work-preparation courses at postsecondary institutions, others may take courses offered by non-educational providers such as professional associations (or self-study) to prepare for occupational certification or licensure exams, and, others participate in work-based training provided by civilian and military employers. For example, apprenticeship programs (discussed further below) provide on-the-job VET, often with no postsecondary education component. However, in the U.S., apprenticeship numbers are very small compared with enrollments in educational institutions. Thus, with a few exceptions, the remainder of this report focuses on postsecondary VET provided in formal education institutions and programs. Because most post-secondary VET credentials are provided by community colleges and other less-than-4-year institutions,3 we will also focus on those institution types.
3 In 2010, 17% of all VET credentials were awarded by 4-year institutions. About half of these VET credentials were awarded by for-profit 4-year institutions.
SIDEBAR: THE CAREER CLUSTERS
In the U.S., VET is commonly known as career and technical education, or CTE. Each U.S. state has one or more state directors for CTE, responsible for overseeing the state’s secondary and postsecondary CTE systems. The National Association of State Directors of Career Technical Education Consortium (NASDCTEc) provides these state CTE directors with leadership, advocacy, and other support. One recent NASDCTEc initiative is the Career Clusters, which divides the world of work into 16 career areas (Table 2). The Career Clusters are intended to provide secondary schools with an organizing framework for delivering CTE instruction. The NASDCTEc encourages the use of the Career Clusters framework by states and localities, providing CTE administrators and educators with guidance and support for its use. In addition, the U.S. Department of Education’s Office of Vocational and Adult Education (OVAE) has adopted the Career Clusters as their preferred framework for states to use to meet Perkins Act reporting requirements. Further information on the career clusters is available at http://www.acteonline.org/stateprofiles.aspx.
Although the Career Clusters is the classification system used within the VET education community, the federal government supports two other occupations-based classifications systems. The U.S. Department of Labor uses the Standard Occupational Classification (SOC) and the U.S. Department of Commerce uses a set of industry clusters (see Annex C).
5

Table 2. Taxonomies used to define postsecondary VET in the United States CTE Statistics taxonomy
Taxonomy for U.S. UOE submissions
Career Clusters
Agriculture and natural resources
Agriculture, parks, and recreation
Agriculture, food, and natural resources
Natural resources Business management Business and marketing Business management and
administration Business support Finance Marketing Marketing Communications Communications and Arts, audio/video technology Communications technology communications technology and communications Design Computer and information sciences
Computer science Information technology
Education Education Education and training Construction Construction Architecture and construction Architecture Architecture Science, technology, Engineering Engineering technologies engineering, and mathematics Science technologies Science technologies Health sciences Health sciences Health science Consumer services Family and personal services Human services Social services Religious vocations Protective services Protective services Law, public safety,
corrections, and security Legal services Law and legal services Public services Public and social services Government and public
administration Public administration Manufacturing Manufacturing Manufacturing Repair Repair Transportation, distribution,
and logistics Transportation Transportation Hospitality and tourism
VET CREDENTIALS
In 2010, approximately 1,400,000 VET credentials (associate’s degrees and certificates) were awarded in the U.S., about 40% of which were associate’s degrees and about 60% certificates (table 3). By far the most common field of study for VET credentials is health care, accounting for 43% of such credentials (table 4). Other common fields of study are the collective “trades” fields of manufacturing, construction, repair, and transportation; consumer services (mainly cosmetology and culinary arts); and business management, each accounting for 10-13% of credentials. All other fields of study each account for no more than 5% of VET credentials.
6

Table 3. Number of undergraduate credentials awarded by Title IV postsecondary institutions, by curriculum area and credential level: 2010
Credential level Number of credentials
Total Academic VET Total, all undergraduate levels 3,429,934 1,987,747 1,442,187 Bachelor’s degree 1,650,014 1,650,014 na Associate’s degree 899,463 337,733 561,730 Certificate 880,457 na 880,457 na = not applicable. Source: U.S. Department of Education, National Center for Education Statistics, Integrated Postsecondary Education Data System, 2010-11, completions component (special run).
Table 4. Number and percentage of VET credentials awarded in each field of study: 2010 Field of study Number Percentage Total, all VET fields 1,410,146 100 Health sciences 606,899 43 Manufacturing, construction, repair, and transportation 183,161 13 Consumer services 158,685 11 Business management 136,938 10 Engineering, architecture, and science technologies 67,731 5 Protective services 67,198 5 Computer and information sciences 56,846 4 Communications and design 31,533 2 Education 26,491 2 Business support 26,241 2 Public, legal, and social services 23,610 2 Marketing 13,361 1 Agriculture and natural resources 11,452 1 Source: U.S. Department of Education, National Center for Education Statistics, Integrated Postsecondary Education Data System, 2010-11, completions component (special run).
PROVIDERS OF VET
VET credentials in the U.S. are typically awarded by sub-baccalaureate institutions. As seen in tables 5 and 6, sub-baccalaureate institutions comprise 59% of all U.S. postsecondary institutions, while enrollments in these institutions comprise 50% of all undergraduate enrollments and 40% of full-time equivalent enrollments. These statistics reflect that, relative to baccalaureate education, sub-baccalaureate institutions tend to be small and sub-baccalaureate students tend to enroll part-time.
7

Table 5. Number and distribution of Title IV undergraduate institutions: 2010-11
Level of institution
Number of institutions
Total Public Private, non-
profit Private, for-
profit Total institutions 6,973 1,970 1,810 3,193 4-year 2,885 679 1,556 650 2-year 2,269 1,077 174 1,018 Less-than-2-year 1,820 214 81 1,525 Percent of all institutions Total institutions 100 28 26 46 4-year 41 10 22 9 2-year 33 15 2 15 Less-than-2-year 26 3 1 22 Source: U.S. Department of Education, National Center for Education Statistics, Integrated Postsecondary Education Data System, 2010-11, institutional characteristics component (special run).
Table 6. Undergraduate enrollment counts at Title IV institutions: 2010-11
Type of institution
12-month undergraduate
enrollment
Percent of undergraduate
enrollments
12-month FTE undergraduate
enrollment
Percent of FTE undergraduate
enrollments Total institutions 25,095,038 100 15,435,767 100 4-year 12,561,830 50 9,321,515 60 Public 7,547,034 30 5,657,848 37 Private non-profit 3,009,105 12 2,432,369 16 Private for-profit 2,005,691 8 1,231,298 8 2-year 11,865,210 47 5,635,057 37 Public 10,989,210 44 4,943,601 32 Private non-profit 60,575 <1 46,684 <1 Private for-profit 815,425 3 644,772 4 Less-than-2-year 667,998 3 479,168 3 Public 114,471 <1 66,393 <1 Private non-profit 24,933 <1 16,745 <1 Private for-profit 528,594 2 396,030 3 Note: FTE stands for full-time equivalent. Source: U.S. Department of Education, National Center for Education Statistics, Integrated Postsecondary Education Data System, Fall 2010, 12-month enrollment component. (Knapp, Kelly-Reid, and Ginder, 2011)
Table 7 summarizes the sub-baccalaureate sector, and shows that VET programs are offered by about 4,000 less-than-4-year institutions. In total, NCES counts suggest that the U.S. has about 6 million VET enrollments in about 30,000 programs at 4,000 institutions.
8

Table 7. Number and percent of postsecondary institutions of each type with VET programs, and number and percent of VET credentials awarded by each type of institution: 2010
Type of institution
Number of institutions awarding
credentials in VET
Percent of institutions awarding
credentials in VET
Number of VET
credentials awarded
Percent of VET
credentials Total, all institutions na na 1,410,146 100 4-year (baccalaureate) institutions
na na 242,925 17
Public na na 77,658 6 Private not-for-profit na na 40,570 3 For-profit na na 124,697 9 Less-than-4-year (sub-baccalaureate) institutions
4,050 100 1,167,221 83
Public 1,283 32 686,130 49 Private not-for-profit 239 6 27,032 2 For-profit 2,528 62 454,059 32 2-year institutions 2,237 55 914,057 65 Public (community colleges) 1,069 26 652,588 46 Private not-for-profit 160 4 13,900 1 For-profit 1,008 25 247,569 18 Less-than-2-year institutions 1,813 45 253,164 18 Public 214 5 33,542 2 Private not-for-profit 79 2 13,132 1 For-profit 1,520 38 206,490 15 na=not available. Source: U.S. Department of Education, National Center for Education Statistics, Integrated Postsecondary Education Data System 2009-10 Completions component and 2010-11 Institutional Characteristics component (special run).
A few points to note from these tables:
• Although sub-baccalaureate institutions are predominantly for-profit (or proprietary) institutions (62%), because these institutions are often small, they account for only 17% of full-time equivalent (FTE) sub-baccalaureate enrollments. In contrast, community colleges (public 2-year institutions) comprise 26% of all sub-baccalaureate institutions, but they enroll 81% of FTE sub-baccalaureate students.
• Sub-baccalaureate institutions are slightly weighted toward 2-year institutions (those offering associate’s degrees as their highest credential), with 55% percent falling into this category, while 45% are less-than-2-year institutions (offering certificates as their highest credential). Because of size differences, 2-year institutions enroll the vast majority of sub-baccalaureate students; they account for 95% of total enrollments and 92% of FTE enrollments.
• The public and private nonprofit VET sectors are dominated by 2-year institutions (83% and 68% respectively) while the for-profit sector is dominated by less-than-2-year institutions (67%).
9

A caveat. The text and tables above reflect the most accurate data available on postsecondary institutions and enrollments, as collected by NCES. But these data do have one important limitation. All postsecondary institutions in the U.S. that participate in the federal student aid program (often referred to as “Title IV” because the aid programs are authorized within Title IV of the Higher Education Act) are required to report a wide range of institutional data to the Secretary of Education; the estimates above are based on those reports, which NCES collects in its Integrated Postsecondary Education Data System (IPEDS). IPEDS provides excellent coverage of public and non-profit institutions, but it yields an under-coverage of for-profit institutions, as some for-profits (particularly smaller ones) choose not to participate in Title IV and thus do not report data to IPEDS. The amount of under-coverage is unknown, but a recent report based on an analysis of administrative records from five states estimates that the true number of for-profit institutions is twice what is counted in IPEDS, with the number of students in these institutions being about one-fourth to one-third higher than in IPEDS (Cellini and Goldin, 2012).4
4 The five states included in this study were Florida, Michigan, Missouri, Tennessee, and Wisconsin.
SIDEBAR: THE FOR-PROFIT SECTOR
Traditionally, proprietary institutions have provided many small, specialized VET training programs; the prototypical example is the school of cosmetology. However, factors such as the growing availability of federal student aid and trends toward the privatization of government services have led to recent growth and diversification in the proprietary sector (Clery, 2008), including among large, publicly traded proprietary schools (institutions such as Kaplan, DeVry, ITT, and Cappella).
Along with this growth have come increased concerns about the extent to which these institutions provide high-quality educational services. In 2010, the U.S. Government Accountability Office (the Congressional “watchdog” agency) found that in a covert investigation of 15 for-profit institutions, all 15 made “deceptive or otherwise questionable statements” as part of their student marketing (GAO, 2010). That same year, a number of for-profit education companies were investigated by Congress over concerns that their students leave school with extraordinarily heavy debts and little in the way of employable skills (Lewin, 2010). Concern about some players in the proprietary sector comes down to this: In some cases, these expensive institutions encourage students to rely heavily on federal loans. The students then leave school deeply in debt but with no marketable skills and so default on their loans, leaving students and taxpayers at a loss, while the institution profits.
Certainly, this is not the way most proprietary institutions operate. But there have been enough examples supporting these concerns that Congress has taken an interest. The “gainful employment” provisions that Congress recently proposed for the U.S. Department of Education’s program integrity regulations (see section on “Policy and Other Initiatives”) are designed to ensure that programs eligible for federal financial aid produce graduates who are capable of securing employment that allows them to pay off their student debts.
10

Where Students Enroll
Overall, most postsecondary VET students (68%) enroll at community colleges, but enrollment patterns vary by credential level. While three-quarters of VET associate’s-degree-seekers attend community colleges, certificate-seekers most often enroll at for-profit institutions (table 8). This distribution reflects the different nature of public versus for-profit institutions. For-profit institutions are roughly evenly divided between less-than-2-year institutions and 2-year institutions, and about one-third of students at for-profit 2-year institutions are certificate seekers (table 9). In comparison, only 7% of community college students are seeking a certificate.
Because of differences in the size of institutions, the mix of postsecondary VET providers differs depending on whether one looks at the number of institutions or the number of credentials awarded. The three largest providers on both measures are community colleges, for-profit 2-year institutions, and for-profit less-than-2-year institutions. But while for-profit less-than-2-year institutions out-number community colleges, community colleges far out-number both types of for-profit institutions in terms of the number of VET credentials awarded, with community colleges awarding almost half (46%) of all VET credentials.
Over time, the number of institutions of each type has grown, but growth has been largest in the for-profit sector. From 1997 to 2006, for example, the percentage of VET credentials awarded by community colleges remained constant, while the percentage awarded by both types of less-than-4-year for-profit institutions increased (Clery, 2008).
Table 8. Percentage distribution of credential-seeking sub-baccalaureate students, by type of institution: 2007-08
Type of institution All VET students
VET certificate
seekers
VET associate’s
degree seekers
Academic associate’s
degree seekers
4-year public 3 2 4 4 2-year public 68 39 75 85 Less-than-2-year public 1 6 <1 <1 Private non-profit 4 2 2 1 Private for-profit 19 47 13 5 More than one institution 6 4 7 9 Total, any institution 100 100 100 100 Source: CTE Statistics website, table P41; available at http://nces.ed.gov/surveys/ctes/tables/P41.asp. Original source: U.S. Department of Education, National Center for Education Statistics, 2007-08 National Postsecondary Student Aid Study.
11

Table 9. Credential program of postsecondary students, by institution type: 2007-08 Credential program Public 2-year For-profit 2-year
For-profit less-than-2-year
Certificate 7 36 98 Associate’s degree 79 62 na Bachelor’s degree 3 na na No credential sought 11 2 2 na = not applicable Source: U.S. Department of Education, 2011a. Original source: 2007-08 National Postsecondary Student Aid Study.
The Community College
As the single largest provider of VET and a key provider of public education generally, the community college is the most well-studied VET institution. Community colleges typically serve multiple missions, including preparation for 4-year education, workforce develop-ment, and adult basic education. In addition to VET, their offer-ings typically include noncredit courses and community services, noncredit federally supported workforce training, remedial education, fine and cultural arts, and general education and trans-fer courses (Katsina, Tollefson, and Reamey, 2008). But both within and across states, community colleges vary widely in their focus on these goals. About 80% of community college students are enrolled to earn an associate’s degree, with about 10% seeking a certificate, and another 10% not seeking a credential (U.S. Department of Education, 2010a).
SIDEBAR: HISTORY OF THE COMMUNITY COLLEGE
Community colleges pride themselves on the role they play in serving under-served populations: working adults, older students, and adult with lower levels of English-language or other skills. They also play a valuable role in supporting local economies, as community colleges build links with local employers and students usually stay in their community to work. As one analyst has noted: As a distinctly American invention, the comprehensive community college stands between secondary and higher [tertiary] education, between adult and higher education, and between industrial training and formal technical education. (Ratcliff, undated)
Community colleges developed from a range of influences. One such influence was the early 20th century growth of “junior colleges,” designed to provide students with the first two years of a bachelor’s degree education, leaving universities to focus on the more rigorous last two years. Another was the development of 2-year “normal schools,” designed to prepare teachers for the growing number of students enrolled in high school. In addition, various waves of interest in vocational education supported the growth of two-year technical institutes designed for post-high-school vocational preparation.
Over time, many of these institutions became either 4-year colleges or comprehensive community colleges, while others remained junior colleges or technical institutes/colleges. Roughly speaking, these institutions differ in terms of whether their mission focuses on general education for transfer to a 4-year institution (junior colleges), vocational preparation (tech-nical institutes) or both (community colleges). Each state has its own sub-baccalaureate system and may use this terminology differently. Wisconsin, for example, has both a community college system that focuses on general education and transfer (more like “junior colleges”), and a technical college system focusing on VET. A list of each state’s community colleges can be found at: http://www.utexas.edu/world/comcol/state/.
12

Community colleges tend to be adaptable institutions, which makes it easy for them to respond to local education and training needs, but at the cost of having their mission under constant scrutiny and subject to change. Although most analysts credit the community college with playing a vital role in increasing access to postsecondary education, providing valuable workforce training opportunities, and serving local needs for a variety of adult learning activities, these institutions have historically been viewed as “lower tier” (Grubb, 1996). In part, some of this image problem may stem from community colleges historical roots as “junior” colleges (see sidebar). But they are also less “prestigious” by design—they have open admissions, educate students who lack basic educational or occupational skills or are otherwise not prepared for 4-year college, focus on teaching rather than research, and award primarily sub-baccalaureate credentials. In 2010, only 32% of young Americans (ages 24-35) had at least a bachelor’s degree (U.S. Census Bureau, 2012), a figure that is likely to increase only incrementally at best. Yet, when parents of 9th-grade students were asked in 2009 what level of education they expect their child to attain, 70% said they expected their child to attain at least a bachelor’s degree (LoGerfo, Christopher, Flanagan, 2011).
State Level VET Information
Because each state’s VET system is different, it is difficult to summarize them. But a number of websites provide information about the postsecondary VET systems in individual states. Some of the most informative sites can be found at these links:
• The National Association of State Directors of Career and Technical Education Consortium (NASDCTEc) publishes a summary of each state’s enrollments, Perkins funding, Perkins accountability indicators, use of career clusters, and links to state CTE staff and other state resource. States’ Perkins-mandated “Consolidated Annual Report” (CAR) is one source for this information; note that the CAR allows each state to establish its own definition for CTE, so not all of the information is comparable across states: http://cteworks.careertech.org/state-profile/.
• The Association for Career and Technical Education (ACTE) publishes similar data, also relying in part on states’ CAR submissions. The ACTE site also includes information on states’ CTE delivery systems, workforce agendas, and a variety of other topics related to the Perkins Act and CTE reform, such as programs of study, dual credit (earning college credits while in high school), and business and industry involvement in CTE: http://www.acteonline.org/stateprofiles.aspx.
• The National Center for Education Statistics supports a CTE Statistics website that includes data on states’ postsecondary education delivery systems, program offerings, and credential awards, all as of 2006: http://nces.ed.gov/surveys/ctes/tables/index.asp?LEVEL=COLLEGE.
• The U.S. Department of Labor provides a listing of each state’s labor force and employment situation, including the size of the labor force, per capita income, education level of workers, unemployment rate, largest employers in the state, fastest growing
13

occupations, and other state employment resources: http://www.careerinfonet.org/select_state.asp?id=11&nodeid=12&next=state1.
• The Department of Commerce supports a list of state industry clusters that is available in beta version: http://clustermapping.us/index.html. (See also Annex C.)
WHO ENROLLS IN POSTSECONDARY VET
Postsecondary education students in the U.S. are a diverse group, differing widely in the extent to which they come from disadvantaged (low-income and low-education) backgrounds and the extent to which they are non-traditional students (older, part-time, or full-time-working students). In general, VET students tend to be disadvantaged and non-traditional compared with academic (liberal arts and sciences) students (Bailey et al., 2004), but this difference seems to arise more from a sorting by credential level than by field of study, with students seeking lower levels of credentials having more disadvantaged and non-traditional backgrounds than those seeking higher credentials (table 10). Specifically, certificate students tend to be more disadvantaged and non-traditional than associate’s degree students (even when compared with just VET associate’s degree students), as are associate’s degree students compared with bachelor’s degree students (even when just academic associate’s degree students are compared with bachelor’s degree students). Differences within education level are less consistent: Students seeking VET associate’s degrees tend to be older and from a lower educational background than academic associate’s degree students, but they are not more likely to be from a minority group or low-income background. These differences by credential level are reflected in differences among students who attend different types of postsecondary institutions (table 11).
One final point is worth noting before we move on to other topics. In spite of VET’s relatively high prevalence in postsecondary education, only a minority of American adults has a postsecondary VET credential. As of 2009, 19% of adults ages 18 or older had a postsecondary certificate or an associate’s degree (either VET or academic associate’s degree) (Ewert, 2012). Adjusting this figure based on the percentage of credentials awarded in VET (in table 7 above) yields 15% of adults with postsecondary VET credentials.
14

Table 10. Percentage of postsecondary students with each background characteristic, by student’s intended credential and curriculum area: 2007-08 Credential goal and curriculum area Female
White, non-Hispanic
Younger than 25
Lowest family income quartile
Parent has at least
bachelor’s degree
Bachelor’s degree students 55 67 76 22 50 Sub-baccalaureate students 59 58 55 28 29 VET 61 57 50 28 27 Academic 56 63 65 29 34 Associate’s degree students 58 59 57 28 30 VET 60 59 52 27 28 Academic 56 63 66 29 34 Certificate students 63 52 43 31 25 Note: Students are classified into “curriculum area” based on their major field of study. Sub-baccalaureate and associate’s degree totals include students with undeclared majors. Source: U.S. Department of Education, National Center for Education Statistics, 2007-08 National Postsecondary Student Aid Study (CTE Statistics web tables P45, P47)
Table 11. Percentage of postsecondary students with each background characteristic, by postsecondary institution type: 2007-08
Institution type Female
White, non-
Hispanic Younger than 24
Income in lowest quartile Parent
has bachelor’s
degree
Depen-dent
students
Indepen-dent
students Public or non-profit 4-year 55 67 73 20 28 51 Public 2-year 57 60 51 31 22 32 For-profit 2-year 69 45 42 53 38 20 For-profit less-than-2-year 77 39 51 53 45 18 Source: U.S. Department of Education, 2011a. Original source: U.S. Department of Education. National Center for Education Statistics, 2007-08 National Postsecondary Student Aid Study.
WORKPLACE TRAINING
Workplace training is not a systematic part of postsecondary VET in the U.S., and no federal agency currently collects data on it.5 Although most postsecondary students do work while they are in school, those jobs are typically not part of the student’s education program (Horn and Berktold, 1998). Given the relatively high mobility of American workers, U.S. employers prefer to leave the costs of entry-level training for semi-skilled and skilled jobs to individuals and the government; they have little incentive to offer workplace training opportunities for skills that can
5 The U.S. Department of Labor sponsored a survey of “employer-provided training” in the 1990s, but that survey was discontinued. Information on that survey can be found at: http://www.bls.gov/ept/. The U.S. Department of Education sponsored a survey of adult education that was discontinued after 2005; see http://nces.ed.gov/nhes/surveytopics_adult.asp.
15

be used by many employers.6 There are, however, exceptions, primarily in areas for which occupational certification or licensure requires job experience, and in selected technical institutions that offer internships as a distinctive part of their learning program. Many nursing programs, for example, have a clinical experience requirement. As another example, Drexel University, which offers engineering and IT programs as well as health-care programs, requires that all students complete an internship as part of their education. But Drexel is one of only a handful of U.S. colleges that have such an internship requirement.
Apprenticeships. While work-based learning can provide VET students with opportunities to work (for no pay) while in school, apprenticeship programs offer new workers opportunities to learn on-the-job (at reduced pay). Apprenticeships are only a minor feature of worker training in the United States. In an economy with about 36 million workforce entrants a year (Toossi, 2012), the federal government’s Registered Apprenticeship program trains about 500,000 workers annually, with an estimated additional 500,000-1,000,000 apprentices trained through other programs (Lerman, 2009). This low level of use reflects the lack of incentives within the U.S. for employers to participate in such programs. Labor unions are uncommon7 and federal and state governments typically do not provide much support for apprenticeships. The lack of external pressure and financial incentives, combined with high worker mobility rates, results in industry having little motivation to use apprenticeships for new worker training.
The state of South Carolina provides one notable exception to the relatively minor role of apprenticeships. South Carolina has developed a state-wide apprenticeship initiative supported with tax incentives and grants to the state’s technical colleges and businesses (see http://www.apprenticeshipcarolina.com/). Expanding this type of model could be advantageous for community colleges’ VET systems, but would face some hurdles. As one analyst has noted, policymakers “generally view the two approaches as distinct and substitutes for one another” (Lerman, 2009, p. 32)—as evidenced by federal funding for VET coming through the U.S. Department of Education and Registered Apprenticeships funds coming through the U.S. Department of Labor. Lerman (2009) also notes that the focus of apprenticeship programs on construction jobs (which often require little or no postsecondary education) is a further barrier to collaboration with community colleges, as is the need to coordinate various aspects of the training, such as course and work schedules, instructional curricula and employer needs, and the timing of new hires versus course initiation. Nonetheless, about 40% of apprentices receive at
6 For example, a recent New York Times article noted that the moving company Atlas World Group is increasingly finding it difficult to meet demand for qualified drivers by using federal job training programs; the Atlas CEO was quoted as saying that the company would consider providing its own training, if job applicants would “sign a piece of paper saying that when they graduate they will come to work for us for two years.” (Rich, 2012). 7 In 2011, 12% of all workers (and 7% of private-sector workers) were unionized. This is down from 20% of all workers in 1983, the first year for which data were collected (U.S. Bureau of Labor Statistics: http://www.bls.gov/news.release/union2.nr0.htm).
16

least some training from postsecondary institutions (mainly community colleges) (Lerman, 2009). More information on the government’s Registered Apprenticeship program is provided in the section on “Policy and Other Initiatives”.
STEERING AND GOVERNANCE
In recent years, many U.S. schools, state education departments, and other organizations have switched terminology from “vocational education” to “career and technical education” or “CTE”. This switch in terminology is part of an effort to re-invigorate and re-brand occupational education, moving from a traditional vision of “shop classes” where students work with their hands (and do little with their heads), to a more contemporary vision of high-tech education where students engage in applied learning with a strong academic foundation. Nonetheless, this change in terminology has not occurred universally. The variation in term usage reflects the highly decentralized nature of the American education system, with little federal control or guidance (especially at the postsecondary level) and a high degree of local and state variability deriving from the different political, social, and economic backgrounds of states and localities. So there really is no “system” of VET in the United States. At best, there are 51 public “systems” (including the 50 states and the District of Columbia), along with thousands of private “systems”, as each private postsecondary institution operates fairly independently.
This is not to suggest that the federal government plays no role in post-secondary education. Historically, the federal government has contributed significantly to postsecondary educa-tion in a number of ways. First and perhaps foremost, the Morrill land-grant legislation of the 1800s set aside land for each state to create a college to provide instruction in “agriculture and the mechanic arts [engineering].” Over time, these colleges were largely folded into what is today’s U.S. state univer-sity system. More recently, the post-World-War-II GI Bill made college (including VET) affordable for millions of returning military veterans in the 1940s and 1950s. Finally, in recent
SIDEBAR: THE PERKINS ACT
Since 1914, federal legislation has provided funds for schools to support VET. This legislation, currently enacted as the 2006 Carl D. Perkins Career and Technical Education Act (the Perkins Act), allocates funding for CTE to the states, which then distribute funds to their public-sector secondary and post-secondary education institutions. The act provides for a broad range of “allowable uses” for these funds, but the overall purpose of the act is to encourage and assist states and localities in reforming CTE through increased academic rigor, stronger alignment between secondary and postsecondary levels, and a tighter focus on high-wage, high-demand occupations. The later section on “Policy and Other Initiatives” provides more detail on the Perkins Act, and Annex A describes the allocation of Perkins funds to states and localities.
The Perkins Act is scheduled to be reauthorized in 2013. In anticipation of this reauthorization, the U.S. Department of Education has released a “Blueprint” for CTE, outlining the Administration’s goals for the new legislation: http://www2.ed.gov/about/offices/list/ovae/pi/cte/transforming-career-technical-education.pdf.
17

decades, the federal government has played an increasing role in the provision of financial aid for students. As of 2010-11, 66% of the financial aid students received (loans, grants, and work-study funds)—a total of about $150 billion dollars—came from federal sources.8 In the specific area of VET, the federal government also provides funds to states, through the Carl D. Perkins Act, to support VET programs at the secondary and postsecondary levels (see sidebar). Although this funding is small when compared with overall education funding (see “Funding and Incentives” section below), it is important to schools because they have wide flexibility in how these funds are spent, and it is important to Congress as a mechanism for leveraging change in the VET system.
Governance Systems
The past 50 years or so has seen a trend toward the establishment of state-level coordinating or governing boards for public postsecondary education. This trend resulted in large part from the growth of postsecondary education during the 1960s and 1970s; this growing system needed to be managed in order to minimize duplication, ensure the best allocation of resources, and provide a balanced range of postsecondary educational opportunities. The federal Education Amendments of 1972 also encouraged states to develop state-level governance, as these amendments required that states have postsecondary education planning commissions in order to be eligible for certain federal grants (McGuiness, 2002). The amount of control that is delegated to state boards varies from state to state (and within states, over time). In some states, state-level oversight focuses on regulatory policies and practices, while in others, it has expanded into a policy leadership role.
A list of each state’s postsecondary VET administrative structure can be found in Annex A. In most states, the oversight for postsecondary VET resides with the state board of education, but in a few states it resides with a state-level economic development office. Some states have separate postsecondary governing boards for their community college systems. As one example, the state of Kentucky has a community and technical college system governed by a 14-member board of regents and administered by a system president and cabinet. The state of North Carolina is somewhat unusual in that it has both a State Board of Community Colleges and a State Board of Proprietary Schools. In additional, each state governor typically has one or more education advisors to help shape education policy. Some governors choose to be “education governors”, actively fostering legislative change in a state’s elementary/secondary or postsecondary systems.
In spite of growing state oversight, postsecondary VET in the U.S. is still largely decentralized; it is perhaps because of this decentralization that the postsecondary VET system is highly dynamic and adapted to the demands of students, employers, and local labor markets. Programs tend to be
8 Including federal education tax benefits, the figure increases to72%, of total aid, or about $170 billion. Statistics are from the College Board (2011). Full report at http://trends.collegeboard.org/student_aid/.
18

swiftly established in areas of new student and employer demand. VET demand may be assessed through a variety of means, including institutions’ employer advisory boards, state or regional economic planning boards, or other state or regional labor offices, well as by enrollment trends. Private and for-profit institutions in particular tend to be demand-driven, while public institutions are more subject to supply-side constraints due to their reliance on public funding. During the current economic downturn, for example, some community colleges have been faced with fewer state funds and increasing student demand, resulting in waiting lists for entry into specific programs or courses.
As one might expect in a highly decentralized system with mixed public and for-profit provision, quality is highly uneven. State oversight varies across states, but provides some degree of consistency across public institutions; private institutions, free of this state system of checks-and-balances, tend to be more variable in quality. To the extent that a meaningful system of quality assurance exists, it is embedded in the accreditation of programs and institutions by industry and professional bodies, most especially in fields like the health professions, and in the accountability imposed by occupational certification and licensing requirements.
Institutional and Programmatic Accreditation
The U.S. postsecondary education system uses two levels of accreditation—institution level and program level—both of which operate through a voluntary, peer-driven process. Institutions may seek accreditation because (1) it conveys legitimacy to the public and prospective students; (2) it is sometimes required in order to obtain program accreditation; and/or (3) it is required in order for the institution to be eligible for participation in federal student financial aid (Title IV) programs. For the latter purpose, the U.S. Department of Education maintains a list of 39 federally recognized accrediting bodies.9 For all accreditation purposes, the non-governmental Council for Higher Education Accreditation (CHEA) recognizes 60 accrediting bodies, many of which overlap with the U.S. Department of Education list. The CHEA accrediting bodies include eight accrediting organizations that each cover a specific region of the country, a few faith-based accrediting organizations (e.g., for rabbinical or theological schools), a few career-related organizations that accredit mainly proprietary (for-profit) VET institutions, and about 40 specialized organizations that accredit programs within specific disciplines, or single-discipline institutions (e.g., a school of cosmetology or nursing). The accreditation process examines whether an institution “operates on a sound financial basis, has an approved program of study, qualified instructors, adequate facilities and equipment, and approved recruitment and admissions policies” (Welch, undated); it thus provides a basic indication of an institutions’ ability to operate, rather than a rigorous indication of institutional quality.
9 The list of approved accrediting bodies and further information on the government’s use of accreditation for federal student aid purposes can be found at http://ope.ed.gov/accreditation/.
19

For most VET students, the accreditation that matters most is programmatic, as this accreditation is often linked to occupational certification and licensing requirements, which in turn often feed into hiring requirements.10 The decision-making body for programmatic accreditation is typically composed mainly of practitioners and educators within the discipline; in effect, the occupations are responsible for the review and attestation of the quality of their VET programs. The quality of these accreditation programs likely varies across fields, and may be higher for programs that involve professional certification, as the certification process carries its own quality assurance requirements. Table 12 lists a few of the accrediting bodies recognized by the American National Standards Institute (ANSI), all of which provide certification, registration, or licensure.
Table 12. List of accrediting agencies that establish occupational credentialing standards for certification, registration, or licensure Recognized accrediting agency Approved standards for: American Board of Industrial Hygiene Certified Industrial Hygienist American Registry for Diagnostic Medical Sonography
Registered diagnostic cardiac sonographer Registered diagnostic medical sonographer Registered physician in vascular interpretation Registered vascular technologist
Computing Technology Industry Association (CompTIA)
CompTIA A+ CompTIA Advanced Security Practitioner CompTIA Network+ CompTIA Security+
American Society for Clinical Pathology Cytotechnologist Histotechnician Histotechnologist Medical laboratory scientist Medical laboratory technician Pathologists’ assistant Phlebotomy technician Specialist in cytotechnology Technologist in molecular biology
Environmental Health Testing, LLC International certified food safety manager InfoComm International Certified technology specialist
Certified technology specialist – design Certified technology specialist – installation
Manufacturing Skill Standards Council MSSC – Certified logistics technician MSSC – Certified production technician
National Inspection Testing Certification Corporation
Fire sprinklerfitter certification HVAC mastery certification Medical gas installer Medical gas instructor Medical gas verifier
Source: https://www.ansica.org/wwwversion2/outside/Default.asp
10 For example, an occupational therapist typically cannot be hired without state or national certification. But only graduates of postsecondary programs approved by the Accreditation Council for Occupational Therapy Education can sit for the national certification examination.
20

ACCESS AND EQUITY
As part of sub-baccalaureate education, postsecondary VET in the U.S. is a fairly open-access system. As noted in table 1, many sub-baccalaureate institutions, particularly community colleges, have open admissions—the entry requirement is simply graduation from high school (or the equivalent). There are exceptions, most notably in the health-care fields, where specific programs may have more stringent requirements. And, as discussed below in the section on remedial education, getting into a postsecondary school is not necessarily the same as getting into credit-bearing postsecondary courses. In addition, most VET programs are, by design, terminal degree programs that do not articulate into higher-level programs. Certificate programs are most often intended for job entry, not for transition into associate’s degree or bachelor’s degree programs. Likewise, a VET associate’s degree is also designed for job entry. This does not mean that VET students cannot go on to further education, and in some areas, such as nursing, career ladders and linked educational programs offer a stepwise progression of educational credentials. But, generally speaking, students enroll in VET programs because they want to prepare to enter the workforce, rather than to continue their education beyond their initial credential goal, and VET programs are designed to serve this purpose.
Community colleges’ open-admissions policy, while valued for the accessibility it offers, may leave high school students with the impression that what one does in high school is irrelevant to succeeding in community college (Rosenbaum, 2001). One analyst has suggested that this mistaken impression often results in community colleges’ open door becoming a revolving door, as students enter and then drop out when they realize they do not have the skills needed for college level work (Parnell, 1991). Nonetheless, open admissions is crucial to ensuring access to higher education, a key goal of both the U.S. Department of Education and many state governments.
Other ways in which many postsecondary VET (and academic) programs maximize access is by offering part-time, evening, and/or weekend courses in addition to full-time programs. About 70% of community college students attend part-time, as do about 30% of for-profit students (U.S. Department of Education, 2012). Most postsecondary institutions also offer a range of student support services, including tutoring, counseling, transportation, and/or child care.
The most significant access issue in postsecondary VET (as in postsecondary education in general) is cost. Student financial aid, federal aid in particular, is one factor that can help mitigate this cost.
Student Financial Aid
Students can receive education grants (which do not need to be repaid) or loans from a variety of sources, including the federal government, state governments, postsecondary institutions, or private sources (such as employers). As seen in table 13, federal grants and loans are the largest
21

source of student aid, accounting for 72% of students’ total aid. A detailed overview of the different sources of student financial aid is provided in: http://trends.collegeboard.org/sites/default/files/Student_Aid_2011.pdf
Table 13. Sources and amount of student aid (in millions, constant 2010 dollars): 2000-01 and 2010-11 Source of Aid 2000-01 2010-2011 Federal Programs Federal grants Pell Grants $ 10,038 $ 34,762 Other grants $ 4,026 $ 14,303 Total federal grants $ 14,064 $ 49,065 Federal loans $ 43,453 $103,995 Federal work-study $ 1,185 $ 1,171 Education tax benefits $ 5,310 $ 14,830 Total federal aid $ 64,012 $169,061 State grants $ 6,013 $ 9,207 Institutional grants $ 20,490 $ 38,110 Nonfederal loans (state, institution, or private)
$ 6,430 $ 7,878
Total aid $104,325 $235,089 Source: Trends in Student Aid 2011 (College Board, 2011a)
Federal Student Aid
In the 1960s, Congress passed the first federal legislation designed to increase educational access and equity, making federal need-based grants (Pell grants) and guaranteed student loans available to full-time students seeking bachelor’s degrees. 11 Although loans were included in the legislation, the original focus was on need-based grants that do not have to be repaid (as well as on work-study programs for low-income students). During reauthorization of the Higher Education Act in 1972, eligibility for federal aid was expanded to part-time students and to students at community colleges, technical colleges, and trade schools, including for-profit institutions. Although that legislation opened up federal aid to almost all postsecondary students, subsequent legislation shrank the amount of federal aid available through Pell grants and increased the amount available through loans. This situation was reversed somewhat in 2009-10, when Congress increased Pell grant funding by two-thirds. However, as of 2010-11, student loans comprised the majority (62%) of federal aid (see table 13).
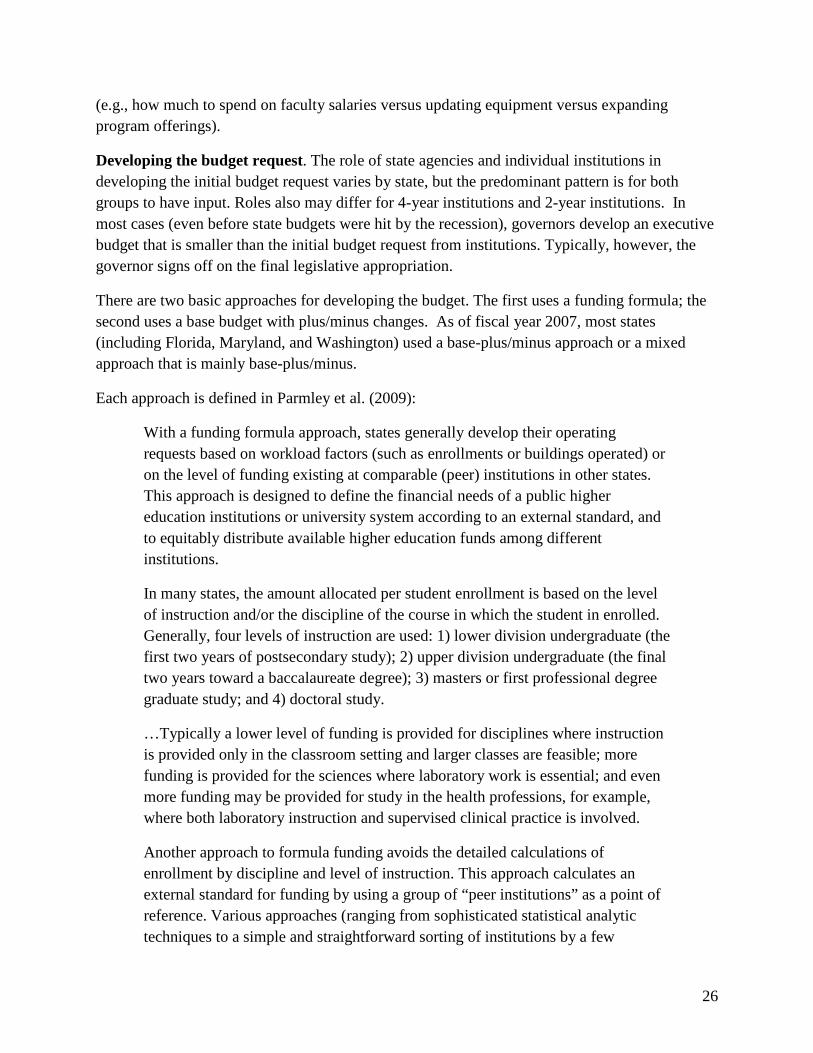
Although the amount of federal aid available to students has increased in recent decades, tuition and other college costs increased as well, rising faster than the cost of living. As a result, from 1995-96 to 2007-08, the “average net price” (price of attendance minus all grants) paid by
11 The historical information in this paragraph is from Gladieux (1995).
22

community college students increased from $5,200 to $6,200 (U.S. Department of Education, 2011b). Even taking into account loans, the average out-of-pocket net price (price of attendance minus all grants and loans) paid by these students increased from $4,900 to $5,400. For students in for-profit institutions, average net price increased from $13,800 to $18,400 from 1995-96 to 2007-08 and average out-of-pocket net price increased from $9,500 to $10,200. (All amounts in constant 2008 dollars.) In other words, even with an increasing infusion of federal aid, the affordability of the institutions that provide postsecondary VET has not, on average, increased.
Another financial aid issue is the associated debt that students accrue. As previously mentioned, loan debt is primarily a concern for VET students in the for-profit sector, where most students take out loans; these students also tend to borrow the largest amounts (see table 14). Because community colleges are subsidized by the state and their programs are relatively short, community college students are the least likely to take out student loans and take out the smallest amount of loans. But even for these students, loan debt may be problematic, particularly in a weak economy with high unemployment. Further compounding the student loan debt issue is the fact that student loans, unlike most other forms of debt, are not dischargeable under personal bankruptcy law.
Table 14. Percent of undergraduates who have ever received federal student loans and the average cumulative amount borrowed, by type of institution: 1989-90 and 2007-08
Type of institution
1989-90 2007-08 Percent
who ever borrowed
Average cumulative
amount1
Percent who ever borrowed
Average cumulative
amount
Total, all institutions 27 $ 7,100 46 $10,300 Public 4-year 29 $ 7,400 53 $11,100 Private non-profit 4-year 39 $ 8,700 62 $11,400 Public 2-year 12 $ 5,600 24 $ 7,700 Private for-profit 71 $ 6,400 92 $10,500 1In constant 2008 dollars. Source: U.S. Department of Education, 2010b. Original source: 1989-90 and 2007-08 National Postsecondary Student Aid Studies.
State Support
State funding for community colleges and state need-based aid also play a large role in ensuring access to postsecondary VET. In recent decades, however, competing demands on state resources (such as Medicaid and corrections) have made it more challenging to maintain state support (Bailey, 2006). The economic recession has added to this challenge, increasing concerns about states’ ability to provide affordable education, as tuitions rise and state-level need-based aid shrink (Katsinas, Tollefson, and Reamey, 2008; Hurley et al., 2012). State appropriations per full-time student declined by 9% in 2008-09, 6% in 2009-10, and 4% in 2010-11 (College Board, 2011b). The American Association of State Colleges and Universities recently summed up the issue as follows:
23

The cascading effect of the lackluster domestic economy on higher education was felt in its most acute form yet, with 2011 marking a new low point in state funding for public colleges and universities. Hundreds of millions of dollars in funding cuts, combined with increasing student enrollments, resulted in per-student funding reaching a 30-year low…For many, 2011 seemed to have marked a somber turning point in which the major stock owner of the American public university switched hands—from that of the collective taxpayer, through funding allocated by the state, to that of students and their families, through funding paid for via tuition payments.” (Hurley et al, 2012, p.1)
In fact, for the past four years, the American Association of State Colleges and Universities has ranked state funding for postsecondary education at the top of its list of “hot issues” in higher education state policy (Hurley et al, 2012). One high-profile example of this state-funding issue recently occurred in California, where Santa Monica College (a community college) proposed to offer “two tier pricing”, raising the fees for select high-demand courses from $46 per credit-unit to about $200 per credit-unit (Rivera, 2012). In response to concerns about the legality and fairness of this proposal, it has (as of this writing) been put on hold.
FUNDING AND INCENTIVES
As Table 15 indicates, funding for postsecondary VET is both highly diversified and decentralized, with the leading role played by federal student aid (provided by the U.S. Department of Education to students) and funding from the states (both to fund institutions directly and to support students). The vast majority of federal funds for postsecondary education are for student financial aid. In addition to the major federal programs listed in Table 15, a few other federal programs provide funding for selected programs or student groups (e.g. U.S. Department of Agriculture funds for extension programs), and institution and private grants (including those from employers) also help support students. This general picture varies, however, depending on the sector of the institution involved; public institutions such as community colleges are highly subsidized by states (with the amount of subsidy varying by state) while private institutions rely more heavily on payments from students and their families, often with the assistance of federal student aid.
Generally, the funding provided to both institutions and students is program-neutral. Some states may use a slightly higher weight to fund VET programs that require special facilities and equipment, but typically funding is based on expenditure categories that cut across programs (e.g., enrollment counts). Federal student aid programs, and most other student aid programs, are similarly program-neutral. Need-based aid is also program-neutral, depending on tuition costs (which are typically credit-based) and family income.
24

Table 15. Revenue sources and amount estimates for postsecondary VET in the United States: 2007-08 Revenue Source for Postsecondary VET
Dollars, in billions
Federal sources (total) $30.8 Federal student aid (Title IV of the Higher Education Opportunity Act) $20.7 Federal tax expenditures for postsecondary education (credits, deductions, 2009) $ 8.1 Veterans educational benefits (2009) $ 1.1 Trade Adjustment Assistance $ 0.5 Workforce Investment Act (WIA, postsecondary share) $ 0.5 Perkins Act $ 0.4 State sources (total) $16.9 State and local appropriations to public 2-year institutions $14.3 State grants to students $ 2.6 Institution and other sources (total) $10.0 Institutional grants to students $ 7.5 Private and employer grants $ 2.5 Student/family payments $ 9.7 Total $67.9 Note: These estimates assume that VET comprises 60 percent of sub-baccalaureate enrollment, 33 percent of under-graduate enrollment, and 25 percent of total postsecondary enrollment. All revenues are prorated by the VET share of total, undergraduate, or sub-baccalaureate enrollments, as appropriate. Data are for years 2007-8 academic year, unless otherwise noted.
The Within-State Funding Process
Most of sub-baccalaureate education is provided by public institutions that are state supported. This section reviews how the state funding process works for public postsecondary education.12
The state budget process occurs in six steps, typically on an annual or biennial cycle:
1. Budget request is developed, by institutions and/or a state governing or coordinating board. 2. Request is sent to the state legislative and state executive branches for review. 3. Governor proposes a budget (the “executive” budget). 4. Legislature enacts its desired budget. 5. Governor signs legislative budget or may amend it by vetoing parts. 6. (If governor amends) Legislature accepts or over-rides governor’s action (the result is the legislative appropriation).
The overall goal of the budgeting process is to provide adequate funding to meet policymakers’ goals for postsecondary education. But the process is complicated by the number of policymakers involved (various legislative bodies and the governor) and by the fact that sufficient funds to meet all policymakers’ goals are rarely available, forcing budgetary trade-offs
12 This section draws heavily from Parmley, Bell, L’Orange and Lingenfelter (2009), which describes state budgetary processes as of fiscal year 2007.
25
(e.g., how much to spend on faculty salaries versus updating equipment versus expanding program offerings).
Developing the budget request. The role of state agencies and individual institutions in developing the initial budget request varies by state, but the predominant pattern is for both groups to have input. Roles also may differ for 4-year institutions and 2-year institutions. In most cases (even before state budgets were hit by the recession), governors develop an executive budget that is smaller than the initial budget request from institutions. Typically, however, the governor signs off on the final legislative appropriation.
There are two basic approaches for developing the budget. The first uses a funding formula; the second uses a base budget with plus/minus changes. As of fiscal year 2007, most states (including Florida, Maryland, and Washington) used a base-plus/minus approach or a mixed approach that is mainly base-plus/minus.
Each approach is defined in Parmley et al. (2009):
With a funding formula approach, states generally develop their operating requests based on workload factors (such as enrollments or buildings operated) or on the level of funding existing at comparable (peer) institutions in other states. This approach is designed to define the financial needs of a public higher education institutions or university system according to an external standard, and to equitably distribute available higher education funds among different institutions.
In many states, the amount allocated per student enrollment is based on the level of instruction and/or the discipline of the course in which the student in enrolled. Generally, four levels of instruction are used: 1) lower division undergraduate (the first two years of postsecondary study); 2) upper division undergraduate (the final two years toward a baccalaureate degree); 3) masters or first professional degree graduate study; and 4) doctoral study.
…Typically a lower level of funding is provided for disciplines where instruction is provided only in the classroom setting and larger classes are feasible; more funding is provided for the sciences where laboratory work is essential; and even more funding may be provided for study in the health professions, for example, where both laboratory instruction and supervised clinical practice is involved.
Another approach to formula funding avoids the detailed calculations of enrollment by discipline and level of instruction. This approach calculates an external standard for funding by using a group of “peer institutions” as a point of reference. Various approaches (ranging from sophisticated statistical analytic techniques to a simple and straightforward sorting of institutions by a few
26

categorical variables) are used to develop peer groups…Clearly, the institutions included in the peer group determine the level of funding required by the formula; unsurprisingly, the selection of “peer institutions” can be a matter of intense negotiation.
Base plus/minus funding or “incremental funding” involves setting the current year’s funding through an increase or decrease of the prior year’s allocation based on a set of decisions about needs and priorities. Such decisions typically include some of the elements which may be considered in formulas: changes in enrollment, cost increases, salary increases, the operative costs of new buildings, etc. Typically, budget changes involve increases for such factors, but occasionally they might include decreases if an institution’s enrollment declines or if its costs are judged to be excessive in the context of funding for other institutions. Budgets may also be reduced differentially among institutions or programs or across the board if a state experiences a revenue shortfall.
Base plus/minus budgeting frequently uses external benchmarks to judge the adequacy of funding, without basing funding directly on benchmarks or a calculated formula. A few states, including Illinois, New York, Ohio, Washington, and Florida, regularly perform annual or periodic studies of instructional costs which can be used to monitor the equity of funding among institutions and the distribution of resources. Even states without such studies frequently make comparisons of faculty salaries and institutional funding with reference to other, similar institutions elsewhere. (pp.10-11)
Related to the budget setting process is the process of setting tuition. At least half the states have tuition-setting philosophies formalized in their constitution, legislative statutes, or state rules or policy (Bell, Carnahan, and L’Orange, 2011). A 2010-11 survey of state fiscal officers identified a number of guiding principles for establishing tuition rates, including state budget requirements, access and affordability concerns, institutional mission, and state constitutional mandates or other guiding documents; tuition charges at peer institutions in neighboring states are also sometimes considered (Bell, Carnahan, and L’Orange, 2011).
Many states have separate tuition policies for their 2-year and 4-year institutions. In most states, 2-year institutions have lower tuitions than 4-year institutions, in order to ensure access, foster workforce training, and/or meet affordability goals. In some states, differences in tuition between the sectors arise from the existence of separate state boards for each sector. States typically use a multi-step process for setting tuition rates, involving multiple players. Table 16 describes who has primary responsibility in each of the states. More details on how states determine tuition can be found at http://www.sheeo.org/resources/publications/state-tuition-fees-and-financial-assistance-policies.
27

Table 16. Primary tuition-setting authority in each state: 2010-11 Legislature (3)
Statewide coordinating or governing agency for multiple systems (11)
Coordinating or governing boards for individual systems (19)
Local district governing boards (2)
Individual institutions (10)
California Florida Louisiana
Colorado Hawaii Idaho Iowa Kentucky Montana North Carolina North Dakota Oklahoma South Dakota Utah
Alaska Arizona Connecticut Georgia Illinois Kansas Maine Maryland Minnesota Mississippi Nebraska New Hampshire New York Pennsylvania Tennessee Texas Vermont West Virginia Wisconsin
New Mexico Oregon
Alabama Arkansas Delaware Indiana Massachusetts Missouri Ohio South Carolina Virginia Wyoming
Note: Information is not available for the following 5 states that did not respond to the tuition-policy survey: Michigan, New Jersey, Rhode Island, Nevada, and Washington. Source: Bell, Carnahan, and L’Orange (2011)
Performance-based funding. The process outlined above describes the traditional method of funding postsecondary institutions based on inputs (size, etc.). An alternative (or more often, supplemental) method is to have at least some funding based on outputs. Such performance-based funding has been around for a while—with mixed success—but is of particular interest to policymakers today as concerns about accountability have grown and new methods for implementing performance-based funding have evolved. As of 2011, 17 states had or were considering implementing performance-based funding for their postsecondary institutions (Harnish, 2011). Performance-based funding allows states to link funding to policy goals and to institutional quality or improvement. But it also has been criticized for over-simplifying and distorting institutions’ goals and for increasing funding inequality and instability. Perhaps because of these concerns, there is currently no consensus on how performance-based funding should be implemented; even among the states that use it, there is a great deal of variation in the
28

number and type of performance measures used and in the percentage of total funding that is performance-based.13
Resourcing of Community Colleges. Even though community colleges are considered positive additions to the American postsecondary landscape—especially for increasing access to college and filling an important niche for work-force training—they tend to receive fewer resources than their 4-year counterparts. As shown in table 17, community colleges have only about 36% of the revenue of their 4-year public institution counterparts, and they have lower revenue levels than any other institution type, including other 2-year institutions.
Table 17. Revenue per full-time-equivalent student at public degree-granting institutions: 2008-09 Type of institution
Total revenues
Tuition and fees1
Appropriations, grants, and contracts All other Federal State Local
4-year public $35,252 $ 7,082 $ 5,300 $ 12,505 $ 1,571 $ 8,794 2-year public $12,991 $ 2,132 $ 2,122 $ 4,459 $ 2,551 $ 1,727 4-year private non-profit
$22,448 $17,473 $ 6,859 $ 588 $ 188 $ 2,660
2-year private non-profit
$17,203 $11,516 $ 2,270 $ 788 $ 24 $ 2,605
4-year for-profit $15,059 $13,220 $ 916 $ 82 $ 841 2-year for-profit $15,685 $12,886 $ 1,736 $ 171 $ 892 1Excludes scholarships and fellowships. Source: Snyder and Dillow (2011), pp.513-514, 519, 521. Original source: U.S. Department of Education, National Center for Education Statistics, 2007-08 Integrated Postsecondary Education Data System, Spring 2009.
Likewise, community college expenditures are one-third as large as those of public 4-year institutions (table 18). Part of the reason for this difference is that the latter tend to have larger research and community support programs; community colleges focus fairly exclusively on teaching.14 But even comparing expenditures on direct student services (defined here as instruction, academic support, and student services), community college expenditures are only half that of public 4-year institutions. This difference also exists in the private nonprofit sector, but in that sector, spending on direct student services is relatively high, so that 2-year non-profits still spend 60% more than community colleges on direct student services. In the for-profit sector, the situation is reversed, perhaps because of 4-year for-profit institutions’ reliance on (relatively low-cost) on-line learning.
13 Harnisch (2011) provides an overview of the current status of performance-based funding in the states. 14 It should be noted that community colleges provide community support through many of their offerings, such as adult basic education courses, English-as-a-second-language courses, and noncredit courses for personal interest. What they provide less frequently than 4-year public institutions is community support that is not instructionally related.
29

Likewise, even when one compares what institutions spend on instruction, although community colleges spend a higher proportion of their funds on instruction (Mullin, 2010), they pay their faculty less than other institutions. The average salary of full-time faculty at a community college in 2008-09 was $60,587, compared to $74,209 at public 4-year institutions (Snyder and Dillow, 2010; Mullin, 2010). Some analysts have suggested that this salary discrepancy may contribute to the relatively low persistence and completion rates among community college students (discussed in a later section) (Bound, Lovenheim, and Turner, 2009).
Student Costs. Another way to examine funding is to look at how much VET students are charged for their education and how they cover those charges. As noted above, institutions don’t typically charge VET students more or less than students in other programs (of equivalent duration or credit-units), so this section looks at charges by institution type—which is where the variability in charges is most significant. Four-year institutions are included here for comparison purposes; however, as previously mentioned, VET encompasses sub-baccalaureate education, which is predominantly provided by less-than-4-year institutions.
As seen in table 19, private institutions cost more than public institutions, with for-profit institutions having the highest costs. Student loans and grants help to mitigate these costs, so that students’ “net price” can be substantially lower than the “sticker price” (tables 19 and 20). However, even though for-profit students receive more financial aid than community college students, the net price for attending for-profit institutions is still higher than the net price for attending community colleges.
30

Table 18. Expenditures per full-time-equivalent student at degree-granting institutions: 2008-09
Type of institution
Total, all expen-ditures
Direct student services Scholar-ships and fellow-ships
Public service
Research
All other
Total
Instruction
Academic
support
Student services
4-year public $36,707 $13,222 $ 9,327 $ 2,492 $ 1,403 $ 1,166 $ 1,710 $ 4,337 $16,272 2-year public $12,153 $ 6,539 $ 4,542 $ 894 $ 1,103 $ 1,007 $ 190 $ 6 $ 4,411 4-year private non-profit
$46,080 $22,825 $15,143 $ 4,102 $ 3,580 $ 246a $ 751 $ 4,993 $17,265
2-year private non-profit
$19,129 $10,641 $ 6,405 $ 1,599 $ 2,637 $ 276a $ 139 $ 13 $ 8,060
4-year for-profit
$12,654 (na) $ 2,633 (na) (na) $ 34a $ 8 $ 9,979b
2-year for-profit
$13,498 (na) $ 4,394 (na) (na) $ 38a $ 8 $ 9,058b
a Net grant aid to students. b Not comparable to other types of institutions because these cells include “Academic support” and “Student services”. (na) Not available separately for these institutions. Source: Snyder and Dillow, 2011, pp.526-527,529-530, 532-533. Original source: U.S. Department of Education, National Center for Education Statistics, 2007-08 Integrated Postsecondary Education Data System, Spring 2009.
31

Table 19. Costs faced by students at postsecondary institutions, by type of institution, 2007-08 Institution type
Median tuition
and fees
Median price of
attendance
Average tuition and
fees
Average price of
attendance Total, all institutions $ 2,800 $11,000 $ 5,800 $14,000 Public 4-year institutions $ 4,800 $15,500 $ 5,500 $15,300 Private non-profit 4-year institutions $18,700 $29,300 $17,800 $28,300 Public 2-year institutions $ 800 $ 6,200 $ 1,200 $ 7,000 Public less-than-2-year institutions ǂ $ 8,900 $ 2,900 ! $ 9,800 Private, non-profit less-than-4-year institutions
$ 5,000 $14,300 $ 6,700 $14,900
For-profit institutions $8,400 $19,300 $10,200 $20,600 ǂ Reporting standards not met. ! Interpret data with caution (estimates are unstable). Note: Price of attendance is the total amount institutions estimate that undergraduate-level full-time, first-time degree/certificate-seeking students will pay to attend before financial aid is considered. This price includes tuition and fees, books and supplies, room and board, and certain other designated expenses such as transportation. Source: U.S. Department of Education, National Center for Education Statistics, 2007-08 National Postsecondary Student Aid Study. For more tables on student financing of undergraduate education, see http://nces.ed.gov/pubsearch/pubsinfo.asp?pubid=2010162.
32
Table 20. Sources of student financial aid and students’ net price, 2007-08 Percent of undergraduates receiving aid (and average amount received)
Average net price
Average out-of-pocket
net price
Institution type
Any aid
Any grants
Any work-study
Any loans
Any other type of aid
Total, all institutions 66 ($ 9,100) 52 ($ 4,900) 7 ($ 2,400) 39 ($ 7,100) 7 ($ 8,100) $11,500 $ 8,000 Public 4-year institutions 71 ($ 9,400) 53 ($ 5,200) 8 ($ 2,500) 46 ($ 6,600) 9 ($ 8,200) $15,200 $ 8,600 Private non-profit 4-year institutions
85 ($17,400) 74 ($10,200) 23 ($ 2,100) 59 ($ 9,100) 11 ($12.200) $28,300 $13,500
Public 2-year institutions 48 ($ 3,400) 40 ($ 2,200) 3 ($ 3,000) 13 ($ 4,100) 3 ($ 3,600) $ 6,200 $ 5,400 Public less-than-2-year institutions
54 ($ 4,700) 45 ($ 2,700) na 18 ($ 700) 11 ($ 3,000) $ 8,600 $ 7,200
Private, non-profit less-than-4-year institutions
85 ($ 7,800) 74 ($ 4,000) 23 ($ 2,000) 59 ($ 7,000) 11 ($ 7,400) $12,500 $ 8,700
For-profit institutions 96 ($10,800) 70 ( 3,200) 2 ($ 3,500) 92 ($ 8,100) 9 ($ 7,900) $18,400 $10,200 na = not available Note: Average net price is the price of attendance minus all grants. Average out-of-pocket net price is the price of attendance minus total aid. Source: U.S. Department of Education, 2010c and special runs. Original source: U.S. Department of Education, National Center for Education Statistics, 2007-08 National Postsecondary Student Aid Study.
33

THE ROLE OF EMPLOYERS
As is true for virtually everything else in the American postsecondary education system, the role of employers in VET is idiosyncratic and highly variable. Generally speaking, their roles are determined at the institution level or program level, and typically involve employers serving in some type of advisory capacity, for example, serving on advisory boards or governing boards. In addition, employers have two main avenues through which they provide financial support to postsecondary VET. First they can provide tuition support to their workers. In 1995, NCES found that six percent of all undergraduates reported receiving employer aid for school 1995-96, with an average aid amount of $932 per student (Lee and Clery 1999). Larger employers are more likely than smaller employers to offer this type of support, and it is most commonly offered to workers in higher level and more skilled positions (who employers may feel are more difficult to replace) (Creighton and Hudson, 2002). Although we don’t have hard data on this, it is likely that employer support for VET is sometimes intended to help employees maintain the occupational certification or licensure necessary for their jobs.
The second major way in which employers financially support postsecondary VET is by sponsoring contract (or customized) training, in which employers contract with community colleges or other postsecondary institutions to provide training for their employees.15 Contract training is often designed to directly improve the skills of employees, but can also help companies develop their own training programs, through a “train the trainer” program. Contract training is an open market in which education institutions compete with each other and with private training companies; in fact, postsecondary institutions are generally regarded as newcomers to this market (Bailey, 2006). At postsecondary institutions, contract training may be paid for by the employer, or through grants to institution-employer consortia. Business tax credits also may support this type of training. For example, Washington State has a state-wide contract training program that operates through the state’s community, technical, and private career colleges. The program is open to individual businesses and postsecondary institutions that partner for training services. The institution pays the up-front costs of the training; after training, the business repays the costs interest-free and is eligible for a 50% tax credit. A 2008 study of noncredit enrollments in community colleges suggests that it is widespread and growing (Van Noy et al., 2008).
Enrollments in noncredit courses are not collected by the National Center for Education Statistics, and are often not collected by postsecondary institutions themselves. The best estimate on noncredit enrollments comes from the American Association of Community Colleges, which estimates that in 2008, 5 million students were enrolled in noncredit community college
15 When the contract training is tailored for a specific company or client, it is referred to as customized training.
34

courses.16 Based on headcounts, this comes to 40% of all community college students. These noncredit enrollments include workforce training (such as contract training programs for employers), but also adult basic education, remedial education, English-as-a-second-language instruction, and recreational instruction. Van Noy et al. (2008) note that noncredit VET courses serve a number of purposes in community colleges, including supporting local workforce development as well as generating revenue for the institution. Noncredit VET courses may cost more than for-credit courses, as most states do not set limits on noncredit course charges, and institutions charge what employers will pay (Van Noy et al., 2008).
Organizational policies and approaches for noncredit workforce education vary widely across institutions. Van Noy et al. (2008) provides brief case studies of relevant policies in a number of community colleges, including some in Florida, Maryland, and Washington.
FINANCIAL INCENTIVES
One important incentive for students to participate in postsecondary VET is the labor market returns to higher education (see figures 1 and 2). In today’s economy, the weak labor market adds to the incentive for students to stay in (or return to) school, particularly in programs that prepare for job entry in high demand fields such as health care.
State subsidies to community colleges can also be viewed as providing a financial incentive, as such subsidies make these colleges more affordable. Student loan programs likewise provide financial incentives, as they defer student costs. Student grants and scholarships are less available than loans, but they provide even stronger financial incentives for the students who can get them, as grants and scholarships don’t just defer costs but reduce them. Tax credits and deductions (tax expenditures) add yet another financial incentive.
Institutions’ incentives to provide VET come mainly from the demand for human capital from employers and individuals. In the public sector, local and state policymakers support the development of VET programs as a means of encouraging local, regional, and state economic development. In the private, for-profit sector, labor market demand helps ensure profitability.
16 See AACC 2011 Fast Facts at http://www.aacc.nche.edu/AboutCC/Documents/FactSheet 2011.pdf.
35

Figure 1. Labor market returns to postsecondary education: Earnings, 2011
Note: Data are for persons age 25 and over. Earnings are for full-time wage and salary workers. Source: U.S. Department of Labor, Bureau of Labor Statistics, Current Population Survey.
36

Figure 2. Labor market returns to postsecondary education: Unemployment, 2011
Note: Data are for persons age 25 and over. Source: U.S. Department of Labor, Bureau of Labor Statistics, Current Population Survey.
REMEDIATION
The linked issues of college readiness and remedial (or developmental) education are important issues in American postsecondary education, including VET. Unfortunately, not all high school graduates are prepared for college level work; nor are all adults who enroll in postsecondary education prepared, either because of inadequacies in their high school education or because of skill loss since leaving school. The need for remediation is most common in, but not restricted to, open-access institutions such as community colleges (see tables 21 and 22). Although these schools have open admissions, entering students often must take placement tests (typically the College Board’s AccuPlacer or ACT’s Compass) upon enrolling.17 Students who do not meet the
17 Although many community colleges require entry testing of all students, most also allow exemptions. Scores on college entrance exams (e.g., SAT, ACT) are the most commonly used exemption criterion, but exemptions also are sometimes made for transfer students, or based on a student’s high school grade-point average, score on a statewide high school exit exam, or completion of high school Advanced Placement tests (Shults, 2001).
37

institution’s established cut-off scores are either advised or required to enroll in remedial courses—for which the students typically pay tuition but do not receive college credit.
As more students have enrolled in postsecondary education over the decades, the percentage of students who need remediation has grown, with increasing costs to institutions, students, and their families.18 In school year 2007-08, 38% of first-and second-year postsecondary students reported that they had ever taken a remedial course (after high school), with an average of 2 remedial courses taken by these students in 2007-08. Among community college students, 45% of first- and second-year students report having had remediation (versus 30% at public 4-year institutions).
Table 21. Percentage of degree-granting institutions offering remedial services: 2009-10 Institution type All institutions 2-year institutions 4-year institutions Total, all institutions 73 80 68 Public institutions 90 >99 75 Private, non-profit institutions 61 73 61 Private, for-profit institutions 64 49 81 Source: Snyder and Dillow, p. 483. Original source: U.S. Department of Education, National Center for Education Statistics, 2009-10 Integrated Postsecondary Education Data System, “Institutional Characteristics Survey,” Fall 2009.
Table 22. Number of degree-granting institutions with freshman that offered remedial reading, writing or mathematics courses: Fall 2000
Institution type
Percent offering remedial courses in: Reading, writing or
mathematics Reading Writing Mathematics All institutions 76 56 68 71 Public 2-year 98 96 96 97 Private 2-year 63 37 56 62 Public 4-year 80 49 67 78 Private 4-year 59 30 46 49 Source: U.S. Department of Education, National Center for Education Statistics, Postsecondary Education Quick Information System, “Survey on Remedial Education in Higher Education Institutions: Fall 2000”, 2001. From Parsad and Lewis (2003), p. 8.
Table 23 suggests that both high school preparation and skill loss among older adults play a part in the need for remediation; 30% of students ages 18 or younger enrolled in remedial courses, compared to 40% or more of those ages 24 or older. So while improvements in primary and secondary education could help mitigate this problem, they may not eliminate it.
Remediation has been criticized because, at least when provided to recent high school graduates, it results in the public “paying twice” for what should have been learned in high school (Russell,
18 It has been estimated that the remediation needed by recent high school graduates costs taxpayers $1.4 billion annually (Alliance for Excellent Education, 2006).
38

2008). At the same time, the goal of maximizing educational access supports the provision of a second chance and “open doors”. So while there is little argument about the need to improve secondary education, there is debate about where remedial education should be provided—in just community colleges or also in 4-year colleges19—and how it should be provided. It is also not yet clear whether remedial coursetaking helps students persist in and complete postsecondary education. Numerous studies have shown that students who need remediation are less likely to earn a postsecondary credential than are students who do not need remediation (see table 24). More recent studies using natural experiments and modeling techniques have yielded inconsistent findings (Russell 2008; Bettinger and Long, 2009; Melguizo, Bos and Prather, 2011; Calcagno and Long, 2008).
Another concern is the arbitrary nature of determining the need for remediation. There is no consensus across states or institutions on what it means for a student to be “college ready”. Institutions (or programs within institutions) are often free to select which placement tests to use and the cut-off scores for the tests. At least eight states, however, have a state-mandated college placement test (Russell, 2008). The U.S. Department of Education, through the National Assessment Governing Board, is attempting to develop a national assessment of college preparedness, but that assessment is years off, and would be designed to serve as a national indicator, rather than as a tool for postsecondary institutions.
An additional concern is that by lengthening the time it takes students to complete their programs, remediation increases students’ reliance on loans and their debt burden. Likewise, remediation forces postsecondary institutions to channel resources into courses and services that are not part of their core mission. In order to mitigate these concerns, many states and institutions are rethinking how they use remediation and/or experimenting with new models for providing remedial education.
19 In the past few years, a number of states have removed remediation from 4-year institutions. In Florida, for example, only community colleges and one of the state’s 4-year colleges is allowed to provide remedial courses (Russell, 2008). The percent of public 4-year institutions that offer remedial services reached a high of 85% in 1997-98 and has since declined to 75%, while at public 2-year institutions the rate has been 98-99% since first measured in 1989-90 (Digest 2010, table 340).
39

Table 23. Percentage of first- and second-year undergraduates who reported ever taking a remedial course after high school graduation, by institution type and student age: 2007-08 Institution type and student age
Ever took a remedial course
Total 38 Type of institution 4-year, public and private non-profit 28 2-year public 44 Less-than-2-year public 32 Less-than-4-year private non-profit 36 For-profit 30 Student age as of 12/31/07 18 years or younger 30 19-23 years 36 24-29 years 43 30-39 years 43 40 years or more 41 Note: Estimates include students enrolled in Title IV eligible postsecondary institutions in the 50 states, the District of Columbia, and Puerto Rico. Source: U.S. Department of Education, 2010a. Original Source: National Center for Education Statistics, 2007-08 National Postsecondary Student Aid Study.
One new approach is to integrate basic skills instruction into occupational skills training, so that students can acquire basic literacy and numeracy skills along with their technical skills. It is hoped that this approach will yield both better and faster remediation. These “Integrated Education and Training” models contextualize the teaching of basic skills around the skills and competencies required for specific occupations. The most well-known example of this approach is the “I-BEST” (Integrated Basic Education and Skills Training) model in Washington State. The model integrates basic skills and occupational training by having two instructors in the classroom – one to teach basic skills and the other to deliver technical instruction. Students earn college credits for these classes. As a second example, Connecticut is considering legislation that would eliminate non-credit remedial courses by 2012, replacing them with remedial support services provided within regular college courses. A number of other states, including Minnesota and Wisconsin, are implementing similar state-wide initiatives to better integrate adult basic education with workforce training and postsecondary education. The section on “Policy and Other Initiatives” provides further information on I-BEST and related “career pathways” models.
Finally, two recent studies have suggested that community college’s remedial placement practices do a poor job of determining who needs remediation, thereby placing into remediation many students who do not need it (Belfield and Crosta, 2012; Scott-Clayton, 2012).
40

Table 24. Attainment and persistence rates of 2003-04 first-time postsecondary students, by first institution type, degree or certificate program and, for students in less-than-4-year institutions, number of remedial courses taken: 2004-2009 First institution type, degree or certificate program, and number of remedial courses taken
Attained degree or certificate
No degree or certificate,
still enrolled
No degree or certificate,
not enrolled Total 49 15 36 Type of first institution 4-year 64 12 24 2-year 35 19 46 2-year public 34 20 46 Less-than-2-year 56 9 35 Degree or certificate program, 2003-04 Certificate 55 9 36 Associate’s degree 35 18 46 Bachelor’s degree 67 12 21 Number of remedial courses taken by students in less-than-4-years institutions (from transcripts)
Total 38 17 45 None 42 11 47 1 40 18 42 2 34 21 45 3 or more 34 25 41 Source: U.S. Department of Education, 2011c and special runs. Original source: National Center for Education Statistics, 2003-04 Beginning Postsecondary Students Longitudinal Study, Second Follow-up.
STUDENT PERSISTENCE AND COMPLETION
Although access to postsecondary education is a long-standing issue, student persistence and completion have received increased attention in recent years. The development of state and federal accountability systems is one factor contributing to this focus; another factor is President Obama’s 2020 education goals, which call for increasing the percentage of Americans with postsecondary credentials. As described in the section on “Policy and Other Initiatives” the two major pieces of federal legislation supporting postsecondary VET (Perkins and WIA) include mandated accountability systems, and the American Association for Community Colleges is in the process of developing a “Voluntary Framework of Accountability.”
Persistence and completion are of particular concern at the sub-baccalaureate level, where completion rates are relatively low. As table 25 shows, bachelor’s degree and certificate students have similar 6-year completion rates—even though certificate programs are at least 4 times shorter than bachelor’s degree programs. Looking at completion or persistence, bachelor’s degree seekers have higher completion-or-persistence rates than do certificate seekers, suggesting that bachelor’s degree completion may outpace certificate completion in later years. For students in associate’s degree programs, completion rates are only around 40%, compared to
41

about 60% for bachelor’s degree and certificate students. This does not seem to be a VET issue, however, as both students seeking vocational associate’s degrees and those seeking academic associate’s degrees have similarly low completion rates. (The VET and academic associate’s degree rates in table 25 are not significantly different.)
Table 25. Persistence and attainment rates of 1995-96 beginning postsecondary students, as of 2001 Initial institution type and credential sought
Persisted or attained No
credential, not enrolled
Total
Attained credential
No credential,
still enrolled VET students, by institution type Less-than-2-year 70 67 3 28 Public 2-year, total 53 40 13 47 VET field of study 55 43 12 45 Academic field of study 56 38 18 44 Private 2-year 65 60 5 35 4-year 64 54 10 36 Credential sought Certificate (VET) 64 60 4 36 VET associate’s degree 56 42 14 44 Academic associate’s degree 57 40 17 43 Bachelor’s degree 77 61 16 23 Source: CTE Statistics website, Tables B02 and B05. Original source: U.S. Department of Education, National Center for Education Statistics, 1996/01 Beginning Postsecondary Students Longitudinal Study.
One reason it may take longer for students to complete associate’s degrees than certificates is that associate’s degree programs are longer and have more academic requirements than certificate programs. But the difference also seems to be related to the type of institution in which students seeking associate’s degrees enroll. Overall, 75% of the students seeking an associate’s degree in a VET field are enrolled in a community college, but only 51% of VET associate’s degrees are awarded by community colleges (CTE Statistics, table P74). Interestingly, this is not true for certificates: community colleges enroll 39% of all certificate students and produce 43% of certificate awards. Table 25 also shows relatively low completion rates for community colleges.20 One reason it might take longer for community college students to complete their program is that these students are more likely than those enrolled at private institutions to attend part-time. (Part-time students take longer to complete and are more likely to drop out than are full-time students). But analysts have pointed to other issues as well—issues that may be particularly salient for part-time students. The next section summarizes these issues.
20 In this case, it is difficult to tell if the problem is unique to VET. There is no statistical difference in the completion rates of VET versus academic students at community colleges, but the VET students include certificate seekers, while the academic students are all associate’s degree seekers.
42

Persistence and Completion at Community Colleges
There is no clear answer as to why community college completion rates are so low, but analysts have suggested a number of factors that may combine to make completion particularly difficult at community colleges: (1) self-selection of students who lack direction; (2) relatively low resource levels, and (3) organizational structure and philosophy. The argument runs as follows:
While many high school students and working adults want to get a college education, they are not always clear on what that education should be, what exactly it will get them, and how much time and money they should devote to it. For these individuals, the community college is an attractive alternative—it is relatively cheap, conveniently located, offers many programs, and is easy to get into. As a result, community colleges often serve, more than other postsecondary institutions, students who are unclear on why they are there or what their goals are—they enter with relatively low levels of commitment or direction (Grubb, 2006; Rosenbaum, Deil-Amen, and Person, 2006). From one perspective this is good, as one of the goals of community colleges is to give everyone a chance to “try” college. But from a completion standpoint, this situation is somewhat problematic. Students who lack direction and commitment are likely to be easily knocked off track.
In addition, community colleges’ relatively low resources, multiple missions, and “options for everyone” approach often combine to create an educational environment that provides little structure or support. While smaller private institutions tend to focus on the goal of preparing students for work, the typical community college has a more wide-ranging set of missions—including remedial education, adult basic education, transfer preparation, continuing education contract/customized training, faculty development, and building community and business partnerships—all of which community colleges undertake with relatively low levels of revenues. Studies have noted differences in the extent to which students are guided through admissions, registration, and advisement services (see section on “Career Guidance” below). These services tend to be integrated, well-funded, and highly individualized for students in some of the better for-profit institutions, while it is more common for community colleges to provide disjointed services with limited counseling, so that students are often unclear on where, when, or how to select and schedule their courses (Bailey, Badway, and Gumport, 2001).
The title of one recent report on community colleges neatly sums up the concern: “The Shapeless River: Does a Lack of Structure Inhibit Students’ Progress at Community Colleges?” (Scott-Clayton, 2011). Many analysts believe the answer to this question is “yes” (see Bailey, Badway, and Gumport, 2001; Bosworth, 2011; Fonte, 1997; Shulock, Moore, and Offenstein, 2011; Rosenbaum, Deil-Amen, and Person, 2006; Schuetz and Barr, 2009; Scott-Clayton, 2011). A number of changes have been proposed to alleviate this problem:
• Offer and deliver instruction as integral programs rather than as discrete courses so that students do not have to make complex choices or have uncertainty as to requirements and progress.
43

• Schedule program courses consistently from semester to semester so students can plan work and life schedules around their education.
• Build remediation into occupational programs so that students can begin occupational instruction immediately and can learn academic skills in the context of their program.
• Enroll students in cohorts to provide a “learning community” and social support network.
• Use consolidated counseling services and pro-active counseling techniques so that students do not have to figure out how to access counseling services and so that all students are served.
• Collect and analyze student outcome data to monitor student progress, evaluate the institution’s completion rate, and guide program improvement.
• Develop a coordinated, streamlined system for admissions, financial aid, course enrollment, and credit transfer, so that students can easily and efficiently enroll in the appropriate courses.
Some of these recommendations run counter to the goals of maximizing student flexibility and choice. The notion of constraining students’ choices, while acceptable in some community colleges, is likely to be met with resistance in others. In the end, each state and/or institution must strike its own balance between providing optional choices and structured programs, and between voluntary and required services.
LABOR MARKET BENEFITS
Determining the labor market benefits of postsecondary VET is complicated by many factors, including variability in the types and quality of the institutions that deliver VET, differing levels of selectivity of institutions, different goals of students who enroll in sub-baccalaureate education (including the goal of finding a goal), small numbers of students in many fields of study and institution types, and a reliance on short-term outcomes in research and accountability systems. Nonetheless, numerous studies have documented positive economic returns to sub-baccalaureate VET (e.g., Grubb, 2002; Bailey, Kienzl, and Marcotte, 2004; U.S. Department of Education, 2004; Crissey and Bauman, 2010). Two reviews found consistent earnings returns to an associate’s degree, with average returns around 13-18% for males and 22-23% for females (Grubb, 2002; Belfield and Bailey, 2011). Occupational associate’s degrees have sometimes been found to have higher economic returns than academic associate’s degrees (Grubb, 1995; Bailey, Kienzl, and Marcotte, 2004), but sometimes have not (Kane and Rouse, 1995; Marcotte, 2010).
The findings for certificates have been less consistent, with some studies finding mixed or positive effects (Belfield and Bailey, 2011; Bailey, Kienzl, and Marcotte, 2004) and others finding no effect (Kane and Rouse, 1995). The inconsistent findings for certificates may reflect the different effects of short-term (less than one year) versus long-term (one year or more) certificates; long-term certificates have been more consistently found to produce earning returns,
44
(Bosworth 2010).21 Similarly, studies have shown that 30 credits—the equivalent of about one year of full-time enrollment—is the minimum needed to provide an economic return to postsecondary education. Many certificates are also awarded in cosmetology, an occupational field that has state licensing requirements, but has been found to not provide significant labor market returns (Grubb, 2002).
Another possible reason for the inconsistent findings at both credential levels is that it matters what field one studies, and it matters whether one gets a job in a field related to one’s training. The evidence suggests that sub-baccalaureate VET credentials are more likely to provide labor market benefits to students who complete programs (or at least earn 30 credits) in high-wage, high-demand fields such as health care, business, IT, and engineering, and to individuals who work in jobs related to their training—that is, individuals in jobs for which they have developed the relevant human capital (Grubb, 2002; Hudson, Kienzl, and Diehl, 2007; Crissey and Bauman, 2010).22 The lower levels of labor market benefits from sub-baccalaureate credentials compared to baccalaureate credentials also depends on field of study. For example, women earn more from an associate’s degree in health than from a bachelor’s degree in humanities or education; similarly, men earn more from an associate’s degree in engineering than from a bachelor’s degree in humanities or education (Grubb, 2002).
Finally, outcomes may differ depending on the type of institution the student attends. These comparisons can be difficult because (as seen above) different types of students attend different types of institutions. A recent review that attempted to account for student differences found that students who attend for-profit institutions tend to have higher unemployment rates and lower passing rates on licensure exams than do students at other institutions; however, no differences were found in earnings among students who attended different types of institutions (GAO, 2011).
One question raised by these findings is: To what extent does the American postsecondary VET system focus on the fields that provide economic returns? As seen in figure 3, in 2011, 63% of all sub-baccalaureate VET credentials were awarded in the four areas found to have the highest economic returns (healthcare, business, IT, and engineering). Most of this 63% is due to the high proportion of students in healthcare, which accounts for 43% of postsecondary VET credentials. The second and third most common fields (based on credentials earned) are the traditional trades (manufacturing, construction, repair and transportation) and “consumer services” (mostly cosmetology and culinary arts), for which the economic payoffs are small or nonexistent. Of course, students may study these subjects for reasons other than financial reward.
21 The Bosworth (2010) report is a useful source of state comparative data on certificates, as it includes a number of analyses of certificates broken out by state. 22 Crissey and Bauman (2010) found one notable exception to the related-field finding: Students who earned a certificate or associate’s degree in IT fields had an earnings premium regardless of whether they worked in an IT job.
45

One concern about much of this work on labor market outcomes is that it is based largely on economic outcomes (getting a job, getting a good-paying job), and mainly on short-term outcomes. It seems reasonable for VET programs to result in increased employability and family-sustaining wages, but some analysts are concerned that too much emphasis is placed on initial employability and earnings, rather than long-term employability and earnings growth (e.g., Bailey, Badway, and Gumport, 2001). To some extent, this focus on initial outcomes is driven by data constraints (e.g., many federal longitudinal data collections stop a few years after program completion), but federal accountability systems (e.g., those associated with Title IV and the new gainful employment requirements) also focus on initial outcomes.
Figure 3. Distribution of VET credentials among fields of study
Source: U.S. Department of Education, National Center for Education Statistics, Integrated Postsecondary Education System, 2010-11 Completions file and 2011-12 Institutional Characteristics file.
46

VET TEACHING
The qualification requirements for teaching staff in postsecondary VET programs (as in all other postsecondary programs) are determined by institutional and/or programmatic accreditation requirements, and/or by individual institutions in collaboration with their governing boards. Typically, institutions require some minimal level of education and/or work experience. Work experience is particularly likely to be a requirement for VET faculty.
Shortages of postsecondary VET teachers are difficult to document and tend to vary depending on local labor markets. In general, however, shortages seem to be fairly common in technical fields for which the demand for workers and worker pay are relatively high—areas such as nursing, allied health, and IT. For example, in a 2007 survey of state directors of community colleges, the top-rated “hot topic” was shortages of faculty in allied health, with shortages in science and technology faculty rated number four on the list (Katsinas, Tollefson, and Reamey, 2008). In these fields, it may be difficult for postsecondary institutions to compete in terms of salary with the non-teaching labor market.
In community colleges, teachers are typically given a great deal of leeway to make curricular and pedagogical decisions. Community college faculty are also typically allowed to develop new courses (e.g., to meet labor market demand), but before a new course can be taught it often must undergo a few bureaucratic hurdles. Bailey, Badway, and Gumport (2001, p. 26) found that new courses must undergo “a departmental-level approval process, then a campus approval process, then an academic senate approval, and then some external review by a state or regional entity charged with avoiding duplication or with constraining courses to a catalog of approved content.”
Some community colleges rely heavily on adjunct faculty, who work part-time on a contractual basis. The use of adjunct faculty is particularly common at community colleges; in 2003, two-thirds of community college faculty worked part-time, compared to one-third of faculty at all other degree-granting institutions (Snyder and Dillow, pp. 381-383). Adjunct faculty are cheaper to employ and give community colleges much-needed flexibility to adjust staffing in response to demand. Many adjuncts also work full-time outside of teaching, bringing valuable work experience to the VET classroom. But it has been noted that adjunct faculty are in some ways marginalized workers: their pay is relatively low, they have little job security or benefits, no tenure and little chance for promotion, and typically have little or no opportunity to participate in departmental activities outside of teaching (Gappa and Leslie, 1993; Kezar and Sam, 2010). It is generally accepted that the use of adjunct faculty is a reasonable (and inevitable) solution for dealing with tight budgets and high course demand. But there is some concern about the over-reliance on part-time teaching staff who are not well-integrated into institutional life, are under-paid, and are not given the same level of resources as other faculty members.
47

CAREER GUIDANCE
Postsecondary career guidance is not a well-studied field in the United States. But the studies that have been done, which are mainly studies of community colleges, suggest that (as is true in the elementary and secondary education system), guidance and counseling services are inadequate to meet demand. For example, studies have found caseloads of one counselor for every 800-1,200 students (Grubb, 2006; Rosebaum, Deil-Amen, and Person, 2006), and that fewer than one-fourth of community college students have an assigned advisor or counselor (Scott-Clayton, 2011). Some qualitative studies also have found that for-profit institutions tend to put greater emphasis and resources into career counseling and job placement than do community colleges (Bailey, Badway, and Gumport, 2001; Rosenbaum, Deil-Amen, and Person, 2006). Grubb (2006) conducted a qualitative analysis of 15 community colleges, which provides a good overview of the status of guidance and counseling in community colleges. The following summary is based on his work.
For the most part, individual institutions make their own decisions about guidance and counseling services. States play virtually no role, other than sometimes setting entry requirements for counselors. As a result, community colleges vary widely in the career and guidance services they offer. Some community colleges are moving toward “one stop” services, where students can receive a full array of guidance and counseling services at one location, but more typically, guidance and counseling services at community colleges tend to be under-funded, uncoordinated, fragmented, and non-intrusive/passive (relying on the student to seek services). Students often must go to different locations or staff for career counseling, academic counseling, and financial counseling. Career counseling services are typically rare and are left largely to occupational faculty; the focus in most community colleges is on academic guidance. But even this form of guidance is limited. Community college counselors rely heavily on the “trait-and-factor approach”—the use of standardized personality and career inventories—but after providing students with assessment results, the students are often left to make their own educational and career decisions (i.e., to guide themselves). Also, as a cost-cutting measure, many community colleges are replacing higher paid and higher skilled counselors with advisors (often faculty) who provide students with factual information on course offerings and requirements, but not with guidance on how to make decisions, plan one’s education, or deal with life issues that affect students’ ability to stay in school.
Grubb also found that work-based learning (work experience programs and internships) were rarely used to help students explore a career area—that is, outside of health fields, where they are common (mainly due to occupational certification and licensing requirements). More often, occupational faculty provided students with career advice and help finding jobs. There is a certain logic to a reliance on VET faculty for (specific) career advice, since career center staff cannot be expected to be familiar with the skill demands, professional credentialing requirements, hiring practices, and job openings in every occupational field for which
48

community colleges typically offer programs. Thus, once students are enrolled in specific VET program, they most often rely on their VET faculty for career guidance.
Some community colleges also offer short courses designed to instruct students on how to navigate the process of making career and education decisions. These courses are often explicitly designed to help students choose their educational major and career goal. But these courses are typically optional and relatively few students take them, choosing instead to “shop around” for courses.
Information Sources for Prospective Students
A related issue to guidance and counseling is how (prospective) students decide which institution or program to enroll in. Sub-baccalaureate students tend to enroll in institutions near where they live, suggesting that location is an important consideration. In fact, most students, but particularly those at community colleges, report that location and affordability are important considerations in their decision on which institution to attend (U.S. Department of Education, 2009). Advertising and recruitment are also common, at least among some institutions, and may also have an influence on student choice.
Publicly available information is also available for students to compare institutions. The Higher Education Amendments require that all institutions that participate in Title IV disclose to prospective and current students the institution’s graduation rates and employment outcomes (among other things); colleges typically make this information available on their websites and in promotional materials. 23 In addition, a number of college search websites exist, many of which also publish graduation and/or employment information. The U.S. Department of Education sponsors College Navigator (http://nces.ed.gov/collegenavigator/), which provides information on offerings, tuition and fees, accreditation, and graduation rates, among other institution and student characteristics. Nongovernmental college search tools include College Match (http://www.collegedata.com/cs/search/college/college_search_tmpl.jhtml), which includes graduation rates, employment rates six months after graduation, and starting salaries; and the following sites that include graduation rate information:
• Princeton Review (http://www.princetonreview.com/schoolsearch.aspx); • Big Future (https://bigfuture.collegeboard.org); • College View (http://www.collegeview.com/index.jsp) • College Results Online (http://www.collegeresults.org)
About one-quarter of community college students report that they consider graduation rates when selecting an institution (U.S. Department of Education, 2009).
23 The full requirements are detailed in http://nces.ed.gov/pubs2010/2010831rev.pdf. For an example of how one technical college meets these requirements, see http://www.albanytech.edu/index.php?option=com_content&view=article&id=563&Itemid=89.
49

POLICY AND OTHER INITIATIVES
This section reviews recent policy and other initiatives that relate to postsecondary VET. The focus here is on federal government initiatives, but we also include a few other national efforts and some related state developments that have attracted attention. Given the number of states, foundations, and advocacy groups in the U.S., and the diversity and independence of postsecondary institutions, this section does not provide a complete overview of all relevant initiatives.
National (Non-Federal) Initiatives
Voluntary Framework of Accountability. The community college sector has often complained that traditional accountability measures do not adequately capture the effectiveness of community colleges in the many roles they serve, and do not provide community colleges with appropriate guidance for improvement. To address this concern, the American Association of Community Colleges (AACC) has recently developed a set of performance indicators designed specifically for community colleges. Prior to their release, the performance measures were pilot tested in 58 community colleges; they were then released in a “Metrics Manual”. Known as the Voluntary Framework of Accountability (VFA), 24 the system is specifically designed to include students in adult basic education and VET programs, as well as part-time students and students in non-credit courses. The VFA includes a range of progress and outcome measures, including measures of college readiness, student progress and completion, and job preparation and employment. Student learning outcomes are included as a “work in progress.”
In 2012-13, the AACC is working to promote the VFA among community colleges, while also building the VFA data collection and analysis tools. The plan is to have the system running in 2013-14, with participating community colleges paying dues to help support the system. More information about the VFA is available at http://www.aacc.nche.edu/Resources/aaccprograms/ VFAWeb/Pages/VFAHomePage.aspx.
College Completion Initiatives. In part in response to the Administration’s call for increased college graduation rates (see next sub-section), a number of national college completion initiatives have arisen in the past few years. Although these initiatives do not focus specifically on VET, increased completion of postsecondary VET programs is a key part of their goal. The AACC, for example, launched a “College Completion Challenge” in 2010, to encourage all community colleges to increase their completion rates by 50 percent by 2020 (McPhail, 2011). About 70 community colleges (including the 15-institution Maryland community college system) have signed onto this challenge. The AACC website provides a listing of other on-going
24 Note that a separate “Voluntary System of Accountability” exists for public 4-year institutions, sponsored by the Association of Public and Land-grant Universities and the Association of State Colleges and Universities.
50

completion initiatives; see http://www.aacc.nche.edu/About/completionchallenge/Pages/ national_initiatives.aspx.
Federal Administration Initiatives
The Obama administration has placed a high priority on education, particularly on the completion of postsecondary education and on the role of community colleges in raising both education levels and workforce skills. In response to evidence on the labor market outcomes associated with postsecondary education and to international statistics showing the U.S. losing ground in terms of the percentage of adults who have completed college, the Administration has set two goals, aiming for: (1) all Americans to complete at least one year of college or career training; and (2) the U.S. to have the highest percentage of college-educated adults in the world by 2020. Passing legislation to support these goals has been challenging. Congress has supported increased funding for federal student-aid grants. But the President’s proposed American Graduation Initiative—which would have given community colleges $12 billion over 10 years to improve programs and increase the number of community college graduates by 5 million—was scaled back during the legislative process to a smaller, more focused set of grants (TAACCCT, described below). In April 2012, the White House issued an Education Blueprint, laying out the Administration’s goals and initiatives for both postsecondary and elementary/secondary occupational education. The postsecondary proposals focus in part on TAACCCT and other initiatives designed to link community college VET programs with business and industry. A second focus is on increasing access to postsecondary education, through investments and reform of the federal student aid systems. The Education Blueprint can be found at: http://www.whitehouse.gov/sites/default/files/cantwait/final_-_education_blueprint _-_an_economy_built_to_last.pdf.
The Administration has also recently (February 2012) announced a new $8 billion Community College to Career Fund. Co-administered by the U.S. Departments of Education and Labor, this fund is designed to establish partnerships between community colleges and businesses, to train workers for jobs in high-growth, high-demand industries, such as health care, logistics, transportation, and advanced manufacturing. The hope is that more community colleges will become community career centers. If implemented, the Community College to Career Fund will support activities such as:
• Paid internships for low-income community college students; • Support for regional industry sectors to develop skills consortia to identify workforce
needs and solutions; and • The development of pathways to entrepreneurship for small business owners.
51

Federal Legislation and Initiatives
In addition to federal student aid (discussed previously), the federal government provides funding and/or technical support for postsecondary VET through numerous legislative acts, or public laws. The main acts supporting VET are administered by the U.S. Departments of Education and Labor.25 While both Departments support education and training programs for both youth and adults, the acts administered through the Department of Labor focus more on adults who have left the education system and have entered the workforce (or are trying to enter the workforce), while the Education Department focuses more on secondary and postsecondary VET. More specifically, the Labor programs target specific types of workers (e.g., those whose jobs have gone off-shore) and offer a variety of supports for job re-entry as well as—or even in preference to—education and training, while Education focuses on the creation of secondary-to-postsecondary education “programs of study” and increasing the rigor of secondary VET so that students are prepared for entry into postsecondary education as well as work.
This section summarizes the following acts:
• U.S. Department of Education, Carl D. Perkins Career and Technical Education Act (Perkins Act)
• U.S. Department of Labor, Workforce Investment Act (WIA) • U.S. Department of Labor, Trade Adjustment Act (TAA) • U.S. Department of Labor, National Apprenticeship Act (Fitzgerald Act)
Career and Technical Education Legislation
The Perkins Act provides an annual appropriation of $1.1 billion to states and localities to support secondary and postsecondary level VET in public schools, as well as research and data collection on VET issues. The vast majority of funds appropriated under the Perkins Act are awarded as grants to State Boards of CTE. These State Basic Grants are allotted via formula to states. States determine (within guidelines) the split of funds between secondary and postsecondary VET, and then award funds to local grantees—local education agencies (school districts) and postsecondary institutions, or consortia of these. (Annex B provides further detail on the funding allocation process.) Each state designates a state agency to oversee the implementation of the Act, including the establishment of funding priorities in a State Plan, disbursal of funds, monitoring of state and local compliance, collection of accountability and other reporting data, and implementation of program improvement efforts.
25 The U.S. Department of Health and Human Services also supports adult education and training through the federal welfare system, Temporary Aid to Needy Families (TANF); see http://www.acf.hhs.gov/programs/ofa/programs/tanf for more information on this program.
52

Generally, the Act supports “accountability for results and program improvements at all levels, increased coordination within the CTE system, stronger academic and technical integration, connections between secondary and postsecondary education, and links to business and industry” (ACTE, 2006, p 9). States and localities determine how they will use Perkins funds to meet these goals, through state and local plans, approved by (respectively) OVAE and the State’s Board of CTE. Although Perkins grantees are given broad leeway in funds use, the Act does require that each state and locality develop at least one CTE “program of study”(defined broadly as a sequence of aligned secondary postsecondary courses that lead to an industry-recognized credential, postsecondary certificate, associate’s degree, or baccalaureate degree). Each state must monitor and annually report to the Department’s Office of Vocational and Adult Education (OVAE) on a set of performance accountability measures, which OVAE collects in its Consolidated Annual Report (CAR). Because each state selects its own accountability measures and target performance levels (approved by OVAE), this accountability system is state-specific.
The Perkins Act also funds a national research center on CTE, through a competitive grant process (see http://www.nrccte.org/; this research center is currently being re-competed). The research center conducts studies intended to identify and develop best practices for CTE programs, increase the academic rigor of CTE courses and the academic achievement of CTE students, and disseminate research findings and provide technical assistance for implementing innovative CTE strategies. Many of the center’s current projects focus on the implementation of programs of study. The Act also requires that NCES collect and report data on CTE, a mandate met through the NCES CTE Statistics website (http://nces.ed.gov/surveys/ctes/). Finally, each authorization of the Act includes a “national assessment”, a large-scale independent assessment of the status of CTE and evaluation of the implementation of the Act, conducted through a series of grants, contracts, and cooperative agreements. The last National Assessment of CTE (for the 1998 Perkins Act) submitted its final report to Congress in 2004 (see http://cte.ed.gov/downloads/NAVE2004.pdf for the full report and http://www2.ed.gov/rschstat/eval/sectech/nave/naveexesum.pdf for the executive summary); the current National Assessment is due to submit its final report to Congress in June 2012.
Findings from NAVE. As mentioned above, the 2004 National Assessment of Vocational Education (NAVE) evaluated the previous (1998) authorization of the Perkins Act, rather than the current authorization. The two authorizations are not very different, however, so the findings from the 2004 NAVE are still worth noting. (The main difference between the two is the current authorization’s focus on programs of study as a reform tool.) Some of the NAVE findings were:
• The legislation’s ability to create change is limited by program improvement strategies that are vague and ill-defined, have too many goals and objectives, and give broad leeway to localities for the use of funds.
53

• Because of technical and data quality issues, the Act’s accountability system is rarely used to monitor or direct program improvement; inconsistency across states also means the accountability system cannot provide a national portrait of VET.
• State flexibility in allocating funds has weakened the Act’s targeting to low-income areas.
Workforce Development Legislation
The Federal government currently invests over $9 billion annually in employment and training programs. This public workforce investment system operates through a network of federal, state, and local entities that attempt to match skill development opportunities with employer and industry needs.
The Workforce Investment Act of 1998 (WIA). In order to streamline training and employment services, the Workforce Investment Act of 1998 replaced the Job Training Partnership Act (JTPA) as the country’s largest single source of federal funding for workforce development activities. The law mandates coordination among a range of federal job training programs—including the Employment Service, adult education and literacy programs, welfare-to-work programs, vocational education, and vocational rehabilitation (job training for the disabled)—in order to provide a range of services to employers and workers through a consolidated “one-stop” career center system.
WIA currently supports a network of nearly 3,000 “One-Stop Career Centers.” The centers offer training referrals, career counseling, job listings, and similar employment-related services. In an effort to consolidate various federal programs at the local level, One-Stop partners include a range of federal programs (e.g., unemployment insurance, Trade Adjustment Assistance, Senior Community Services Employment, Jobs for Veterans State Grant programs, the Indian and Native American Program, the National Farmworker Jobs Program, Temporary Assistance for Needy Families). WIA has four Titles, each of which provides a separate funding stream to support services for a specific population. Titles I and II are relevant to postsecondary VET. WIA Title I delineates the education, training, and employment services to be delivered to youth, adult, and dislocated workers. WIA Title II does the same for funds supporting adult basic education.
WIA Title I. WIA Title I consists of three funding streams – one for youth (ages 14-21), one for adults (18 and older), and one for dislocated workers.
• The WIA Youth program is directed at low-income, out-of-school youth. Service strategies prepare youth for employment and/or post-secondary education. Services vary across providers, but are generally a mix of counseling, academic instruction, work readiness training, and, in some cases, subsidized employment. In 2010, the WIA Youth Program was funded at $924,069,000 and served 129,505 young people.
54

• The WIA Adult Program is the largest WIA funding stream. Although training is not the primary goal of this program, it does support access to postsecondary VET. Eligibility for the program is broad, including all adults, 18 years and older. In situations where funds are limited, priority for services must be given to recipients of public assistance and other low-income individuals. In addition to unemployed adults, employed adults can also receive services to obtain or retain employment that allows for “self-sufficiency”; however, this function is rarely used. State and local areas are responsible for establishing procedures for applying the low-income priority and self-sufficiency requirements. In 2010 the program was funded with $861,540,000 and served 1,221,345 adults, 13% of whom participated in education and training programs.
• The WIA Dislocated Worker Program has more restricted eligibility criteria than the Adult program, but it sends a higher percentage of participants to postsecondary education. A dislocated worker is defined as an individual who has been terminated or laid off, an individual who was self-employed but is unemployed as a result of local economic conditions, or a “displaced homemaker” who is no longer supported by another family member. In 2010 the program was funded with $1,183,840,000 and served 638,515 dislocated workers, 19% of whom participated in education and training programs.
WIA funds are distributed to states by formula, and by states to local workforce investment boards who, in turn, are responsible for managing the Career One-Stops Centers. Services to adults and dislocated workers are divided into three levels. First are core services, which involve the provision of basic job search information, provided mainly on-line. Intensive services are staff-assisted and include skills assessments, counseling, resume preparation, etc. Training services are the third tier of service; individuals receiving training services are given Individual Training Accounts to pay tuition for education and training programs administered through “eligible training providers” approved by the local workforce investment board. On some occasions, workforce investment boards can use WIA funds to contract with a community college to develop specific courses, but the primary funding mechanism is indirect and flows through the individual participant.
Community colleges historically have had little involvement in WIA, in part because of WIA’s low emphasis on training, the differing accountability and reporting requirements of WIA and Perkins (U.S. Department of Education, 2004),26 and volatility in WIA funding (GAO, 2008). But community colleges do often at least coordinate with One-Stop Centers. About half of local workforce investment boards have community college representatives, and about one third of One-Stops have community college staff co-located at the Center (GAO, 2008). In addition,
26 WIA performance measures include earnings gains, employment, and job retention.
55

about 11% of One-Stop Centers are operated, entirely or in part, by community colleges (GAO, 2008).
One concern with WIA is that only a small percentage of funds go to training – particularly long-term training. Overall, only a small subset of WIA program exiters receive training of any kind and, of those that do, a little over half obtain a certificate or degree. The majority of funds are used to deliver “core” and “intensive” services rather than “training” services. Emphasis of the Act when it was passed in 1998 was on getting people into work, so “work-first” strategies were favored. However, in the face of the current recession, training has increased in federal priority. Nevertheless, it remains challenging to re-tool the system to focus more on training.
WIA Title II (Adult Education and Family Literacy Act). Title II of the Workforce Investment Act, also known as the Adult Education and Family Literacy Act (AEFLA) is the major source of federal funding for adult basic education. The U.S. Department of Education’s Office of Vocational and Adult Education administers AEFLA. This funding supports instruction in reading, numeracy, English literacy, and high school equivalency instruction (General Educational Development, or GED, preparation). In 2011, the federal government appropriated $658,346 for WIA Title II and the program served 2,012,163 individuals.
AEFLA funds are distributed to states by formula, based on the number of adults over age sixteen who are not enrolled in school and have not completed high school. Within states, funds are awarded to eligible institutions on a competitive basis. Eligible institutions include local education agencies, community-based organizations, volunteer literacy organizations, postsecondary institutions, libraries, public housing authorities, one-stop career centers, the military, and correctional institutions. The program seeks to increase the number of adults who are literate and have the knowledge and skills necessary for employment and self-sufficiency; and the number who have completed a secondary school education.
For more information on WIA, see http://www2.ed.gov/policy/adulted/leg/legis.html.
The Trade Adjustment Assistance Act
The Trade Adjustment Assistance (TAA) program was created in 1962 to assist workers in the manufacturing sector who had lost their jobs because of increased competition from overseas. TAA provides training assistance, re-employment services, and income support to these laid-off workers. Eligible individuals are entitled to tuition support for up to 130 weeks of full-time training – enough time to earn an associate’s degree – and may be eligible for income support while in training, health care coverage, a relocation allowance, and career and academic advising, among other services. Postsecondary community and technical colleges are the primary training providers for TAA-eligible individuals. Changes made to the TAA program in 2009 under the American Recovery and Reinvestment Act include provisions to extend eligibility to trade-affected workers in the service and public sectors, and significant increases in authorized funding for training.
56

TAA offers the most robust set of training, employment, and support services among the government’s various job training initiatives, but eligibility for the program is more restrictive and the program serves far fewer individuals than WIA. In 2011, the program was funded at $702,265,694 and served 196,000 trade-affected workers, 86,000 of whom (44%) received training services.
For more information on TAA see http://www.doleta.gov/tradeact/factsheet.cfm.
Registered Apprenticeship
The National Apprenticeship Act of 1937 (also known as the Fitzgerald Act), established a national Registered Apprenticeship program, overseen by the Office of Apprenticeship in the U.S. Department of Labor. In contrast to WIA, TAA, and Perkins, the Fitzgerald Act does not provide funds to states or local areas—i.e., there is no direct federal funding for the establishment or operation of apprenticeship programs. Instead, the Office of Apprenticeship supports apprenticeship programs that seek federal recognition through regulations, technical assistance, maintenance of a national database, issuance of certificates, and promotional activities.
Registered Apprenticeship programs are sponsored by individual employers, groups of employers, joint labor-management organizations, government agencies, and the military. The program sponsors operate the programs—they recruit and hire apprentices, and determine the content of the training, the requirements and partners for classroom instruction, the number of apprentices to train, and wages to be paid. Sponsors also work with state apprenticeship agencies to make sure their programs meet state requirements and standards, as well as to register programs and apprentices.
Registered Apprenticeship offers one of the few opportunities in the U.S. for young and entry-level workers to “earn and learn” and has been gaining increased attention over the last decade as a strategy for supporting youth transitions into the labor market. Nevertheless, Registered Apprenticeship programs reach a small number of workers. As of 2008, about 27,000 registered apprenticeship sponsors were training about 480,000 apprentices (Lerman, 2009)—about 0.3 percent of the total work force, and not quite 4 percent of new entrants to the work force.
Registered Apprenticeships are also concentrated in fields that require little or no postsecondary education. The top ten occupations within the program are: electrician, truck driver, carpenter, plumber, pipefitter, construction laborer, sheet metal worker, structural steel/ironworker, roofer, and dry wall applicator (Uvin et al., 2012). But in response to calls from the Government Accountability Office (GAO) for expansion of federal apprenticeships (in 2001 and 2004), the U.S. Department of Labor has made efforts to expand registered apprenticeships in the health care and IT industries.
57

A current challenge facing Registered Apprenticeship programs is the lack of educational recognition for the certificates that apprentices earn. Apprenticeship course work is often the equivalent of one year of community college; however, apprenticeship certificates are generally not accepted as proof of knowledge and skills by postsecondary institutions. Some states and colleges are finding ways to “cross-walk” apprenticeship certificates to credit-bearing college courses, enabling apprentices to gain credit for what they already know. For an example, see the Ivy Tech Community College certification crosswalk: http://www.ivytech.edu/pla/. In addition, a national Registered Apprenticeship-Community College Working Group, with membership from community colleges as well as the U.S. Departments of Education and Labor, was formed in January 2012, to facilitate the coordination of registered apprenticeship and community college programs so that apprentices can receive college credit.
For more information on Registered Apprenticeship, see http://www.doleta.gov/oa/ or visit the on-line community of practice at https://21stcenturyapprenticeship.workforce3one.org/.
Other Federal Initiatives
Gainful Employment Provisions
“Students at for-profit institutions represent 12 percent of all higher education students, 26 percent of all student loans, and 46 percent of all student loan dollars in default. The median federal student loan debt carried by students earning associate degrees at for-profit institutions is $14,000 while the majority of students at community colleges do not use federal loans for their education. More than a quarter of for-profit institutions receive 80 percent of their revenues from taxpayer-financed federal student aid.” (from http://www.ed.gov/news/press-releases/gainful-employment-regulations)
These problems and evidence of waste, fraud, and abuse in the for-profit sector prompted the development of a set of regulations designed to strengthen the integrity of the federal student aid program and ensure that taxpayer fund are used appropriately. The new regulations (which are slated to go into effect July 1, 2012) will apply to all Title IV-eligible certificate programs and all programs at for-profit institutions, which means that they will affect about 80% of postsecondary institutions. Under the new regulations, to qualify for federal aid, a postsecondary program must prepare students for “gainful employment.” A program is considered to lead to gainful employment if it meets at least one of the following three metrics: at least 35 percent of former students are repaying their loans; the estimated annual loan payment of a typical graduate does not exceed 30 percent of his or her discretionary income; or the estimated annual loan payment of a typical graduate does not exceed 12 percent of his or her total earnings. Institutions must collect the information for these metrics, and report their performance to the public and to the U.S. Department of Education, including disclosing on their web sites and in promotional material information on graduates’ employment rates, loan repayment rates, and debt-to-earnings
58

ratios. Institutions that fail the debt measures three times in a four-year period will lose eligibility to participate in federal student aid programs. (The final regulations are a less stringent version of those originally proposed by the Department, which would have resulted in a loss of eligibility after one year of poor performance.)
Discretionary Workforce Development Programs
Federal discretionary27 grant initiatives provide insight into the federal government’s current goals for postsecondary VET and beliefs around promising and effective practices. Two significant discretionary programs initiated during the Obama Administration are the Trade Adjustment Community College and Career Training Grant Program and the Workforce Innovation Fund. Both programs promote “career pathway” approaches to education and training (described in the following section) and attempt to strengthen alignment between postsecondary VET and the labor market. Both programs also emphasize evaluation and the development of an evidence-based approach to workforce development.
The Trade Adjustment Assistance Community College and Career Training Grant Program aims to build the capacity of community colleges to meet the needs of adult learners. The Workforce Innovation Fund aims to improve the performance and cost-efficiency of workforce training programs by encouraging cross-system collaboration among the vocational education, public workforce, and human services systems. Both programs are administered by the U.S. Department of Labor, in collaboration with the U.S. Department of Education.
Trade Adjustment Assistance Community College and Career Training (TAACCCT) Grant Program. The TAACCCT grant program, initiated in March 2010, is an extension of the Trade Adjustment Act, which aims to help workers dislocated by international trade to access educational and job training programs. The $2 billion program is being implemented over four years, with $500 million grant competitions each year; each state is guaranteed at least $2.5 million in each competition. The grants are designed to support capacity-building by community colleges to “expand and improve their ability to deliver education and career training programs that can be completed in two years or less, are suited for workers who are eligible for training under [TAA], and prepare program participants for employment in high-wage, high-skill occupations.” To support this goal, TAACCCT grants help community colleges implement the following four strategies:
• Accelerate progress for low-skilled and other workers—increase success rates for students with basic skills deficiencies, using strategies such as contextualized learning that combines basic skills with occupational training; improve student support services; and partner with community-based organizations and other entities that serve the targeted population.
27 Discretionary grants are awarded based on a competitive process rather than by formula.
59

• Improve retention and achievement to reduce time to completion—improve education and training courses and develop innovative techniques in course sequencing, scheduling, and delivery to reduce barriers to enrollment, increase student success, and reduce the time needed to attain degrees, certificates, and other industry-recognized credentials.
• Expand programs that meet industry needs, including career pathways—expand and improve programs to ensure relevance to area workforce requirements, offer credit for both academic and occupational training, integrate industry-based competencies, and enable participants to earn credentials that support employment and/or further education.
• Strengthen online and technology-enabled learning—develop and implement on-line and technology-enabled courses and projects.
The program is currently receiving applications for the second round of competition. For more information on TAACCCT, including recent grantee awards and project descriptions, see http://www.doleta.gov/taaccct/.
The Workforce Innovation Fund. The Workforce Innovation Fund seeks to improve the delivery of training and employment services through closer alignment and integration of workforce development, education, human services, social insurance, and economic development programs. The program will compete nearly $100 million to support changes in structures and policies at the state and local levels. The focus on “systems change” reflects a growing emphasis in the U.S. on streamlining services and breaking down the silos that exist between programs operated by different government agencies (see next section on “Career Pathways Approach”.)
The Workforce Innovation Fund is also one of several new federal grant programs (including the U.S. Department of Education’s Investing in Education Fund (I3) and The Corporation for National and Community Service’s Social Innovation Fund) in which agencies fund projects that use evidence to design program strategies. By focusing on change at both the service delivery and systems levels, and by requiring rigorous evaluations of each investment, the hope is that these initiatives will form a sounder basis for change and improvement in the public workforce system.
Career Pathways Approach
A cursory review of reports put out by the Government Accountability Office makes it clear that a frequent issue with federal initiatives—in almost any program area—is that they are uncoordinated, fragmented, and duplicative. The federal system for workforce training is no exception. In response to growing recognition that our current systems for providing training and employment services are (1) difficult for students, job seekers, and employers to navigate, and
60

(2) neither cost-efficient nor effective in terms of outcomes, three federal agencies have recently joined forces to advocate for a more cohesive and comprehensive workforce preparation system.
Currently, the education, public workforce, and social service systems are administered, respectively, by the U.S. Departments of Education, Labor, and Health and Human Services, with little or no coordination among them. These agencies have adopted the career pathways approach (or career pathway system) to encourage articulation across these public systems. The goal is to develop a more efficient approach to vocational education and training by better coordinating the necessary adult basic education, occupational training, secondary education, postsecondary education, career and academic advising, and support services needed by those seeking employment—in effect, to foster integrated, coordinated education and employment services.
The Departments of Education, Labor, and Health and Human Services recently issued a joint letter encouraging the use of the career pathway approach by states and local areas28. To incorporate the career pathway approach in federally funded programs, the Departments are taking a number of steps, such as:
• The Department of Labor’s new Workforce Innovation Fund (summarized above) seeks to improve the delivery of training and employment services through closer alignment and integration of workforce development, education, human services, social insurance, and economic development programs.
• The Department of Health and Human Services’ Administration for Children and Families is funding a large-scale evaluation of a career pathways program, Innovative Strategies for Increasing Self-Sufficiency (ISIS). This study will test ISIS approaches within a rigorous evaluation framework in an effort to produce strong evidence of effectiveness. More information on ISIS can be found at http://www.projectisis.org.
• The Departments of Labor and Education launched a one-year Career Pathways
Initiative in June 2010, funding nine states and two Native American tribal entities to develop career pathways and promote linkages among system partners. To support the Career Pathways Initiative, the Department of Labor’s Employment and Training Administration produced technical assistance tools, webinars, and resources to help state, local, and tribal policymakers implement career pathway approaches. These resources, including an overview of each grantee’s work, are available at www.learnwork.workforce3one.org.
28 See http://www2.ed.gov/news/newsletters/ovaeconnection/2012/04122012.html.
61

• The Department of Education’s Office of Vocational and Adult Education is funding the Designing Instruction for Career Pathways initiative, which seeks to assist state and local adult education providers in developing and delivering career pathway programs for low-skilled adults. As part of this effort, an on-line Adult Career Pathways Training and Support Center (http://www.acp-sc.org) has been developed, to provide technical assistance resources, policy briefs, and the latest research on the effectiveness of career pathways for those who are considering or currently implementing this approach.
Industry Competency Models
To promote a broader understanding of the competencies needed to train a globally competitive workforce, the U.S. Department of Labor has launched the Industry Competency Model Initiative. Through this initiative, Labor and industry partners collaborate to develop models of the foundation (i.e., general) and technical competencies that are needed in economically vital sectors of the American economy. The models are intended to serve as a resource for discussions among industry leaders, educators, and public workforce professionals as they work to identify employer skill needs; develop competency-based curricula and training models; develop industry-defined performance indicators, skill standards, and competencies; and develop resources for career exploration and guidance. The initiative currently supports 20 models. More information on this initiative and each model can be found on the Competency Model Clearinghouse website, at http://www.careeronestop.org/CompetencyModel/default.aspx. State and Other Career Pathways Initiatives
The federal focus on career pathways follows the initiative taken by a number of states to align their education, training, and employment services. These state efforts, in turn, have been aided by a number of private foundations that support the development of more concrete and coherent career pathways for low-skill adults—for example, the Joyce Foundation’s “Shifting Gears” initiative, and Jobs for the Future’s “Accelerating Opportunity” initiative (funded by a number of foundations). State initiatives include:
Oregon. One of the earliest states to adopt a career pathways approach, Oregon launched the Career Pathways Statewide initiative in 2004 in order to align its community college programs with local industry needs and with the needs of adult learners. The initiative seeks to 1) increase the number of Oregonians with certificates, credentials, and degrees in high-demand occupations and 2) articulate and ease student transitions across the education continuum, from high school to community college, from pre-college (adult basic education) to postsecondary education, and from community college to university or employment.
Washington. Washington introduced a new approach to adult education called Integrated Basic Education and Skills Training (I-BEST). I-BEST pairs workforce training with adult basic
62

education so that students learn literacy as part of their acquisition of workplace skills. Adult literacy and vocational instructors work together to develop and deliver instruction within VET courses. I-BEST operates in every community college in Washington, across a variety of industry sectors. A number of state policies support I-BEST. In 2005, the State Board for Community and Technical Colleges (SBCTC) approved enhanced funding of programs that meet the I-BEST program criteria, providing 1.75 times the normal reimbursement rate to compensate colleges for the increased costs of I-BEST programs. To be approved by the SBCTC for funding, colleges must show that I-BEST courses are part of a “career pathway,” a certificate or degree program that leads to jobs that are in demand in the local labor market. A separate Student Achievement Initiative provides an incentive system that rewards colleges for the gains students make in increasing basic skills, attaining certificates, or receiving degrees. Finally, the legislature offers, through a competitive process, “high demand” funds for community and technical colleges to respond to the state’s industry skill needs.
Minnesota. Minnesota’s FastTRAC is a state-wide initiative that aligns resources among local, state, and national partners to meet the skills needs of Minnesota businesses. To encourage postsecondary degree completion and subsequent employment, the program provides basic skills instruction, targets occupations in high demand, and is tailored to adults who are working full-time and/or taking care of a family; the program also offers career and academic advising, childcare, and transportation services. As in I-BEST, adult basic education and VET instructors co-teach VET courses. Support for FastTRAC comes from state partners that cut across agencies, including the state higher education offices, departments of employment and economic development, human services, and labor and industry. These partners award grants to local partnerships through a competitive process. Currently, 17 grantees operate FastTRAC programs.
Wisconsin. Wisconsin’s Regional Industry Skills Education (RISE) is a joint initiative of the Wisconsin Technical College System and the Wisconsin Department of Workforce Development. The RISE initiative uses the career pathway model to realign state policies and programs in order to create a more accessible and navigable career training system for low-skill adults. RISE seeks to increase the number of low-skill adults in the state who receive VET postsecondary credentials, and to improve the policy environment for reaching that goal. The initiative includes a “bridge” program to help move adult basic education learners into postsecondary education, using contextualized learning. The initiative also creates linked education and workforce pathways that allow adults to use technical college courses to move from low-skill, low-pay jobs into higher-skill, higher-pay jobs.
REFORM AGENDAS AND POLICY OPTIONS
What sort of reforms do various participants wish to see made to postsecondary VET? Focusing here on five sets of public stakeholders, one can identify these concerns:
63

o U.S. student aid policymakers -- As the leading federal investors in VET through its federal student aid programs, these policymakers have been keenly concerned about the quality of provision, and the capacity of graduates to find “gainful employment” sufficient to repay their loans (and, more generally, to ensure economic well-being). The recent promulgation of the gainful employment regulations is intended as one step in the direction of quality assurance.
o Federal policymakers – International data showing that the U.S. is falling behind in postsecondary attainment has brought attention to the relatively low rates at which postsecondary students complete a credential. The Obama administration wants to increase college completion rates and the percent of U.S. adults who have completed at least one year of postsecondary education. But, outside of federal student aid, the federal government has little leverage other than the bully pulpit to effect such change.
o The Veterans Administration – The Veterans administration is now also a major investor through the post 9/11 GI Bill, and shares a concern with quality and student outcomes.
o State policymakers – These policymakers are concerned about the adequacy of the supply of VET graduates to meet the needs of employers and regional economic development, and the efficiency with which publicly financed programs operate. They are less engaged in questions of reform per se; their focus has typically centered on securing wider assistance from federal authorities in meeting the cost of funding community colleges, especially as the current recession has taken its toll on state budgets.
o The Perkins Act/CTE community – OVAE, state directors of CTE, and CTE researchers/advocates have focused on the establishment or strengthening of CTE “programs of study.” To state the matter over-simply, they wish to see a system of VET commencing in secondary schools that is closely aligned, in teaching, curriculum, and assessment, to postsecondary VET programs and to postsecondary baccalaureate programs, resulting in a pathway where two years of preparation in high school is linked to 2-year sub-baccalaureate programs, which are in turn linked to 4-year baccalaureate programs.
Each of these reform agendas faces challenges, but the challenges facing the adoption of linked secondary-postsecondary VET pathways are especially tough. Throughout the past century the U.S. has had a low level of integration between its secondary and postsecondary educational systems—whether one considers its academic or vocational dimensions (Parnell, 1991). The organization of secondary and postsecondary education in the United States is powerfully centrifugal – with separate state governing bodies, state legislative committees, national legislative subcommittees, professional associations, statutes, funding streams, career systems, and specialized media. Seen in this light, the weak alignment of secondary to postsecondary VET is simply one aspect of a much larger phenomenon. In addition, the primary policy tool available bring about more robust programs of study – the Perkins Act – is ill-suited to the task. In the larger scheme of postsecondary VET funding, Perkins is very small. Moreover, because it is a formula grant program (rather than a competitive grant program), it is difficult to use it as a
64

means to shape the behavior of secondary and postsecondary institutions. As Annex B indicates, dollars are driven out to states and localities by population-based formulas, and both state and local recipients have wide latitude in how funds are used.
The existence of robust, linked secondary and postsecondary VET programs, where they exist, probably owe more to industry standards and practices, or to longstanding public policies outside of federal legislation. Some pathways between secondary vocational education and postsecondary vocational education – and the workplace – do exist. A long history of applied agricultural education has yielded an infrastructure that links secondary and postsecondary agricultural education. Military education – the junior reserve officer training program – has been supported by the U.S. Department of Defense since 1916. Automotive repair/technology is an industry with robust occupational standards and certification, and longstanding high school programs are joined to both, creating school-to-work pathways.29 However, absent clear industry foundations in training, standards, and/or assessment, such education pathways tend to be nebulous.
Finally, few high school students invest heavily in vocational education. Fewer than one in five high school graduates has taken three courses within a specific occupational area, so few leave high school with much in the way of sunk costs. Given the low level of initial investment, the rate of persistence in an area of occupational concentration is fairly low. Even among those who pursue an initial VET “concentration” (three courses) in high school, only about 20% continue their work or education within the same occupational area.30
If “programs of study” are to meaningfully exist, they must be something that students recognize, value, and follow; we offer below some proposals for creating more meaningful programs of this type.
Reform and the Perkins Act
How could the federal policy role available through the Perkins Act be used to accomplish reform in postsecondary VET?
Probably one dollar in four from Perkins goes to overhead at the federal and state level (e.g. accountability and reporting systems) rather than to instruction delivered at the educational institution. One way to more efficiently use Perkins dollars would be to make them a subsidy delivered directly to students for sub-baccalaureate programs in selected subject fields. These dollars could be a top-up to student Pell grant awards, obtained based upon enrollment in a
29 The automotive repair pathway has been supported by the joint work of the National Automotive Technicians Education Foundation (NATEF), which accredits training programs, and the National Institute for Automotive Service Excellence (ASE), which accredits automotive service technicians. 30 See table H112 at http://nces.ed.gov/surveys/ctes/tables/index.asp?LEVEL=SECONDARY.
65

program of study—or the money could be used for loan forgiveness upon completion of an eligible program. Funding could be provided to students enrolled in any eligible institution, whether public, nonprofit, or for-profit, or could be reserved for public institutions (as Perkins funds currently are). Although dollar amounts would not be large, this would send a signal to students about the importance of the fields they have chosen. Delivered as loan forgiveness, this funding strategy would provide an incentive for students to complete their studies.
Alternatively, economies achieved in the delivery of funding could be repurposed to new activities that would effectively cultivate VET program paths, based upon public/private partnerships, described below.
Secondary to Postsecondary Paths. National activities monies could be used to collaborate with the College Board, ACT, or other assessment firms to develop a modest program of “Advanced Placement” for a core set of five to ten occupational courses. A small set of such courses would give students an investment in an education path that they presently lack, since they would now have portable credits. This would also help, in a small way, to achieve parity of esteem between academic and occupational coursework.
Secondary to Work Paths. Secondary education Perkins dollars could flow to states or schools by formula—but by a formula that rewards the development and use of school-to-career paths. For example, Perkins dollars to secondary institutions could be allocated based upon a formula in which both student counts and student employment in a job related to the field in which s/he studied. This would introduce a performance basis into funding, encouraging programs to align courses and assessments to labor market demand. To ensure that schools are rewarded for the student outcomes among those who continue to postsecondary VET, the formula could also recognize “one year of credit” in postsecondary programs, as do other U.S. Department of Education initiatives, e.g. Race to the Top.
The present Perkins funding system has no way of joining exhortation (“build programs of study”) to funding. Proposals such as these would join them as they have not been in the past.
Unique Features of the U.S. System
A number of features of the U.S. VET system will require consideration as the OECD develops its analysis and recommendations. These include:
• The U.S. has a decentralized, loosely regulated education system, with very limited federal input or control.
• VET and academic education in the U.S. are not clearly bifurcated education paths.
• Education, workforce development, and social services operate through separate policy bodies at the national level and in most states.
• The U.S. education and workforce systems generally have weak ties between employers and employees, and between employers and schools.
66

• Postsecondary VET operates through both public and private sectors, and has widely variable institutional provision.
• Postsecondary VET in the public sector is provided in institutions (community colleges) that serve a wide range of missions and student populations.
Using International Comparisons to Advance U.S. Reform Efforts
This OECD study can be most helpful to the U.S. if it assists in the following ways.
• Help the U.S. VET community understand the distinctiveness of the U.S. system, including how dissimilar it is to continental European, especially Germanophone, systems (and vice versa). Understanding how embedded each education system is in longstanding labor market institutions (and cultural assumptions about class and work) should help us to recognize that we must build reforms out of the socio-cultural context in which we live.
• Help identify systems that do look like the U.S., with low investment in specialized secondary VET, and a heavy dependence upon a decentralized system of postsecondary VET to deliver occupationally-focused skills and training, and in which industry-based standards and assessments and externally-awarded qualifications figure prominently. What can we learn from these similar systems?
• Following from the two points above, focus on analysis and recommendations that call for policy options that have a high prospect of adoption within the U.S. National qualification frameworks, for example, are unlikely to be adopted in the U.S.
67

REFERENCES
ACTE (2006). The Perkins Act of 2006: The Official Guide. Alexandria, VA: Association for Career and Technical Education.
Alliance for Excellent Education (2006, August). Paying Double: Inadequate High Schools and Community College Remediation. Available at http://www.all4ed.org/files/archive/ publications/remediation.pdf.
Baily, T. (2006). “Increasing Competition and Growth of the For-Profits.” In Bailey, T. and Morest, V.S. (eds.), Defending the Community College Equity Agenda. Baltimore, MD: The Johns Hopkins University Press.
Bailey, T., Badway, N., and Gumport (2001). For-Profit Higher Education and Community Colleges. Stanford, CA: National Center for Postsecondary Improvement. Available at http://www.stanford.edu/group/ncpi/documents/pdfs/forprofitandcc.pdf.
Bailey, T., Kienzl, G. and Marcotte, D.E. (2004). The Return to a Sub-Baccalaureate Education: The Effects of Schooling, Credentials and Program of Study on Economic Outcomes. Washington, DC. Paper prepared for the National Assessment of Vocational Education, U.S. Department of Education. Available at http://ccrc.tc.columbia.edu/publications/ return-to-sub-baccalaureate-education.html.
Bailey, T., Leinbach, T., Scott, M., Alfonso, M., Kienzl, G. and Kennedy, B. (2004, August). The Characteristics of Occupational Students in Postsecondary Education. CCRC Brief No. 21. New York, NY: Community College Research Center, Teachers’ College, Columbia University. Available at http://ccrc.tc.columbia.edu/media/k2/attachments/ characteristics-occupational-students-postsecondary-brief.pdf.
Belfield, C.R. and Bailey, T. (2011). “The Benefits of Attending Community College: A Review of the Evidence.” Community College Review, 39(46). Available at http://crw.sagepub.com/content/39/1/46.
Belfield, C.R. and Crosta, P.M. (2012, February). Predicting Success in College: The Importance of Placement Tests and High School Transcripts. CCRC Working Paper No. 42. New York, NY: Community College Research Center, Teachers’ College, Columbia University. Available at http://toped.svefoundation.org/wp-content/uploads/2012/02/ Predicting-Success-in-College-The-importance-of-placement-tests-and-high-school-transcripts.pdf.
Bell, A. C., Carnahan, J., and L’Orange, H.P. (2011). State Tuition, Fees, and Financial Assistance Policies for Public Colleges and Universities 2010-11. Boulder, CO: State Higher Education Executive Officers. Available at http://www.sheeo.org/resources/
68

publications/state-tuition-fees-and-financial-assistance-policies. Downloaded March 22, 2011.
Bettinger, B.T. and Long, E.P. (2009). Addressing the Needs of Underprepared Students in Higher Education: Does College Remediation Work? The Journal of Human Resources, 44(3), 736-771.
Bosworth, B. (2010). Certificates Count: An Analysis of Sub-baccalaureate Certificates. Washington, DC: Complete College America. Available at http://www.completecollege. org/docs/Certificates%20Count%20FINAL%2012-05.pdf.
Bosworth, B. (2011). “Expanding Certificate Programs.” In Issues in Science and Technology, Fall 2011, pp. 51-57. Available at http://www.issues.org/28.1/bosworth.html.
Bound, J., Lovenheim, M., and Turner, S. (2009). Why Have College Completion Rates Declined? An Analysis of Changing Student Preparation and Collegiate Resources. NBER Working Paper 15566. Cambridge, MA: National Bureau of Economic Research. Available at http://www.nber.org/papers/w15566.
Calcagno, J.C. and Long, B.T. (2008). The Impact of Postsecondary Remediation Using a Regression Discontinuity Approach: Addressing Endogenous Sorting and Noncompliance. NHES Working Paper No. 14194. Cambridge, MA: National Bureau of Economic Research. Available at http://www.nber.org/papers/wp14194.
Cellini, S.R. and Goldin, C. (2012, Feb.). Does Federal Student Aid Raise Tuition? New Evidence on For-Profit Colleges. NBER Working Paper Series, Working paper 17827. New York, NY: National Bureau of Economic Research.
Clery, S. (2008). Postsecondary Career/Technical Education: Changes in the Number of Offering Institutions and Awarded Credentials from 1997 to 2006. (NCES 2008-001). Washington DC: National Center for Education Statistics, Institute of Education Sciences, U.S. Department of Education. Available at http://nces.ed.gov/pubs2008/ 2008001.pdf.
College Board (2011a). Trends in Student Aid 2011. Available at http://trends.collegeboard.org/.
College Board (2011b). Trends in College Pricing 2011. Available at http://trends.collegeboard.org/.
College Board (2008). Trends in Student Aid 2008. Available at http://trends.collegeboard.org/.
Council for Higher Education Accreditation (2006). CHEA 2005 Almanac of External Quality Review. Washington, DC: Author.
Creighton, S. and Hudson, L. (2002). Participation Patterns and Trends in Adult Education: 1991 to 1999. (NCES 2002-119). Washington DC: National Center for Education Statistics, Institute of Education Sciences, U.S. Department of Education. Available at http://nces.ed.gov/pubsearch/pubsinfo.asp?pubid=2002119.
69

Crissey, S. and Bauman, K. (2010, April). Between a Diploma and a Bachelor’s Degree: The Effects of Sub-Baccalaureate Postsecondary Educational Attainment and Field of Training on Earnings. Paper prepared for the annual meeting of the Population Association of America, Dallas, TX. Available at http://www.edweek.org/media/ censusdiplomas-34jobs.pdf.
Ewert, S. (2012). What It’s Worth: Field of Training and Economic Status in 2009. Washington, DC: U.S. Census Bureau, U.S. Department of Commerce. Available at http://www.census.gov/prod/2012pubs/p70-129.pdf.
Fonte, R. (1997). “Structured Versus Laissez-Faire Open Access: Implementation of a Proactive Strategy.” New Directions for Community Colleges, 1997(100), 43-52.
GAO (2008). Community Colleges and One-Stop Centers Collaborate to Meet 21st Century Workforce Needs. (GAO-08-547). Washington, DC: U.S. Government Accountability Office, Report to Congressional Requestors, May 15, 2008. Available at http://www.gao.gov/products/GAO-08-547.
GAO (2010). Undercover Testing Finds Colleges Encouraged Fraud and Engaged in Deceptive and Questionable Marketing Practices. (GAO-10-948T). Washington, DC: U.S. Government Accountability Office, testimony before the Committee on Health, Education, Labor, and Pensions, U.S. Senate. Available at http://www.gao.gov/new.items/d10948t.pdf.
GAO (2011). Student Outcomes Vary at For-Profit, Nonprofit, and Public Schools. (GAO-12-143). Washington, DC: U.S. Government Accountability Office, testimony before the Committee on Health, Education, Labor, and Pensions, U.S. Senate. Available at http://www.gao.gov/products/GAO-12-143.
Gappa, J.M., and Leslie, D.W. (1993). The Invisible Faculty: Improving the Status of Part-Timers in Higher Education. San Francisco, CA: Jossey-Bass.
Gladieux, L.E. (1995). Federal Student Aid Policy: A History and an Assessment. Available at http://www2.ed.gov/offices/OPE/PPI/FinPostSecEd/gladieux.html.
Grubb, W.N. (1995). “Postsecondary Education and the Sub-Baccalaureate Labor Market: Corrections and Extensions.” Economics of Education Review, 14(3), 285-299.
Grubb, W.N. (1995b). The Returns to Education and Training in the Sub-Baccalaureate Labor Market: Evidence from the Survey of Income and Program Participation, 1984-1990. National Center for Research in Vocational Education, Publication MDS-756. Berkeley, CA: University of California at Berkeley.
Grubb, W.N. (1996). Working in the Middle: Strengthening Education and Training for the Mid-Skilled Labor Force. San Francisco, CA: Jossey-Bass Publishers.
Grubb, W.N. (2002). “Learning and Earning in the Middle, Part 1: National Studies of Pre-Baccalaureate Education.” Economics of Education Review, 21, 299-321. Available at http://ac.els-cdn.com/S0272775701000425/1-s2.0-S0272775701000425-
70

main.pdf?_tid=3a36cbd857cb0e3946e8c68ec3a6a457&acdnat=1333635687_23d605fe788ec49e470d81b2afa646c6.
Grubb, W.N. (2006). “’Like, What Do I Do Now?’ The Dilemmas of Guidance Counseling.” In Defending the Community College Equity Agenda, edited by T. Bailey and V. Smith Morest. Baltimore, MD: The Johns Hopkins University Press.
Harnisch, T.L. (2011). Performance-based Funding: A Re-Emerging Strategy in Public Higher Education Financing. Washington, DC: American Association of State Colleges and Universities. Available at http://www.congressweb.com/aascu/docfiles/Performance _Funding_AASCU_June2011.pdf.
Horn, L. and Berktold, J. (1998). Profile of Undergraduates in U.S. Postsecondary Education Institutions: 1995-96. NCES 98-084. Washington, DC: U.S. Department of Education, National Center for Education Statistics. Available at http://nces.ed.gov/pubsearch/pubsinfo.asp?pubid=98084.
Hurley, D.J., McBain, L., Harnisch, T.L., Parker, E., and Russell, A. (2012, January). Top 10 Higher Education State Policy Issues for 2012. Washington, DC: American Association of State Colleges and Universities. Available at http://www.aascu.org/uploadedFiles/ AASCU/Content/Root/PolicyAndAdvocacy/PolicyPublications/Policy_Matters/Top_Ten_State_Policy_Issues_2012.pdf.
Hudson, L., Kienzl, G. and Diehl, J. (2007). Students Entering and Leaving Postsecondary Occupational Education: 1995-2001. NCES 2007-041. Washington, DC: U.S. Department of Education, National Center for Education Statistics. Available at http://nces.ed.gov/pubsearch/pubsinfo.asp?pubid=2007041.
Kane, T.J. and Rouse, C.E. (1995). “Comment on W. Norton Grubb: ‘The Varied Economic Returns to Postsecondary Education: New Evidence from the Class of 1972’”. The Journal of Human Resources, 30(1), 205-221.
Katsinas, S.G., Tollefson, T.A., and Reamey, B.A. (2008). Funding Issues in U.S. Community Colleges: Findings from a 2007 Survey of the National State Directors of Community Colleges. Washington, DC: American Association of Community Colleges.
Kezar, A., and Sam, C. (2010). Understanding the New Majority of Non-Tenure-Track Faculty in Higher Education: Demographics, Experiences, and Plans of Action. ASHE Higher Education Report 36(4). Hoboken , NJ: Wiley Periodicals.
Knapp, L. G., Kelly-Reid, J.E., and Ginder, S.A. (2011). Postsecondary Institutions and Price of Attendance in the United States: 2010-11, Degrees and Other Awards Conferred: 2009-10, and 12-Month Enrollment: 2009-10 (NCES 2011-250). Author. Available at http://nces.ed.gov/pubs2011/2011250.pdf.
Lee, J.B. and Clery, S.B. (1999). Employer Aid for Postsecondary Education (NCES 1999-181). Washington DC: National Center for Education Statistics, Institute of Education Sciences, U.S. Department of Education. Available at http://nces.ed.gov/pubs99/1999181.pdf. Retrieved March 16, 2012
71

Lerman, R. I. (2009). Training Tomorrow’s Workforce: Community College and Apprenticeship as Collaborative Routes to Rewarding Careers. Washington, DC; Center for American Progress. Available at http://www.americanprogress.org/issues/2009/12/pdf/comm _colleges_apprenticeships.pdf.
Lewin, T. (2010, Nov. 9) Scrutiny Takes Toll on For-Profit College Company. The New York Times. Available at http://www.nytimes.com/2010/11/10/education/10kaplan.html?page wanted=all.
LoGerfo, L., Christopher, E.M. and Flanagan, K.D. (2011). High School Longitudinal Study of 2009: A First Look at Fall 2009 Ninth-Graders’ Parents, Teachers, School Counselors, and School Administrators. (NCES 2011-355). Washington DC: National Center for Education Statistics, Institute of Education Sciences, U.S. Department of Education. Available at http://nces.ed.gov/pubsearch/pubsinfo.asp?pubid=2011355.
McPhail, C.J. (2011). The Completion Agenda: A Call to Action. Washington, DC: American Association of Community Colleges. Available at http://www.aacc.nche.edu/ Publications/Reports/Documents/CompletionAgenda_report.pdf.
Melguizo, T., Bos, J., and Prather, G. (2011). Is Developmental Education Helping Community College Students Persist? A Critical Review of the Literature. American Behavioral Scientist, 55(2), 173-184. Available at http://abs.sagepub.com/content/55/2/173.
Marcotte, D. E. (2010). The Earnings Effect of Education at Community Colleges. Contemporary Economic Policy, 28(1), 36-51.
Mullin, C.M. (2010, September). Doing More with Less: The Inequitable Funding of Community Colleges. AACC Policy Brief 2010-03PBL. Washington, DC: American Association of Community Colleges.
Parmley, K., Bell, A., L’Orange, H. and Lingenfelter, P. (2009). State Budgeting for Higher Education in the United States as Reported for Fiscal Year 2007. Boulder, CO: State Higher Education Executive Officers. Available at http://www.sheeo.org/finance/ Budgeting_For_Higher_Ed.pdf.
Parnell, D. (1991). The Neglected Majority. Washington, DC: The Community College Press.
Parsad, B. and Lewis, L. (2003). Remedial Education at Degree-Granting Postsecondary Institutions in Fall 2000. Washington DC: National Center for Education Statistics, Institute of Education Sciences, U.S. Department of Education. Available at http://nces.ed.gov/pubs2004/2004010.pdf.
Ratcliff, J. L. (undated). Community Colleges – The History of Community Colleges, the Junior College and the Research University: The Community College Mission. Downloaded from http://education.stateuniversity.com/pages/1873/Community-Colleges.html.
72

Rich, M. (2012, April 8). “Federal Funds to Train the Jobless Are Drying Up.” New York, NY: New York Times. Available at http://www.nytimes.com/2012/04/09/business/economy/federal-funds-to-train-jobless-are-drying-up.html?_r=2&hp.
Rivera, C. (2012). Santa Monica College to offer Two-Tier Course Pricing. Los Angeles, CA: Los Angeles Times, March 14, 2012.
Rosenbaum, J.E. (2001). Beyond College for All: Career Paths for the Forgotten Half. New York, NY: Russell Sage Foundation.
Rosenbaum, J.E., Deil-Amen, R., and Person, A.E. (2006). After Admission: From College Access to College Success. New York, NY: Russell Sage Foundation.
Russell, A. (2008). Enhancing College Student Success Through Developmental Education. Washington, DC: American Association of State Colleges and Universities.
Schuetz, P. and Barr, J. (eds.). (2009) “Are Community Colleges Underprepared for Underprepared Students?” New Directions for Community Colleges, 2009(144).
Scott-Clayton, E. (2012, February). Do High-Stakes Placement Exams Predict College Success? CCRC Working Paper No. 42. New York, NY: Community College Research Center, Teachers’ College, Columbia University. Available at http://ccrc.tc.columbia.edu/Publication.asp?UID=1026.
Scott-Clayton, E. (2011, January). The Shapeless River: Does a Lack of Structure Inhibit Students’ Progress at Community Colleges? CCRC Working Paper No. 25. New York, NY: Community College Research Center, Teachers’ College, Columbia University. Available at http://ccrc.tc.columbia.edu/Publication.asp?UID=839.
Shulock, N., Moore, C., and Offenstein, J. (2011, Feb.) The Road Less Traveled: Realizing the Potential of Career Technical Education in the California Community Colleges. Sacramento, CA: California State University, Institute for Higher Education Leadership and Policy. Available at http://www.ecs.org/html/Document.asp?chouseid=9253.
Shults, C. (2001). Remedial Education: Practices and Policies in Community Colleges. Washington, DC: American Association of Community Colleges.
Snyder, T.D., and Dillow, S.A. (2011). Digest of Education Statistics 2010. (NCES 2011-015). National Center for Education Statistics, U.S. Department of Education: Washington, DC. Available at http://nces.ed.gov/pubsearch/pubsinfo.asp?pubid=2011015.
Toossi, M. (2012, Jan.). “Labor Force Projections to 2020: A More Slowly Growing Workforce.” Monthly Labor Review Online, 135(1). Washington, DC: Bureau of Labor Statistics, U.S. Department of Labor. Available at http://www.bls.gov/opub/mlr/2012/01/.
U.S. Census Bureau (2012). Statistical Abstracts of the United States 2012. Washington, DC: U.S. Department of Commerce. Available at http://www.census.gov/compendia/statab/.
73

U.S. Department of Education, Office of the Under Secretary, Policy and Program Studies Service (2004). National Assessment of Vocational Education: Final Report to Congress, Executive Summary. Washington, DC: Author. Available at http://www2.ed.gov/rschstat/ eval/sectech/nave/naveexesum.pdf.
U.S. Department of Education, National Center for Education Statistics (2009). Web Tables—Choosing a Postsecondary Institution: Considerations Reported by Students (NCES 2009-186). Washington, DC: Author. Available at http://nces.ed.gov/pubs2009/ 2009186.pdf.
U.S. Department of Education, National Center for Education Statistics (2010a). Web Tables—Profile of Undergraduate Students: 2007-08 (NCES 2010-205). Washington, DC: Author. Available at http://nces.ed.gov/pubs2010/2010205.pdf.
U.S. Department of Education, National Center for Education Statistics (2010b). Web Tables—Trends in Undergraduate Stafford Loan Borrowing: 1989-90 to 2007-08 (NCES 2010-183). Washington, DC: Author. Available at http://nces.ed.gov/pubs2010/2010183.pdf.
U.S. Department of Education, National Center for Education Statistics (2010c). Web Tables—Student Financing of Undergraduate Education: 2007-08 (NCES 2010-162). Washington, DC: Author. Available at http://nces.ed.gov/pubs2010/2010162.pdf.
U.S. Department of Education, National Center for Education Statistics (2011a). Web Tables—Students Attending For-Profit Postsecondary Institutions: Demographics, Enrollment Characteristics, and 6-year Outcomes (NCES 2012-173). Washington, DC: Author. Available at http://nces.ed.gov/pubsearch/pubsinfo.asp?pubid=2012173.
U.S. Department of Education, National Center for Education Statistics (2011b). Web Tables—Trends in Student Financing of Undergraduate Education: Selected Years, 1995-96 to 2007-08 (NCES 2011-218). Washington, DC: Author. Available at http://nces.ed.gov/pubsearch/pubsinfo.asp?pubid=2011218.
U.S. Department of Education, National Center for Education Statistics (2011c). Web Tables—Six-Year Attainment, Persistence, Transfer, Retention, and Withdrawal Rates of Students Who Began Postsecondary Education in 2003-04 (NCES 2011-152). Washington, DC: Author. Available at http://nces.ed.gov/pubs2011/2011152.pdf.
U.S. Department of Education, National Center for Education Statistics (2012). Web Tables—Characteristics of Associate’s Degree Attainers and Time to Associate’s Degree (NCES 2012-271). Washington, DC: Author. Available at http://nces.ed.gov/pubs2012/2012271.pdf.
Uvin, J., Ladd, J., Goodman, C., and Snider, M. (2012). Registered Apprenticeship-Community College Work Group’s Framework for Articulating from Apprenticeship to College Degrees. Presentation at the January 27, 2012 American Association of Community Colleges’ Workforce Development Institute, Miami, Florida.
Van Noy, M., Jacobs, J., Korey, S., Bailey, T., and Hughes, K.L. (2008). Noncredit Enrollment in Workforce Education: State Policies and Community College Practices. Washington,
74

DC: American Association of Community Colleges. Available at http://www.aacc. nche.edu/Publications/Reports/Documents/noncredit.pdf.
Welch, S. R. (undated). What Does Accreditation Mean to You, the Student? Washington, DC: Distance Education and Training Council. Available at http://www.detc.org/downloads/ publications/WhatdoesAccreditationMeantoYou.PDF.
75

ANNEX A. STATE GOVERNANCE STRUCTURES FOR POSTSECONDARY VET (2007)
State Governance Structure
Alabama The State Board of Education is the State Board for Vocational Education.
Alaska In 1996, the Governor's Council on Vocational Education was eliminated. Currently, the Alaska Human Resources Investment Council plays a role in statewide vocational education planning. The Commission on Postsecondary Education has statutory authority for planning postsecondary vocational education. The state's regional universities offer vocational education programs under Board of Regents authority.
Arizona The State Board of Education serves as the State Board of Vocational Education. All less-than-baccalaureate programs offered by institutions of postsecondary education, however, are under governing boards of those institutions. Occupational programs offered by institutions designated as area vocational schools are under the supervision of the State Board of Education.
Arkansas Under the reform legislation of 1997, the State Board of Workforce Education and Career Opportunities replaced the State Board of Education as the State Board for Vocational Education. Legislation also changed the name of the Division of Vocational and Technical Education to the Arkansas Department of Workforce Education. This department and its director report directly to the State Board of Workforce Education and Career Opportunities, operate 10 postsecondary vocational-technical programs at all levels.
California In California, the State Board of Education has been designated by the federal government as the State Board of Vocational Education. Most responsibilities, however, are executed by a Joint Committee on Vocational Education, which has equal representation from both the Board of Education and the Board of Governors of the California Community Colleges.
Colorado The State Board for Community Colleges and Occupational Education is the State Board of Education.
Connecticut The State Board of Education serves as the State Board of Vocational Education. The Commissioner of Higher Education serves as an ex-officio member by virtue of the elected office he or she holds.
Delaware The State Board of Education serves as the State Board of Vocational Education. In Delaware, all less-than-baccalaureate occupational education programs are supervised by the postsecondary governing boards, and no such programs appear to be under the State Board of Education. To the extent that any of the less-than-baccalaureate programs are offered by institutions designated as area vocational schools, these institutions are under the supervision of the state board and responsibility is divided between the postsecondary governing boards and the state board.
District of Columbia
The D.C. State Board of Education serves as the District's Board of Vocational Education, with the D.C. Advisory Council on Adult Education and Literacy acting in an advisory capacity. The Participatory Planning committee of the body develops the Annual Performance Report for Adult Education and Literacy.
Florida As part of the reorganization process, an Office of Workforce Development, within the office of the Commissioner of Education, reports to the Florida Board of Education.
76

Georgia The State Board of Technical and Adult Education is responsible for establishing standards, regulations and policies for the operation of the Georgia Department of Technical and Adult Education, the state's 34 technical colleges, and 17 satellite campuses. The Board also oversees the state's adult literacy education programs.
Hawaii The Board of Regents of the University of Hawaii also serves as the State Board for Career and Technical Education with basic responsibility for planning, coordinating and evaluating public vocational education programs at the secondary and postsecondary levels and for requesting and allocating federal funds within the state.
Idaho The State Board of Education is the State Board for Professional-Technical Education.
Illinois The Illinois Community College Board has responsibility for adult and vocational education.
Indiana The Commission on Vocational and Technical Education is the State Board for Vocational Education. The commission consists of 11 citizens who are appointed to four-year terms by the governor. Each of 10 congressional districts is represented by a member; the remaining member represents the state at-large.
Iowa The State Board of Education functions as the State Board of Vocational Education and exercises statutory authority over 15 community colleges.
Kansas The State Board of Education serves as the State Board of Vocational Education.
Kentucky The Department of Technical Education in the Cabinet for Workforce Development operates 52 area vocational education centers, which primarily offer secondary vocational programs, but also offer postsecondary programs. 12 postsecondary education programs at state correctional facilities are operated by the department under contract with the Department of Corrections. The 1997 postsecondary education reform moves the 15 public postsecondary education vocational-technical schools from the Workforce Development Cabinet to the Board of Regents for the Kentucky Community and Technical College System.
Louisiana The State Board of Elementary and Secondary Education serves as the State Board of Vocational Education.
Maine The Board of Trustees of the Technical College System of Maine is the governing body responsible for the governance of public postsecondary vocational-technical education.
Maryland The Maryland State Department of Education oversees vocational education.
The Massachusetts Board of Education is the State Board of Vocational Education.
Michigan The State Board of Education serves as the State Board of Vocational Education. With recommendations from the Community College Board, the Board approves occupational programs for the 29 public community and junior colleges.
Minnesota The Board of Trustees of the Minnesota State Colleges and Universities (MnSCU) oversees the state's vocational-technical education programs.
Mississippi The State Board of Education functions as the State Board of Vocational-Technical Education.
Missouri The State Board of Education is the State Board of Vocational Education in Missouri. The Coordinating Board for Higher Education has developed and implemented the State Plan for Postsecondary Technical Education. The plan designates the state's community colleges as the lead institutions for postsecondary technical education. It also calls for articulated courses and programs from the state's area vocational technical schools, community colleges, and baccalaureate, master's and public doctoral degree-granting engineering universities.
77

Montana The Board of Regents of Higher Education is responsible for the governance of public postsecondary vocational-technical education.
Nebraska The State Board of Education functions as the State Board of Vocational Education.
Nevada The State Board of Education serves as the State Board of Vocational Education.
New Hampshire
The Board of Trustees of the Community Technical College System is responsible for the governance of public postsecondary vocational-technical education.
New Jersey The State Board of Education is the State Board of Vocational Education.
New Mexico The State Board of Education is the State Board of Vocational Education.
New York The Regents are the State Board of Vocational Education, since the federal government empowers them to administer funds and programs under the Carl D. Perkins Vocational Education Act.
North Carolina
The State Board of Education functions as the State Board of Vocational Education, but shares authority for this area with the State Board of Community Colleges.
North Dakota The State Board of Public School Education serves as the State Board of Vocational Education.
Ohio The State Board of Education is the State Board of Vocational Education.
Oklahoma The State Board of Career and Technology Education supervises the vocational and technical schools of Oklahoma. Its members consist of the state superintendent of public instruction, 6 appointed members of the State Board of Education plus 6 members appointed by the governor.
Oregon The State Board of Education functions as the State Board of Vocational Education and as the State Board for Community Colleges.
Pennsylvania The State Board of Education serves as the State Board for Vocational Education.
Puerto Rico The Human Resources and Occupational Development Council of Puerto Rico is recognized as the state agency for the approval of public postsecondary vocational education.
Rhode Island The Department of Elementary and Secondary Education serves as the State Board of Vocational Education. However, the Board of Governors for Higher Education has approval authority over all postsecondary for-profit/proprietary schools.
South Carolina
The State Board of Education is designated the State Board of Vocational Education and governs secondary vocational programs in 43 vocational education centers and a number of comprehensive high schools. Postsecondary vocational and technical programs are conducted by 16 public technical colleges governed by the State Board for Technical and Comprehensive Education and by a number of junior and senior public and private colleges.
South Dakota
The State Board of Education is a citizen board attached to the Department of Education and Cultural Affairs. It governs both secondary and postsecondary vocational education, as well as pre-K-12 education.
Tennessee The State Board of Education is the State Board for Vocational Education.
Texas The State Board of Education functions as the State Board for Career and Technology Education. The coordinating board is responsible for administration and funding of programs relating to vocational-technical education in Texas' public community colleges, the Texas State Technical College System and other public postsecondary institutions.
78
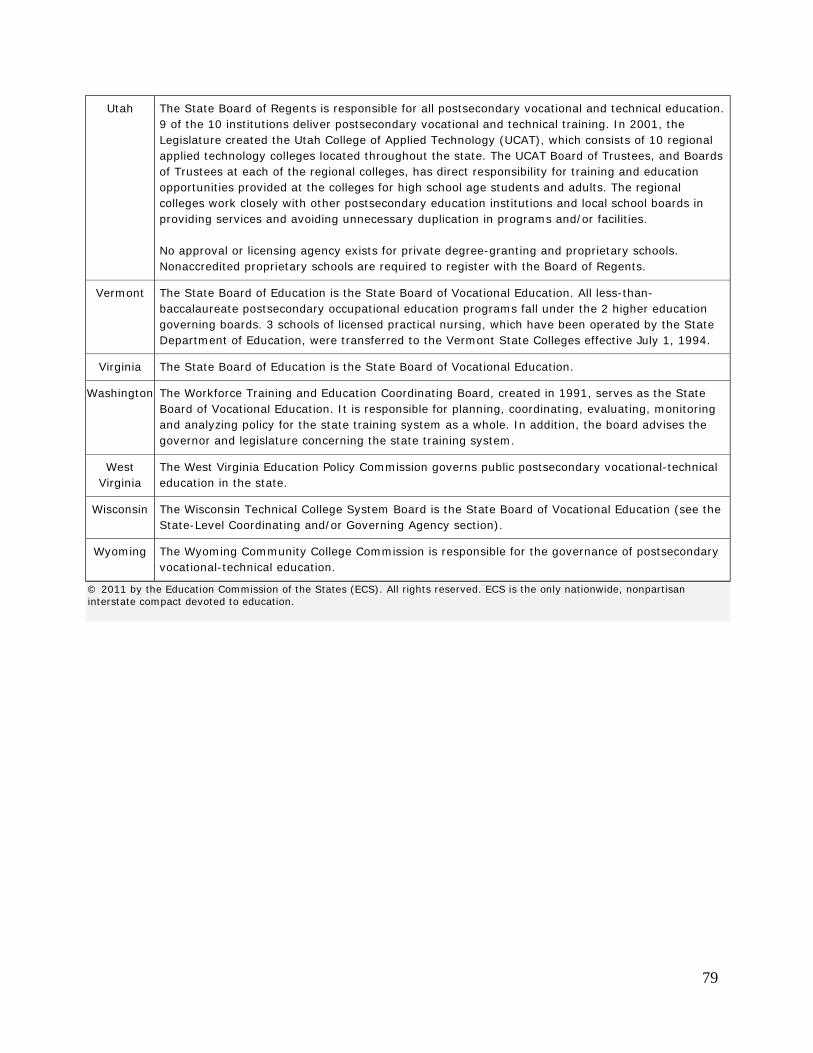
Utah The State Board of Regents is responsible for all postsecondary vocational and technical education. 9 of the 10 institutions deliver postsecondary vocational and technical training. In 2001, the Legislature created the Utah College of Applied Technology (UCAT), which consists of 10 regional applied technology colleges located throughout the state. The UCAT Board of Trustees, and Boards of Trustees at each of the regional colleges, has direct responsibility for training and education opportunities provided at the colleges for high school age students and adults. The regional colleges work closely with other postsecondary education institutions and local school boards in providing services and avoiding unnecessary duplication in programs and/or facilities. No approval or licensing agency exists for private degree-granting and proprietary schools. Nonaccredited proprietary schools are required to register with the Board of Regents.
Vermont The State Board of Education is the State Board of Vocational Education. All less-than-baccalaureate postsecondary occupational education programs fall under the 2 higher education governing boards. 3 schools of licensed practical nursing, which have been operated by the State Department of Education, were transferred to the Vermont State Colleges effective July 1, 1994.
Virginia The State Board of Education is the State Board of Vocational Education.
Washington The Workforce Training and Education Coordinating Board, created in 1991, serves as the State Board of Vocational Education. It is responsible for planning, coordinating, evaluating, monitoring and analyzing policy for the state training system as a whole. In addition, the board advises the governor and legislature concerning the state training system.
West Virginia
The West Virginia Education Policy Commission governs public postsecondary vocational-technical education in the state.
Wisconsin The Wisconsin Technical College System Board is the State Board of Vocational Education (see the State-Level Coordinating and/or Governing Agency section).
Wyoming The Wyoming Community College Commission is responsible for the governance of postsecondary vocational-technical education.
© 2011 by the Education Commission of the States (ECS). All rights reserved. ECS is the only nationwide, nonpartisan interstate compact devoted to education.
79

Annex B: How Perkins Act Funds Are Allocated
Title I of the Perkins Act (PL 109-270) provides “career and technical education assistance to the states”, with funds distributed through formula-based “basic state grants.” Title II of the Act (now unfunded) provided funds for Tech Prep education.31 In FY2011, about $1.1 billion went out under Title I, with state grants ranging from $118 million for California, to (the statutory minimum of) $4.2 million for Alaska, North Dakota, Vermont, Wyoming, and Washington, DC.32
Allocation of Perkins Funds to the States (Section 111 of the Act)
From the total Perkins appropriations, small percentages are taken out for these programs:
• 1. 50% for Native American (1.25%) and Native Hawaiian (0.25%) programs; • 0.13% for the outlying areas.
In addition, Congress allocates “such funds as necessary” for a set of national activities (primarily the national research center on CTE, the national assessment of CTE, and the provision of occupational employment information).
State Allotments. From the remaining funds, allocations to states are made using a population-based formula, as follows:
• 50% based on the population ages 15 to19 • 20% based on the population ages 20 to 24 • 15% based on the population ages 25 to 65 • 15% based on the population ages 15 to 65.
This allotment is adjusted by an “allotment ratio” based on the state’s per capita income; the ratio allots slightly more funding to poorer states and slightly more to richer states. By law, the adjustment ratio ranges from 0.4 to 0.6.
To keep small-population states from receiving miniscule amounts, there is a set “small state minimum”: The law stipulates that no state shall receive less than one-half of 1 percent of the amount appropriated for basic state grants. However, because of how the funding formula is constructed, small states actually get less than this. (Currently, they get about 0.4% of the total basic grant amount.) There is also a hold-harmless provision to ensure that states do not receive
31 Tech Prep was a “2+2” model for linking secondary and postsecondary education. Tech Prep funds had been awarded to consortia of one or more local school districts or high schools in partnership with one or more postsecondary institutions that have 2-year programs. 32 State allocations are listed at: http://cte.ed.gov/file/state_allocations/2011_Rev_Estimated_Federal_State_Allocations_100511.pdf.
80

less funding in any one year than they did in 1998. Finally, no state can receive more than 150 of what it received the previous year.
State Plan. Each state must submit to OVAE a 5-year state plan that describes procedures for public input into the plan; how funds will be allocated and use within the state; and how the state will monitor compliance and ensure accountability.
Within State Allotments (Section 112 of the Act)
State offices can keep up to 15% of the state’s allotment for state leadership (up to 10%) and administrative (up to 5%) functions, with the remaining 85% or more going to local programs. States determine how they will split the funds between secondary and postsecondary education, although their allocation split must be justified in their state plan. Table 1 below shows how states split funds between the secondary and postsecondary levels in 2009. In that year, secondary/ postsecondary splits ranged from 85/15 to 40/60.
Within State Postsecondary Allocations. Funds are allocated to postsecondary institutions33 (or consortia of postsecondary institutions) based on the number of Pell grant recipients and BIA-assistance recipients enrolled in CTE programs. States may apply for a waiver of this formula if they believe an alternative formula will better distribute funds to economically disadvantaged individuals. A minimum grant award is set at $50,000. Eligible postsecondary institutions that do not meet this minimum are encouraged to join into a consortium with other eligible recipients so that they can meet the minimum.
Each recipient of funds must submit a local plan. There are about 30 allowable uses for local funds (section 135 of the Act); local administrative costs are one allowable use, but with a 5% cap. The two most common uses are “salaries and fringe” and “equipment and supplies”. Programmatic uses vary widely by state, but professional development and “serving special populations”34 are common programmatic uses. (The law used to include set-asides for special populations.)
33 The Perkins Act defines a postsecondary institution as an educational institution that offers “not less than a 2-year program of instruction that is acceptable for credit toward a bachelor’s degree”, a tribally controlled college or university, or a nonprofit institution offering postsecondary certificate or apprenticeship programs. This definition should exclude most or all proprietary schools. 34 As defined in Perkins, special populations include: individuals with disabilities; individuals from economically disadvantaged families; individuals preparing for nontraditional fields; single parents; displaced homemakers; and individuals with limited English proficiency.
81

Annex C. Clusters used by the U.S. Department of Commerce, Economic Development Administration
Traded Clusters: Aerospace engines Aerospace vehicles and defense Agricultural products Analytical instruments Apparel Automotive Biopharmaceuticals Building fixtures, equipment, and services Business services Chemical products Communication equipment Construction materials Distribution services Education and knowledge creation Entertainment Financial services Fishing and fishing products Footware Forest products Furniture Heavy construction services Heavy machinery Hospitality and tourism Information and technology Jewelry and precious metals Leather and related products Lighting and electrical equipment Medical devices Metal manufacturing Motor driven products Oil and gas products and services Plastics Power generation and transmission Prefabricated enclosures Processed food
Production technology Publishing and printing Sporting, recreational, and children’s goods Textiles Tobacco Transportation and logistics Local clusters: Local commercial services Local community and civic organizations Local education and training Local entertainment and media Local financial services Local food and beverage processing and xxxdistribution Local health services Local hospitality establishments Local household goods and services Local industrial products and services Local logistical services Local motor vehicle products and services Local personal services (non-medical) Local real estate, construction, and xxxdevelopment Local retail clothing and accessories Local utilities National endowment dependent clusters: Agricultural products Casino hotels Coal mining Combination energy services Fertilizers Forestry and primary wood processing Lifestock processing Metal mining Nonmetal mining Water transport
82

U.S. Department of Commerce “strong” clusters for the three case study states:
Florida • Business services • Hospitality and tourism • Transportation and logistics • Distribution services • Agricultural products • Tobacco
Maryland
• Business services • Education and knowledge creation • Analytical instruments
Washington
• Information technology • Aerospace vehicles and defense • Distribution services • Entertainment • Agricultural products • Fishing and fishing products
83