Embed Size (px)
Citation preview

U.S. Climate Alliance
Alliance States commit to:
1. Reduce GHGs by at least 26-28 percent below 2005 levels by 2025;
2. Track and report progress; and
3. Accelerate implementation of existing and new policies.
Bipartisan coalition of 25 governors cooperating to tackle climate challenge.

U.S. Climate Alliance
Alliance States commit to:
1. Reduce GHGs by at least 26-28 percent below 2005 levels by 2025;
2. Track and report progress; and
3. Accelerate implementation of existing and new policies.
Bipartisan coalition of 25 governors cooperating to tackle climate challenge.

• Speak with a Unified Voice
• Multi-State Strategies
• Inspire Action at Home and Abroad
• Support Implementation of State Climate Change Policy Priorities
To drive down the emission of
these harmful pollutants,
Canada and Mexico accept the
SLCP Challenge issued by the
U.S. Climate Alliance, and we
each agree to develop and
implement ambitious SLCP
strategies.

Secretariat Profiles
Keri Enright-KatoSenior Policy Advisor
Erin BeddingfieldSenior Associate
Jenn PhillipsSenior Policy Advisor
Transportation
Buildings
Efficiency Natural & Working
Lands
ResilienceState Climate Governance
Andrew SandSenior Policy Advisor
Power

Secretariat Profiles
Kristin IguskySenior Associate
Emissions & Analysis
Economy-wide Policies
Kareem HammoudPolicy Analyst
Taryn FinnesseySenior Policy Advisor
Methane Climate Finance
Just Transition
HFCs
Industry Industry

GHG Inventory &
Deep Decarbonization Pathways

Importance of GHG Emissions Inventories & Analysis
✓You can’t mitigate what you don’t measure
✓Tracking historical emissions allows you to:• Identify largest emission sources• Show progress (or not) over time
• Track different indicators
✓Modeling allows you to:• Establish robust emissions goals• Identify whether you are on track to meet goals with current policies
• Identify robust technology pathways to achieve long-term deep decarbonization to inform near-term policy development
• Identify policies and actions that help reduce emissions in the near-to-mid term

GHG Inventory MethodsCorporate GHG Accounting Boundaries:
Source: GHG Protocol
National & State GHG Accounting Boundaries (Sector-Based):
Source: U.S. Environmental Protection Agency

GHG Inventory Methods
Source: Oregon DEQ
State GHG Accounting Boundaries (Consumption-based):

GHG Inventory Methods
✓ Majority of Alliance states use EPA State Inventory & Projection Tool (SIT) for at least one sector
✓ EPA SIT = interactive spreadsheet model
✓ 7 Alliance states report emissions via 3rd party; most post report on govt website

EXAMPLE: U.S. MIDCENTURY STRATEGY
Achieving Deep Decarbonization

State DDP and Economic AnalysisEXAMPLE: MILESTONES IN DECARBONIZING A STATE'S ECONOMY
States that have completed or are in the process of scoping/completing a DDP analysis • CA, CO, CT, DE, HI, ME, MD, MA, MT, NC, NM, NJ, NY, PA, WA

State DDP and Economic AnalysisEXAMPLE: COLORADO

State DDP and Economic AnalysisEXAMPLE: MASSACHUSETTS

Questions or Clarifications?

Addressing Climate Change at the State-levelPolicies, Regulations, & Programs
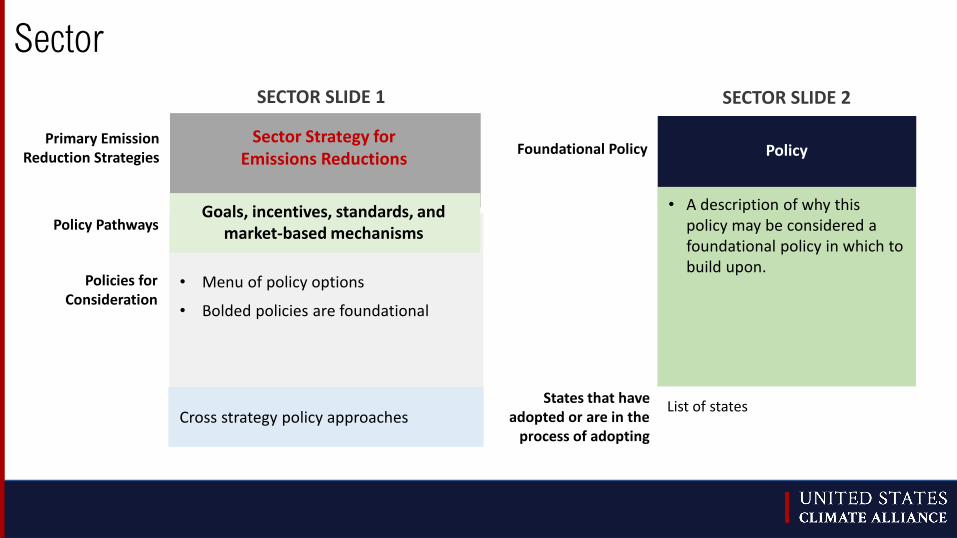
Sector
Sector Strategy forEmissions Reductions
Primary EmissionReduction Strategies
Policy Pathways
Policies for Consideration
Goals, incentives, standards, and market-based mechanisms
• Menu of policy options
• Bolded policies are foundational
PolicyFoundational Policy
States that have adopted or are in the
process of adopting
• A description of why this policy may be considered a foundational policy in which to build upon.
List of statesCross strategy policy approaches
SECTOR SLIDE 1 SECTOR SLIDE 2

Economy-wide
Market-based mechanisms Social Cost of CarbonPrimary Emission
Reduction Strategies
Policies for Consideration
Economy-wide or sector-specific:
• Carbon tax
• Cap & trade/invest
● Cost-effectiveness measure when evaluating various policies in climate action policies.
● Power-sector specific:
● Resource compensation
● Resource planning
● Cost-benefit analysis
● Social cost of other GHGs starting to be considered

Cap and trade/invest Integrate SCC into policy and regulatory decision-making
Foundational Policy
States that have adopted or are in
the process of adopting
• Sets a fixed cap on emissions from one or more sectors that declines over time.
• State regulators can auction allowances, generating proceeds that can be re-invested into programs that promote energy efficiency, clean energy deployment, clean transportation, resilience, community development, or other state programs.
• These programs have proven that emissions reductions can be achieved while growing state economies and achieving other co-benefits.
• Allows agencies and regulators to estimate global damages from avoiding one metric ton of GHGs
• Can be weighed with other policy-specific benefits and costs
• Contributes to the full and transparent assessment of all associated environmental, economic, and social impacts
Economy-wide
• Economy-wide: CA• Power sector: RGGI (CT, DE, ME, MD, MA, NJ, NY, RI, VT,
VA / PA in process) • Transport: TCI (CT, MA, RI / DE, MD, NJ, PA,VT, VA)
• Electricity-sector regulatory procedures or planning: CA, CO, CT, IL, ME, MD, MN, NV, NJ, NY, OR, VA, WA
• Climate action plan evaluation: CA, PA

Power Sector
Setting Generation and Efficiency Standards/Targets
Comprehensive Utility Resource and Transmission Planning
RatemakingPrimary Emission
Reduction Strategies
Policy Pathways
Policies for Consideration
• Electricity sector goals (non-enforceable)
• Clean Energy Standard (CES) / Renewable Portfolio Standard (RPS)
• Energy Efficiency Resource Standard (EERS)
• Energy efficiency and clean energy procurement
Standards, market-based mechanisms, utility planning processes, rate design, and regional markets
• Integrated Resource Planning (IRP)
• Distribution System Planning
• Beneficial Electrification Planning
• Wholesale power markets
• Enhancing siting and planning processes
• Net metering
• Time varying rates
• Decoupling revenue from sales
• Performance Based Regulation

Power Sector
Electricity Standards Energy Efficiency Resource Standards (EERS)
Foundational Policy
States that have adopted or are in the process
of adopting
• By Executive Order, legislation or regulatory action.
• Provides an important market signal and benchmark against which utility resource planning can measure against.
• Renewable Portfolio Standards / Clean Energy Standards
• Set interim and long-term targets to benchmark progress.
RPS: 29 states100% targets or goals: CA, CO, HI, ME, MT, NV, NJ, NM, NY, NC, PR, RI, VA, WA, WI, NC
• Requirement to achieve a certain percentage of energy savings based on the amount of electricity and/or natural gas sold each year.
• Promoting our least cost resource through long-term efficiency goals to decrease consumption
• Provide a signal to the market and take advantage of low-cost renewable and storage procurement.
• Examples from 2020:
• ME- initiated the largest clean energy procurement in state history
• NV- providers have developed nearly 2.5 GW of new solar and 700 MW of battery storage
• NM - approved 650 MW of solar resources and 300 MW of battery storage
27 states have an electric EERS18 have a gas EERS
Renewable & Energy Storage Procurements

Transportation
Low- & Zero-carbon Fuels & Technologies
Infrastructure DeploymentSustainable Land-use Planning
& Vehicle Miles Traveled Reductions
Primary Emission Reduction Strategies
Policy Pathways
Policies for Consideration
• Electric Vehicle Supply Equipment (EVSE) providers exempted as a utility
• Infrastructure incentives (tax credit, grants, VW settlement funds)
• EV ready building codes
• Right to charge law
• EVSE infrastructure targets
• EV ready utility program
• Transit oriented development
• Performance-based decision making that measures mobility, access to jobs and services, environmental impact, and equity
• Complete Street policies
• VMT reduction target
• Road-usage fees/congestion pricing
Goals, incentives, standards, and market-based mechanisms
• Clean/low-carbon fuel standard• Cap-and-invest
• Transportation Decarbonization Plan• ZEV Planning/Roadmap
• Low- and zero-emission vehicle standards
• Medium- and heavy-duty vehicle standards
• ZEV purchase incentives• Statewide ZEV target
• LBE zero-carbon/electric fleet targets/procurement policy
• Variable EV rates & demand charge solutions

Transportation
Low- and zero-emission vehicle standards
Exempt EVSE providers from regulation as public service
companies
Policies that incent transit-oriented development
Foundational Policy
States that have adopted or are in
the process of adopting
• Incent (grant, tax exemption) jobs, services, and residential housing near transportation hubs.
• Reduces dependence on driving and increases walking
• Provides access to critical services
• Increases economic development
• Revitalizes communities
• Vehicle emission standards have been a primary driver for improved vehicle efficiency and emissions reductions.
• Higher proportion of new ZEV sales in ZEV state vs. non-ZEV states.
• Increased ZEV model availability in ZEV states
CA, CO, CT, DE*, MA, ME, MD, MN, NJ, NM, NV, NY, OR, RI, PA*, VT, WA,
AL, AK, CA, CO, CT, DC, FL, HI, ID, IL, KY, ME, MD, MA, MI, MN, NV, NH, NM, NY, OK, OR, PA, UT, VA, WA, WV
• Provides certainty for EVSE owners and operators that they are not subject to retail electricity regulations.
• Allows third-parties to include a per-KWh fee in pricing to driver.
• Enables private investment of EVSE
Varies by state

Buildings
Energy Efficiency Building Electrification Decarbonizing FuelsPrimary Emission
Reduction Strategies
Policy Pathways
Policies for Consideration
• Energy codes for new construction and renovations (high efficiency, EV-ready)
• Efficiency requirements for affordable housing
• Appliance efficiency standards
• Financial instruments (PACE, ESPCs)
• Utility DSM programs (discussed in Power Sector)
Goals, planning, incentives, codes and standards, and market-based mechanisms
• Lead by example with government assets (build/buy/lease/operate)• Enabling local action where necessary
• Health and safety building codes (combustion safety, air quality)
• Incentive programs for appliance electrification
• Gas infrastructure planning
• Research and development
• Planning for managed transition of fossil fuels
• Planning for end uses that can not be fully electrified

Buildings
Codes Appliance Standards IncentivesFoundational
Policy
States that have adopted or are in
the process of adopting
• US DOE estimates that building energy codes govern up to 80% of a building’s energy load
• Reduce use and peak demand
• Model energy codes available for state to adopt, and can be amended to include additional considerations for EVs and load flexibility
Process varies by state – most have some version of an energy code; CA, MA, NY, WA are leading states
• States adopt standards for products not preempted by federal standards
• Decrease energy use, save consumers and businesses money, and reduce GHGs
• Model bill for product categories to standardize across states
• Developing multi-state implementation resources
• Utility/DSM programs
• Coordinate with Biden administration on design of incentive programs for efficiency and thermal electrification (WAP, LIHEAP)
• Technology adoption, market transformation
AZ, CA, CO, CT, DC, GA, HI, MD, NV, NH, NY, OR, RI, TX, VT, WA
Varies by state – USCA is coordinating on areas for state/federal engagement

Questions or Clarifications?

Agriculture, Forestry, Conservation
Maintaining Natural and Working Lands
Restoration and Reforestation
Farming, Conservation Practices for GHG Reductions
and Carbon Sequestration
Primary Emission Reduction Strategies
Policy Pathways
Policies for Consideration
• Avoided conversion, land use/protection goal
• Best management practices across land types and landscapes
• Incentives for lands as lands
• Conservation easements
• Wood product utilization
Goals, incentives, standards, and market-based mechanisms
• Urban greening/forestry
• Wetland, seagrass restoration
• Forest restoration and afforestation, including woodland and riparian
• Programs designed for resilient carbon sequestration with tools & tech to measure
• Soil Carbon, Healthy Soils, Carbon Farming Programs
• Payments for soil carbon storage and farm level carbon accounting
• Strategies to reduce methane from ag and waste (improved manure management, etc.)
• NWL GHG Inventory to integrate NWL into economy-wide goals, policies• NWL pathways analysis to scale NCS opportunities & focus on additional benefits• NWL Working Group and Plan

Agriculture, Forestry, Conservation
Avoided ConversionRestoration
programs for resilientcarbon sequestration
Soil Carbon, Healthy Soils, Carbon Farming
Programs
Foundational Policy
States that have adopted or are
in the process of adopting
• Benefits for other sectors
• Land-use intensification is dominant source of NWL emissions, with forest, grassland, and wetland conversion to settlements and cropland, making up more than 90 percent of LULUCF emissions
Varies by state
• Articulate and elevate co-benefits such as community resilience, habitat connectivity, flood risk reduction, and high-quality ag land
• Need tools & tech to measure, and prioritize restoration activities in service of conservation and climate objectives
• 10% of U.S. GHG Emissions
• Soil health principles sequester carbon, increase water infiltration, improve habitat while harvesting better profits and yields
• Adoption of tech and innovations to reduce GHG emissions from agricultural operations
Varies by state, most have program(s) that recognize other co-benefits. CA, NC, OR, MN leading states
Varies by state, many have healthy soils programs – CA, IL, MD, MA, NM, VT, WA, etc.

Manufacturing and Industry
Eliminating High-GWP Emissions
Clean Manufacturing Standards and Codes
Process EfficiencyPrimary Emission
Reduction Strategies
Policy Pathways
Policies for Consideration
Incentives, standards, regulations, and market-based mechanisms
• RD&D for product and process redesign• Carbon pricing (cap-and-trade or carbon tax)
• Low-carbon procurement policies and/or building codes
• Clean product/manufacturing standards
• Low-carbon fuel standards
• Labeling initiatives
• HFC phase-out regulations
• Account for HFCs in building codes
• Improve high GWP refrigerant management practices, end of life and reclaim programs
• Emissions regulations• Trade protections
• Strategic energy management programs
• Industrial equipment performance/efficiency standards
• Material efficiency policies

Manufacturing and Industry
HFC phase down Low-carbon procurement
policies (Buy Clean)Foundational
Policy
States that have adopted or are in the process
of adopting
• HFCs are a part of a group of potent, high GWP, GHGs known as short lived climate short‐pollutants (SLCP)
• Offers energy efficiency and net cost savings benefits
• Bipartisan industry support
*** The AIM act passed in late 2020 phases down the consumption and production of HFCs, nationally. States will continue to support and enhance these efforts
CA, WA, VT, NJ, VA, MD, DE, NY, MA, RI, CO, PA, NM, ME, HI, OR
• Some alternatives to high GWP refrigerants are not currently permissible under state building codes
• These alternatives are safe and have undergone rigorous testing
• Allowing for alternatives can result in the equivalent of 1.6 billion tons of CO2
• Heavy manufacturing of basic materials accounts for most of industrial emissions
• Governments have purchasing power: ~50% of cement and 20% of steel is govt procured
• Green procurement creates a guaranteed market and incentivizes lower-carbon industry
WA, FL, OH CA, OR, WA, CO, MN, NY, NJ
Account for HFCs in building codes

Mining and Oil and Gas Production
Leak Detection and Repair (LDAR)
Data CollectionPrimary Emission
Reduction Strategies
Policy Pathways
Policies for Consideration
Incentives, standards, regulations, and market-based mechanisms
• Air quality and public health • Carbon pricing (cap-and-invest or carbon tax)
• Best Available Control Technology
• Monitoring & Inspection
• Prohibit venting & flaring
• Include new & existing
• Extend regulations to include midstream and downstream
• Emission intensity standards
• VOC regs
• Planning for managed transition of fossil fuels
• Demand management
• Incentives
• Emissions regulations
• Reporting, record keeping and verification
• Improved emissions inventory
• Identification and plugging orphaned wells
• Emerging technology
Demand Management & Transition

Mining and Oil and Gas Production
LDAR Incentives Foundational
Policy
States that have adopted or are in
the process of adopting
CA,CO,MD,MA,NM,NY,PA
• Improved data and inventories allow for more targeted and tailored approaches
• Monitoring, reporting and verification fundamental in methane abatement efforts
• Wells can predate tracking systems
• Technology is rapidly evolving and providing new opportunities for data collection and use
• Incentives help make the economic case for industry
• Incentives and regulation can accelerate the transition and decrease overall demand
Varies by state and sector
• Leaking methane is a significant source of potent GHGs
• There is an economic benefit to capturing leaking gas
• Decreased ground-level ozone pollution
Improved data
CA,CO,MD,MA,NM,NY,PA

Equity & Just Transition
Foundational Policy
States that have adopted or are in
the process of adopting
Varies by state, nearly all in some capacity
• Transition can increase opportunities and investment for those previously excluded from educational pursuits and family-sustaining jobs .
• Explore ways to avoid, minimize or compensate for economic and environmental losses incurred by communities
• A just transition requires meeting the needs of the present while planning for future, including long term economic development.
• This transition should support communities in their vision for a sustainable and resilient future and provide resources to ensure those needs can be met.
Varies by state and sector
• Historically, many groups have been excluded from economic transition planning processes. These include but are not limited to: fenceline, low-income, Black, Indigenous, peoples of color (BIPOC), individuals with limited English proficiency (LEP), and workers. Gaining trust with each of these groups and understanding and respecting their distinct perspectives is critical to a fair and equitable transition
CA, CO, ME, NJ, NM, NY, VA, WA
Facilitate meaningful community-based
engagement
Examine an equitable distribution of
costs and benefits
Achieve community longevity & resilience

Climate FinanceFacilitate Meaningful
Community-based Engagement
Green Financing
Financial Incentives Financing Mechanisms
• Tax credits/ deductions/ exemptions
• Rebate programs• Grant programs• Loan programs
• Green / infrastructure banks• Bond issuance• Revolving loan funds• Credit enhancement• PACE• ESPC• On-bill financing• Leasing arrangements
Institutional Reform
• Climate-related risk analysis and disclosure requirements
• Climate stress-testing• Emissions targets / requirements on state-
managed portfolios• Sustainability criteria for state investments• Climate criteria on projects funded by public
dollars
Operating: CA, CO, CT, DE, FL, HI, LA, MD, MI, OH, NV, NY, PA, RIDeveloping: ME, MN, NC, NJ, PR
States operating or developing green banks: States integrating climate w/ institutional finance:
Pensions: CA, NYInsurance: CA, WA, NY, NM, CT, MNBanks and Lenders: NYStatewide: CA, NY

Questions or Clarifications?

APPENDIX

USCA State Climate Planning
▪ State climate plans generally include GHG emissions reduction targets and a comprehensive list of economy-wide policy recommendations the state should adopt to help meet their goals.
▪ Plans may also include additional components such as: ✓ resilience strategies
✓ clean electricity, building and vehicle electrification targets
✓ economic costs and benefits
✓ policy co-benefits
✓ Equity lens
▪ 15 Climate/Decarbonization Plans (2016 or later)
✓ CA, CO, CT, HI, MA, NJ, NM, NV, ME, MD, MT, OR, PA, RI, WI
▪ 5 New plans on the horizon: ✓ DE, MD, MI, NY, VT

Climate Change Planning Best Practices
✓ Recommendations are specific, provide clear and concise direction with measurable outcomes.
✓ Include implementation timing (near-, -medium, long-term).
✓ Identify the responsible party for implementation.
✓ Commitment to a regular progress report (annual, biannual, every 3 years).
✓ Commitment to re-evaluate recommendations and adjust as new information and science emerges.
✓ Assessment of economic costs and benefits (REMI, IMPLAN)
✓ Integrate climate change planning into existing planning and policy requirements/plans(Energy, Conservation and Development, Integrated Resource, Statewide Transportation, Economic Development plans)


Low- and Zero-emission Vehicle Standards
State
Initial applicable vehicle
regulation model year State EV
sales shareCriteria
pollutant
Greenhouse
gas
Zero
emission
California 1992 2009 1990 7.9%
New York 1993 2009 1993 1.5%
Massachusetts 1995 2009 1995 2.2%
Vermont 2000 2009 2000 2.4%
Maine 2001 2009 2001 1.5%
Pennsylvania 2001 2009 1.0%
Connecticut 2008 2009 2008 2.0%
Rhode Island 2008 2009 2008 1.3%
Washington 2009 2009 2020 4.4%
Oregon 2009 2009 2009 4.2%
New Jersey 2009 2009 2009 1.6%
Maryland 2011 2011 2011 2.2%
Delaware 2014 2014 1.7%
Colorado 2022 2022 2023 3.2%
Washington, DC 2012 2012 5.0%
Minnesota * * * 1.3%
Nevada * * * 2.1%
New Mexico * * * 1.0%
* indicates adoption in process (year unknown) based on legislation, announcements, policy consideration
17States have adopted or in the process of adopting Low-Emission Vehicle Standards
15States have adopted or in the process of adopting Zero-Emission Vehicle Standards

Market-based Mechanisms
Cap and InvestCalifornia RGGI TCI
States and Sectors
covered
Electricity, transportation, heat,
industry
CT, DE, ME, MD, MA, NH, NJ,
NY, PA*, RI, VA, VT
CT, MA, RI, D.C.
(DE, ME, MD, NC,NJ, NY, PA, RI, VA,
VT)
Electricity Transportation
Emissions covered CO2, CH4, N2O, SF6, HFCs, PFCs,
NF3
CO2 CO2
Emissions Cap Declined 3% annually from 2015-
2020, new cap requires an
additional 5% reduction from 2021-
2030
Declined 2.5% per year 2008-
2020, new cap 30% below 2020
by 2030
26% from 2022-2032
Proceeds received $12.5 billion since the start of the
program
$3.7 billion since the start of the
program
Projected proceeds are equal to $3
billion
Emissions avoided due to
investment of proceeds
Cumulative investment through 2019
reduced GHG emissions by 44.7
MTCO2e
Cumulative investments through
2018 avoided the release of 4.6
million short tons of CO2
TBD
Allowance Price $ per MTCO2e $ per short ton TBD

Market-based Mechanisms
Clean/low-carbon fuel standardCalifornia Low-Carbon Fuels Standard (2011)
Oregon Clean Fuels Standard (2016)
Carbon intensity target
10% reduction from 2010 levels by
2020, new standard requires 20%
reduction by 2030
10% reduction from 2015 levels by
2025
LCFS range of average
price per credit
$196-201
(average for 2020)
$115-125
(average for 2020)
Market credit
transactions
The total value of credit transactions
exceeded $2 billion in 2018
The total value of credit
transactions exceeded $205 million
in 2020
*Washington State & New Mexico have legislation pending in their 2021 legislative session.
*British Columbia adopted a LCFS in 2008

ZEV Incentives
StateApproximate
average incentiveIncentive type BEVs PHEVs
Vehicle
price
maximum
Maximum
income
eligibility
California $2,500 Rebate (after sale)
Colorado $5,000 Income tax credit
Connecticut $1,500 Rebate (at sale)
Delaware $3,500 Rebate (at sale or after)
Louisiana $2,500 Income tax credit
Maryland $3,000 Excise tax credit
Massachusetts $1,500 Rebate (after sale)
New Jersey$2,500 + ZEV sales
tax exemption
Rebate (at sale)
Sale tax exemption for ZEVs
New York $2,000 Rebate (at sale)
Oregon $2,500 Rebate (after sale
Pennsylvania $1,500 Rebate (after sale)
Vermont $2,000 Rebate (at sale or after sale)
Washington $1,700 Sales tax exemption
9Rebate
Incentive
4Tax
Incentive
10Equity &
Access
13State w/ ZEV
Incentives