Embed Size (px)
Citation preview

U.S. Department of Energy (DOE) National Energy Technology Laboratory (NETL)
Coal-Based Power Plants of the Future: Electricity and Ammonia Polygeneration Concept CONTRACT: 89243319CFE000016
April 13, 2020 Page i

U.S. Department of Energy (DOE) National Energy Technology Laboratory (NETL)
Coal-Based Power Plants of the Future: Electricity and Ammonia Polygeneration Concept CONTRACT: 89243319CFE000016
April 13, 2020 Page ii
1. Concept Background ............................................................................................................... 1
2. Cost Estimating Methodology ................................................................................................. 2
2.1 Capital Costs ...................................................................................................................... 3
2.1.1 Cost Estimate Basis and Classification ...................................................................... 4
2.1.2 System Code-of-Accounts ......................................................................................... 5
2.1.3 Estimate Scope ........................................................................................................... 5
2.1.4 Capital Cost Assumptions .......................................................................................... 5
2.1.5 Price Fluctuations....................................................................................................... 6
2.1.6 Process Contingency .................................................................................................. 6
2.1.7 Owner’s Costs ........................................................................................................... 6
2.2 Operation and Maintenance Costs ..................................................................................... 6
2.2.1 Operating Labor ......................................................................................................... 7
2.2.2 Maintenance Material and Labor ............................................................................... 7
2.2.3 Administrative and Support Labor............................................................................. 7
2.2.4 Consumables .............................................................................................................. 7
2.2.5 Waste Disposal........................................................................................................... 7
2.2.6 Co-Products and By-Products .................................................................................... 7
3. Cost Estimates ......................................................................................................................... 7

U.S. Department of Energy (DOE) National Energy Technology Laboratory (NETL)
Coal-Based Power Plants of the Future: Electricity and Ammonia Polygeneration Concept CONTRACT: 89243319CFE000016
April 13, 2020 Page 1
1. Concept Background
Team AST developed a coal-based power system for application in the evolving bulk power
system. Specifically, the design is a polygeneration plant for the co-production of electricity and
ammonia from coal in a flexible system that can adapt to complex and shifting realities inherent
in a modern electrical grid with significant renewable penetration. At a high level, the plant
consists of two gasifier trains, a power island and two ammonia loops.
The general business philosophy of the polygeneration design centers on offering multiple
potential revenue streams, including (1) commercial electricity available for sale to the grid, (2)
salable ancillary services (e.g., capacity markets, frequency stability, voltage regulation, etc.), (3)
and NH3 for commercial delivery at or near retail (as opposed to wholesale) prices. By combining
these three different revenue streams in a polygeneration facility that offers high operational
flexibility, it is possible to modulate plant operations on a very short time scale to meet emerging
market signals and opportunities. This ability to correctly match production to market demand will
allow for optimization of plant profitability.
While the plant has the flexibility to operate at a multitude of operating points, the edges of the
overall operating range are currently described by five specific operation modes, as seen in Exhibit
1-1:
Exhibit 1-1. Summary of Operating Modes
Operating
Point
Net Export
Power
Ammonia
Production
Gasifier
Operation
GT Operation ST Operation Ammonia Loop
Operation
Balanced
Generation,
3 GT’s
48 MW 600 MTPD 100% of
Capacity
Three Turbines @
67% Capacity
Primary ST @
86% load
Both Trains @
100% Capacity
Balanced
Generation,
2 GT’s
51 MW 600 MTPD 100% of
Capacity
Two Turbines @
100% Capacity
Primary ST @
91% Load
Both Trains @
100% Capacity
Net Zero
Power 0 MW 600 MTPD
66% of
Capacity
One Turbine at 67%
Capacity
Primary ST @
40% Load
Both Trains @
100% Capacity
High
Electricity
Production
82 MW 380 MTPD 100% of
Capacity
Three Turbines @
100% Capacity
Primary ST @
88% Load
Both Trains @
63% Capacity
Max
Electricity
Production
112 MW 59 MTPD 100% of
Capacity
Three Turbines @
100% Capacity
Primary ST @
100% Load,
Secondary ST @
85% Load
Both Trains @
10% Capacity
These operating modes define an operating window that provides the flexibility to modulate
ammonia and net electricity production to meet market demand while enabling the two gasifier
trains to operate at ~65% of capacity even in the absence of net electricity demand by the grid.
This will allow the plant owner to choose operating points to maximize profitability while reducing
the potential of being forced into outage by curtailed market demand.
The intent is to operate the polygeneration facility at a high service factor more typical of a
chemical production facility rather than what would be normally expected from a pure, fossil fuel-

U.S. Department of Energy (DOE) National Energy Technology Laboratory (NETL)
Coal-Based Power Plants of the Future: Electricity and Ammonia Polygeneration Concept CONTRACT: 89243319CFE000016
April 13, 2020 Page 2
based electricity generation facility that is subjected to forced curtailment. A number of design
decisions have been made to support this goal. Multiple gasifier trains have been selected to
provide the ability to run one train in conjunction with utilization of stored syngas (if required)
while another train is shut down for maintenance. Additionally, if service is required to either the
ammonia loop or power island, it can be performed at time when high demand is predicted for the
alternative plant production capacity (i.e., if ammonia loop maintenance is required, it can be
scheduled during a time of predicted high net energy demand, reducing the overall turndown for
the plant as a whole).
The ability to perform opportunistic maintenance as described above, as well as the ability to match
plant output to market demand, should support a service factor closer to the 96% metric achievable
by chemical production facilities. However, it should be noted that the standard electrical
generation service metric does not have as clear of a meaning for a polygeneration plant with
multiple, viable operating points.
At the reference Balanced Production, 3 GT’s operating point, ~71,000 kg/hr of as-received,
Illinois #6 coal will be dried in a fluidized bed before passing to two SES U-Gas gasifiers, which
will produce ~172,000 kg/hr of raw syngas. After passing through a water-gas shift reactor and
various syngas cleaning and emission control technologies1, the clean syngas will be nominally
distributed to the ammonia train and power block. This Balanced Production syngas disposition
will support net power generation of 48 MW and ammonia generation of 600 MTPD.
As detailed above in Exhibit 1-1, the 600 MTPD represents the maximum ammonia production
for this plant. By shifting to the High Electricity Production operating mode, it is possible to
increase net power generation to 82 MW while reducing ammonia production to ~380 MTPD.
This net power export can be further increased to 112 MW, as seen in the Max Electricity
Production operating point. This 112 MW net power export relies on a deep turndown of the
ammonia trains (both trains operating at 10% of maximum capacity).
To maximize cross-comparison against existing studies, and to maintain compliance with the site
characteristics and conditions provided by the awarded contract, general siting characteristics and
air composition will be adopted in accordance with those found in the June 2019 release of
National Energy and Technology Laboratory’s (NETL’s) Quality Guideline for Energy System
Studies: Process Modeling Design Parameters2. The general and specific siting characteristics are
provided in the Design Basis report. These characteristics, and the business philosophy described
above, will be combined with the Class 4 capital cost estimates contained below to develop a
forthcoming assessment of commercial viability for inclusion in the final report.
2. Cost Estimating Methodology3
The cost estimates contained in this document are consistent with approved NETL methodologies,
1 Details on ammonia removal, mercury removal, acid gas removal, CO2 compression and drying, sulfur recovery, and
tail gas treatment can be found in Performance Analysis Report. 2 These exhibits correspond with Site Conditions found in the June 2019 release of NETL’s Quality Guideline for
Energy System Studies: Process Modeling Design Parameters. However, some differences do exist. In these instances,
this report has defaulted to the values in the latest QGESS document. 3 This section is largely repeated verbatim from the 2019 version of NETL’s Cost and Performance Baseline for
Fossil Energy Plants Volume 1: Bituminous Coal and Natural Gas to Electricity.” Changes have been made, were
appropriate, to ensure relevance and accuracy with the polygeneration design.

U.S. Department of Energy (DOE) National Energy Technology Laboratory (NETL)
Coal-Based Power Plants of the Future: Electricity and Ammonia Polygeneration Concept CONTRACT: 89243319CFE000016
April 13, 2020 Page 3
as defined in the 2019 revision of the QGESS document Cost Estimation Methodology for NETL
Assessment of Power Plant Performance. Multiple individual members of the AST Team are well
versed in these approaches through their experience serving as Program Managers overseeing past
process and cost engineering work for NETL. Additionally, the applied methodology draws on
Worley’s past experience serving as the EPC supporting NETL strategic analysis functions.
Worley has applied their experience, combined with both (1) vendor cost estimates for component
technologies and (2) scaling and estimation practices considered to be industry standard to develop
and certify a Class 4 capital cost estimate as defined by the Association for the Advancement of
Cost Engineering International (AACE).4
The individual unit operations and operating sections of the defined polygeneration plant are
sufficiently mature to eliminate the need to integrate technologies requiring a high level of new
research and development (R&D). However, there is some uncertainty associated with the initial,
complex integrations of technologies in a commercial application. It is possible that the integration
component may result in higher costs, however this cost variation will be within the cost range as
expected for a Class 4 cost estimate.
While these cost estimates represent the best abstract estimate at the current level of engineering,
actual reported project costs for the polygeneration design are also expected to deviate from the
cost estimates in this report due to differences in real-world implementation (e.g., project- and site-
specific considerations) that may impact construction costs. The reported cost uncertainty does not
capture changes to site characteristics or added infrastructure costs that would be incurred from
changing the design basis of the project.
External supporting innovations (e.g., improvements in ammonia synthesis and pre-combustion
capture technology, as mentioned in the Pre-FEED study’s technology gap analysis) are expected
to result in design and operational improvements for future generations of this polygeneration
technology platform (beyond the current scope), resulting in lower costs than those estimated here.
2.1 Capital Costs5
Exhibit 2-1, provides an overview of the five capital cost levels included within this report: BEC,
EPCC, TPC, and TOC are “overnight” costs, expressed in December 2018 dollars. TASC is
expressed in mixed, current-year dollars over the assumed five-year capital expenditure period for
the polygeneration design. The following definitions have been adopted in accordance with the
definitions found in the 2019 version of NETL’s Quality Guideline for Energy System Studies: Cost
Estimation Methodology for NETL Assessment of Power Plant Performance:
Bare Erected Cost (BEC) comprises the cost of process equipment, on-site facilities and
infrastructure that support the plant (e.g., shops, offices, labs, road), and the direct and indirect
labor required for its construction and/or installation. Equipment cost estimates are frequently
4 A disconnect exists between the Class 4 definition of -30% to 50% found in the relevant AACE documentation
(“18R-97: Cost Estimate Classification System – As Applied in Engineering, Procurement, and Construction for the
Process Industries”) vs. the definition of -15% to 30% found in the relevant QGESS documentation ("Cost
Estimation Methodology for NETL Assessment of Power Plant Performance"). As AACE is the accepted authority
for the AACE Class 4 standard, the AACE defined range of -30% to 50% has been applied in this report. 5 The cost level definitions and graphic appearing in Exhibit 2-1 are a reproduction of those found in Section 2.1:
Level of Capital Costs in the June 2019 release of NETL’s Quality Guideline for Energy System Studies: Cost
Estimation Methodology for NETL Assessment of Power Plant Performance (National Energy Technology
Laboratory, "Quality Guidelines for Energy System Studies: Cost Estimation Methodology for NETL Assessment of
Power Plant Performance," U.S. Department of Energy, Pittsburgh, PA, 2019.)

U.S. Department of Energy (DOE) National Energy Technology Laboratory (NETL)
Coal-Based Power Plants of the Future: Electricity and Ammonia Polygeneration Concept CONTRACT: 89243319CFE000016
April 13, 2020 Page 4
developed for each plant or plant component using in-house database and conceptual estimating
models for specific technologies and may differ from values generated by other software packages
such as Aspentech’s Aspen Economic Analyzer.
Engineering, Procurement, and Construction Cost (EPCC) comprises the BEC plus the cost of
services provided by the EPC contractor. The EPC services include detailed design, contractor
permitting (i.e., those permits that individual contractors must obtain to perform their scopes of
work, as opposed to project permitting, which is not included here), and project/construction
management costs.
Total Plant Cost (TPC) comprises the EPCC cost plus project and process contingencies.
Total Overnight Capital (TOC) comprises the TPC plus all other “overnight” costs, including
owner’s costs. TOC is an overnight cost, expressed in base-year dollars and as such does not include
escalation during construction or construction financing costs.
Total As-Spent Capital (TASC) comprises the sum of all capital expenditures as they are incurred during
the capital expenditure period for construction including their escalation. TASC also includes interest
during construction, comprised of interest on debt and a return on equity (ROE). TASC is expressed in
mixed, current-year dollars over the capital expenditure period.
Exhibit 2-1. Capital Cost Levels and Their Elements6
2.1.1 Cost Estimate Basis and Classification
Worley used a combination of: (1) in-house database and estimating models, (2) commercial
software packages, and (3) scaling based on applying QGESS methodologies to existing NETL
6 This graphic is a reproduction of one found in existing NETL literature (National Energy Technology Laboratory,
"Quality Guidelines for Energy System Studies: Specification for Selected Feedstocks," U.S. Department of Energy,
Pittsburgh, PA, 2019) in accordance with fair-use standards.

U.S. Department of Energy (DOE) National Energy Technology Laboratory (NETL)
Coal-Based Power Plants of the Future: Electricity and Ammonia Polygeneration Concept CONTRACT: 89243319CFE000016
April 13, 2020 Page 5
reports to develop TPC and operation and maintenance (O&M) costs for the relevant operating
modes. Additional discussion and details can be found in Section 3.
2.1.2 System Code-of-Accounts
As with NETL’s Baseline reports7, a process/system-oriented code of accounts is used to group
relevant costs into logical subaccounts. This approach ensures that all components of a given
process or unit operation are logically grouped together.
2.1.3 Estimate Scope
The estimates represent the polygeneration plant deployed on a generic site located in the Midwest.
The limit of the plant includes the total facility including feedstock receiving and water supply
system, ending at the high voltage side of the main power transformers.
CO2 transport and storage (T&S) costs are not considered in the reported capital or O&M costs.
2.1.4 Capital Cost Assumptions8
Worley developed the capital cost estimates for the polygeneration plant using the company’s in-
house database, commercial software packages, and relevant QGESS scaling methodologies. This
database and approach are maintained by Worley as part of a commercial design base of experience
for similar equipment in the company’s range of power and chemical process projects. A reference
bottom-up estimate for each major component provides the basis for the estimating models.
Other key estimate considerations include the following:
• Labor costs are based on Midwest, Merit Shop. The estimating models are based on a U.S.
Gulf Coast location and the labor cost has been factored to a Midwest location. Labor cost
data were sourced from recent projects and proprietary Worley in-house references/cost
databases.
• The estimates are based on a competitive bidding environment, with adequate skilled craft
labor available locally.
• Labor is based on a 50-hour work-week (5-10s). No additional incentives such as per-diem
allowances or bonuses have been included to attract craft labor.
• While not included at this time, labor incentives may ultimately be required to attract and
retain skilled labor depending on the amount of competing work in the region, and the
availability of skilled craft in the area at the time the projects proceed to construction.
• The estimates are based on a greenfield site.
7 National Energy Technology Laboratory, "Cost and Performance Baseline for Fossil Energy Plants Volume 1:
Bituminous Coal and Natural Gas to Electricity," U.S. Department of Energy, Pittsburgh, PA, 2019.
8 These are standard assumptions used by Worley for capital cost assumptions. As such they match the assumptions
which appear in previous NETL documents on which they have worked, including the previous NETL Baseline
reports. The text in this section closely mirrors what can be found in Revision 2b of Volume 1b (National Energy
Technology Laboratory, "Cost and Performance Baseline for Fossil Energy Plants Volume 1b: Bituminous Coal
(IGCC) to Electricity, Revision 2b – Year Dollar Update" U.S. Department of Energy, Pittsburgh, PA, 2015.). The
only notable exception is the update in the engineering/construction management costs from 8-10% to 15% to reflect
prevailing Baseline assumptions.
U.S. Department of Energy (DOE) National Energy Technology Laboratory (NETL)
Coal-Based Power Plants of the Future: Electricity and Ammonia Polygeneration Concept CONTRACT: 89243319CFE000016
April 13, 2020 Page 6
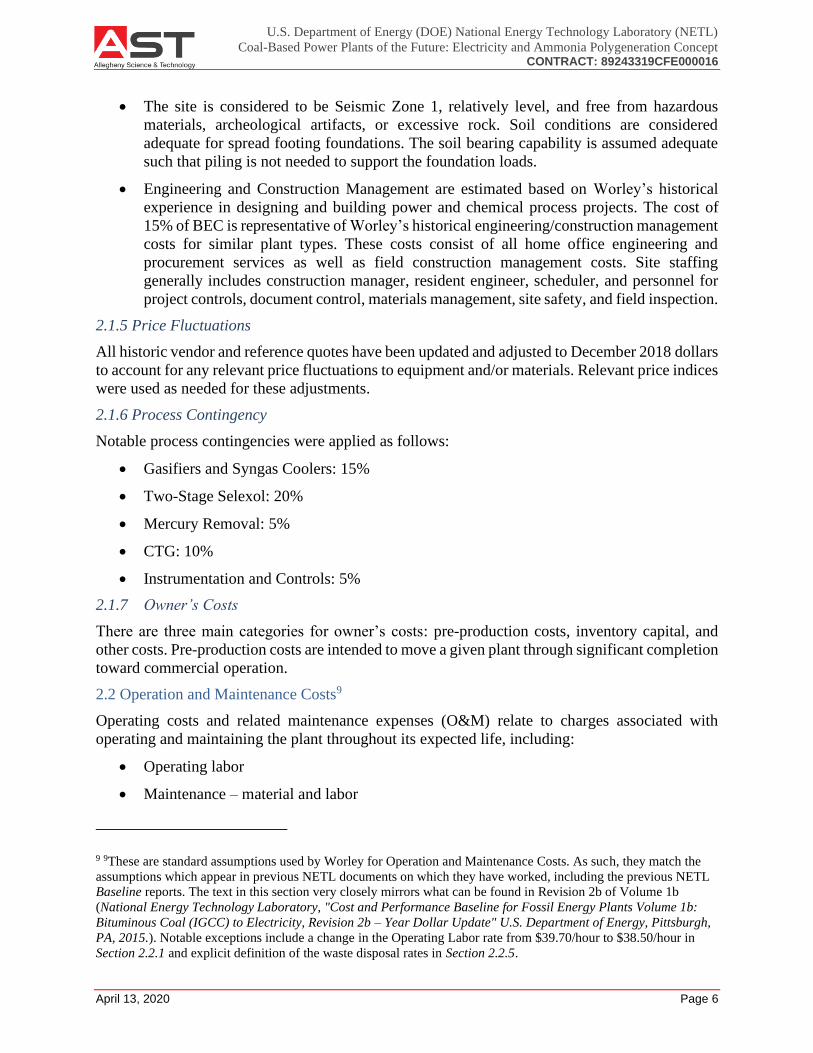
• The site is considered to be Seismic Zone 1, relatively level, and free from hazardous
materials, archeological artifacts, or excessive rock. Soil conditions are considered
adequate for spread footing foundations. The soil bearing capability is assumed adequate
such that piling is not needed to support the foundation loads.
• Engineering and Construction Management are estimated based on Worley’s historical
experience in designing and building power and chemical process projects. The cost of
15% of BEC is representative of Worley’s historical engineering/construction management
costs for similar plant types. These costs consist of all home office engineering and
procurement services as well as field construction management costs. Site staffing
generally includes construction manager, resident engineer, scheduler, and personnel for
project controls, document control, materials management, site safety, and field inspection.
2.1.5 Price Fluctuations
All historic vendor and reference quotes have been updated and adjusted to December 2018 dollars
to account for any relevant price fluctuations to equipment and/or materials. Relevant price indices
were used as needed for these adjustments.
2.1.6 Process Contingency
Notable process contingencies were applied as follows:
• Gasifiers and Syngas Coolers: 15%
• Two-Stage Selexol: 20%
• Mercury Removal: 5%
• CTG: 10%
• Instrumentation and Controls: 5%
2.1.7 Owner’s Costs
There are three main categories for owner’s costs: pre-production costs, inventory capital, and
other costs. Pre-production costs are intended to move a given plant through significant completion
toward commercial operation.
2.2 Operation and Maintenance Costs9
Operating costs and related maintenance expenses (O&M) relate to charges associated with
operating and maintaining the plant throughout its expected life, including:
• Operating labor
• Maintenance – material and labor
9 9These are standard assumptions used by Worley for Operation and Maintenance Costs. As such, they match the
assumptions which appear in previous NETL documents on which they have worked, including the previous NETL
Baseline reports. The text in this section very closely mirrors what can be found in Revision 2b of Volume 1b
(National Energy Technology Laboratory, "Cost and Performance Baseline for Fossil Energy Plants Volume 1b:
Bituminous Coal (IGCC) to Electricity, Revision 2b – Year Dollar Update" U.S. Department of Energy, Pittsburgh,
PA, 2015.). Notable exceptions include a change in the Operating Labor rate from $39.70/hour to $38.50/hour in
Section 2.2.1 and explicit definition of the waste disposal rates in Section 2.2.5.

U.S. Department of Energy (DOE) National Energy Technology Laboratory (NETL)
Coal-Based Power Plants of the Future: Electricity and Ammonia Polygeneration Concept CONTRACT: 89243319CFE000016
April 13, 2020 Page 7
• Administrative and support labor
• Consumables
• Feedstock
• Waste disposal
• Co-product or by-product credit (that is, a negative cost for any by-products sold)
O&M costs can be divided into both “fixed” and “variable” costs.
2.2.1 Operating Labor
Operating labor cost was determined based on the number of operators required for the
polygeneration plant with an average base labor rate used to determine annual cost is $38.50/hour
and an associated labor burden of 30% relative to the base labor rate.
2.2.2 Maintenance Material and Labor
Maintenance cost is based on the maintenance costs in relation to the initial capital costs. Due to
the aggressive cycling and ramping that this plant is expected to be subjected to, an additional
10% maintenance adder has been applied to account for protentional extra wear on the equipment.
2.2.3 Administrative and Support Labor
Labor administration and overhead charges are assessed at a rate of 25% of the burdened O&M
labor.
2.2.4 Consumables
Consumable costs, including plant feedstock, were determined on the using relevant consumption
rates, unit costs, and plant capacity factors. Required consumable quantities are based on
previously developed energy and mass balances for the polygeneration plant.10 The quantities for
initial fills and daily consumables were calculated on a 100 percent operating capacity basis at the
Balanced Generation, 3 GT’s operating point.11
2.2.5 Waste Disposal
The approach for estimating waste quantities and disposal costs is similar to consumables, with
hazardous waste disposal rates of $80.00/ton and non-hazardous waste disposal rates of
$38.00/ton.
2.2.6 Co-Products and By-Products
No financial credit was taken to offset costs based on the potential salable value or relevant by-
products when calculating system costs. However, as the plant is a polygeneration facility,
sensitivity to ammonia prices was examined in Section 3.
3. Cost Estimates
Additional details regarding the source of cost estimates can be seen in Exhibit 3-1, and applying
10 Please refer to the Performance Analysis report for the relevant energy and mass balances. 11 The Balanced Generation, 3 GT’s operating point represents the maximum values for initial fills and consumables
of the five defined operating points.

U.S. Department of Energy (DOE) National Energy Technology Laboratory (NETL)
Coal-Based Power Plants of the Future: Electricity and Ammonia Polygeneration Concept CONTRACT: 89243319CFE000016
April 13, 2020 Page 8
the previously discussed cost methodologies results in the BEC and TPC seen in Exhibit 3-2.
Exhibit 3-3 shows the owner’s costs, TOC, and TASC. Exhibit’s 3-4 through 3-10 examine the
O&M costs for the polygeneration plant.
It should be noted that no costs in Exhibits 3-1 through 3-10 are reported on a per kilowatt (or
megawatt) basis due to the inherent design and operating characteristics of a polygeneration plant.
There is not a clear kilowatt basis for a system that operates across a broad, adaptive window that
includes cogeneration of salable products (e.g., ammonia). Furthermore, the metric has no meaning
when there are capital components (such as the ammonia loop) that are not related to electricity
generation.
Additional discussion of this decision, as well as the inherent problems of applying a per kilowatt
(or per megawatt) metric to a polygeneration plant, is presented following Exhibit 3-12.
The cost estimates for the major sub-systems came from three primary sources:
• Worley proprietary in-house data and cost modeling database
• Aspen Capital Cost Estimator based on the relevant sized equipment list
• Scaling based on the 2019 Baseline report, which represents detailed bottoms-up
estimates of cost accounts done by qualified firms such as Worley Group and Black
and Veatch providing site support services to NETL
In some cases, data points from multiple sources were combined to generate the final reported
estimate.
Details of this approach for selected major subsystems can be seen in Exhibit 3-1.
Exhibit 3-1 Polygeneration Owner’s Costs
(table content redacted to protect proprietary information)
U.S. Department of Energy (DOE) National Energy Technology Laboratory (NETL)
Coal-Based Power Plants of the Future: Electricity and Ammonia Polygeneration Concept CONTRACT: 89243319CFE000016
April 13, 2020 Page 9
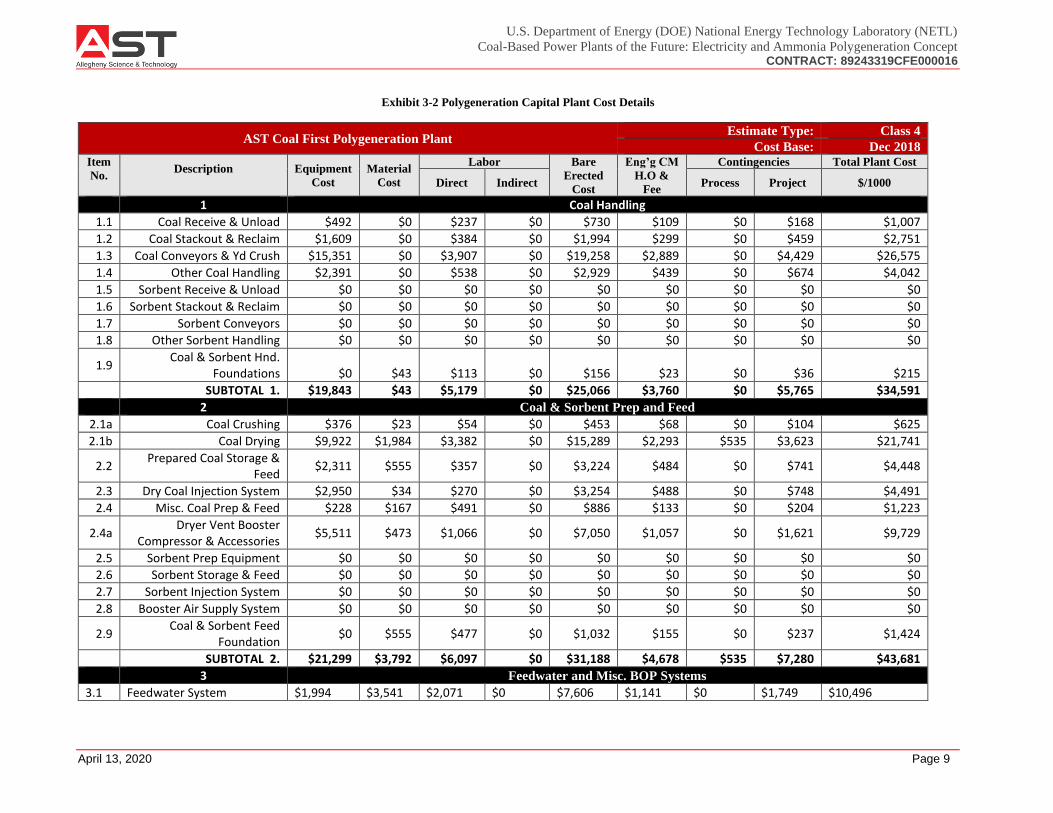
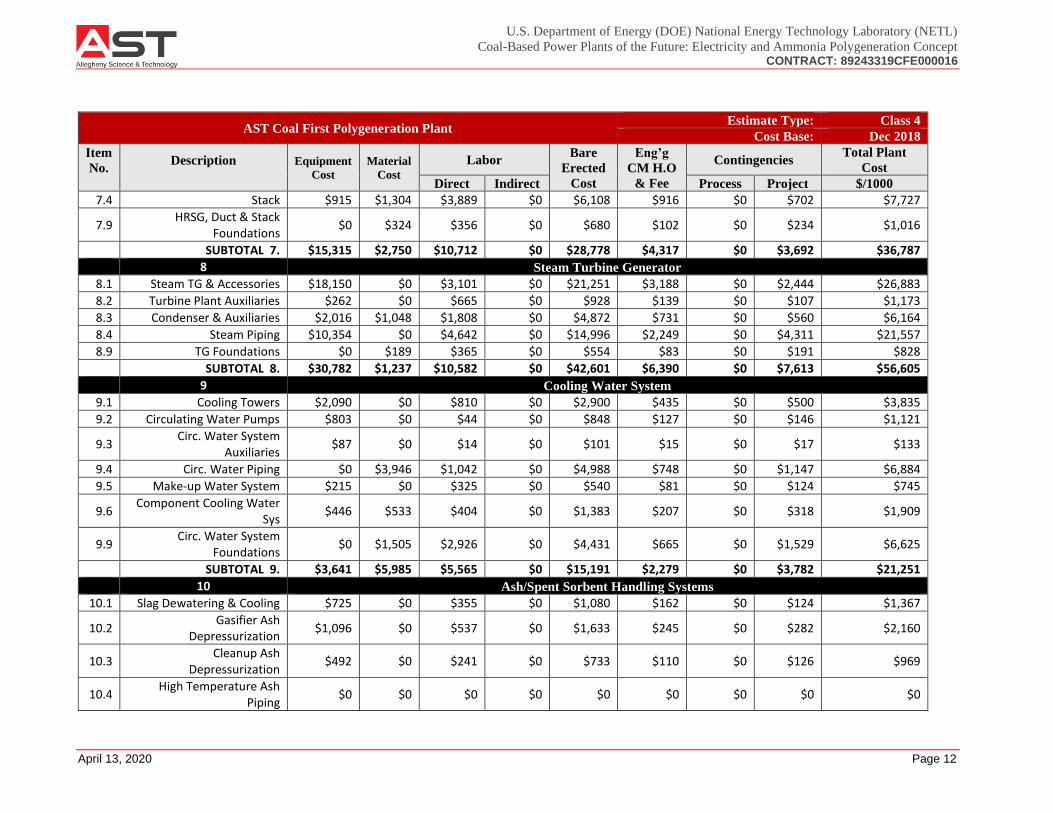
Exhibit 3-2 Polygeneration Capital Plant Cost Details
AST Coal First Polygeneration Plant Estimate Type: Class 4
Cost Base: Dec 2018 Item
No.
Description
Equipment
Cost
Material
Cost
Labor Bare
Erected
Cost
Eng’g CM
H.O &
Fee
Contingencies Total Plant Cost
Direct Indirect Process Project $/1000
1 Coal Handling
1.1 Coal Receive & Unload $492 $0 $237 $0 $730 $109 $0 $168 $1,007
1.2 Coal Stackout & Reclaim $1,609 $0 $384 $0 $1,994 $299 $0 $459 $2,751
1.3 Coal Conveyors & Yd Crush $15,351 $0 $3,907 $0 $19,258 $2,889 $0 $4,429 $26,575
1.4 Other Coal Handling $2,391 $0 $538 $0 $2,929 $439 $0 $674 $4,042
1.5 Sorbent Receive & Unload $0 $0 $0 $0 $0 $0 $0 $0 $0
1.6 Sorbent Stackout & Reclaim $0 $0 $0 $0 $0 $0 $0 $0 $0
1.7 Sorbent Conveyors $0 $0 $0 $0 $0 $0 $0 $0 $0
1.8 Other Sorbent Handling $0 $0 $0 $0 $0 $0 $0 $0 $0
1.9 Coal & Sorbent Hnd.
Foundations $0 $43 $113 $0 $156 $23 $0 $36 $215
SUBTOTAL 1. $19,843 $43 $5,179 $0 $25,066 $3,760 $0 $5,765 $34,591
2 Coal & Sorbent Prep and Feed
2.1a Coal Crushing $376 $23 $54 $0 $453 $68 $0 $104 $625
2.1b Coal Drying $9,922 $1,984 $3,382 $0 $15,289 $2,293 $535 $3,623 $21,741
2.2 Prepared Coal Storage &
Feed $2,311 $555 $357 $0 $3,224 $484 $0 $741 $4,448
2.3 Dry Coal Injection System $2,950 $34 $270 $0 $3,254 $488 $0 $748 $4,491
2.4 Misc. Coal Prep & Feed $228 $167 $491 $0 $886 $133 $0 $204 $1,223
2.4a Dryer Vent Booster
Compressor & Accessories $5,511 $473 $1,066 $0 $7,050 $1,057 $0 $1,621 $9,729
2.5 Sorbent Prep Equipment $0 $0 $0 $0 $0 $0 $0 $0 $0
2.6 Sorbent Storage & Feed $0 $0 $0 $0 $0 $0 $0 $0 $0
2.7 Sorbent Injection System $0 $0 $0 $0 $0 $0 $0 $0 $0
2.8 Booster Air Supply System $0 $0 $0 $0 $0 $0 $0 $0 $0
2.9 Coal & Sorbent Feed
Foundation $0 $555 $477 $0 $1,032 $155 $0 $237 $1,424
SUBTOTAL 2. $21,299 $3,792 $6,097 $0 $31,188 $4,678 $535 $7,280 $43,681
3 Feedwater and Misc. BOP Systems
3.1 Feedwater System $1,994 $3,541 $2,071 $0 $7,606 $1,141 $0 $1,749 $10,496

U.S. Department of Energy (DOE) National Energy Technology Laboratory (NETL)
Coal-Based Power Plants of the Future: Electricity and Ammonia Polygeneration Concept CONTRACT: 89243319CFE000016
April 13, 2020 Page 10
AST Coal First Polygeneration Plant Estimate Type: Class 4
Cost Base: Dec 2018
Item
No.
Description
Equipment
Cost
Material
Cost
Labor Bare
Erected
Cost
Eng’g
CM H.O
& Fee
Contingencies Total Plant
Cost
Direct Indirect Process Project $/1000
3.2 Water Makeup &
Pretreating $320 $33 $195 $0 $548 $82 $0 $189 $819
3.3 Other Feedwater
Subsystems $1,549 $541 $656 $0 $2,746 $412 $0 $632 $3,790
3.4 Service Water Systems $189 $372 $1,429 $0 $1,989 $298 $0 $686 $2,974
3.5 Other Boiler Plant Systems $3,271 $1,360 $3,201 $0 $7,832 $1,175 $0 $1,801 $10,808
3.6 FO Supply Sys & Nat Gas $267 $505 $522 $0 $1,295 $194 $0 $298 $1,787
3.7 Waste Treatment
Equipment $416 $0 $298 $0 $713 $107 $0 $246 $1,067
3.8 Misc. Power Plant
Equipment $910 $121 $547 $0 $1,578 $237 $0 $544 $2,359
SUBTOTAL 3. $8,915 $6,473 $8,919 $0 $24,306 $3,646 $0 $6,146 $34,098
4 Gasifier and Accessories
4.1 Gasifier, Syngas Cooler &
Auxiliaries (U-Gas) $40,045 $23,625 $33,868 $0 $97,538 $14,631 $14,631 $19,020 $145,819
4.2 Syngas Cooling w/4.1 w/ 4.1 w/ 4.1 $0 $0 $0 $0 $0 $0
4.3 ASU/Oxidant Compression $23,731 $15,188 $26,199 $0 $65,117 $9,768 $0 $0 $74,885
4.4 LT Heat Recovery & FG
Saturation $0 $0 $0 $0 $0 $0 $0 $0 $0
4.5 Misc. Gasification Equip. $173 $321 $664 $0 $1,159 $174 $0 $0 $1,333
4.6 Flare Stack System $343 $193 $108 $0 $643 $96 $0 $148 $887
4.8 Major Component Rigging w/ 4.1 w/ 4.1 w/ 4.1 $0 $0 $0 $0 $0 $0
4.9 Gasification Foundations w/ 4.1 w/ 4.1 w/ 4.1 $0 $0 $0 $0 $0 $0
SUBTOTAL 4. $64,292 $39,327 $60,838 $0 $164,457 $24,669 $14,631 $19,168 $222,924
5A Gas Cleanup and Piping 5A.1 Double Stage Selexol $65,792 $0 $27,586 $0 $93,379 $14,007 $18,676 $25,212 $151,274
5A.2 Elemental Sulfur Plant $23,075 $4,498 $29,566 $0 $57,139 $8,571 $0 $13,142 $78,852
5A.3 Mercury Removal $317 $0 $240 $0 $557 $84 $28 $134 $802
5A.4 Shift Reactors $3,741 $2,859 $3,225 $0 $9,824 $1,474 $0 $0 $11,298
5A.5 Particulate Removal w/4.1 $0 w/4.1 $0 $0 $0 $0 $0 $0
5A.6 Blowback Gas Systems $343 $193 $108 $0 $643 $96 $0 $0 $739

U.S. Department of Energy (DOE) National Energy Technology Laboratory (NETL)
Coal-Based Power Plants of the Future: Electricity and Ammonia Polygeneration Concept CONTRACT: 89243319CFE000016
April 13, 2020 Page 11
AST Coal First Polygeneration Plant Estimate Type: Class 4
Cost Base: Dec 2018
Item
No.
Description
Equipment
Cost
Material
Cost
Labor Bare
Erected
Cost
Eng’g
CM H.O
& Fee
Contingencies Total Plant
Cost
Direct Indirect Process Project $/1000
5A.7 Fuel Gas Piping $0 $380 $249 $0 $629 $94 $0 $145 $868
5A.8 Gas Cooling $10,413 $2,355 $4,481 $0 $17,250 $2,587 $0 $3,967 $23,805
5A.9 Sour Water Stripper $2,394 $1,745 $3,060 $0 $7,199 $1,080 $0 $1,656 $9,935
5A.10 Sulfur Storage $2,651 $272 $1,238 $0 $4,161 $624 $0 $957 $5,743
5A.11 Syngas Storage $0 $5,152 $8,872 $0 $14,023 $2,104 $0 $3,225 $19,352
5A.12 Process Interconnects $0 $10,000 $24,000 $0 $34,000 $5,100 $0 $7,820 $46,920
5A.13 HGCU Foundations $0 $214 $144 $0 $358 $54 $0 $124 $536
SUBTOTAL 5A. $108,727 $27,668 $102,769 $0 $239,164 $35,875 $18,704 $56,382 $350,124
5B CO2 Compression 5B.1 CO2 Removal System $0 $0 $0 $0 $0 $0 $0 $0 $0
5B.2 CO2 Compression & Drying $13,822 $1,802 $3,468 $0 $19,092 $2,864 $0 $4,391 $26,347
5B.3 CO2 Transport & Storage $0 $0 $0 $0 $0 $0 $0 $0 $0
SUBTOTAL 5B. $13,822 $1,802 $3,468 $0 $19,092 $2,864 $0 $4,391 $26,347
5C Ammonia Production 5C.1 Ammonia Plant $71,045 $19,563 $13,157 $0 $103,764 $15,565 $0 $23,866 $143,195
5C.2 Ammonia Storage &
Loadout $7,466 $2,146 $12,576 $0 $22,188 $3,328 $0 $5,103 $30,619
SUBTOTAL 5C. $78,510 $21,709 $25,733 $0 $125,952 $18,893 $0 $28,969 $173,813
6 Combustion Turbine and Accessories
6.1 Combustion Turbine
Generator $33,945 $0 $1,929 $0 $35,874 $5,381 $3,587 $4,484 $49,327
6.2 Combustion Turbine
Auxiliaries $1,796 $429 $813 $0 $3,038 $456 $0 $0 $3,494
6.3 Compressed Air Piping $0 $0 $0 $0 $0 $0 $0 $0 $0
6.9 Combustion Turbine
Foundations $0 $601 $760 $0 $1,360 $204 $0 $469 $2,034
SUBTOTAL 6. $35,741 $1,029 $3,502 $0 $40,273 $6,041 $3,587 $4,954 $54,855
7 Heat Recovery Steam Generator (HRSG), Ducting, and Stack 7.1 HRSG $14,400 $0 $5,623 $0 $20,023 $3,003 $0 $2,303 $25,329
7.2 Selective Catalytic
Reduction (SCR) System w/7.1 w/7.1 w/7.1 $0 $0 $0 $0 $0 $0
7.3 Ductwork $0 $1,123 $845 $0 $1,967 $295 $0 $453 $2,715
U.S. Department of Energy (DOE) National Energy Technology Laboratory (NETL)
Coal-Based Power Plants of the Future: Electricity and Ammonia Polygeneration Concept CONTRACT: 89243319CFE000016
April 13, 2020 Page 12
AST Coal First Polygeneration Plant Estimate Type: Class 4
Cost Base: Dec 2018
Item
No.
Description
Equipment
Cost
Material
Cost
Labor Bare
Erected
Cost
Eng’g
CM H.O
& Fee
Contingencies Total Plant
Cost
Direct Indirect Process Project $/1000
7.4 Stack $915 $1,304 $3,889 $0 $6,108 $916 $0 $702 $7,727
7.9 HRSG, Duct & Stack
Foundations $0 $324 $356 $0 $680 $102 $0 $234 $1,016
SUBTOTAL 7. $15,315 $2,750 $10,712 $0 $28,778 $4,317 $0 $3,692 $36,787
8 Steam Turbine Generator 8.1 Steam TG & Accessories $18,150 $0 $3,101 $0 $21,251 $3,188 $0 $2,444 $26,883
8.2 Turbine Plant Auxiliaries $262 $0 $665 $0 $928 $139 $0 $107 $1,173
8.3 Condenser & Auxiliaries $2,016 $1,048 $1,808 $0 $4,872 $731 $0 $560 $6,164
8.4 Steam Piping $10,354 $0 $4,642 $0 $14,996 $2,249 $0 $4,311 $21,557
8.9 TG Foundations $0 $189 $365 $0 $554 $83 $0 $191 $828
SUBTOTAL 8. $30,782 $1,237 $10,582 $0 $42,601 $6,390 $0 $7,613 $56,605
9 Cooling Water System 9.1 Cooling Towers $2,090 $0 $810 $0 $2,900 $435 $0 $500 $3,835
9.2 Circulating Water Pumps $803 $0 $44 $0 $848 $127 $0 $146 $1,121
9.3 Circ. Water System
Auxiliaries $87 $0 $14 $0 $101 $15 $0 $17 $133
9.4 Circ. Water Piping $0 $3,946 $1,042 $0 $4,988 $748 $0 $1,147 $6,884
9.5 Make-up Water System $215 $0 $325 $0 $540 $81 $0 $124 $745
9.6 Component Cooling Water
Sys $446 $533 $404 $0 $1,383 $207 $0 $318 $1,909
9.9 Circ. Water System
Foundations $0 $1,505 $2,926 $0 $4,431 $665 $0 $1,529 $6,625
SUBTOTAL 9. $3,641 $5,985 $5,565 $0 $15,191 $2,279 $0 $3,782 $21,251
10 Ash/Spent Sorbent Handling Systems 10.1 Slag Dewatering & Cooling $725 $0 $355 $0 $1,080 $162 $0 $124 $1,367
10.2 Gasifier Ash
Depressurization $1,096 $0 $537 $0 $1,633 $245 $0 $282 $2,160
10.3 Cleanup Ash
Depressurization $492 $0 $241 $0 $733 $110 $0 $126 $969
10.4 High Temperature Ash
Piping $0 $0 $0 $0 $0 $0 $0 $0 $0

U.S. Department of Energy (DOE) National Energy Technology Laboratory (NETL)
Coal-Based Power Plants of the Future: Electricity and Ammonia Polygeneration Concept CONTRACT: 89243319CFE000016
April 13, 2020 Page 13
AST Coal First Polygeneration Plant Estimate Type: Class 4
Cost Base: Dec 2018
Item
No.
Description
Equipment
Cost
Material
Cost
Labor Bare
Erected
Cost
Eng’g
CM H.O
& Fee
Contingencies Total Plant
Cost
Direct Indirect Process Project $/1000
10.5 Other Ash Rec. Equipment $0 $0 $0 $0 $0 $0 $0 $0 $0
10.6 Ash Storage Silos $1,104 $0 $1,193 $0 $2,297 $345 $0 $396 $3,038
10.7 Ash Transport/Feed Equip. $425 $0 $99 $0 $524 $79 $0 $90 $693
10.8 Misc. Ash Handling Equip. $61 $75 $22 $0 $158 $24 $0 $27 $209
10.9 Ash/Spent Sorbent
Foundation $0 $431 $573 $0 $1,004 $151 $0 $346 $1,501
SUBTOTAL 10. $3,903 $506 $3,020 $0 $7,429 $1,114 $0 $1,393 $9,936
11 Accessory Electric Plant 11.1 Generator Equipment $556 $0 $661 $0 $1,217 $183 $0 $140 $1,539
11.2 Station Service Equipment $3,359 $0 $364 $0 $3,722 $558 $0 $428 $4,709
11.3 Switchgear & Motor Control $5,986 $0 $1,358 $0 $7,344 $1,102 $0 $1,267 $9,712
11.4 Conduit & Cable Tray $0 $3,403 $11,439 $0 $14,842 $2,226 $0 $4,267 $21,336
11.5 Wire & Cable $0 $5,921 $4,353 $0 $10,274 $1,541 $0 $2,954 $14,769
11.6 Protective Equipment $0 $878 $3,976 $0 $4,854 $728 $0 $837 $6,419
11.7 Standby Equipment $146 $0 $177 $0 $323 $48 $0 $56 $427
11.8 Main Power Transformers $9,374 $0 $85 $0 $9,459 $1,419 $0 $1,632 $12,509
11.9 Electrical Foundations $0 $94 $279 $0 $373 $56 $0 $129 $558
SUBTOTAL 11. $19,421 $10,295 $22,692 $0 $52,408 $7,861 $0 $11,709 $71,979
12 Instrumentation and Control 12.1 IGCC Control Equipment $0 $0 $395 $0 $395 $59 $20 $71 $545
12.2 Combustion Turbine
Control $0
$0 $0
$0 $0 $0 $0 $0 $0
12.3 Steam Turbine Control $0 $0 $0 $0 $0 $0 $0 $0 $0
12.4 Other Major Component
Control $1,399 $0 $1,163 $0 $2,562 $384 $128 $461 $3,535
12.5 Signal Processing
Equipment w/12.7 $0 w/12.7 $0 $0 $0 $0 $0 $0
12.6 Control Boards, Panels &
Racks $322 $0 $257 $0 $578 $87 $29 $139 $833
12.7 Computer & Accessories $7,462 $0 $297 $0 $7,760 $1,164 $388 $931 $10,243
12.8 Instrument Wiring & Tubing $0 $2,900 $6,634 $0 $9,535 $1,430 $477 $2,860 $14,302

U.S. Department of Energy (DOE) National Energy Technology Laboratory (NETL)
Coal-Based Power Plants of the Future: Electricity and Ammonia Polygeneration Concept CONTRACT: 89243319CFE000016
April 13, 2020 Page 14
AST Coal First Polygeneration Plant Estimate Type: Class 4
Cost Base: Dec 2018
Item
No.
Description
Equipment
Cost
Material
Cost
Labor Bare
Erected
Cost
Eng’g
CM H.O
& Fee
Contingencies Total Plant Cost
Direct Indirect Process Project $/1000
12.9 Other I & C Equipment $4,988 $0 $3,015 $0 $8,004 $1,201 $400 $1,441 $11,045
SUBTOTAL 12. $14,171 $2,900 $11,762 $0 $28,834 $4,325 $1,442 $5,903 $40,504
13 Improvements to Site 13.1 Site Preparation $0 $141 $3,630 $0 $3,771 $566 $0 $1,301 $5,638
13.2 Site Improvements $0 $2,513 $4,014 $0 $6,527 $979 $0 $2,252 $9,759
13.3 Site Facilities $4,504 $0 $5,712 $0 $10,216 $1,532 $0 $3,524 $15,273
SUBTOTAL 13. $4,504 $2,655 $13,356 $0 $20,514 $3,077 $0 $7,077 $30,669
12 Building and Structures 14.1 Combustion Turbine Area $0 $202 $123 $0 $326 $49 $0 $75 $449
14.2 Steam Turbine Building $0 $1,678 $2,579 $0 $4,257 $639 $0 $734 $5,630
14.3 Administration Building $0 $1,190 $931 $0 $2,120 $318 $0 $366 $2,804
14.4 Circulation Water
Pumphouse $0 $149 $85 $0 $234 $35 $0 $40 $309
14.5 Water Treatment Buildings $0 $271 $285 $0 $556 $83 $0 $96 $735
14.6 Machine Shop $0 $629 $464 $0 $1,093 $164 $0 $189 $1,446
14.7 Warehouse $0 $1,016 $707 $0 $1,723 $258 $0 $297 $2,279
14.8 Other Buildings &
Structures $0 $608 $511 $0 $1,119 $168 $0 $257 $1,545
14.9 Waste Treating Building &
Str. $0 $1,228 $2,532 $0 $3,760 $564 $0 $865 $5,189
SUBTOTAL 14. $0 $6,972 $8,216 $0 $15,188 $2,278 $0 $2,919 $20,386
TOTAL COST $442,887 $135,144 $302,411 $0 $880,441 $132,066 $38,899 $177,144 $1,228,550

U.S. Department of Energy (DOE) National Energy Technology Laboratory (NETL)
Coal-Based Power Plants of the Future: Electricity and Ammonia Polygeneration Concept CONTRACT: 89243319CFE000016
April 13, 2020 Page 15
Estimates related to syngas storage capacity used a syngas storage capacity of 1,000 m3. The
design basis for the storage capacity was motivated by the desire to ease transitions between
plant operating points, as well as assisting in handling process upsets (i.e. syngas to be diverted
to storage while the gasifier is backdown in event of an issue with the PSA or ammonia train).
These transition needs set the capacity requirement, primarily by evaluating the lag in the
transition time of the ammonia loop relative to the gasifier trains and the power island. The
capacity selected will provide 40 minutes of storage which is sufficient to handle the most drastic
operating point transition, and this storage time can be extended to 60 – 80 minutes by performing other
operational adjustments during the transition period.
Exhibit 3-3 reports the TOC and TASC using the pre-production and inventory capital
requirements required to operate across the whole operating window as strategically desired. As
previously noted, the Owner’s Costs are based on assumptions found in NETL’s Quality Guideline
for Energy System Studies: Cost Estimation Methodology for NETL Assessment of Power Plant
Performance12.
12 The cost estimation contained in this report assumes:
• A Debt/Equity split of 55%/45%
• Real current dollar cost of debt of 2.94%
• Real current dollar cost of equity of 7.84%
• A total weighted average cost of capital of 5.14%
• A 5 year capital expenditure period, with a distribution of total overnight capital over the capital
expenditure period (before escalation) of: 10%, 30%, 25%, 20%, 15%
Please refer to Exhibits 2-4, 3-1, 3-2, and 3-11 in the referenced QGESS document for additional details and
assumptions (National Energy Technology Laboratory, "Quality Guidelines for Energy System Studies: Cost
Estimation Methodology for NETL Assessment of Power Plant Performance," U.S. Department of Energy,
Pittsburgh, PA, 2019.).

U.S. Department of Energy (DOE) National Energy Technology Laboratory (NETL)
Coal-Based Power Plants of the Future: Electricity and Ammonia Polygeneration Concept CONTRACT: 89243319CFE000016
April 13, 2020 Page 16
Exhibit 3-3 Polygeneration Owner’s Costs
Description Balanced, 3 GT’s
$/1,000
Pre-Production
6 Months All Labor $12,090
1 Month Maintenance Materials $1,492
1 Month Non-Feedstock Consumables
$132
1 Month Waste Disposal $197
25% of 1 Month's Feedstock at 100% CF
$740
2% of TPC $24,571
Total Pre-production $39,222
Inventory Capital
60 Day Supply Feedstock & Consumables at 100% CF
$6,095
0.5% of TPC (spare parts) $6,143
Total Inventory Capital $12,238
Other Costs
Initial Cost for Catalysts & Chemicals
$10,456
Land $900
Financing Costs $33,171
Other Owner's Costs $184,282
Total Other Costs $228,809
Total Overnight Cost (TOC) $1,508,818
TASC Multiplier (IOU, 35 year) 1.154
Total As-Spent Cost (TASC) $1,741,177
U.S. Department of Energy (DOE) National Energy Technology Laboratory (NETL)
Coal-Based Power Plants of the Future: Electricity and Ammonia Polygeneration Concept CONTRACT: 89243319CFE000016
April 13, 2020 Page 17
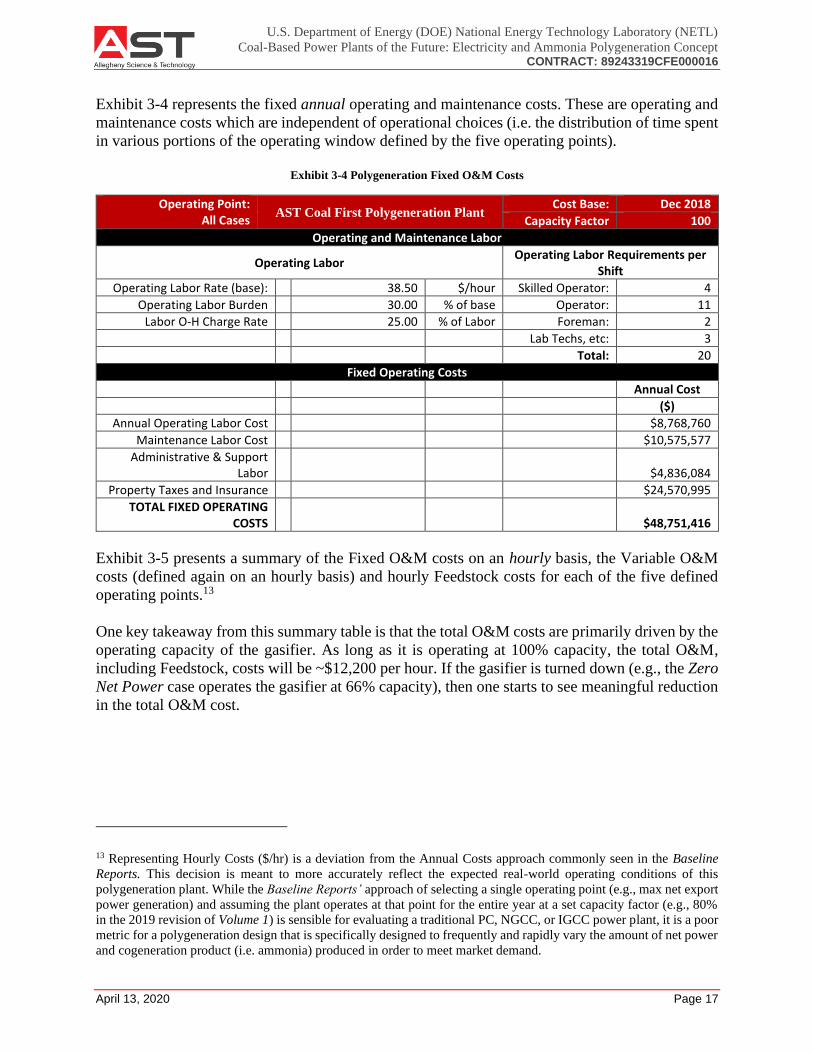
Exhibit 3-4 represents the fixed annual operating and maintenance costs. These are operating and
maintenance costs which are independent of operational choices (i.e. the distribution of time spent
in various portions of the operating window defined by the five operating points).
Exhibit 3-4 Polygeneration Fixed O&M Costs
Operating Point: All Cases
AST Coal First Polygeneration Plant Cost Base: Dec 2018
Capacity Factor 100
Operating and Maintenance Labor
Operating Labor Operating Labor Requirements per
Shift
Operating Labor Rate (base): 38.50 $/hour Skilled Operator: 4
Operating Labor Burden 30.00 % of base Operator: 11
Labor O-H Charge Rate 25.00 % of Labor Foreman: 2
Lab Techs, etc: 3
Total: 20
Fixed Operating Costs
Annual Cost
($)
Annual Operating Labor Cost $8,768,760
Maintenance Labor Cost $10,575,577
Administrative & Support Labor
$4,836,084
Property Taxes and Insurance $24,570,995
TOTAL FIXED OPERATING COSTS
$48,751,416
Exhibit 3-5 presents a summary of the Fixed O&M costs on an hourly basis, the Variable O&M
costs (defined again on an hourly basis) and hourly Feedstock costs for each of the five defined
operating points.13
One key takeaway from this summary table is that the total O&M costs are primarily driven by the
operating capacity of the gasifier. As long as it is operating at 100% capacity, the total O&M,
including Feedstock, costs will be ~$12,200 per hour. If the gasifier is turned down (e.g., the Zero
Net Power case operates the gasifier at 66% capacity), then one starts to see meaningful reduction
in the total O&M cost.
13 Representing Hourly Costs ($/hr) is a deviation from the Annual Costs approach commonly seen in the Baseline
Reports. This decision is meant to more accurately reflect the expected real-world operating conditions of this
polygeneration plant. While the Baseline Reports’ approach of selecting a single operating point (e.g., max net export
power generation) and assuming the plant operates at that point for the entire year at a set capacity factor (e.g., 80%
in the 2019 revision of Volume 1) is sensible for evaluating a traditional PC, NGCC, or IGCC power plant, it is a poor
metric for a polygeneration design that is specifically designed to frequently and rapidly vary the amount of net power
and cogeneration product (i.e. ammonia) produced in order to meet market demand.

U.S. Department of Energy (DOE) National Energy Technology Laboratory (NETL)
Coal-Based Power Plants of the Future: Electricity and Ammonia Polygeneration Concept CONTRACT: 89243319CFE000016
April 13, 2020 Page 18
Exhibit 3-5 Summary of Hourly Polygeneration O&M and Feedstock Costs
Cost Component Balanced,
3 GT’s
Balanced,
2 GT’s
Zero Net
Power
High Elec
Prod
Max Elec
Prod
Fixed O&M ($/hr) $5,565 $5,565 $5,565 $5,565 $5,565
Variable O&M ($/hr) $2,545 $2,556 $2,409 $2,552 $2,543
Maintenance Material Cost ($/hr) $2,044 $2,044 $2,044 $2,044 $2,044
Water ($/hr) $50 $63 $38 $64 $74
Chemicals ($/hr) $180 $179 $148 $173 $154
Waste Disposal ($/hr) $270 $270 $179 $270 $270
By-Products and Emissions ($/hr) $0 $0 $0 $0 $0
Feedstock ($/hr) $4,059 $4,059 $2,680 $4,059 $4,059
Total: $12,169 $12,180 $10,654 $12,176 $12,167

U.S. Department of Energy (DOE) National Energy Technology Laboratory (NETL)
Coal-Based Power Plants of the Future: Electricity and Ammonia Polygeneration Concept CONTRACT: 89243319CFE000016
April 13, 2020 Page 19
Exhibit’s 3-6 through 3-10 present the detailed breakdown of the Variable O&M and Feedstock
costs that are summarized in Exhibit 3-5. The analysis focuses on the December 2018 Dollars per
hour since the hours spent in various portions of the operating window are not known a priori.
These per hour cost vectors are a key input to AST’s proprietary investment analysis which uses
a reduced form model for the evaluating the profit potential for this polygeneration platform at
the five defined operating points.
Exhibit 3-6 Variable Polygeneration O&M and Feedstock Costs for Balanced, 3 GT’s Operating Point
Operating Point Bal, 3 GT AST Coal First
Polygeneration Plant Cost Base: Dec 2018
Electrical Generation (MW, net) 48
Variable Operating Costs
($)/hr
Maintenance Material: $2,044.46
Consumables
Initial Fill Per Hour Per Unit Initial Fill Cost
Water (gal/1000) - 26.3910 $1.90 $0 $50.14
MU & WT Chem. (ton) - 0.0197 $550.00 $0 $10.81
Carbon (Mercury Removal) (ton) 73 0.0042 $12,000.00 $873,031 $50.27
Water Gas Shift Catalyst (ft3) 3,320 0.0636 $480.00 $1,593,398 $30.51
Selexol Solution (gal) 118,613 0.6868 $38.00 $4,507,304 $26.10
SCR Catalyst (ft3) w/ equip 0.0886 $48.00 $0 $4.25
Ammonia (19% NH3) (ton) 95 0.0562 $300.00 $28,440 $16.87
Ammonia Synthesis Catalyst (ft3) 1,766 0.0202 $1,956.00 $3,453,774 $39.44
Claus Catalyst (ft3) w/ equip 0.0403 $48.00 $0 $1.93
Subtotal: $550.00 $10,455,946 $180.18
Waste Disposal
Spent Mercury Catalyst (ton) 0.0042 $80.00 $0 $0.34
Water Gas Shift Catalyst (ft3) 0.0636 $2.50 $0 $0.16
Selexol Solution 0.6868 $0.35 $0 $0.24
SCR Catalyst (ft3) 0.0886 $3.10 $0 $0.27
Ammonia Synthesis Catalyst (ft3) 0.0202 $16.00 $0 $0.32
Claus Catalyst (ft3) 0.0011 $2.00 $0 $0.00
Slag (ton) 7.0713 $38.00 $0 $268.71
Subtotal: 0.0042 $80.00 $0 $270.04
By-Products Disposal
Sulfur (ton) 1.9842 $0.00 $0 $0
Ammonia (ton) 27.5000 $0.00 $0 $0
Subtotal: $0 $0
Variable Operating Costs Total: $10,455,946 $2,544.83
Feedstock Cost
Illinois #6 (ton) 78.1142 $51.96 $0 $4,058.82
U.S. Department of Energy (DOE) National Energy Technology Laboratory (NETL)
Coal-Based Power Plants of the Future: Electricity and Ammonia Polygeneration Concept CONTRACT: 89243319CFE000016
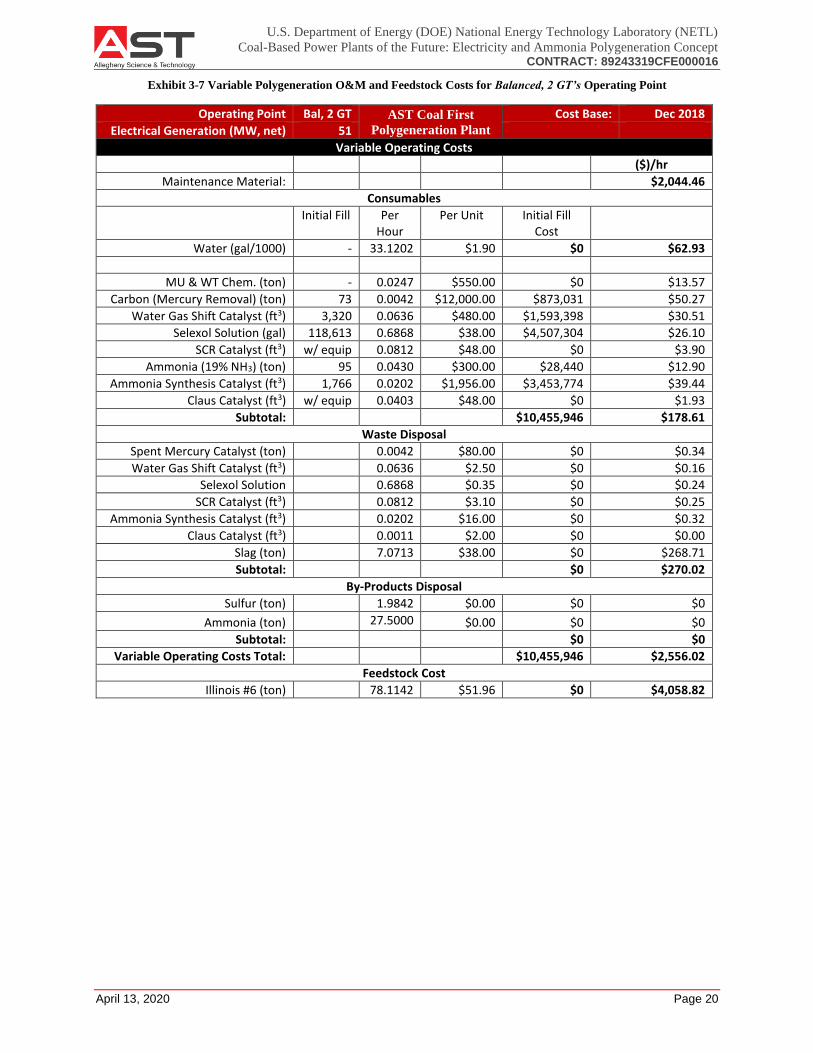
April 13, 2020 Page 20
Exhibit 3-7 Variable Polygeneration O&M and Feedstock Costs for Balanced, 2 GT’s Operating Point
Operating Point Bal, 2 GT AST Coal First
Polygeneration Plant Cost Base: Dec 2018
Electrical Generation (MW, net) 51
Variable Operating Costs
($)/hr
Maintenance Material: $2,044.46
Consumables
Initial Fill Per Hour
Per Unit Initial Fill Cost
Water (gal/1000) - 33.1202 $1.90 $0 $62.93
MU & WT Chem. (ton) - 0.0247 $550.00 $0 $13.57
Carbon (Mercury Removal) (ton) 73 0.0042 $12,000.00 $873,031 $50.27
Water Gas Shift Catalyst (ft3) 3,320 0.0636 $480.00 $1,593,398 $30.51
Selexol Solution (gal) 118,613 0.6868 $38.00 $4,507,304 $26.10
SCR Catalyst (ft3) w/ equip 0.0812 $48.00 $0 $3.90
Ammonia (19% NH3) (ton) 95 0.0430 $300.00 $28,440 $12.90
Ammonia Synthesis Catalyst (ft3) 1,766 0.0202 $1,956.00 $3,453,774 $39.44
Claus Catalyst (ft3) w/ equip 0.0403 $48.00 $0 $1.93
Subtotal: $10,455,946 $178.61
Waste Disposal
Spent Mercury Catalyst (ton) 0.0042 $80.00 $0 $0.34
Water Gas Shift Catalyst (ft3) 0.0636 $2.50 $0 $0.16
Selexol Solution 0.6868 $0.35 $0 $0.24
SCR Catalyst (ft3) 0.0812 $3.10 $0 $0.25
Ammonia Synthesis Catalyst (ft3) 0.0202 $16.00 $0 $0.32
Claus Catalyst (ft3) 0.0011 $2.00 $0 $0.00
Slag (ton) 7.0713 $38.00 $0 $268.71
Subtotal: $0 $270.02
By-Products Disposal
Sulfur (ton) 1.9842 $0.00 $0 $0
Ammonia (ton) 27.5000 $0.00 $0 $0
Subtotal: $0 $0
Variable Operating Costs Total: $10,455,946 $2,556.02
Feedstock Cost
Illinois #6 (ton) 78.1142 $51.96 $0 $4,058.82

U.S. Department of Energy (DOE) National Energy Technology Laboratory (NETL)
Coal-Based Power Plants of the Future: Electricity and Ammonia Polygeneration Concept CONTRACT: 89243319CFE000016
April 13, 2020 Page 21
Exhibit 3-8 Variable Polygeneration O&M and Feedstock Costs for Zero Net Power Operating Point
Operating Point Zero Net Power
AST Coal First
Polygeneration Plant
Cost Base: Dec 2018
Electrical Generation (MW, net) 0
Variable Operating Costs
($)/hr
Maintenance Material: $2,044.46
Consumables
Initial Fill Per Hour Per Unit Initial Fill Cost
Water (gal/1000) - 19.9075 $1.90 $0 $37.82
MU & WT Chem. (ton) - 0.0148 $550.00 $0 $8.15
Carbon (Mercury Removal) (ton) 73 0.0030 $12,000.00 $873,031 $35.71
Water Gas Shift Catalyst (ft3) 3,320 0.0636 $480.00 $1,593,398 $30.51
Selexol Solution (gal) 118,613 0.6868 $38.00 $4,507,304 $26.10
SCR Catalyst (ft3) w/ equip 0.0290 $48.00 $0 $1.39
Ammonia (19% NH3) (ton) 95 0.0187 $300.00 $28,440 $5.62
Ammonia Synthesis Catalyst (ft3) 1,766 0.0202 $1,956.00 $3,453,774 $39.44
Claus Catalyst (ft3) w/ equip 0.0268 $48.00 $0 $1.29
Subtotal: $10,455,946 $148.22
Waste Disposal
Spent Mercury Catalyst (ton) 0.0030 $80.00 $0 $0.24
Water Gas Shift Catalyst (ft3) 0.0636 $2.50 $0 $0.16
Selexol Solution 0.6868 $0.35 $0 $0.24
SCR Catalyst (ft3) 0.0290 $3.10 $0 $0.09
Ammonia Synthesis Catalyst (ft3) 0.0202 $16.00 $0 $0.32
Claus Catalyst (ft3) 0.0008 $2.00 $0 $0.00
Slag (ton) 4.6727 $38.00 $0 $177.56
Subtotal: $0 $178.61
By-Products Disposal
Sulfur (ton) 1.3228 $0.00 $0 $0
Ammonia (ton) 27.5000 $0.00 $0 $0
Subtotal: $0 $0
Variable Operating Costs Total: $10,455,946 $2,409.12
Feedstock Cost
Illinois #6 (ton) 51.5815 $51.96 $0 $2,680.17

U.S. Department of Energy (DOE) National Energy Technology Laboratory (NETL)
Coal-Based Power Plants of the Future: Electricity and Ammonia Polygeneration Concept CONTRACT: 89243319CFE000016
April 13, 2020 Page 22
Exhibit 3-9 Variable Polygeneration O&M and Feedstock Costs for High Electricity Production Operating Point
Operating Point High Elec Prod
AST Coal First
Polygeneration Plant
Cost Base: Dec 2018
Electrical Generation (MW, net) 82
Variable Operating Costs
($)/hr
Maintenance Material: $2,044.46
Consumables
Initial Fill Per Hour Per Unit Initial Fill Cost
Water (gal/1000) - 33.8956 $1.90 $0 $64.40
MU & WT Chem. (ton) - 0.0252 $550.00 $0 $13.88
Carbon (Mercury Removal) (ton) 73 0.0042 $12,000.00 $873,031 $50.27
Water Gas Shift Catalyst (ft3) 3,320 0.0636 $480.00 $1,593,398 $30.51
Selexol Solution (gal) 118,613 0.6868 $38.00 $4,507,304 $26.10
SCR Catalyst (ft3) w/ equip 0.1218 $48.00 $0 $5.85
Ammonia (19% NH3) (ton) 95 0.0661 $300.00 $28,440 $19.84
Ammonia Synthesis Catalyst (ft3) 1,766 0.0128 $1,956.00 $3,453,774 $25.01
Claus Catalyst (ft3) w/ equip 0.0403 $48.00 $0 $1.93
Subtotal: $10,455,946 $173.39
Waste Disposal
Spent Mercury Catalyst (ton) 0.0042 $80.00 $0 $0.34
Water Gas Shift Catalyst (ft3) 0.0636 $2.50 $0 $0.16
Selexol Solution 0.6868 $0.35 $0 $0.24
SCR Catalyst (ft3) 0.1218 $3.10 $0 $0.38
Ammonia Synthesis Catalyst (ft3) 0.0128 $16.00 $0 $0.20
Claus Catalyst (ft3) 0.0011 $2.00 $0 $0.00
Slag (ton) 7.0713 $38.00 $0 $268.71
Subtotal: $0 $270.03
By-Products Disposal
Sulfur (ton) 1.9842 $0.00 $0 $0
Ammonia (ton) 17.4350 $0.00 $0 $0
Subtotal: $0 $0
Variable Operating Costs Total: $10,455,946 $2,552.28
Feedstock Cost
Illinois #6 (ton) 78.1142 $51.96 $0 $4,058.82

U.S. Department of Energy (DOE) National Energy Technology Laboratory (NETL)
Coal-Based Power Plants of the Future: Electricity and Ammonia Polygeneration Concept CONTRACT: 89243319CFE000016
April 13, 2020 Page 23
Exhibit 3-10 Variable Polygeneration O&M and Feedstock Costs for Max Electricity Production Operating Point
Operating Point Max Elec Prod
AST Coal First
Polygeneration Plant
Cost Base: Dec 2018
Electrical Generation (MW, net) 112
Variable Operating Costs
($)/hr
Maintenance Material: $2,044.46
Consumables
Initial Fill Per Hour Per Unit Initial Fill Cost
Water (gal/1000) - 39.1546 $1.90 $0 $74.39
MU & WT Chem. (ton) - 0.0292 $550.00 $0 $16.04
Carbon (Mercury Removal) (ton) 73 0.0042 $12,000.00 $873,031 $50.27
Water Gas Shift Catalyst (ft3) 3,320 0.0636 $480.00 $1,593,398 $30.51
Selexol Solution (gal) 118,613 0.6868 $38.00 $4,507,304 $26.10
SCR Catalyst (ft3) w/ equip 0.1218 $48.00 $0 $5.85
Ammonia (19% NH3) (ton) 95 0.0650 $300.00 $28,440 $19.51
Ammonia Synthesis Catalyst (ft3) 1,766 0.0020 $1,956.00 $3,453,774 $3.87
Claus Catalyst (ft3) w/ equip 0.0403 $48.00 $0 $1.93
Subtotal: $10,455,946 $154.08
Waste Disposal
Spent Mercury Catalyst (ton) 0.0042 $80.00 $0 $0.34
Water Gas Shift Catalyst (ft3) 0.0636 $2.50 $0 $0.16
Selexol Solution 0.6868 $0.35 $0 $0.24
SCR Catalyst (ft3) 0.1218 $3.10 $0 $0.38
Ammonia Synthesis Catalyst (ft3) 0.0020 $16.00 $0 $0.03
Claus Catalyst (ft3) 0.0011 $2.00 $0 $0.00
Slag (ton) 7.0713 $38.00 $0 $268.71
Subtotal: $0 $269.86
By-Products and Emissions
Sulfur (ton) 1.9842 $0.00 $0 $0
Ammonia (ton) 17.4350 $0.00 $0 $0
Subtotal: $0 $0
Variable Operating Costs Total: $10,455,946 $2,542.78
Feedstock Cost
Illinois #6 (ton) 78.1142 $51.96 $0 $4,058.82
Exhibit 3-11 represents the calculated required first-year cost of electricity (COE) in dollars per
MWh required at the five representative operating points based on the previously discussed
financial assumptions and cost estimates and accounting for revenue obtained through the sale of
ammonia produced by the polygeneration plant.14 It should be noted that the exhibit below does
not reflect additional revenue for any potential CO2 sales prices and emissions penalties, profit
from sale of sulfur, etc.
14 It is appropriate to present the required first-year COE in Exhibits 3-10 through 3-12 in terms of $/MWh-net (in
contrast to the approach adopted for Exhibits 3-4 through 3-9) as the results presented in these exhibits take into
account the financial value that can be provided by the ammonia production aspect of the polygeneration plant.
Additional discussion on this point can be seen following Exhibit 3-12.

U.S. Department of Energy (DOE) National Energy Technology Laboratory (NETL)
Coal-Based Power Plants of the Future: Electricity and Ammonia Polygeneration Concept CONTRACT: 89243319CFE000016
April 13, 2020 Page 24
The first year COE estimate was evaluated over the range from the current ammonia retail cost
($551/ton, representing the “high end” estimate) and the current United States Gulf Coast (USGC)
ammonia contract price ($195/ton, representing the “low end” estimate). The retail price
represents a reasonable upper bound estimate on potential ammonia revenue (i.e., full capture of
the distributed ammonia production advantage), whereas the USGC contract price represents a
current reasonable lower bound estimate, for this stage of evaluation, on the potential ammonia
revenue (i.e., no capture of the distributed ammonia production advantage). An intermediate
choice, such as 75% of the retail price, is a more plausible basis for evaluation. In practice, the
plant would most likely capture a different level of locational advantage based on the geographical
distribution of customers relative to the specific plant siting.
Exhibit 3-11 First Year COE ($/MWh-net) at Five Defined Operating Points for Various Ammonia Price Sensitivities
Balanced
Gen, 3
GT’s
Balanced
Gen, 2
GT’s
Zero
Net
Power
High
Electricity
Production
Max
Electricity
Production
NH3
Revenue
($/ton)
$245 $234 N/A $213 $227 $551 Full Retail Ammonia Price
w/o Distribution Costs
$323 $308 N/A $243 $231 $473 75% of Retail
$401 $383 N/A $272 $234 $276 50% of Retail
$448 $427 N/A $290 $236 $195
Current U.S. Gulf Coast
Delivery; No locational
Advantage
A breakdown of these first year COE’s across previously discussed cost components is presented
in Exhibit 3-12 using the “75% of Retail” price point for ammonia.
Exhibit 3-12 First Year COE ($/MWh-net) Breakdown with Ammonia Price Set at 75% of Retail
First Year COE Component Balanced,
3 GT’s
Balanced,
2 GT’s
Zero Net
Power
High Elec
Prod
Max Elec
Prod
Percentage15
Capital $302 $288 N/A $179 $130 54%
Fixed O&M $120 $114 N/A $71 $52 22%
Variable O&M $53 $50 N/A $31 $23 9%
Feedstock $84 $80 N/A $50 $36 15%
Total (Excluding Ammonia Revenue) $559 $532 N/A $331 $241 N/A
Ammonia Revenue $235 $224 N/A $88 $10 N/A
Total (Including Ammonia Revenue) $323 $308 N/A $243 $231 N/A
Exhibit 3-13 provides an alternative representation on the information contained in Exhibit 3-12.
Rather than including “Ammonia Revenue” as a separate line item, it has been pro-rated and
included as a credit in each of the other cost components. For example, 54% of the $235 “Ammonia
Revenue” in the Balanced, 3 GT’s case was applied as a credit to reduce the First Year COE of the
“Capital” cost component, 22% of the $235 “Ammonia Revenue” was applied as a credit to the
“Fixed O&M” cost component, etc.
15 This represents the percent of each cost component relative to the Total (Excluding Ammonia Revenue). While the
percentage was not exact across all five operating points, the variance fell within the bounds of round-off error (e.g.,
Capital Cost percentages ranged from 54.12% to 54.15%).
U.S. Department of Energy (DOE) National Energy Technology Laboratory (NETL)
Coal-Based Power Plants of the Future: Electricity and Ammonia Polygeneration Concept CONTRACT: 89243319CFE000016
April 13, 2020 Page 25
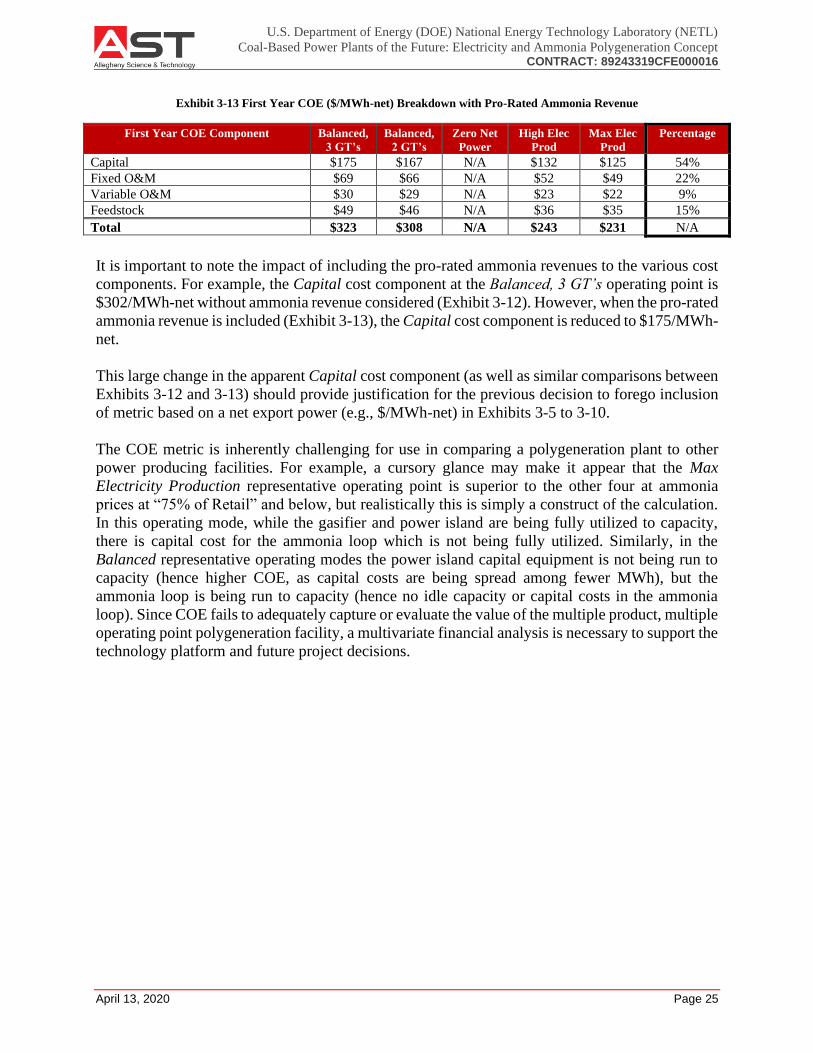
Exhibit 3-13 First Year COE ($/MWh-net) Breakdown with Pro-Rated Ammonia Revenue
First Year COE Component Balanced,
3 GT’s
Balanced,
2 GT’s
Zero Net
Power
High Elec
Prod
Max Elec
Prod
Percentage
Capital $175 $167 N/A $132 $125 54%
Fixed O&M $69 $66 N/A $52 $49 22%
Variable O&M $30 $29 N/A $23 $22 9%
Feedstock $49 $46 N/A $36 $35 15%
Total $323 $308 N/A $243 $231 N/A
It is important to note the impact of including the pro-rated ammonia revenues to the various cost
components. For example, the Capital cost component at the Balanced, 3 GT’s operating point is
$302/MWh-net without ammonia revenue considered (Exhibit 3-12). However, when the pro-rated
ammonia revenue is included (Exhibit 3-13), the Capital cost component is reduced to $175/MWh-
net.
This large change in the apparent Capital cost component (as well as similar comparisons between
Exhibits 3-12 and 3-13) should provide justification for the previous decision to forego inclusion
of metric based on a net export power (e.g., $/MWh-net) in Exhibits 3-5 to 3-10.
The COE metric is inherently challenging for use in comparing a polygeneration plant to other
power producing facilities. For example, a cursory glance may make it appear that the Max
Electricity Production representative operating point is superior to the other four at ammonia
prices at “75% of Retail” and below, but realistically this is simply a construct of the calculation.
In this operating mode, while the gasifier and power island are being fully utilized to capacity,
there is capital cost for the ammonia loop which is not being fully utilized. Similarly, in the
Balanced representative operating modes the power island capital equipment is not being run to
capacity (hence higher COE, as capital costs are being spread among fewer MWh), but the
ammonia loop is being run to capacity (hence no idle capacity or capital costs in the ammonia
loop). Since COE fails to adequately capture or evaluate the value of the multiple product, multiple
operating point polygeneration facility, a multivariate financial analysis is necessary to support the
technology platform and future project decisions.