Embed Size (px)
Citation preview

U.S. Department of Housing and Urban DevelopmentOffice of Policy Development and Research Washington, D.C. 20410
728.1 H688how no. 2
HOW WELLARE WE
HOUSED?2. Femalo-Headed
1 Households•■'I/■'
-■
;
/
U.S. Department of Housing and Urban DevelopmentOffice of Policy Development and Research Washington, D.C. 20410IS
;!
HOW WELL
ARE WE
HOUSED?2. Female- Headed
Households
' !
iJIEMTOF KrjSHGi Wis-'** «
DEPART?
jy.-i 2 0 V/90i
SfflliSYGH, D.C. 20510l fc Ui
ACKNOWLEDGEMENTS
Under contract with HUD, Professor Anthony Yezer of George Washington University did the original research leading to these findings and wrote the report from which this summary was prepared. The data were compiled from the Annual Housing Survey of 1975 and 1976, from The Spirit of Houston, the official report of the First National Women’s Conference, and from Special Labor Reports #206 and #213 published by the Department of Labor’s Bureau of Labor Statistics.
DISCLAIMER
The research findings in this summary are those of the contractor, who is solely responsible for the accuracy and completeness of all information herein. The contents do not necessarily reflect the official views or policies, expressed or implied, of the Department of Housing and Urban Development or the United States Government. ■ ■ ■
IForeword What Is a Female
headed Household?How Well Are We
Housed?Last November, the First National Women’s Conference was held in Houston, Texas. Among the planks in the plan of action presented to the delegates at that time were ones on minority women, on older women, and on statistics. This publication on the housing conditions of households headed by women, which summarizes part of a much larger, more technical study on the housing conditions of various groups of Americans, demonstrates why all three planks were adopted.
I am delighted that HUD and the Office of Policy Development and Research have been able to issue this summary in time to celebrate the first anniversary of the Houston conference. That its findings are not unrelievedly grim is also cause for happiness.
But joy is far from being unconfined. The households of black and Hispanic women have considerably greater chances of being inadequately housed than the total population does. And we estimate that female heads of household, no
matter what their race or ethnic background, must pay inordinate fractions of their incomes for housing adequate to their needs. There is much to consider; much to be done.
I welcome all the readers of this summary to participate actively in the national debate over housing policy in America.
A final note: Ruth Limmer wrote this summary; Katharine C. Lyall, Deputy Assistant Secretary for Economic Affairs, and Duane T. McGough, Director of the Division of Housing and Demographic Analysis, have been centrally involved in the practical development of the series.
The question is more complicated than it seems.
• If a woman identifies herself as head of the household, then the Annual Housing Survey normally considers her household to be femaleheaded.
• If a married woman’s husband is living away from home for any reason, again the household is considered female-headed.
• But if her husband is living under the same roof, then the Annual Housing Survey defines her household as male-headed, even if the wife is identified as the head and even if she is the continuing sole support of the household.
This summary, which is based on data from the Annual Housing Survey, necessarily reflects its operating definition.
A “household” is defined less controversially: it consists of one or more people occupying a housing unit. They may or may not be related. (Group quarters, from convents to boarding houses, are not included.)
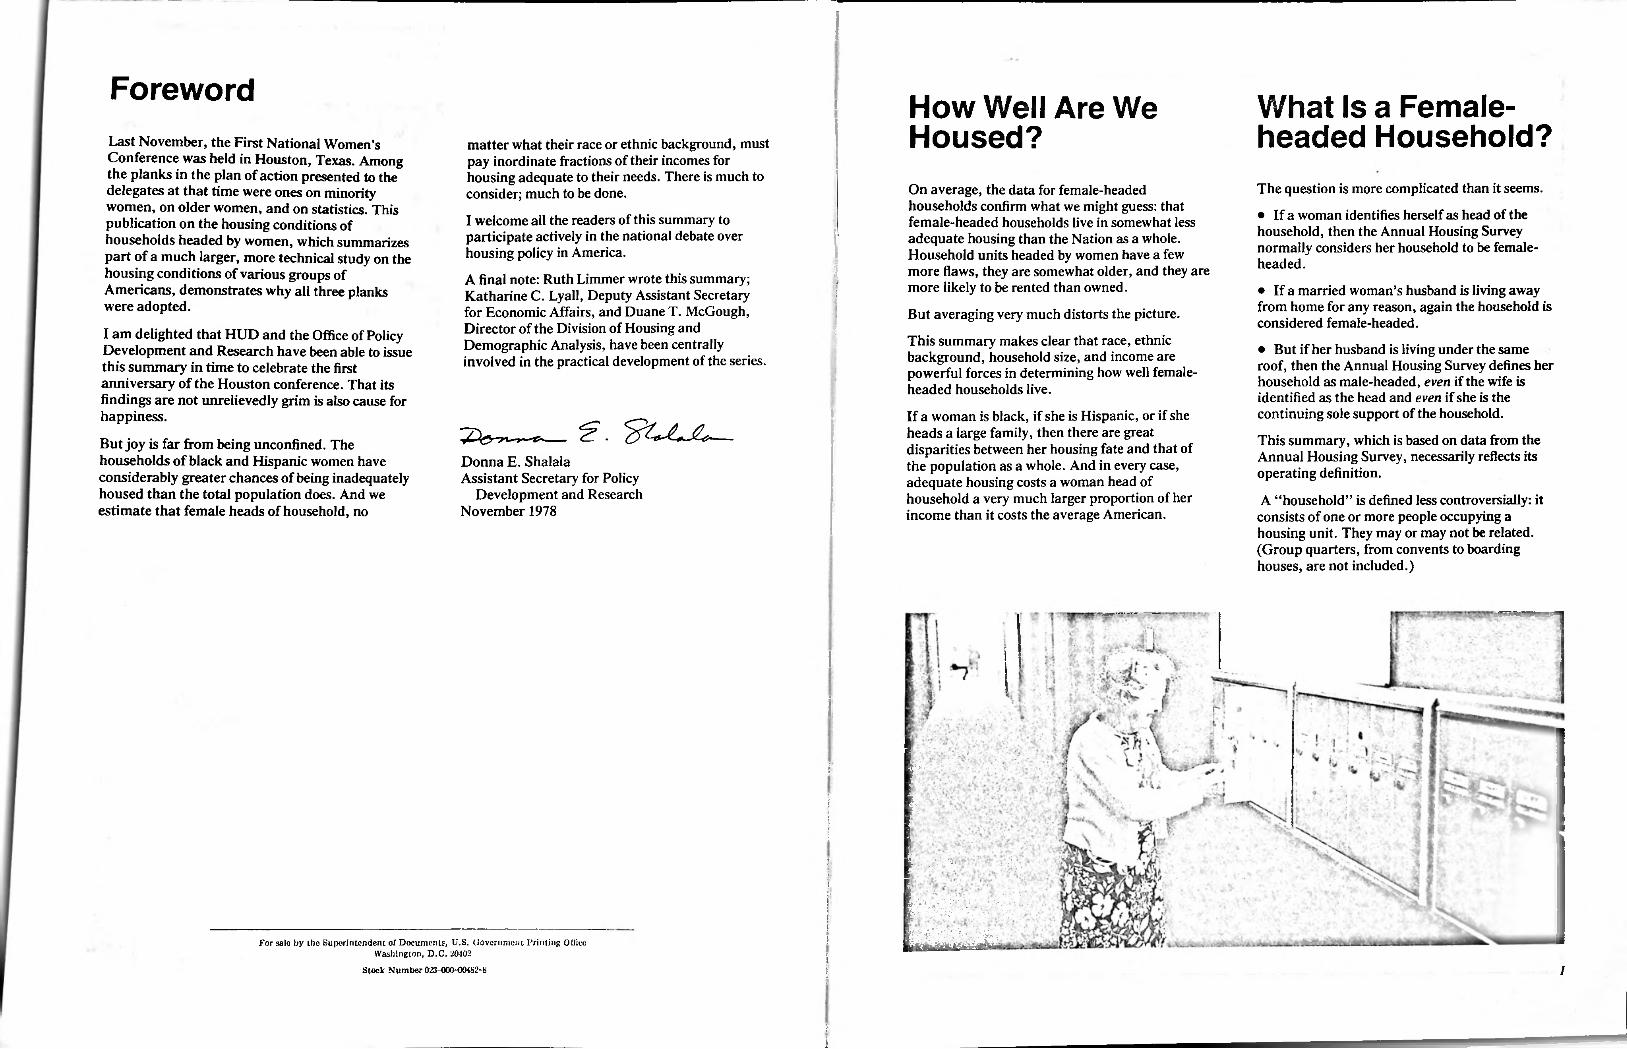
On average, the data for female-headed households confirm what we might guess: that female-headed households live in somewhat less adequate housing than the Nation as a whole. Household units headed by women have a few more flaws, they are somewhat older, and they are more likely to be rented than owned.
But averaging very much distorts the picture.
This summary makes clear that race, ethnic background, household size, and income are powerful forces in determining how well femaleheaded households live.
If a woman is black, if she is Hispanic, or if she heads a large family, then there are great disparities between her housing fate and that of the population as a whole. And in every case, adequate housing costs a woman head of household a very much larger proportion of her income than it costs the average American.
f
i:
IE.Donna E. Shalala Assistant Secretary for Policy
Development and Research November 1978
!
i r
r-:E\ :«|
■
\For sale by the Superintendent of Documents, U.S. Government Printing Ollicc Washington, D.C. 20402
Stock Number 023-000-00482-8 1I
Ii
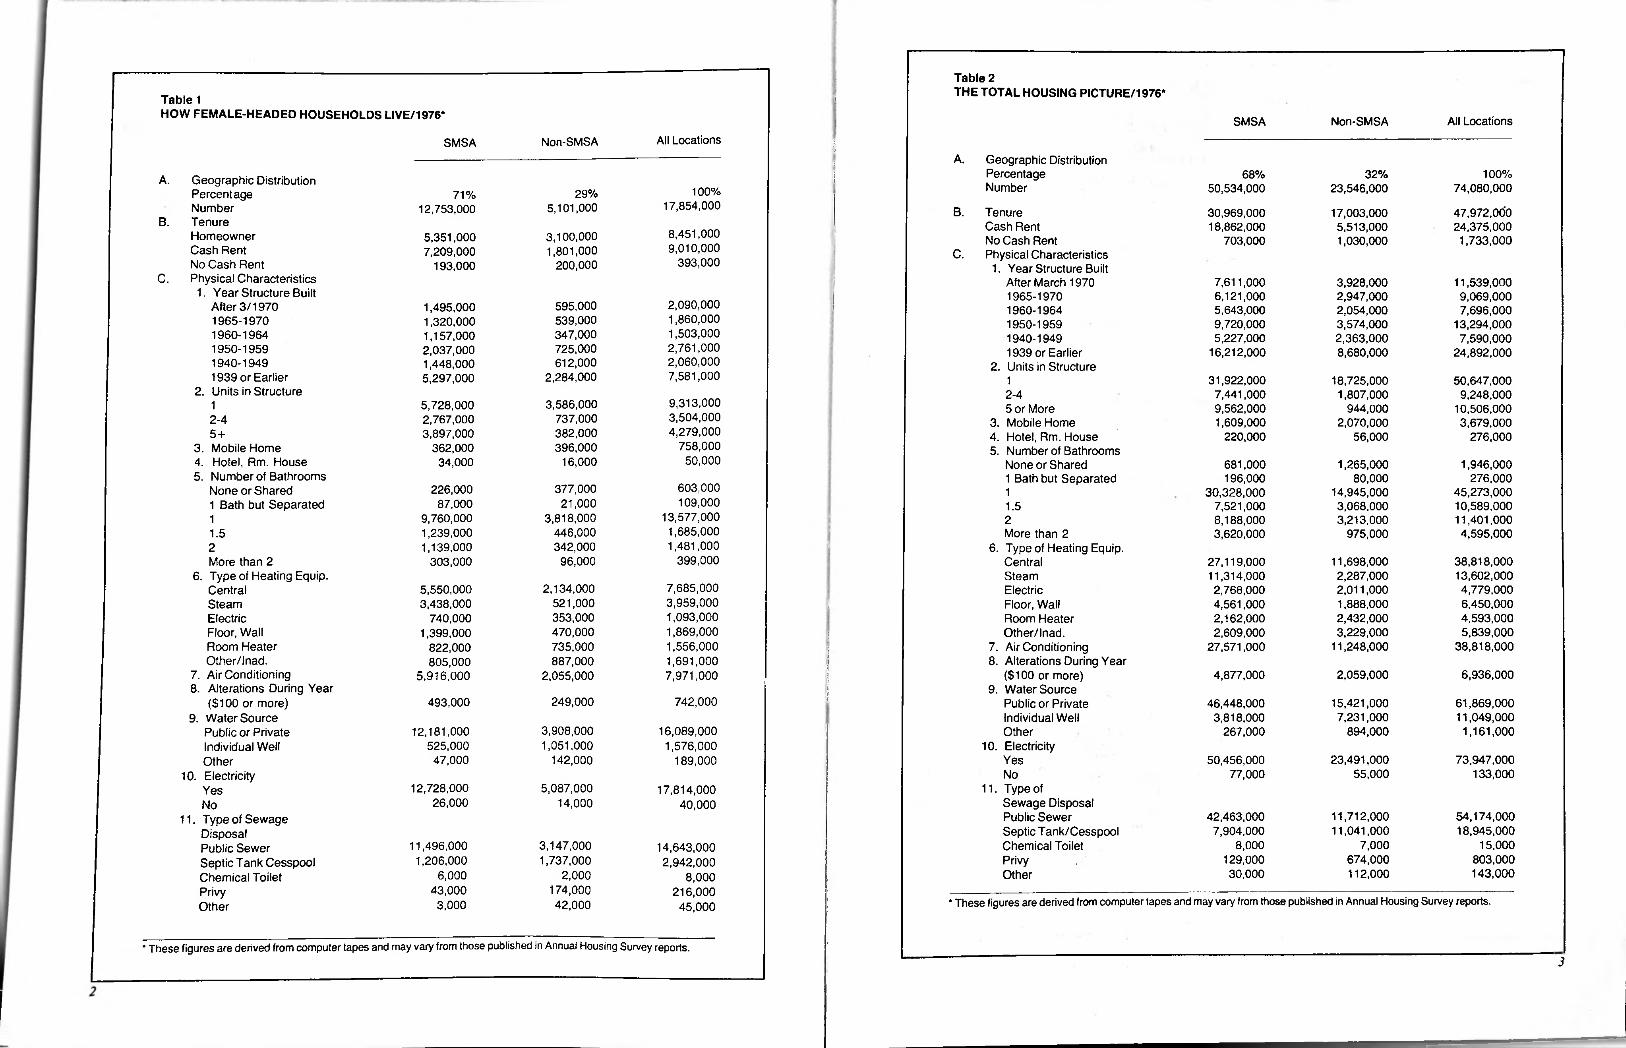
Table 2THE TOTAL HOUSING PICTURE/1976*iTable 1
HOW FEMALE-HEADED HOUSEHOLDS LIVE/1976* All LocationsNon-SMSASMSA
All LocationsNon-SMSASMSA :A. Geographic Distribution
Percentage Number
68% 32% 100%74,080,000
;A. Geographic Distribution Percentage Number
B. Tenure Homeowner Cash Rent No Cash Rent
C. Physical Characteristics1. Year Structure Built
After 3/1970 1965-1970 1960-1964 1950-1959 1940-19491939 or Earlier
2. Units in Structure
23,546,00050,534,000100%17,854,000
29%71%5,101,00012,753,000 47.972.000
24.375.000 1,733,000
B. Tenure Cash Rent No Cash Rent
C. Physical Characteristics1. Year Structure Built
After March 1970 1965-1970 1960-1964 1950-1959 1940-19491939 or Earlier
2. Units in Structure
30.969.00018.862.000
703,000
17,003,0005.513.0001.030.0008.451.000
9.010.000 393,000
3,100,0001,801,000
200,000
5.351.0007.209.000
193,0007.611.0006.121.0005.643.0009.720.0005.227.000
16,212,000
3.928.0002.947.0002.054.0003.574.0002.363.0008.680.000
11.539.0009.069.0007.696.000
13.294.0007.590.000
24.892.000
2.090.0001.860.0001.503.0002.761.0002.060.000 7,581,000
595.000539.000347.000725.000612.000
2,284,000
1.495.0001.320.0001.157.0002.037.0001.448.0005.297.000 31,922,000
7.441.0009.562.0001.609.000
220,000
18,725,0001.807.000
944,0002.070.000
56,000
50.647.0009.248.000
10.506.0003.679.000
276,000
12-49.313.000
3.504.0004.279.000
758,00050,000
3,586,000737.000382.000396.000
16,000
5.728.0002.767.0003.897.000
362,00034,000
1 5 or More3. Mobile Home4. Hotel, Rm. House5. Number of Bathrooms
None or Shared1 Bath but Separated
2-45+
3. Mobile Home4. Hotel, Rm. House5. Number of Bathrooms
None or Shared1 Bath but Separated
1.946.000 276,000
45.273.00010.589.00011.401.0004.595.000
681,000196,000
30,328,0007.521.0008.188.000 3,620,000
1.265.000 80,000
14,945,0003.068.0003.213.000
975,000
603.000109.000
13,577,0001.685.0001.481.000
399.000
377.000 21,000
3,818,000446.000342.000
96,000
226,00087,000
9.760.0001.239.0001.139.000
303,000
11.5
1 2More than 2
6. Type of Heating Equip. CentralSteam Electric Floor, Wall Room Heater Other/lnad.
7. Air Conditioning8. Alterations During Year
($100 or more)9. Water Source
Public or Private Individual Well Other
1.52More than 2
6. Type of Heating Equip. CentralSteam Electric Floor, Wall Room Heater Other/lnad.
7. Air Conditioning8. Alterations During Year
($100 or more)9. Water Source
Public or Private Individual Well Other
27.119.00011.314.0002.768.0004.561.0002.162.000 2,609,000
27.571.000
11.698.0002.287.0002.011.000 1,888,0002.432.0003.229.000
11.248.000
38.818.00013.602.0004.779.0006.450.0004.593.0005.839.000
38.818.000
7.685.0003.959.0001.093.0001.869.0001.556.0001.691.0007.971.000
2.134.000521.000353.000470.000735.000887.000
2.055.000
5.550.0003.438.000
740.0001.399.000
822.000 805,000
5.916.000
;
|
2,059,000 6,936,0004,877,000;
249,000 742,000493,000 15,421,0007,231,000
894,000
61.869.00011.049.000
1,161,000
46,448,0003,818,000
267,0003.908.0001.051.000
142,000
16,089,0001,576,000
189,000
12,181,000525,000
47,00010. Electricity
23,491,00055,000
73,947,000133,000
Yes 50,456,00077,000No10. Electricity
12,728,00026,000
5,087,00014,000
11. Type ofSewage DisposalPublic SewerSeptic Tank/CesspoolChemical ToiletPrivyOther
17,814,00040,000
YesNo
11.712.00011.041.000
7,000674.000112.000
54.174.00018.945.000
15,000803.000143.000
42,463,0007,904,000
8,000129,00030,000
11. Type of Sewage Disposal Public Sewer Septic Tank Cesspool Chemical Toilet Privy Other
3.147.0001.737.000
2,000174,00042,000
11,496,000 1,206,000
6,000 43,000 3,000
14,643,0002,942,000
8,000216,00045,000 * These figures are derived from computer tapes and may vary from those published in Annual Housing Survey reports.
* These figures are derived from computer tapes and may vary from those published in Annual Housing Survey reports.3

1iI
4^^#^ Who the WomenWho Head
Households?4*'**5B8sB5Sr £
ss=^p
:Hispanic 4%
"other" 1% black 17%
:In 1976, 17.8 million women - almost a quarter of all households - were recorded as head of household. Of them, 17 percent were black, 78 percent were white, 4 percent were Hispanic, and 1 percent were “other.”
Of the female heads living alone in 1976, the majority (58 percent) were widows, 13 percent
divorced, 23 percent were single, and 6 percent were married with husbands absent. Of those who headed multiperson households, widows and divorcees were about equal - 32 percent and 31 percent respectively - followed by those who were married but whose husbands were absent, and those who never married.
A significant number of the multiperson households include families for which women have the main economic and social responsibility. In fact, more than 14 percent of all families in the United States are now headed by women, and one- third of them have incomes below the poverty line, although more than half of the women who head families work full- or part-time.
white 78%
A::s r-a
Ft i. •' _ ^were
all U.S. households headed by women
40% 32% 25%headed by -----headed by j----- headed byC£)(3kSWhat Are We
Measuring? all black households all white households all Hispanic households
------13% single----- 32% widowed
23% single6% married but husbands absent 58% widows
Physical Adequacy. The physical adequacy of housing is concerned with the availability of heating and plumbing, with structural soundness, with the availability of sewage-disposal systems, with the maintenance of the living unit, its design, its electrical system, and its kitchen.
Affordability. The measure of affordability in this study is the ability of a family to pay for adequate housing, given the space it needs for its size. It is computed as a ratio between the cost of adequate housing and family cash income.
13% divorced 31% divorced23% married but husbandsabsent
all single-person female-headed households
all multiperson female-headed households
5
What Have We
Learned?;
!■:
Women householders are somewhat more urbanized than the general population - 71 percent live in standard metropolitan statistical areas (SMSAs) as against 68 percent of the total population.They more frequently rent their housing units (53 percent) than does the general population (35 percent). Thus they are more likely than the general population to live in multifamily structures - apartments rather than single dwellings.
Of those who own their own housing units, only 8.8 percent reported spending more than $100 on alterations during 1976. This compares with 14.5 percent of all owners reporting such alterations.
Women householders are also more likely than the general population to live in older units; 55 percent of them vs. 44 percent of the general population live in housing constructed before 1950.
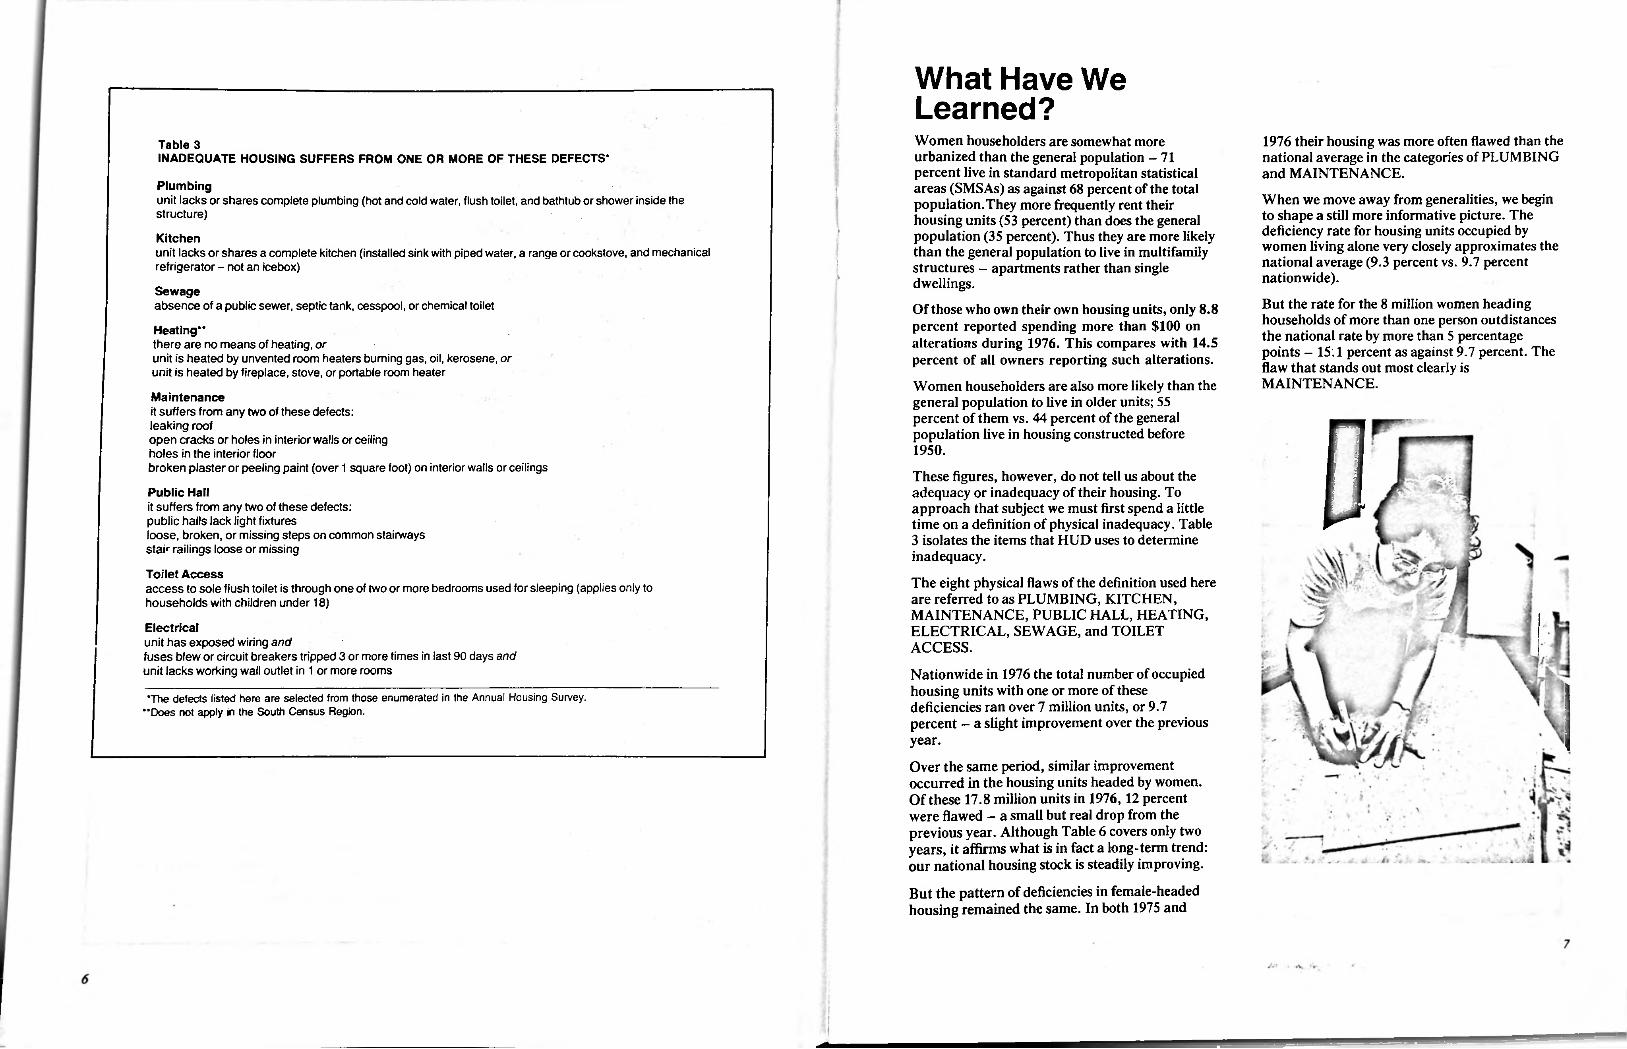
These figures, however, do not tell us about the adequacy or inadequacy of their housing. To approach that subject we must first spend a little time on a definition of physical inadequacy. Table 3 isolates the items that HUD uses to determine inadequacy.
The eight physical flaws of the definition used here are referred to as PLUMBING, KITCHEN, MAINTENANCE, PUBLIC HALL, HEATING, ELECTRICAL, SEWAGE, and TOILET ACCESS.
Nationwide in 1976 the total number of occupied housing units with one or more of these deficiencies ran over 7 million units, or 9.7 percent - a slight improvement over the previous year.
Over the same period, similar improvement occurred in the housing units headed by women. Of these 17.8 million units in 1976, 12 percent were flawed - a small but real drop from the previous year. Although Table 6 covers only two years, it affirms what is in fact a long-term trend: our national housing stock is steadily improving.
But the pattern of deficiencies in female-headed housing remained the same. In both 1975 and
1976 their housing was more often flawed than the national average in the categories of PLUMBING and MAINTENANCE.
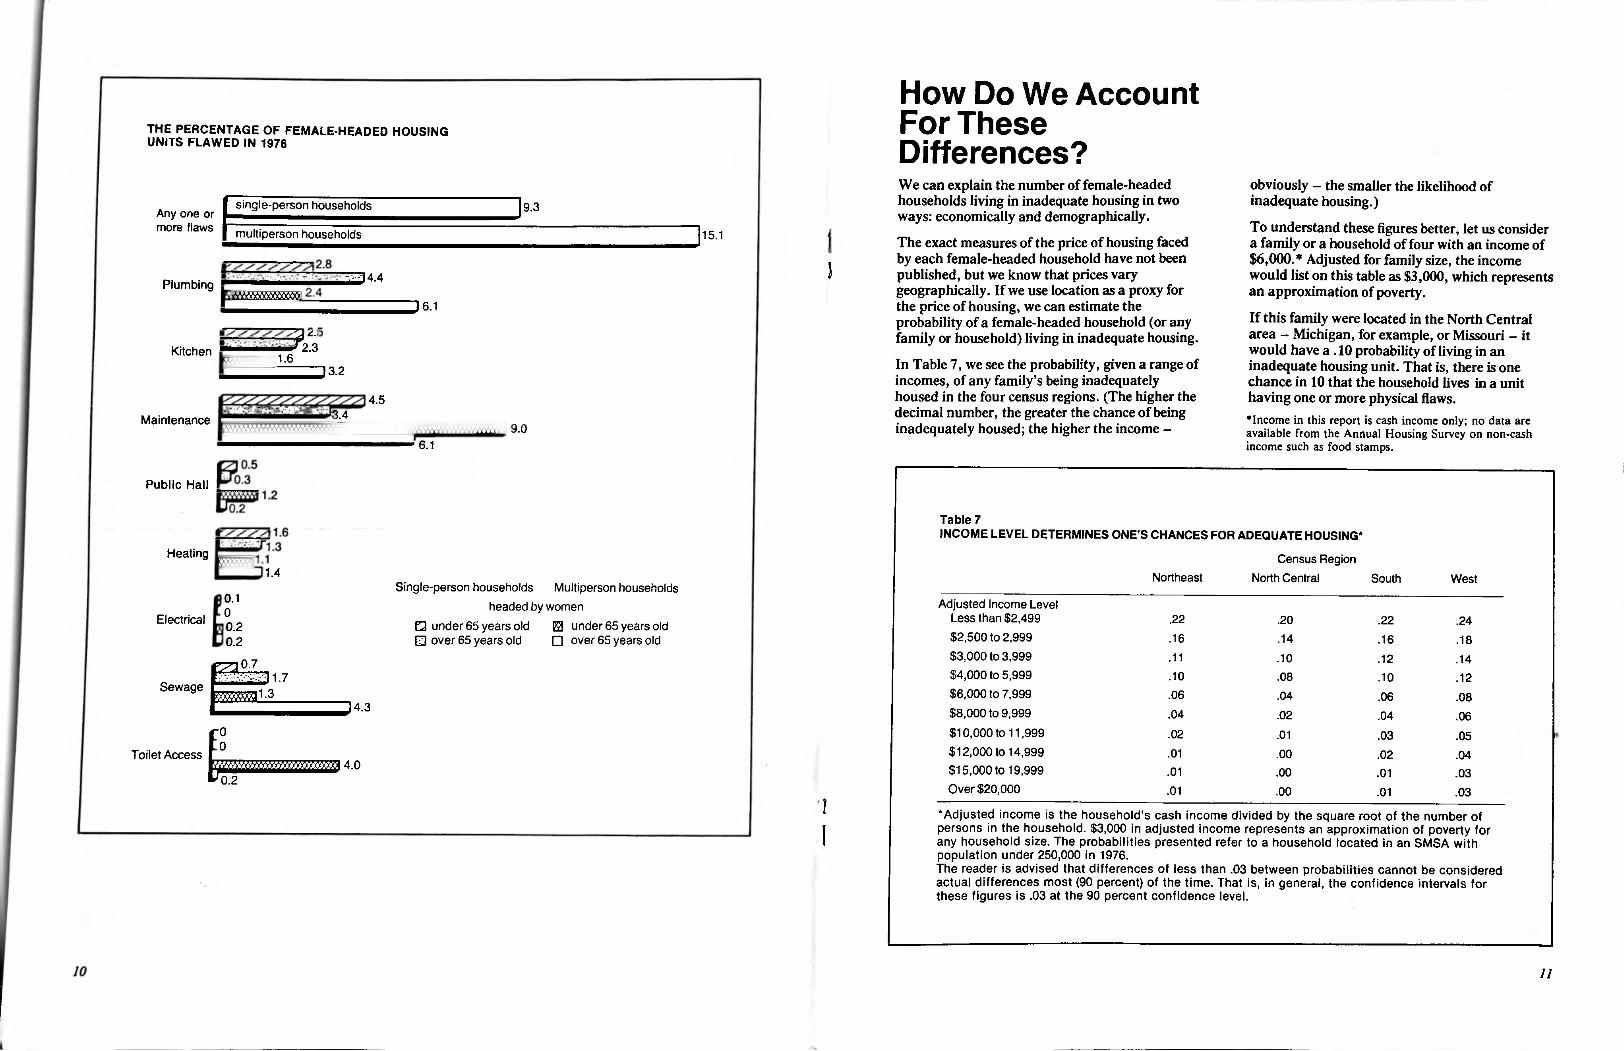
When we move away from generalities, we begin to shape a still more informative picture. The deficiency rate for housing units occupied by women living alone very closely approximates the national average (9.3 percent vs. 9.7 percent nationwide).
But the rate for the 8 million women heading households of more than one person outdistances the national rate by more than 5 percentage points - 15.1 percent as against 9.7 percent. The flaw that stands out most clearly is MAINTENANCE.
Table 3INADEQUATE HOUSING SUFFERS FROM ONE OR MORE OF THESE DEFECTS*
Plumbingunit lacks or shares complete plumbing (hot and cold water, flush toilet, and bathtub or shower inside the structure)
Kitchenunit lacks or shares a complete kitchen (installed sink with piped water, a range or cookstove, and mechanical refrigerator - not an icebox)
Sewageabsence of a public sewer, septic tank, cesspool, or chemical toilet
Heating**there are no means of heating, orunit is heated by unvented room heaters burning gas, oil, kerosene, or unit is heated by fireplace, stove, or portable room heater
Maintenanceit suffers from any two of these defects: leaking roofopen cracks or holes in interior walls or ceiling holes in the interior floorbroken plaster or peeling paint (over 1 square foot) on interior walls or ceilings
Public Hallit suffers from any two of these defects: public halls lack light fixturesloose, broken, or missing steps on common stairways stair railings loose or missing
Toilet Accessaccess to sole flush toilet is through one of two or more bedrooms used for sleeping (applies only to households with children under 18)
Electricalunit has exposed wiring andfuses blew or circuit breakers tripped 3 or more times in last 90 days and unit lacks working wall outlet in 1 or more rooms
i
D'The defects listed here are selected from those enumerated in the Annual Housing Survey.
"Does not apply in the South Census Region.
*
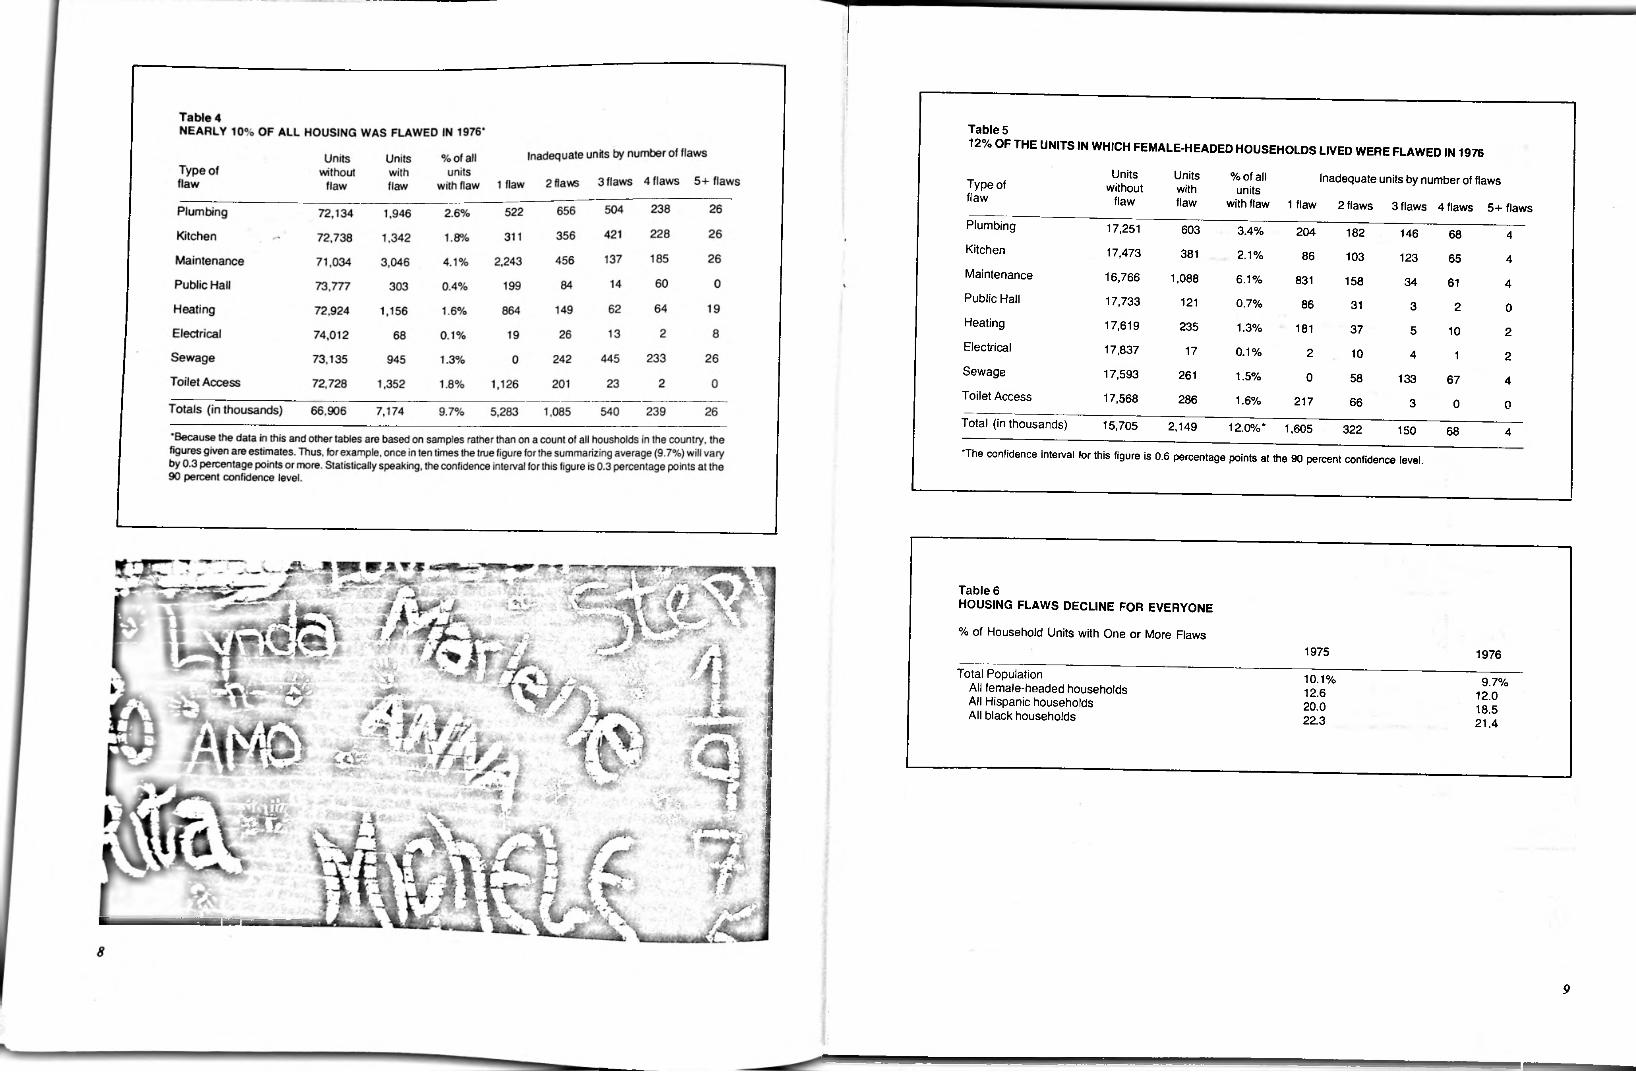
Table 512% OF THE UNITS IN WHICH FEMALE-HEADED HOUSEHOLDS LIVED WERE FLAWED IN 1976
Inadequate units by number of flaws
2 flaws 3 flaws 4 flaws 5+flaws
Unitswithout
flaw
Units % of all units
with flaw 1 flaw
Type of withflaw flaw
Plumbing
Kitchen
Maintenance
17,251 603 3.4% 204 182 146 68 417,473 381 2.1% 86 103 123 65 4
16,766 1,088 6.1% 831 158 34 61 4Public Hall 17,733 121 0.7% 86 31 3 2 0Heating
Electrical
17,619 235 1.3% 181 37 5 10 217,837 17 0.1% 2 10 4 1 2
Sewage
Toilet Access
17,593 261 1.5% 0 58 133 67 417,568 286 1.6% 217 66 3 0 0
Total (in thousands) 15,705 2,149 12.0%* 1,605 322 150 68 4
The confidence interval for this figure is 0.6 percentage points at the 90 percent confidence level.
Table 6HOUSING FLAWS DECLINE FOR EVERYONE
% of Household Units with One or More Flaws
1975 1976
Total Population All female-headed households All Hispanic households All black households
10.1% 9.7%12.6 12.020.0 18.522.3 21.4
9
How Do We Account
For These
Differences?THE PERCENTAGE OF FEMALE-HEADED HOUSING UNITS FLAWED IN 1976
We can explain the number of female-headed households living in inadequate housing in two ways: economically and demographically.
The exact measures of the price of housing faced by each female-headed household have not been published, but we know that prices vary geographically. If we use location as a proxy for the price of housing, we can estimate the probability of a female-headed household (or any family or household) living in inadequate housing.
In Table 7, we see the probability, given a range of incomes, of any family’s being inadequately housed in the four census regions. (The higher the decimal number, the greater the chance of being inadequately housed; the higher the income -
obviously - the smaller the likelihood of inadequate housing.)
To understand these figures better, let us consider a family or a household of four with an income of $6,000.* Adjusted for family size, the income would list on this table as $3,000, which represents an approximation of poverty.
If this family were located in the North Central area - Michigan, for example, or Missouri - it would have a . 10 probability of living in an inadequate housing unit. That is, there is one chance in 10 that the household lives in a unit having one or more physical flaws.♦Income in this report is cash income only; no data are available from the Annual Housing Survey on non-cash income such as food stamps.
single-person households 9.3Any one or more flaws multiperson households 15.1
l234.4Plumbing
] 6.1
¥*2.3Kitchen 1.6rmtft.ff.t.f.* IJ 3.2
Maintenance9.0
6.1
Public Hall
Table 7INCOME LEVEL DETERMINES ONE’S CHANCES FOR ADEQUATE HOUSING*
Heating Census Region North Central1.4 Northeast South West
Single-person households Multiperson households headed by women
□ under 65 years old 0 under 65 years old□ over 65 years old □ over 65 years old
0.1 Adjusted Income Level Less than $2,499$2,500 to 2,999 $3,000 to 3,999 $4,000 to 5,999 $6,000 to 7,999 $8,000 to 9,999 $10,000 to 11,999 $12,000 to 14,999 $15,000 to 19,999 Over $20,000
0Electrical .22 .20 .22 .240.2.16 .14 .16 .180.2.11 .10 .12 .14pa0-7
r/XwvV/,11 -3.10 .08 .10S31.7 .12
Sewage .06 .04 .06 .08) 4.3 .04 .02 .04 .06
F 4.0Po2
.02 .01 .03 .05
.01 .00Toilet Access .02 .04
.01 .00 .01 .03
.01 .00 .01 .03I ‘Adjusted income is the household’s cash income divided by the square root of the number of
persons in the household. $3,000 in adjusted income represents an approximation of poverty for any household size. The probabilities presented refer to a household located in an SMSA with population under 250,000 in 1976.The reader is advised that differences of less than .03 between probabilities cannot be considered actual differences most (90 percent) of the time. That is, in general, the confidence intervals for these figures is .03 at the 90 percent confidence level.
I
11
household is precisely the same. But the low- income female head of household will fare less well than the total low-income population• if she is Hispanic• if she is black• if she is the head of a large family.
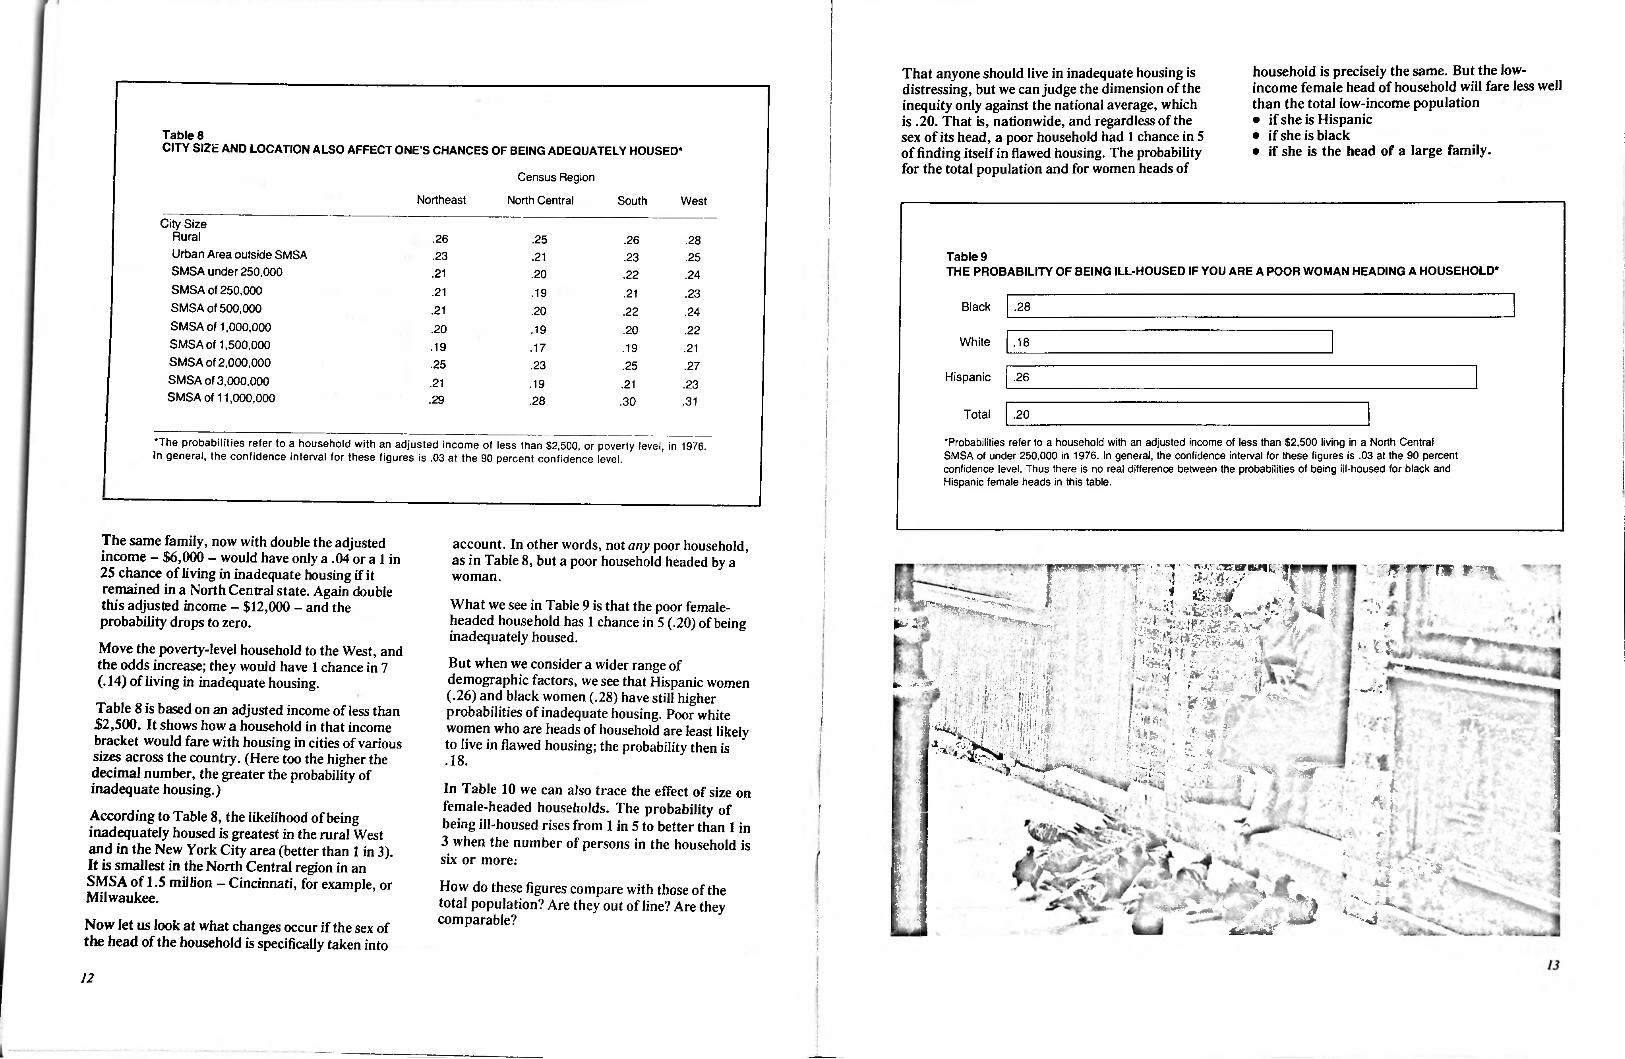
That anyone should live in inadequate housing is distressing, but we can judge the dimension of the inequity only against the national average, which is .20. That is, nationwide, and regardless of the sex of its head, a poor household had 1 chance in 5 of finding itself in flawed housing. The probability for the total population and for women heads of
Table 8CITY SIZE AND LOCATION ALSO AFFECT ONE’S CHANCES OF BEING ADEQUATELY HOUSED*
Census Region
North CentralNortheast South West
City Size RuralUrban Area outside SMSA SMSA under 250,000 SMSA of 250.000 SMSA of 500,000 SMSA of 1,000,000 SMSA of 1,500,000 SMSA of 2,000,000 SMSA of 3,000,000 SMSA of 11,000,000
.26 .25 .26 .28
.23 Table 9THE PROBABILITY OF BEING ILL-HOUSED IF YOU ARE A POOR WOMAN HEADING A HOUSEHOLD*
.21 .23 .25.21 .20 .22 .24
’
.21 .19 .21 .23Black .28.21 .20 .22 .24
I.20 .19 .20 .22White .18.19 .17 .19 .21
.25 .23 .25 .27Hispanic .26.21 .19 .21 .23 ■
.29 .28 .31.30Total .20
•Probabilities refer to a household with an adjusted income of less than $2,500 living in a North Central SMSA of under 250,000 in 1976. In general, the confidence interval for these figures is .03 at the 90 percent confidence level. Thus there is no real difference between the probabilities of being ill-housed for black and Hispanic female heads in this table.
•The probabilities refer to a household with an adjusted income of less than $2,500, or poverty level, in 1976. In general, the confidence interval for these figures is .03 at the 90 percent confidence level. i
■'
The same family, now with double the adjusted income — $6,000 — would have only a .04 or a 1 in 25 chance of living in inadequate housing if it remained in a North Central state. Again double this adjusted income - $12,000 - and the probability drops to zero.
Move the poverty-level household to the West, and the odds increase; they would have 1 chance in 7 (.14) of living in inadequate housing.
Table 8 is based on an adjusted income of less than $2,500. It shows how a household in that income bracket would fare with housing in cities of various sizes across the country. (Here too the higher the decimal number, the greater the probability of inadequate housing.)
According to Table 8, the likelihood of being inadequately housed is greatest in the rural West and in the New York City area (better than 1 in 3). It is smallest in the North Central region in SMSA of 1.5 million - Cincinnati, for example, or Milwaukee.
Now let us look at what changes occur if the sex of the head of the household is specifically taken into
account. In other words, not any poor household, as in Table 8, but a poor household headed by a woman.
g
F^-i.
if >• /
What we see in Table 9 is that the poor femaleheaded household has 1 chance in 5 (.20) of being inadequately housed.
Vi • *.
•V U-■e. v vBut when we consider a wider range of demographic factors, we see that Hispanic (.26) and black women (.28) have still higher probabilities of inadequate housing. Poor white women who are heads of household are least likely to live in flawed housing; the probability then is
SfifflS KSf! 1 h I■ ■<:. /women • V
: £3/A
i Vi :Ni ^v’vVV/
... ...vvSBr -4" - -
I;
.18.t * iIn Table 10 we can also trace the effect of size on
female-headed households. The probability of being ill-housed rises from 1 in 5 to better than 1 in 3 when the number of persons in the household is six or more;
How do these figures compare with those of the total population? Are they out of line? Are they comparable?
■ mi
Ian!
J: AA.'.■'■
• *3 ^ WIi
:12 ‘
r!
■
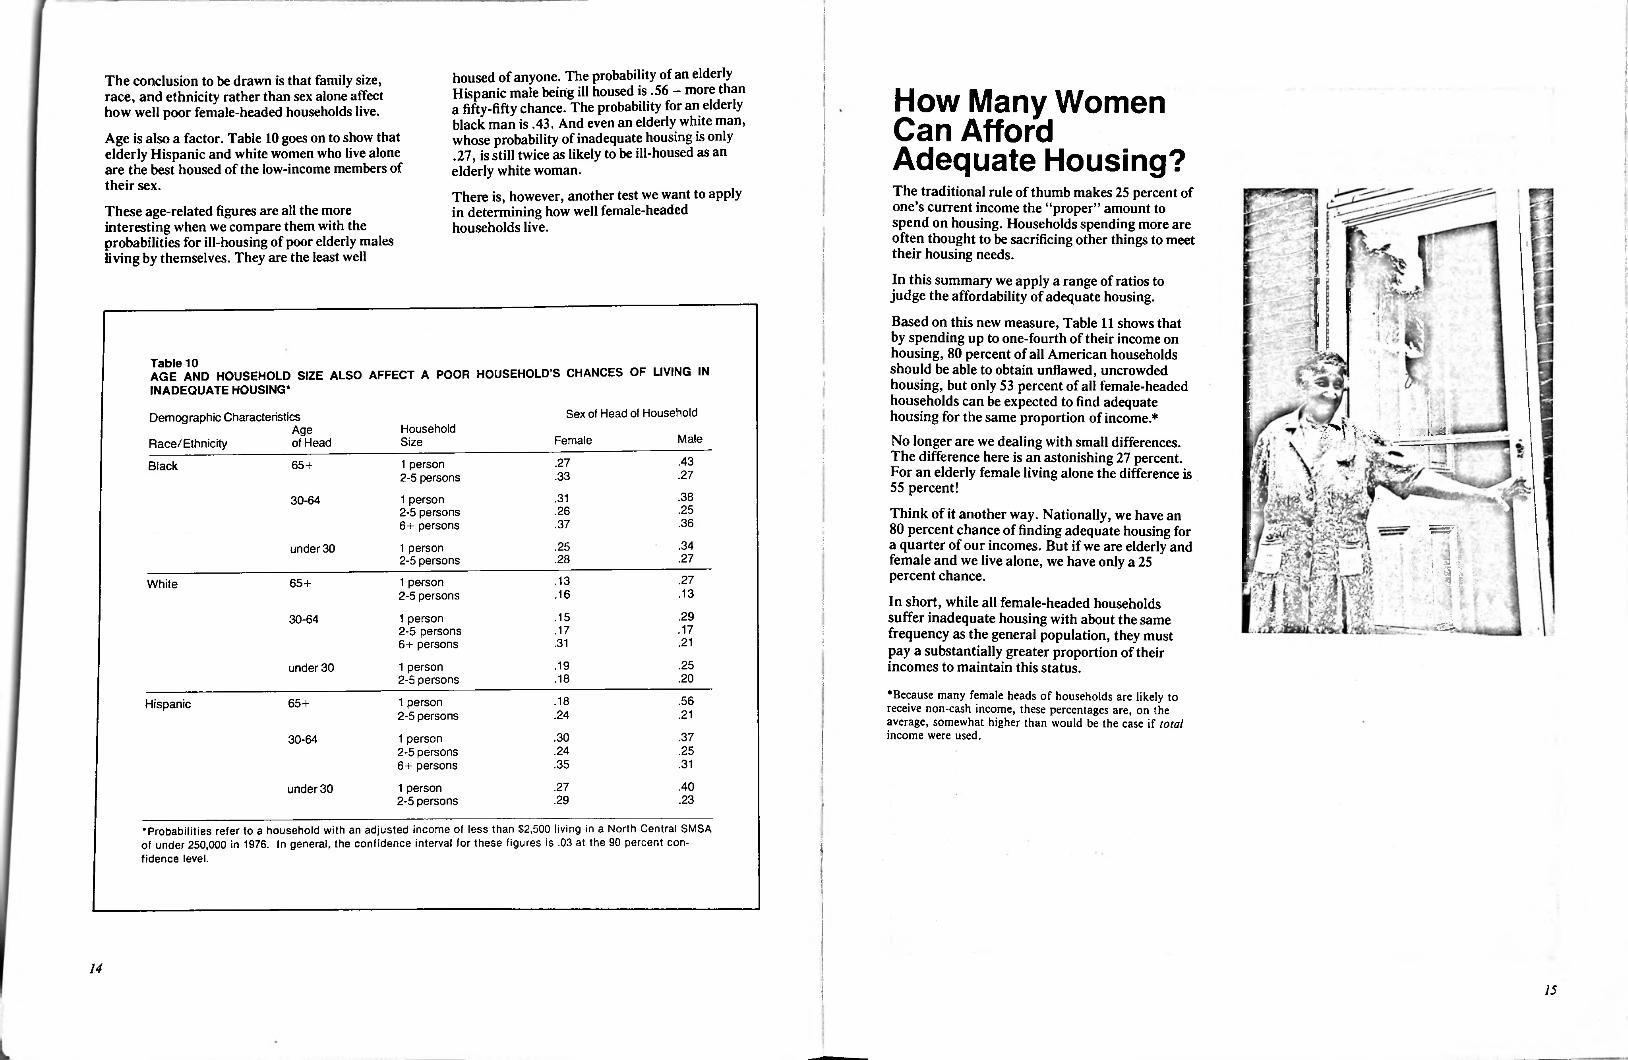
!.housed of anyone. The probability of an elderly Hispanic male being ill housed is .56 - more than
fifty-fifty chance. The probability for an elderly black man is .43. And even an elderly white man, whose probability of inadequate housing is only .27, is still twice as likely to be ill-housed as an elderly white woman.There is, however, another test we want to apply in determining how well female-headed households live.
The conclusion to be drawn is that family size, race, and ethnicity rather than sex alone affect how well poor female-headed households live.
Age is also a factor. Table 10 goes on to show that elderly Hispanic and white women who live alone are the best housed of the low-income members of their sex.
These age-related figures are all the more interesting when we compare them with the probabilities for ill-housing of poor elderly males living by themselves. They are the least well
How Many Women
Can Afford
Adequate Housing?
1a
:
!I I
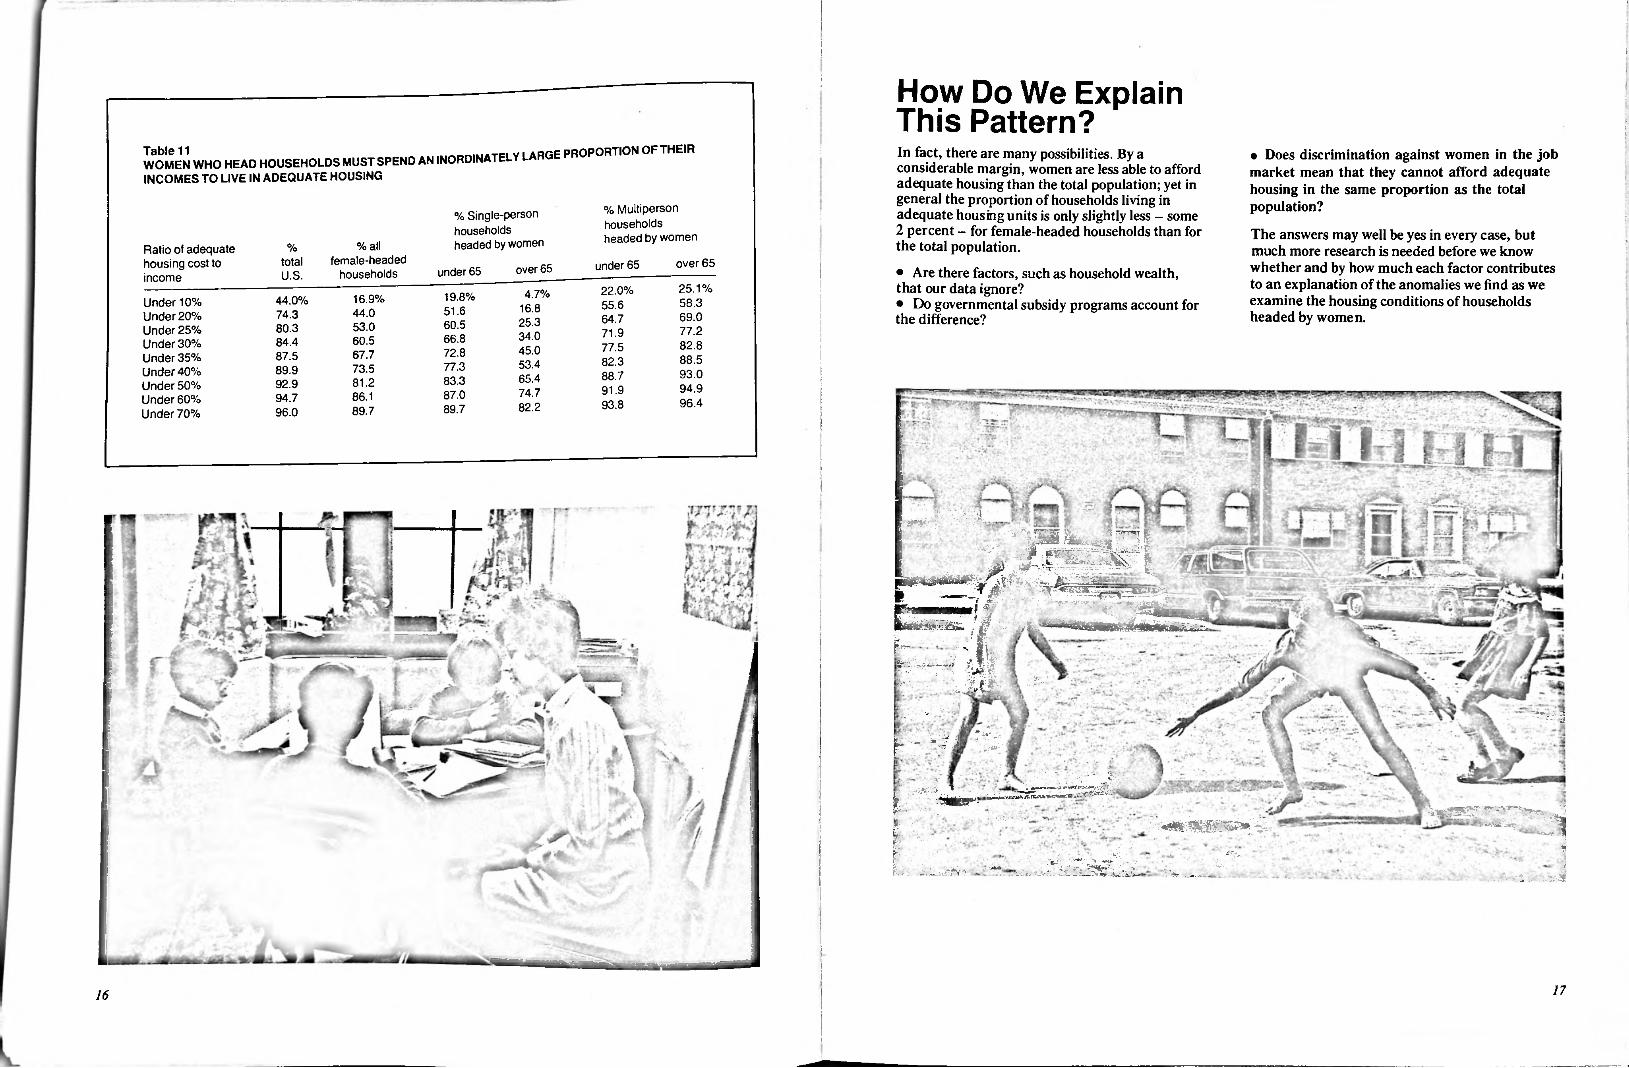
The traditional rule of thumb makes 25 percent of one’s current income the “proper” amount to spend on housing. Households spending more are often thought to be sacrificing other things to meet their housing needs.
In this summary we apply a range of ratios to judge the affordability of adequate housing.
Based on this new measure, Table 11 shows that by spending up to one-fourth of their income on housing, 80 percent of all American households should be able to obtain unflawed, uncrowded housing, but only 53 percent of all female-headed households can be expected to find adequate housing for the same proportion of income*No longer are we dealing with small differences. The difference here is an astonishing 27 percent. For an elderly female living alone the difference is 55 percent!
Think of it another way. Nationally, we have an 80 percent chance of finding adequate housing for a quarter of our incomes. But if we are elderly and female and we live alone, we have only a 25 percent chance.
In short, while all female-headed households suffer inadequate housing with about the same frequency as the general population, they must pay a substantially greater proportion of their incomes to maintain this status.
♦Because many female heads of households are likely to receive non-cash income, these percentages are, on the average, somewhat higher than would be the case if total income were used.
r[ :,
:.i
1I
*>pg
Table 10AGE AND HOUSEHOLD SIZE ALSO AFFECT A POOR HOUSEHOLD’S CHANCES OF LIVING IN INADEQUATE HOUSING*
:;
lSex of Head of HouseholdDemographic Characteristics
Race/Ethnicity1Household
SizeAge
MaleFemaleof HeadI.43.271 person
2-5 persons
1 person 2-5 persons 6+ persons
1 person 2-5 persons
65+Black,.27.33...38.3130-64
.25.26
.36.37 :|
gssr.34.25under 30.27.28 l ’' :.27.131 person
2-5 persons
1 person 2-5 persons 6+ persons
1 person 2-5 persons
65+White !.13.16 :.29.1530-64.17.17 ;.21 S.31
.25.19under 30
.20.18 !
.56.181 person 2-5 persons
1 person 2-5 persons 6+ persons
1 person 2-5 persons
65+Hispanic.24 .21
.37.3030-64
.25.24
.31.35!.40.27under 30
.23.29
•Probabilities refer to a household with an adjusted income of less than $2,500 living in a North Central SMSA of under 250,000 in 1976. In general, the confidence interval for these figures is .03 at the 90 percent confidence level.
1415
■
f
:i!
How Do We Explain
This Pattern?:
;;'
■
WOMEN WHO HEAD HOUSEHOLDS MUST SPEND AN INORDINATELY LARGE PROPORTION OF THEIR
INCOMES TO LIVE IN ADEQUATE HOUSING
In fact, there are many possibilities. By a considerable margin, women are less able to afford adequate housing than the total population; yet in general the proportion of households living in adequate housing units is only slightly less - some 2 percent - for female-headed households than for the total population.
• Are there factors, such as household wealth, that our data ignore?• Do governmental subsidy programs account for the difference?
i • Does discrimination against women in the job market mean that they cannot afford adequate housing in the same proportion as the total population?
The answers may well be yes in every case, but much more research is needed before we know whether and by how much each factor contributes to an explanation of the anomalies we find as we examine the housing conditions of households headed by women.
i
!\% Multiperson
households headed by women
% Single-person households headed by women% all
female-headedhouseholds
%Ratio of adequate housing cost to income
itotal over 65under 65over 65under 65U.S. !25.1%22.0%4.7%19.8%16.9%44.0%Under 10%
Under 20% Under 25% Under 30% Under 35% Under 40% Under 50% Under 60% Under 70%
58.355.616.851.644.074.3 69.064.725.360.553.080.3 77.271.934.066.860.584.4 82.877.545.072.867.787.5 88.582.353.477.373.589.9 93.088.765.483.381.292.9 94.991.974.787.086.194.7 96.493.882.289.789.796.0
v
:
■
,m :Jis§|||f
/ ■. — • -
t̂ &
p———f yif
F~ •• I,• - ;fl
l«r. i
.•v
• ..
V-'i i•••''» j*
1..... ,
• . 3w- ....
: ............. u\ - -• ,: • •._ -JSSLaw :*.£*
I '"4k.•;...- .*• ........ . *. ... s
1716
—j
r! ;;
i: !
For the Record, 1978 : I* ■
To afford adequate housing, we estimate that rly half of all female heads of household must
spend one-fourth or more of their cash incomes on it. Less than 20 percent of all households need do the same.• If they are living alone,- almost 40 percent of women under sixty-five, and- almost 75 percent of women over sixty-five must spend a quarter or more of their income to afford housing adequate to their needs.• If they head a multiperson household,- slightly over 35 percent of women under sixty-five, and-31 percent of women over sixty-five must spend a quarter or more of their income to afford housing adequate to their needs.
Female-headed households are somewhat less well housed than the general population.• they live in older housing• their housing suffers more frequently than the national average from MAINTENANCE and PLUMBING flaws.
The probability of a female-headed household living in inadequate housing depends on:• income• household size (the larger the household, the less chance of adequate housing)• race• ethnicity
:! i .nea i I
f ; :*
L'iu;
IsI
!'j;!
■
:
:i••I:i .
!'
:
!:;: .
t
1:;i
1;
;
U.S. GOVERNMENT PRINTING OFFICE : 1978 O—278-882!
i. i
.....~ r::ji-vv
V-
•• •: • •'•W,'- I • ' V' '.* '' ’
V ' • . •' HUD LIBRARY:
•- W.', ,v;; ►
• , V-’.- : •i •: " t {,' . >•: :• -
;.v V- i
T 23512
- . % .S •'
I
]
■ - - ■---- ' ■>: ' Of H . ■.
Mi 2 0 mLfOilfiRY
i^SHinGTOIi, C n " ' A

IHUD Library f >C >*(/»
CrtO-
isg3?>
; s 02? i S3 .z°53 b™*
ii?«mo °Zc
h<5
00004949
5.m«*i
Zo
o
n >3 ISf " z2
00H6 135
«■ n c> mi& iisis>December 1978
HUD-PDR-344