Embed Size (px)
Citation preview

U.S. Department of the Interior U.S. Geological Survey
Prepared in cooperation withMASSACHUSETTS DEPARTMENT OF ENVIRONMENTAL MANAGEMENT,OFFICE OF WATER RESOURCES and theMASSACHUSETTS DEPARTMENT OF ENVIRONMENTAL PROTECTION,OFFICE OF WATERSHED MANAGEMENT
Relations Between Discharge and Wetted Perimeter and Other Hydraulic-Geometry Characteristics at Selected Streamflow-Gaging Stations in MassachusettsWater-Resources Investigations Report 98-4094
usesscience for a changing world


U.S. Department of the Interior U.S. Geological Survey
Relations Between Discharge and Wetted Perimeter and Other Hydraulic-Geometry Characteristics at Selected Streamflow-Gaging Stations in Massachusetts
By PHILIP C. MACKEY, The Environmental Careers Organization; and PAUL M. BARLOW and KERNELL G. RIES, III, U.S. Geological Survey
Water-Resources Investigations Report 98-4094
Prepared in cooperation withMASSACHUSETTS DEPARTMENT OF ENVIRONMENTAL MANAGEMENT,OFFICE OF WATER RESOURCES and theMASSACHUSETTS DEPARTMENT OF ENVIRONMENTAL PROTECTION,OFFICE OF WATERSHED MANAGEMENT
Marlborough, Massachusetts 1998

U.S. DEPARTMENT OF THE INTERIOR
BRUCE BABBITT, Secretary
U.S. GEOLOGICAL SURVEY Thomas J. Casadevall, Acting Director
The use of trade names in this report is for identification purposes only and does not constitute endorsement by the U.S. Geological Survey.
For additional information write to:
Chief, Massachusetts-Rhode Island District U.S. Geological Survey Water Resources Division 28 Lord Road, Suite 280 Marlborough, MA 01752
Copies of this report can be purchased from:
U. S. Geological Survey Branch of Information Services Box 25286, Federal Center Denver, Colorado 80225-0286

CONTENTSAbstract................................................................................................................................................................................. 1Intnxiuction...........................................................................................................^ 2
Purpose and Scope ...................................................................................................................................................... 3Physical Setting.................................................................................................^^ 3
Methods of Investigation....................................................................................................................................................... 5Analysis of Relations Between Discharge and Wetted Perimeter and Other Hydraulic-Geometry Characteristics............. 10
Correlations Among Discharge, Wetted Perimeter, and Channel Top Width.............................................................. 10Regression Models...................................................................................................................................................... 10Point of Maximum Curvature for the Discharge and Wetted-Perimeter Relations..................................................... 15Limitations of Analysis............................................................................................................................................... 15
Summary and Conclusions............................................................^ 16References Cited................................................................................................................................................................... 18
FIGURES
1. Schematic diagram showing (A) hypothetical stream channel cross-section and (B) graph of relation betweendischarge and wetted perimeter.................................................................................................................................. 2
2. Map showing locations of sites used in the analysis of discharge, wetted perimeter, and other hydraulic- geometry characteristics and the 27 major river basins in Massachusetts.................................................................. 4
3. Graphs relating wetted perimeter and curvature to discharge for Squannacook River near West Groton,Massachusetts........................................................ 9
4-27. Graphs showing discharge, wetted perimeter, and flow duration for:4. Squannacook River near West Groton, Mass..................................................................................................... 215. Assabet River at Maynard, Mass....................................................................................................................... 226. Nashoba Brook near Acton, Mass..................................................................................................................... 237. Parker River at Byfield, Mass............................................................................................................................ 248. Charles River at Dover, Mass............................................................................................................................ 259. Old Swamp River near South Weymouth, Mass................................................................................................ 26
10. Indian Head River at Hanover, Mass................................................................................................................. 2711. Quashnet River at Waquoit Village, Mass......................................................................................................... 2812. Wading River near Norton, Mass....................................................................................................................... 2913. Ten Mile River at Pawtucket Ave. at East Providence, R.I................................................................................ 3014. West River below West Hill Dam near Uxbridge, Mass.................................................................................... 3115. Nipmuc River near Harrisville, R.I.................................................................................................................... 3216. Priest Brook near Winchendon, Mass................................................................................................................ 3317. Whetstone Brook at Depot Road at Wendell Depot, Mass................................................................................ 3418. South River near Conway, Mass........................................................................................................................ 3519. Green River near Colrain, Mass........................................................................................................................ 3620. Mill River at Northampton, Mass...................................................................................................................... 3721. Sevenmile River near Spencer, Mass................................................................................................................. 3822. Quaboag River at West Brimfield, Mass............................................................................................................ 3923. Middle Branch Westfield River at Goss Heights, Mass..................................................................................... 4024. East Branch Housatonic River at Coltsville, Mass............................................................................................ 4125. Housatonic River near Great Barrington, Mass................................................................................................. 4226. North Branch Hoosic River at North Adams, Mass........................................................................................... 4327. Green River at Williamstown, Mass.................................................................................................................. 44
Contents III

TABLES
1. Description of selected streamflow-gaging stations in Massachusetts................................................................... 62. Drainage-area characteristics and summary statistics for period of study for selected streamflow-gaging
stations in Massachusetts........................................................................................................................................ 113. Parameters calculated for power-function relations by regression analysis for selected streamflow-gaging
stations in Massachusetts........................................................................................................................................ 124. Discharge and wetted-perimeter values at the point of maximum curvature and at the 95-percent confidence
intervals for discharge and wetted perimeter power-function relations for selected streamflow-gaging , stations in Massachusetts........................................................................................................................................ 14
CONVERSION FACTORS AND VERTICAL DATUM
CONVERSION FACTORS
_____________________Multiply By To obtain_______________'
cubic foot per second (ft3/s) 0.02832 cubic meter per second cubic foot per second per square mile [(ft3/s)/mi2] 0.01093 cubic meter per second per square kilometer
foot (ft) 0.3048 meter foot per second (ft/s) 0.3048 meter per second
inch (in.) 25.4 millimeter square mile (mi2) 2.590 square kilometer
Temperature in degrees Fahrenheit (°F) can be converted to degrees Celsius (°C) ____________________as follows: °C = 5/9 (°F-32).____________________
VERTICAL DATUM
Sea Level: In this report, "sea level" refers to the National Geodetic Vertical Datum of 1929 (NGVD of 1929) a geodetic datum derived from a general adjustment of the first-order level nets of the United States and Canada, formerly called Sea Level Datum of 1929.
IV Contents

Relations Between Discharge and Wetted Perimeter and Other Hydraulic-Geometry Characteristics at Selected Streamflow-Gaging Stations in MassachusettsBy Philip C. Mackey, Paul M. Barlow, and Kernel! G. Ries III
Abstract
Relations between discharge and wetted perimeter and other hydraulic-geometry characteristics (channel top width, channel depth, and flow velocity) were developed from streamflow and stream-channel data collected at 24 U.S. Geological Survey streamflow-gaging stations in Massachusetts. In addition, the applicability of the use of the wetted- perimeter threshold method, which is based on the relation between discharge and wetted perimeter at a streamflow-measurement site, to the determination of instream-flow requirements for Massachusetts streams was evaluated. The 24 stations selected for analysis are distributed fairly uniformly throughout Massachusetts and have drainage areas that range from less than 5 to nearly 300 square miles.
Power-function regression models (equations) of the form Y = c\ Q 2 (where the dependent variable y is wetted perimeter, channel top width, channel depth, or flow velocity; Q is discharge; and Cj and c2 are coefficients) were used to define relations between discharge and hydraulic-geometry characteristics. The regression models between discharge and wetted perimeter were similar to those between discharge and channel top width because wetted perimeter and channel top width were highly correlated at each station. Mean values of the exponents (c2 ) for the 24 stations were 0.16 for wetted perimeter and channel top width, 0.30 for channel depth, and 0.55 for flow velocity. These results indicate that at the individual stream sections used in this study, wetted perimeter and channel top width tend to change very little with discharge, channel depth changes moderately with discharge, and flow velocity changes
most substantially with discharge. The goodness of fit of the discharge and wetted perimeter regression models, as measured by the adjusted coefficient of determination (R2adj)> tends to be low; values of R^adj range from 0.05 to 0.73, with a mean of 0.48 for all 24 models.
Graphs of wetted perimeter as a function of discharge generally show a transition from steep slopes at very low discharges to more gentle, gradual slopes at low to moderate discharges, which is consistent with results of previous investigations. The transition from a steep slope to a gradual slope at higher discharges is identified by a single pair of discharge and wetted- perimeter values at a point that is referred to as the point of maximum curvature. An analytical method used to determine the point of maximum curvature for each of the discharge and wetted-perimeter relations indicated that at 16 of the 24 gaging stations, the point of maximum curvature is at the discharge that is equaled or exceeded 99 percent of the time or greater for the period of record, and all of the points of maximum curvature are at discharges that are equaled or exceeded 88 percent of the time or greater. Although all of the calculated points of maximum curvature are in the region of lowest discharges, the range of exceedence probabilities is large enough that use of a single, regional flow-duration value to estimate the point of maximum curvature for all stream sections in Massachusetts would be inappropriate. Because the point of maximum curvature is, overall, relatively insensitive to discharge, use of the wetted-perimeter threshold method may not be a useful criterion for determining instream-flow requirements for streams in Massachusetts.
Abstract 1

INTRODUCTION
Maintenance and enhancement of instream flows for riverine ecosystems is becoming a focal point of the debate on the economic benefits and environmental costs of water-resource development. Instream flows are defined as those flows that remain in the stream channel after diversions for off-stream uses such as public and industrial supplies (McMahon, 1993). Many State and Federal environmental agencies have attempted to define instream-flow requirements to ensure maintenance of riverine ecosystems, including habitat for flora and fauna, fish passage, and acceptable water-quality conditions. Definition of instream-flow requirements, however, can be a complicated task because of the difficulties in assessing the hydrologic needs of riverine ecosystems. Methods for determining instream-flow requirements can be grouped into three general classes (McMahon, 1993): (1) historical discharges or rule-of-thumb methods that use only streamflow data; (2) threshold methods that account for the availability of habitat at various discharge levels and that specify a flow below which the habitat is not considered adequate for instream-flow needs; and (3) instream-habitat simulation models that combine hydraulic characteristics of a reach (such as flow velocity, channel depth, wetted perimeter, and substrate) with data on habitat preferences of a given species to estimate the amount of habitat available over a range of discharges. The cost of determining
instream-flow requirements generally increases from the first to the third class of methods because increasing amounts of data are required.
The wetted-perimeter method is a threshold method that was developed to assess instream-flow requirements for salmon (Gordon and others, 1992). Wetted perimeter is used as a measure of the availability of aquatic habitat over a range of discharges (Annear and Conder, 1984; Nelson, 1984; Gordon and others, 1992; O'Shea, 1995). The wetted perimeter of a stream is the cross-sectional distance along which the streambed and stream banks contact water (fig. LA). Wetted perimeter is measured over a range of stream discharges at a particular stream transect and a graph of the relation between discharge and wetted perimeter is made. The slopes of such discharge and wetted-perimeter graphs commonly show a transition from a steep, positive slope at small discharges to a more gentle, gradual slope at larger discharges (fig. IB). A single pair of discharge and wetted-perimeter values is used to identify the point at which this transition occurs. This point is referred to in this report as the point of maximum curvature of the graph (fig. IB), but has been referred to by previous investigators as the "inflection point" of the graph or first break in slope of the graph (Gordon and others, 1992, p. 431). The discharge at which the point of maximum curvature occurs is taken as an indication of the minimum discharge to be maintained during rearing of salmon young (Gordon and others, 1992). Above this point, increases in discharge result in small
(A)
Wetted perimeter
Point of maximum curvature
<r intD
UJ
£DISCHARGE, IN CUBIC
FEET PER SECOND
(Linear axes)
Figure 1. (A) Hypothetical stream channel cross-section and (fl) graph of relation between discharge and wetted perimeter. (Modified from Gordon and others, 1992.)
2 Relations Between Discharge and Wetted Perimeter and Other Hydraulic-Geometry Characteristics, Massachusetts

increases in wetted perimeter, whereas below this point, decreases in discharge result in large decreases in wetted perimeter.
The availability of aquatic habitat also has been related to stream characteristics other than wetted perimeter, including channel width (Wesche and Rechard, 1980) and channel depth and flow velocity (Singh and Broeren, 1989). Fundamental relations between discharge and the hydraulic-geometry characteristics of a stream channel, including channel top width (which is a general measure of channel width), channel depth, and flow velocity have been established by previous investigators (Leopold and Maddock, 1953; Leopold and others, 1964; Park, 1977; Williams, 1978; Hedman and Osterkamp, 1982; Bleed, 1987; Leopold, 1994; Alien and others, 1994). Because wetted perimeter, channel top width, channel depth, and flow velocity all are related to discharge and the availability of aquatic habitat, it is logical to study the relations between discharge and these four stream hydraulic-geometry characteristics simultaneously.
Three Massachusetts State environmental agencies (Department of Environmental Management; Department of Environmental Protection; and Department of Fisheries, Wildlife, and Environmental Law Enforcement) have begun to evaluate methods for establishing instream-flow requirements for Massachusetts streams. One method that is being considered is the wetted-perimeter method. In 1995, the U.S. Geological Survey (USGS), in cooperation with these State agencies, began a study to develop and evaluate discharge and wetted-perimeter relations for their applicability in determining instream flows for Massachusetts streams, and to determine relations between discharge and other hydraulic-geometry characteristics including channel top width, channel depth, and flow velocity. The relations were developed from data collected at 24 selected USGS streamflow- gaging stations that have all or most of their drainage areas in Massachusetts. The results of the study permitted a comparison of the wetted-perimeter threshold method with other methods used in New England.
Purpose and Scope
The purpose of this report is to describe relations between discharge and wetted perimeter and other hydraulic-geometry characteristics at selected USGS streamflow-gaging stations in Massachusetts. In addition, the applicability of the use of the wetted-
perimeter threshold method, which is based on the relation between discharge and wetted perimeter at a streamflow-measurement site, to the determination of instream-flow requirements for Massachusetts streams was evaluated. Methods used and results found at each selected gaging station are described, and limitations of the analysis are discussed.
Physical Setting
Massachusetts has a land area of 8,093 mi2 in the northeastern United States. The State has been subdivided into 27 separate basins by the Massachusetts Department of Environmental Management, Office of Water Resources (MOWR) for planning purposes (fig. 2). Planning-basin boundaries generally follow major river-basin boundaries. The climate of Massachusetts is humid, and annual precipitation, which is fairly evenly distributed throughout the year, averages about 45 in. throughout the State. Average temperatures range from 45°F in the western mountains to 50°F in coastal areas. Mean elevation and topographic relief generally increase from low-lying coastal areas in eastern Massachusetts to the western mountains, where the maximum elevation is nearly 3,500 ft above sea level.
Surficial geology and topography control to a large extent the physical characteristics of streams in Massachusetts. Two primary types of surficial materials are present stratified drift and till. Stratified drift, which was deposited and sorted by meltwater from retreating glaciers at the end of the last ice age, consists of coarse sand and gravel that also may contain layers of fine sand and clay. Stratified drift is commonly present in low-lying areas along major valley floors of inland river basins and in the coastal areas of southeastern Massachusetts. Streambeds in stratified drift are typically sand and gravel in which aquatic plants grow abundantly. In many areas, streambeds are armored by cobbles and boulders that originally may have been in the stratified drift or were carried by the stream from upland areas. Streams in stratified drift tend to have lower slopes and flow velocities than streams in till because stratified drift generally is in low-lying areas. Till is unsorted glacial material that ranges in size from clay to large boulders. Streams in till usually are armored by cobbles and boulders or flow directly on bedrock. These streams are characterized by greater slopes and velocities than streams in stratified drift.
Introduction 3

.* a
o CO
09 O
w ( 9
B Q.
71*0
0'
§ a-
1873
'00'
/ A
A
T1
A)1
3330
00A
<)13
3200
0
7230-
72.0
0,
71.3
0,
42
-3
0'-/
0,16
9900
V
01197000
/ 2
/ A
/ 01197500
A /1 <
\r?
/
""'"
".7'i-
y !
9aj
vT
' o
^ / 1
4aoio
97ooo(
\ ~
NC&
M
assa
chus
etts
O
1 .J
.-
-' '
< _ 1.. »3\
, J3/7
V
1
14b
A>.
? 01
1805
00":
.
'V/V:
.^.
^ ,>
'
/ -«
« "
0^,
>
0110
3500
r-rj
'/A
0117
6000
0117
5670
/ 1W
OR
CE
STE
R'''
C.
.
'. 10
/'
1 12
A
0111
1200
:-
Base
from
U.S
. Geo
logi
cal S
urve
y di
gita
l dat
a, 1
:25.
000.
1991
M
assa
chus
etts
Sta
te P
lane
Zo
ne 4
151
10
9
0111
1300
20
30
40 M
ILES
0 10
20
30
40
KIL
OM
ETE
RS
EX
PL
AN
AT
ION
PL
AN
NIN
G B
AS
INS
1.H
udso
n 13
. Mer
rimac
k 20
. Cha
rles
2. H
ousa
toni
c 14
. Con
cord
21
. Sou
th C
oast
al3.
Dee
rfiel
d a.
Ass
abet
a.
Nor
th a
nd S
outh
Riv
ers
4. W
estfi
eld
b. C
onco
rd a
nd S
udbu
ry
b. S
outh
Coa
stal
Sho
re5.
Far
min
gton
15
. Sha
wsh
een
22. C
ape
Cod
6. C
onne
ctic
ut
16. P
arke
r 23
. Isl
ands
7. M
iller
s 17
. Ips
wic
h 24
. Buz
zard
s B
ay8.
Chi
cope
e 18
. Nor
th C
oast
al
25. T
aunt
on9.
Qui
neba
ug
19. B
osto
n H
arbo
r 26
. N
arra
gans
ett B
ay a
nd10
. Fre
nch
a. M
ystic
M
t. H
ope
Bay
Sho
re11
. Nas
hua
b. N
epon
set
27. T
en M
ite12
. Bla
ckst
one
c. W
eym
outh
and
Wei
r
-----
BA
SIN
BO
UN
DA
RY
..............
SU
BB
AS
IN B
OU
ND
AR
Y01
1701
00
A
ST
RE
AM
FL
OW
-GA
GIN
G S
TA
TIO
NA
ND
U.S
. G
EO
LO
GIC
AL
SU
RV
EY
ST
AT
ION
ID
EN
TIF
IER
(se
e ta
ble
1)
Figu
re 2
. Loc
atio
ns o
f site
s us
ed in
the
anal
ysis
of d
isch
arge
, wet
ted
perim
eter
, and
oth
er h
ydra
ulic
-geo
met
ry c
hara
cter
istic
s an
d th
e 27
maj
or
river
bas
ins
in M
assa
chus
etts
.

METHODS OF INVESTIGATION
The methods used in this study can be divided into five primary steps: (1) selection of streamflow- gaging stations; (2) calculation of wetted perimeter, channel top width, channel depth, and flow velocity from discharge data; (3) calculation of summary statistics and discharge-exceedence probabilities at each streamflow-gaging station; (4) determination of at-a-station relations between discharge and wetted perimeter, channel top width, channel depth, and flow velocity; and (5) determination of the point of maximum curvature for the discharge and wetted- perimeter relations. As used in this report, the period of record is the period for which published discharge records for the station are available; the period of study is the period for which discharge measurements were used for the analysis of discharge, wetted perimeter, and other hydraulic-geometry characteristics.
Selection of streamflow-gaging stations.-- Streamflow-gaging stations were selected for analysis on the basis of the following criteria: (1) the period of record at the stations should be as long as possible; (2) the number of measurements at the stations should be as large as possible; (3) the measurement locations should be as consistent as possible; (4) the distributions of size (area) and surficial materials of drainage basins of the stations should be representative of as many streams in Massachusetts as possible; (5) the stations should be distributed among the State's 27 planning basins; and (6) the stations should have nearly natural flow conditions. In all, 24 USGS streamflow-gaging stations on streams that have all or most of their drainage areas in Massachusetts were selected (table 1). Seventeen of the selected streamflow-gaging stations are predominantly unregulated. Regulation at the remaining seven stations is not of sufficient extent to affect channel geometry.
Discharge measurement records used for the analysis are available at the Marlborough, Massachusetts, USGS office and, for the most part, were made during water years 1986-95 (table 1). Discharge measurements made before water year 1986 were not used (with the exception of those for North Branch Hoosic River at North Adams, Massachusetts) because available measurements generally were adequate to define the wetted perimeter and other
hydraulic-geometry characteristics. Discharge measurements at streamflow-gaging stations often are taken at different cross-section locations, depending on flow conditions and the judgment of the person making the measurement. Because channel characteristics are different at different locations, discharge measurements at each streamflow-gaging station were examined to determine if all measurements were made at the same cross-section location. Measurements were not included in the analysis if they were made at a different location from that normally used, were made during times of high discharge or ice cover, or were affected by backwater.
Calculation of wetted perimeter, channel top width, channel depth, and flow velocity.- Wetted perimeter of a stream channel is calculated from the channel-width and channel-depth data collected as part of a discharge measurement. Channel-width, channel- depth, and flow-velocity measurements are typically made at 25 to 30 measurement stations along a cross section of the river to determine the discharge. The wetted perimeter between each measurement station is the hypotenuse of the right triangle defined by the horizontal distance between stations and the difference in streambed elevation between two stations (Benson and Dalrymple, 1967). Wetted perimeter for the entire stream cross section is determined by summing the individual wetted-perimeter values calculated between measurement stations:
WP =
1 = 1where
WP is wetted perimeter of the stream channel,in feet;
/. is horizontal distance between measurementstations i and i - 1, in feet;
b. is difference in streambed elevations between measurement stations i and / - 1, in feet; and
n is total number of measurement stations.
A computer program was written to automate the calculation of wetted perimeter from discharge measurements.
Methods of Investigation 5

Tabl
e 1.
Des
crip
tion
of s
elec
ted
stre
amflo
w-g
agin
g st
atio
ns in
Mas
sach
uset
ts
Relations
Between
Disch 0 .2 <§ § a s a 9 i 0 a. z a i 5s 6 I 1«< § 0 5 S & s 0 CD i i §
[Per
iod
of re
cord
and
per
iod
of st
udy
are
in w
ater
yea
rs, w
hich
ext
end
from
Oct
ober
1 th
roug
h Se
ptem
ber 3
0; --
, no
sign
ifica
nt re
gula
tion]
Stat
ion
No.
0109
6000
0109
7000
0109
7300
0110
1000
0110
3500
0110
5600
0110
5730
0110
5883
7
0110
9000
0110
9403
0111
1200
0111
1300
0116
2500
0116
6105
0116
9900
0117
0100
0117
1500
0117
5670
0117
6000
0118
0500
0119
7000
0119
7500
0133
2000
0133
3000
Latit
ude
0
*
42 3
8 03
4225
55
42 3
0 39
4245
1042
1522
4211
2542
0602
41 3
5 32
4156
51
4149
51
4206
1741
58
52
4240
5742
35
3942
3231
42 4
2 12
42 1
9 05
42 1
5 54
4210
5642
15
31
42 2
8 10
42 1
3 55
42 4
2 08
4242
32
Long
itude
o *
*
71 3
9 30
7127
01
7124
2570
5646
71 1
538
7056
4370
4923
7030
30
71 1
038
7121
06
71 3
6 28
7141
11
7206
5672
21
4172
4139
7240
1672
3921
7200
1972
1551
72 5
2 23
7311
4973
21 1
973
05
3773
1150
Stat
ion
nam
e
Squa
nnac
ook
Riv
er n
ear W
est G
roto
n, M
ass.
Ass
abet
Riv
er a
t May
nard
, Mas
s.
Nas
hoba
Bro
ok n
ear A
cton
, Mas
s.Pa
rker
Riv
er a
t Byf
ield
, Mas
s.C
harle
s R
iver
at D
over
, Mas
s.
Old
Sw
amp
Riv
er n
ear S
outh
Wey
mou
th, M
ass.
Indi
an H
ead
Riv
er a
t Han
over
, Mas
s.
Qua
shne
t Riv
er a
t Waq
uoit
Vill
age,
Mas
s.
Wad
ing
Riv
er n
ear N
orto
n, M
ass.
Ten
Mile
Riv
er a
t Paw
tuck
et A
ve. a
t Eas
t Pro
vide
nce,
R.I.
Wes
t Riv
er b
elow
Wes
t Hill
Dam
nea
r Uxb
ridge
, Mas
s.N
ipm
uc R
iver
nea
r Har
risvi
lle, R
.I.
Prie
st B
rook
nea
r Win
chen
don,
Mas
s.W
hets
tone
Bro
ok a
t Dep
ot R
oad
at W
ende
ll D
epot
, Mas
s.So
uth
Riv
er n
ear C
onw
ay, M
ass.
Gre
en R
iver
nea
r Col
rain
, Mas
s.M
ill R
iver
at N
orth
ampt
on, M
ass.
Seve
nmile
Riv
er n
ear S
penc
er, M
ass.
Qua
boag
Riv
er a
t Wes
t Brim
field
, Mas
s.M
iddl
e B
ranc
h W
estfi
eld
Riv
er at
Gos
s H
eigh
ts, M
ass.
East
Bra
nch
Hou
sato
nic
Riv
er at
Col
tsvi
lle, M
ass.
Hou
sato
nic
Riv
er n
ear G
reat
Bar
ringt
on, M
ass.
Nor
th B
ranc
h H
oosic
Riv
er a
t Nor
th A
dam
s, M
ass.
Gre
en R
iver
at W
illia
msto
wn,
Mas
s.
Perio
d of
re
cord
1950
-pre
sent
1942
-pre
sent
1964
-pre
sent
1946
-pre
sent
1937
-pre
sent
1966
-pre
sent
1967
-pre
sent
1989
-pre
sent
1926
-pre
sent
1987
-pre
sent
2196
2-90
2196
4-91
1994
-pre
sent
1919
-pre
sent
1985
-91
1967
-pre
sent
1968
-pre
sent
1940
-pre
sent
1961
-pre
sent
1913
-pre
sent
2191
0-90
1937
-pre
sent
1914
-pre
sent
1931
-90
1950
-pre
sent
Perio
d of
st
udy
(num
ber o
f m
easu
re
men
ts)
1986
-95
(58)
1986
-95
(60)
1986
-95
(74)
1986
-95
(63)
1986
-95
(45)
1986
-95
(92)
1986
-95
(56)
1989
-95
(64)
1986
-95
(43)
1987
-95
(71)
2198
6-95
(24)
2198
6-95
(63)
1986
-95
(65)
1986
-91
(38)
1986
-95
(60)
1986
-95
(67)
1987
-95
(26)
1986
-95
(77)
1986
-95
(57)
2198
6-93
(56)
1986
-95
(71)
1986
-95
(49)
1981
-90
(22)
1986
-95
(64)
Dra
inag
e ar
ea
(squ
are
mile
s)
63.7
116 12
.621
.318
3 4.50
30.3
'2.5
8
43.3
53.1
27.9
16.0
19.4 5.22
24.1
41.4
54.0 8.68
150 52.7
57.6
282 40.9
42.6
Rem
arks
Occ
asio
nal r
egul
atio
n by
mill
ups
tream
Occ
asio
nal r
egul
atio
n by
mill
s an
d flo
od
.co
ntro
l res
ervo
irs- O
ccas
iona
l re
gula
tion
by m
ill a
nd p
onds
Div
ersio
ns to
/from
bas
in fo
r mun
icip
alsu
pplie
s
~ Som
e re
gula
tion
by m
ills
and
pond
sup
stre
amO
ccas
iona
l reg
ulat
ion
by c
ranb
erry
bog
;oc
casi
onal
bac
kwat
er fr
om ti
dal s
urge
sR
egul
atio
n by
lake
s and
pon
ds. D
iver
sion
sto
and
from
bas
in fo
r mun
icip
al s
uppl
ies
Reg
ulat
ion
and
dive
rsio
ns fr
om u
pstre
amre
serv
oir
Floo
d-co
ntro
l dam
ups
tream
- - Smal
l diu
rnal
fluc
tuat
ion
sinc
e 19
82
- Occ
asio
nal r
egul
atio
n by
pon
dsSl
ight
ly a
ffec
ted
by re
serv
oirs
ups
tream
Floo
d-co
ntro
l dam
ups
tream
Reg
ulat
ion
by p
ower
plan
ts a
nd re
serv
oir
Reg
ulat
ion
by p
ower
plan
ts a
nd re
serv
oir
Infr
eque
nt s
mal
l diu
rnal
fluc
tuat
ion
Infre
quen
t sm
all d
iurn
al fl
uctu
atio
n'T
he Q
uash
net R
iver
dra
ins
from
a g
roun
d-w
ater
bas
in th
at is
larg
er th
an, a
nd n
ot c
oinc
iden
t with
, the
sur
face
-wat
er b
asin
. Exc
lude
s ar
ea d
rain
ed b
y Jo
hns
Pond
.2S
ever
al d
isch
arge
mea
sure
men
ts w
ere
obta
ined
aft
er th
e st
ream
flow
-gag
ing
stat
ion
was
dis
cont
inue
d.
Channel top width, channel depth, and flow velocity also were calculated from each discharge measurement. As used in this report, channel top width (W) is the width of the channel section at the stream's free surface at the time of measurement; (mean) channel depth (£>) is the total cross-sectional area of the stream channel at the measurement site divided by the top width of the channel at the time of measurement; and (mean) flow velocity (V) is calculated by dividing total discharge by the cross- sectional area of the stream channel at the time of measurement.
Calculation of summary statistics and discharge-exceedence probabilities.--Several summary statistics were calculated for each of the 24 streamflow-gaging stations for the period of study. These include mean discharge, mean wetted perimeter, mean channel top width, mean channel depth, mean flow velocity, and mean unit discharge. Unit discharge was calculated by dividing each discharge measurement by the drainage area of the streamflow- gaging station. Sample correlation coefficients, which are a measure of the linear relation between two parameters, were determined for discharge and wetted perimeter and wetted perimeter and channel top width. All statistical analyses were done using the SAS statistical software (SAS Institute Inc., 1990).
Discharge-exceedence probabilities were calculated for the period of record at each streamflow- gaging station. For example, the 99-percent exceedence probability is the discharge equaled or exceeded 99 percent of the time during the period of record. Exceedence probabilities were calculated using mean daily discharges.
Determination of at-a-station relations between discharge and wetted perimeter, channel top width, channel depth, and flow velocity.-- Regression analyses were used to evaluate the relations between discharge and wetted perimeter, channel top width, channel depth, and flow velocity at each streamflow-gaging station for the period of study. The regression analyses were based on a power-function relation, Y = c^Q 2 , between the dependent variable Y (wetted perimeter, channel top width, channel depth, or flow velocity) and independent variable Q (discharge), where Cj and c2 are coefficients. These relations (termed "at-a-station" hydraulic-geometry relations) are based on the work of Leopold and
Maddock (1953), who were the first to show that at a particular stream cross section, channel top width, channel depth, and flow velocity can be described by power-function relations of discharge. As originally developed by Leopold and Maddock, these power functions are:
and
W = aQb ,
D = cQf,
V = kQm ,
(2)
(3)
(4)
where a, c, k and b,f, m are numerical constants. These power-function relations are straight lines on logarithmic-scale graphs of the independent and dependent variables. The exponents b,f, m quantify the rate of change of the dependent variables with change in Q. They describe the geometry of the channel and the resistance of the streambed and stream banks to erosion (Leopold, 1994). For example, a box-like channel with straight steep sides, which is characteristic of a channel composed of cohesive materials, would have a low value for b and a high value for/(Leopold, 1994). Derivations and evaluations of the hydraulic-geometry relations have been made from a theoretical basis by Leopold and Langbein (1962), Langbein (1964), Smith (1974), and Williams (1978), among others.
Because the wetted perimeter of a stream channel also is a function of discharge, the assumption was made that a power-function relation also could be used to relate wetted perimeter and discharge:
WP = gQh , (5)
where g and h are numerical constants.By taking the logarithm of each side of equations
2-5, a linear relation between the logarithms of the stream-channel characteristics and discharge can be determined. For example, for channel top width and discharge (eq. 2), the logarithmically transformed relation is:
Methods of Investigation 7

logW = loga (6)
where log represents the base-10 logarithm. These transformed logarithmic relations then form the basis for log-log regression models, which are written in general form as:
logK = (7)
where Y is the dependent variable (either wetted perimeter, channel top width, channel depth, or flow velocity), cQ and Cj are regression-model coefficients, and £ is the residual error of the model.
Determination of the point of maximum curvature for the discharge and wetted-perimeter relations.--The final step in evaluating discharge and wetted-perimeter relations was the determination of the point of maximum curvature on the discharge and wetted perimeter graphs. One difficulty in using the wetted-perimeter method is the subjectivity in choosing the point of maximum curvature on a graph made from sparse field data (commonly, fewer than 20 data points), particularly when there are few measurements in the area of the maximum curvature. Previous investigators (such as Nelson, 1984; O'Shea, 1995) have either visually determined or used a computer program to choose mathematically the point of maximum curvature. A drawback to the visual determination that was identified during this investigation is that the point chosen depends on the scales used to graph the discharge and wetted- perimeter data. To reduce the subjectivity of choosing the point of maximum curvature, a mathematical method was used to determine this point.
The mathematical method chosen for this analysis links the statistical regression model of discharge and wetted perimeter (eqs. 5 and 7) with an analytical equation that finds the point of maximum curvature, which is taken as the first break in slope of the discharge and wetted-perimeter graph. This method differs from that used in previous investigations (such as O'Shea, 1995) because all discharge and wetted- perimeter data are used to determine the point of maximum curvature from a best-fit statistical model of
the discharge and wetted-perimeter relation at each streamflow-gaging station. The point of maximum curvature was found for each discharge and wetted- perimeter relation by calculating the curvature (K) of a two-variable mathematical model (for example, variables x and y; Anton, 1980, p. 784):
d2y
K = dx3/2
(8)
whereK is curvature;y is the dependent variable, which equals WP
(wetted perimeter, in feet); x is the independent variable, which equals Q
(discharge, in cubic feet per second);
dxis the absolute value of the second derivative of
y with respect to *; and
~ is the first derivative of y with respect to x.
The first and second derivatives are determined from the power-function model (eq. 5):
(9)
and
A computer program was written to find the point of maximum curvature for each discharge-wetted perimeter relation using equations 8-10 and the values of g and h that were determined for each streamflow- gaging station from the regression analyses (eq. 7).
An example of the calculated discharge and wetted-perimeter function (eq. 5) and curvature function (eq. 8) for Squannacook River near West Groton, Massachusetts (streamflow-gaging station number 01096000) is shown in figure 3. The calculated parameters for the model (which are discussed in the next section) are g=26.9 and fc=0.15:

70
UJ
Point of maximum curvature (0.068) at wetted perimeter = 31.6 feet and discharge = 2.90 cubic feet per second
10
Wetted Perimeter . Curvature
0.08
0.07
0.06
0.05UJ OCID
0.04 <
DC
O0.03
0.02
0.01
20 40 60 80 100 120
DISCHARGE, IN CUBIC FEET PER SECOND
140
Figure 3. Graph relating wetted perimeter and curvature to discharge for Squannacook River near West Groton, Massachusetts (station 01096000).
WP = 26.9J20' 15 . (11)
Curvature decreases rapidly beyond the point of maximum curvature, which is at a discharge of 2.90 ft3/s and wetted perimeter of 31.6 ft (see fig. 3).
Ninety-five-percent confidence intervals were determined for wetted perimeter at the point of maximum curvature. Confidence intervals provide a measure of the reliability of the calculated point of
maximum curvature. The values of wetted perimeter at the 95-percent confidence intervals were then used to find corresponding values of discharge at the 95- percent confidence intervals by rearrangement of equation 5:
(12)\ 8 J
Methods of Investigation 9

ANALYSIS OF RELATIONS BETWEEN DISCHARGE AND WETTED PERIMETER AND OTHER HYDRAULIC-GEOMETRY CHARACTERISTICS
The 24 streamflow-gaging stations selected for analysis are distributed fairly uniformly throughout Massachusetts and lie within 17 of the State's 27 major river basins (fig. 2). On average, 57 discharge measurements were used at each station; the minimum number of measurements used was 22 and the maximum was 92 (table 1). Drainage areas for the 24 stations range from less than 5 mi2 to nearly 300 mi2 (table 1), and the percentage of each drainage basin underlain by stratified drift ranges from a minimum of 2.8 at station 01180500 (Middle Branch Westfield River at Goss Heights, Massachusetts) in the western part of the State to a maximum of 100.0 at station 011058837 (Quashnet River at Waquoit Village, Massachusetts) in the southeastern part of the State (% 2).
Correlations Among Discharge, Wetted Perimeter, and Channel Top Width
The mean wetted perimeter at each streamflow- gaging station ranged from 10.8 to 98.3 ft and the mean channel top width ranged from 9.8 to 97.7 ft (table 2). Wetted perimeter and channel top width were highly correlated at all streamflow-gaging stations (table 2). All streamflow-gaging stations have ratios of mean channel top width to mean channel depth (W7D) greater than 9.8 for the period of study (table 2), and the mean value of W/D for the 24 stations is 31.6. Because channel top width is so much greater than channel depth at the 24 stations, the terms in equation 1 that account for the horizontal distance between measurement stations (I- ) dominate over those that account for the vertical distance between measurement stations (b.) and, consequently, wetted perimeter is largely a function of channel top width at each station. The dependence of wetted perimeter on channel top width can be shown for a generic, rectangularly shaped channel section by the equation (Chow, 1959, p. 21):
WP = W + 2D. (13)
In equation 13, when channel top width greatly exceeds channel depth (that is, W»D), wetted perimeter approximately equals channel top width.
Correlations between discharge and wetted perimeter are not as strong as those between wetted perimeter and channel top width. Graphs of wetted perimeter as a function of discharge for each streamflow-gaging station are shown in figures 4 through 27 (at back of report). Data at most stations show that wetted perimeter tends to increase sharply with increases in discharge at very low discharges and to increase gradually at low to moderate discharges, which is consistent with results of previous investigations. Some of the stations, however, had a nearly constant value of wetted perimeter at all discharges (such as Charles River at Dover, fig. 8; Quashnet River at Waquoit Village, fig. 11; Ten Mile River at East Providence, fig. 13; and Housatonic River near Great Barrington, fig. 25). Most of the stations for which wetted perimeter is nearly constant are those at which discharge measurements are made in pools or in stream reaches with little or no bed slopes, and where the streambanks are nearly vertical at water levels up to bankfull conditions. Stations at which wetted perimeter increases substantially with increases in discharge (such as the stations at South River near Conway, fig. 18 and Green River near Colrain, fig. 19) tend to be in riffle reaches of the streams that have gradual-sloped streambanks.
Regression Models
The power-function regression models calculated for discharge and wetted perimeter, channel top width, channel depth, and flow velocity for the 24 streamflow-gaging stations are shown in table 3. In addition, the adjusted coefficients of determination (R2adj, the percentage of the variation in the dependent variable explained by the model, adjusted for the number of measurements and parameters used in each model) and the root mean squared error (Se) for each regression model are included in table 3. Plots of the discharge and wetted-perimeter power-function models are shown in figures 4 through 27.

Tabl
e 2.
Dra
inag
e-ar
ea c
hara
cter
istic
s an
d su
mm
ary
stat
istic
s fo
r per
iod
of s
tudy
for s
elec
ted
stre
amflo
w-g
agin
g st
atio
ns in
Mas
sach
uset
ts
[Are
a is
in sq
uare
mile
s, di
scha
rge
is in
cub
ic fe
et p
er se
cond
, wet
ted
perim
eter
is in
feet
, vel
ocity
is in
feet
per
sec
ond,
cha
nnel
top
wid
th a
nd d
epth
are
in fe
et, w
idth
to d
epth
ratio
is d
imen
sion
less
, uni
t di
scha
rge
is in
cub
ic fe
et p
er se
cond
per
squa
re m
ile, c
orre
latio
n co
effic
ient
s are
dim
ensi
onle
ss]
1 f 5* a 31
O I O to I § O ca 0 I CO 0 a ef ! I i 5 5 a f X I = 9
Stat
ion
No.
0109
6000
0109
7000
0109
7300
0110
1000
0110
3500
0110
5600
0110
5730
0110
5883
701
1090
0001
1094
03
0111
1200
0111
1300
0116
2500
0116
6105
0116
9900
0117
0100
0117
1500
0117
5670
0117
6000
0118
0500
0119
7000
0119
7500
0133
2000
0133
3000
Dra
inag
e ar
ea
63.7
116 12
.621
.318
3 4.50
30.3 2.58
43.3
53.1
27.9
16.0
19.4 5.22
24.1
41.4
54.0 8.68
150 52.7
57.6
282 40.9
42.6
Stra
tifie
d-
drif
t ar
ea
16.8
45.5 7.45
9.46
87.8 1.19
21.5 2.58
25.7
31.6 8.45
4.50
1.26
1.24
3.18
1.48
9.36
1.10
31.6 1.50
8.37
38.0 3.00
4.84
Mea
n di
scha
rge
90.8
125 17
.629
.919
6 13.6
54.0
14.6
59.0
83.8
46.4
21.4
69.0 9.32
34.5
83.6
52.9
19.7
227 91
.0
80.4
274 52.1
59.7
Mea
n w
ette
d pe
rim
eter
50.7
46.5
15.3
16.4
97.5
15.5
30.1
10.8
29.9
36.3
40.6
26.1
20.4
18.5
33.4
59.6
32.7
14.8
90.5
62.2
49.6
98.3
34.3
37.8
Mea
n ve
loci
ty
1.16
1.64 .91
1.60
1.02 .86
1.07
1.49
1.17
1.20 .71
1.07
1.82 .57
1.09
1.13
1.21
1.06
1.40 .94
1.29
1.46
1.35
1.38
Mea
n ch
anne
l top
w
idth
48.9
44.4
12.9
15.7
96.0
15.0
28.7 9.81
28.6
34.1
37.0
25.6
19.0
17.6
32.8
59.1
31.5
13.9
89.8
61.2
48.6
97.7
33.2
37.0
Mea
n de
pth
1.29
1.50
1.19 .93
1.74 .70
1.43
1.00
1.36
1.86
1.86 .63
1.11 .8
9.8
0
.93
1.20 .89
1.57
1.28
1.05
1.77
1.05
1.04
Wid
th
to d
epth
ra
tio
37.9
29.6
10.8
16.9
55.2
21.4
20.1 9.8
21.0
18.3
19.9
40.6
17.1
19.8
41.0
63.5
26.3
15.6
57.2
47.8
46.3
55.2
31.6
35.6
Mea
n un
it -
disc
harg
e 1
1. 42
1.08
1.38
1.40
1.07
3.02
1.78
5.67
1.36
1.58
1.66
1.34
3.56
1.79
1.43
2.02 .9
82.
271.
511.
73
1.40 .97
1.27
1.40
Cor
rela
tion
coef
fici
ents
(R)
Wet
ted
peri
met
er W
ette
d pe
rim
eter
and
an
d di
scha
rge
chan
nel t
op w
idth
0.47 .7
3.7
4.4
8.6
0
.66
.52
.29
.70
.45
.39
.67
.73
.59
.77
.70
.78
.68
.23
.65
.75
.69
.86
.48
0.98 .8
8.9
5.9
2.9
3
1.00 .94
.77
.98
.96
.99
1.00 .94
1.00
1.00
1.00 .99
.95
.99
.99
1.00
1.00 .95
.99
o 81 S

10 ations
Betw 1 a
a. I O I
Tabl
e 3.
Par
amet
ers
calc
ulat
ed fo
r pow
er-fu
nctio
n re
latio
ns b
y re
gres
sion
ana
lysi
s fo
r sel
ecte
d st
ream
flow
-gag
ing
stat
ions
in M
assa
chus
etts
[WP,
wet
ted
perim
eter
, in
feet
; Q, d
isch
arge
, in
cubi
c fe
et p
er se
cond
; W, c
hann
el to
p w
idth
, in
feet
; D, d
epth
, in
feet
; V, v
eloc
ity, i
n fe
et p
er se
cond
; g,h
,a,b
,c,f
, k,
and
m, c
oeffi
cien
ts; R
adj
, squ
ared
ad
just
ed re
gres
sion
cor
rela
tion
coef
ficie
nt; S
e, ro
ot m
ean
squa
red
erro
r]
Model
Station
No.
01096000
0109
7000
0109
7300
0110
1000
0110
3500
01105600
01105730
0110
5883
701
1090
0001109403
01111200
01111300
01162500
01166105
01169900
01170100
01171500
01175670
01176000
0118
0500
0119
7000
0119
7500
0133
2000
0133
3000
WP=gQh
WssaQP
DscO
f
9 26.9
18.4 8.07
13.6
79.2
11.8
23.3 8.37
20.4
28.1
22.7
14.7
12.2 9.04
14.9
26.9
15.2 9.71
61.8
29.2
30.7
56.8
12.4
17.4
h 0.15 .20
.26
.07
.04
.14
.07
.09
.11
.06
.15
.21
.15
.33
.25
.20
.21
.18
.07
.18
.12
.10
.27
.20
#adl
0.43 .59
.73
.61
.34
.53
.35
.05
.60
.11
.12
.73
.67
.38
.71
.66
.73
.55
.14
.46
.51
.56
.72
.31
Se 0.08 .06
.09
.04
.02
.08
.04
.05
.05
.05
.14
.08
.07
.14
.07
.07
.05
.09
.08
.10
.04
.03
.06
.12
a
25.8
15.9 6.94
13.7
79.3
11.4
22.5 7.20
20.5
28.4
20.0
14.6
11.4 8.39
14.8
26.7
13.9 9.43
61.0
28.7
30.7
56.9
13.1
16.9
b 0.15 .22
.25
.05
.04
.14
.07
.11
.09
.04
.14
.21
.15
.34
.24
.20
.22
.16
.08
.18
.11
.10
.25
.20
f?adl
0.41 .78
.65
.45
.22
.49
.34
.05
.51
.04
.03
.70
.69
.36
.70
.64
.72
.43
.13
.47
.52
.53
.73
.28
Se 0.08 .04
.10
.04
.03
.09
.04
.06
.05
.05
.22
.08
.06
.15
.07
.08
.05
.11
.08
.09
.04
.03
.05
.12
c 0.34 .36
.67
.38
.31
.39
.48
.40
.27
.34
.75
.21
.39
.59
.30
.29
.62
.42
.55
.28
.20
.44
.39
.30
f
0.31 .30
.22
.30
.34
.28
.29
.34
.43
.39
.24
.38
.29
.19
.30
.29
.18
.30
.21
.36
.39
.25
.26
.31
ffia
d]
0.82 .55
.56
.95
.65
.83
.77
.23
.94
.94
.47
.80
.87
.27
.66
.83
.63
.82
.59
.85
.94
.57
.61
.54
Se 0.07 .09
.11
.05
.10
.08
.08
.08
.06
.03
.11
.11
.07
.10
.09
.07
.05
.08
.08
.07
.04
.06
.07
.12
k 0.12 .18
.22
.21
.04
.25
.09
.32
.18
.10
.07
.33
.24
.20
.24
.13
.12
.25
.03
.13
.16
.04
.18
.20
V=kQm
m 0.53 .46
.53
.64
.63
.55
.64
.57
.48
.57
.61
.42
.55
.46
.45
.52
.61
.53
.73
.46
.50
.64
.52
.49
ffadi
0.88 .78
.81
.96
.86
.85
.92
.44
.92
.95
.71
.84
.96
.42
.82
.96
.94
.82
.88
.80
.94
.95
.74
.69
Se 0.09 .09
.14
.09
.11
.14
.09
.08
.08
.04
.16
.11
.08
.18
.09
.06
.06
.15
.13
.11
.04
.04
.10
.13

Coefficients for the discharge and wetted- perimeter regression models are nearly equal to those for the discharge and channel top width models (table 3) because of the close correlation between wetted perimeter and channel top width at each station (table 2). The R2adj values, however, are generally low for both model types. For example, the discharge and wetted-perimeter models have /?2«0 values that range from 0.05 to 0.73, with a mean of 0.48 for all 24 models. This indicates that, on average, only 48 percent of the variation in wetted perimeter is explained by the models. Values of l&adj are better for the channel depth and flow velocity power-function relations than for the wetted-perimeter and channel top width relations. Mean values of R2adj for the channel-depth and discharge relation and the flow velocity and discharge relation are 0.70 and 0.83, respectively.
Some correlation is apparent between the goodness of fit of the discharge and wetted-perimeter regression models (as measured by the R^adj values) and the quadrant of the State within which the streamflow-gaging station lies. The mean l&adj values for the 11 streamflow-gaging stations north of latitude 42°20' (which approximately divides the State into north and south halves) is 0.58, whereas the values for the 13 streamflow-gaging stations south of latitude 42°20/ is only 0.40. The lowest R2adj values are for the eight streamflow-gaging stations in the southeastern quadrant of the State (south of latitude 42°20' and east of longitude 72°00/); the mean R^adj value for these eight stations is only 0.35. The generally poor correlation between discharge and wetted perimeter at these stations may be a result of the generally low stream slopes of these basins.
The slopes of the power-function regression models for discharge and wetted perimeter (variable h in table 3) and for discharge and channel top width (variable b in table 3) tend to be small compared to those for discharge and channel depth and discharge and flow velocity. Slopes for the power-function regression models for discharge and wetted perimeter and discharge and channel top width range from 0.04 to 0.33 for wetted perimeter and 0.04 to 0.34 for channel top width. These small slopes indicate that wetted perimeter and channel top width generally vary less with discharge than do channel depth and flow velocity. For the case of channel top width, this conclusion is consistent with the work of Leopold and Maddock (1953), Park (1977), and Leopold (1994), who have determined that the general tendency is for
channel top width to show little change with an increase in discharge at a particular measurement station.
The exponents b, f, and m in the power-function regression models for channel top width (W), channel depth (D), and flow velocity (V), respectively, can be used to compare stream-channel characteristics in different physiographic regions. Channel width, channel depth, and flow velocity are related to discharge through the continuity relation (Leopold and Maddock, 1953):
Q = area x velocity = WDV. (14)
Substituting definitions for W, D, and V from equations 2 through 4 into equation 14 gives:
Q = aQb xcQfxkQm = (15)
Furthermore, because the left- and right-hand sides of equation 15 must be equal, it follows that:
and
axcxk = 1.0
b + f + m = 1.0.
(16)
(17)
Several investigators have evaluated the at-a- station hydraulic-geometry exponents b, f, and m for many representative physiographic regions. Leopold and Maddock (1953) found average values of £=0.26, /=0.40, and m=0.34 for 20 rivers in the Great Plains and southwestern United States. Williams (1978) found ranges of 0.00 <,b< 0.82 (top width), 0.10 </< 0.78 (depth), and 0.03 < m < 0.81 (flow velocity) for cross sections on 165 streams throughout the United States. Park (1977) compiled the results of investigations from several physiographic regions of the world. His analysis indicated wide ranges in the values of the exponents, even within a particular physiographic region. For all physiographic regions evaluated, he found the width exponent (b) ranged from 0.00-0.59 with most observations in the modal class 0.00-0.10. The channel depth exponent (/) showed a similar range to that of the width exponent, and the largest number of observations were in the modal class 0.30-0.40. The flow-velocity exponent (m) ranged from 0.07-0.71, and
Analysis of Relations Between Discharge and Wetted Perimeter and Other Hydraulic-Geometry Characteristics 13

values were more normally distributed than either the channel width or channel depth exponents; the largest number of values were in the modal class 0.40-0.50. Park (1977) found considerable scatter in the exponents reported for humid, temperate regions similar to the northeastern United States, with a general tendency toward a low to medium width exponent and medium channel-depth and flow-velocity exponents.
The ranges and mean values of the hydraulic- geometry exponents determined for the 24 streamflow- gaging stations in this study are similar to those reported by Park (1977) and Williams (1978). Summary statistics for the exponents b,f, and m, for the product axcxk, and for the sum b + f + m for the 24 streamflow-gaging stations are:
Variable, product, or sum
bf m a\c\k b+f+m
Range
0.04-0.34 0.18-0.43 0.42-0.73 0.92-1.11 0.97-1.03
Median
0.15 .30 .53
1.01 1.00
Mean Standard deviation *£££*
0.16 .30 .55
1.01 1.00
0.08 .06 .08 .05 .01
0.50 .20 .15 .05 .01
Table 4. Discharge and wetted-perimeter values at the point of maximum curvature and at the 95-percent confidence intervals for discharge and wetted perimeter power-function relations for selected streamflow-gaging stations in Massachusetts
[Discharge is in cubic feet per second, wetted perimeter is in feet; >, greater than]
Station No.
0109600001097000010973000110100001103500
01105600011057300110588370110900001109403
0111120001111300011625000116610501169900
0117010001171500011756700117600001180500
01197000011975000133200001333000
95-percent confidence interval below point of maximum curvature
Discharge
1.101.10.80.30.40
.70
.30
.02
.70
.08
.141.50.60.80
1.62
2.501.00.60.30
1.75
1.251.50.89.80
Percent exceedence
>99>99
9599
>99
94>99>99>99>99
>999299
>99>99
>99>99
95>99
99
>99>99>99>99
Wetted perimeter
27.318.87.60
12.676.5
11.121.5
5.8019.424.0
16.916.011.38.40
16.8
32.415.19.00
56.332.3
30.859.312.016.6
Point of maximum curvature
Discharge
2.902.501.10.60
2.40
1.001.10.50
1.501.10
2.402.101.101.602.50
4.102.101.003.304.00
2.604.302.102.40
Percent exceedence
>99999396
>99
88>99>99>99>99
99889794
>99
>99>99
91>99
97
>99>99>99>99
Wetted perimeter
31.522.08.30
13.282.1
11.823.57.80
21.328.2
25.817.212.410.518.7
35.617.79.70
67.537.4
33.765.815.120.7
95-percent confidence interval above point of maximum curvature
Discharge
7.605.601.601.20
14.9
1.604.00
14.23.40
16.0
40.13.002.003.204.33
6.504.301.70
48.19.00
5.5012.25.007.10
Percent exceedence
98999093
>99
8397509899
4084937898
99>99
868788
>99>99>99
96
Wetted perimeter
36.425.99.10
13.888.2
12.525.710.623.333.2
39.418.513.513.321.5
39.120.610.681.043.3
36.873.019.125.7
14 Relations Between Discharge and Wetted Perimeter and Other Hydraulic-Geometry Characteristics, Massachusetts

The mean value of the exponent h in the discharge and wetted-perimeter relations equals that of the exponent b in the discharge and channel top width relations because of the close correlation between wetted perimeter and channel top width. The mean value of the product of the coefficients a, c, and k (1.01) is close to the theoretical value of 1.00, and the mean value of the sum of the exponents b,f, and m equals the theoretical value of 1.00. The results at the individual stream sections used in this study indicate that channel top width tends to change very little with discharge, channel depth changes moderately with discharge, and flow velocity changes most substantially with discharge. These results imply that, for the most part, the stream sections generally are rectangular and have channel widths that greatly exceed mean channel depths. At all but the lowest flows, the full base width of the stream channels is wetted. As discharge increases, channel width remains virtually constant or increases very gradually up to bankfull conditions, and depth remains small relative to width.
Point of Maximum Curvature for the Discharge and Wetted-Perimeter Relations
Data shown in figures 4 through 27 indicate that the transition from a steep to a gradual slope on the discharge and wetted-perimeter curves generally is in the region of the lowest discharges. The analytical method used to determine the point of maximum curvature for each of the discharge and wetted- perimeter relations indicated that at 16 of the 24 stations, points of maximum curvature are at the discharge equaled or exceeded 99 percent of the time or greater for the period of record (table 4). Previous investigators generally have found breaks in slope at higher discharges than those found in this study. The highest point of maximum curvature in terms of the flow duration for the 24 stations is at the 88-percent exceedence probability (stations 01105600 and 01111300).
The point of maximum curvature determined by use of the analytical method was lower than the lowest measured discharge for 11 of the stations. In fact, the point of maximum curvature was below the minimum discharge for the period of record for seven of the stations (01105730,01109403,01171500,01176000, 01197000,01332000,01333000). Though the curves for these stations are not defined by discharge
measurements in the vicinity of the point of maximum curvature, the curves generally were defined adequately in the very low range by discharge measurements made at or near the 99-percent duration flow. The measuring sections for many of the stations were in pools, where even at the lowest flows the channel width does not substantially decrease with decreasing water level. In these areas, there may almost always be adequate wetted perimeter to sustain biota, although other stream conditions may have deleterious effects.
Though the calculated points of maximum curvature are in the region of lowest discharges, the range of exceedence probabilities is large enough that use of a single, regional flow-duration value to estimate the point of maximum curvature for all stream sections in Massachusetts would not adequately represent the variability in flow-duration values at the points of maximum curvature seen in this study. However, because all of the calculated points of maximum curvature are in the region of lowest discharges, the point of maximum curvature is, overall, relatively insensitive to discharge. Also, the discharges at the points of maximum curvature for the 24 streamflow- gaging stations are all less than the 0.5 (ft3/s)/mi2 Aquatic Base Flow (ABF) guideline used by the U.S. Fish and Wildlife Service (1981) as an estimate of the summer-time minimum discharge per square mile of drainage area required for maintenance of habitat for biota in New England streams. Though the ABF is not used as a formal policy by the Massachusetts Department of Fisheries, Wildlife, and Environmental Law Enforcement (K.R. Simmons, Massachusetts Department of Fisheries, Wildlife, and Environmental Law Enforcement, written commun., April 1997), it has been used for water-resource planning and management at various times by most New England States. For these reasons, use of the wetted-perimeter threshold method may not be a useful criterion for determining instream-flow requirements for streams in Massachusetts.
Limitations of Analysis
The primary limitation of this study is the assumption that the wetted perimeter and other hydraulic-geometry characteristics measured at individual USGS streamflow-gaging stations are representative of the riffle reaches of the streams where
Analysis of Relations Between Discharge and Wetted Perimeter and Other Hydraulic-Geometry Characteristics 15

the wetted-perimeter criterion is meant to be applicable. In this study, gaging stations in both riffle and non-riffle reaches were selected for analysis to evaluate wetted perimeter and other hydraulic- geometry characteristics at different stream-channel environments at which the gaging stations are located. The locations of USGS streamflow-gaging stations are selected primarily for reasons of gage and section control, accessibility, and position of the site in reference to downstream confluences. Stream reaches selected for aquatic-habitat evaluation, however, should reflect the habitat requirements of the species of interest. In a study of hydraulic-geometry relations near 14 USGS streamflow-gaging stations in the Sangamon and South Fork Sangamon River basins in central Illinois, Singh and Broeren (1989) concluded that hydraulic-geometry relations derived from the USGS measurements generally reflected near-riffle conditions; however, adjustment factors for the USGS channel top width, channel-depth, and flow-velocity measurements were needed to convert the USGS measurements to reach-average values. Because no assessment was made during this investigation of the representativeness of the stream reaches at the 24 USGS streamflow-gaging stations, it is difficult to draw conclusions about the discharge, wetted perimeter, and other hydraulic-geometry characteristics at other reaches along the streams. Collection of discharge and wetted-perimeter data at a variety of stream-reach types along several representative streams in Massachusetts would be needed to evaluate the representativeness of such data collected at USGS streamflow-gaging stations. Nevertheless, the close correlation between the exponents calculated for the power-function models of channel top width, channel depth, and flow velocity at the 24 stations with those calculated by previous investigators (for example, Leopold and Maddock, 1953; Park, 1977; Williams, 1978) would indicate that the reaches in which the USGS stations are located may be typical of streams in Massachusetts, at least with respect to the discharge and hydraulic geometry relations.
An additional limitation of the analysis is that the types of sediments comprising the streambeds and stream banks and the character of the sediment load at the 24 stations were not evaluated. These factors have
been shown to affect the hydraulic geometry of stream channels (Hedman and Osterkamp, 1982; Leopold, 1994).
The low values of discharge at the points of maximum curvature calculated by the analytical method may reflect, in part, the limitations of assuming a power-function relation between discharge and wetted perimeter and the use of the point of maximum curvature as the first break in slope on the discharge and wetted-perimeter graphs. These power-function relations were assumed on the basis of previous theoretical studies on the hydraulic geometry of stream channels (Leopold and Maddock, 1953; Leopold and Langbein, 1962; Langbein, 1964; Smith, 1974; and Williams, 1978). A more complicated, perhaps multiple-parameter or nonlinear, function might better represent the discharge and wetted-perimeter relations and lead to somewhat higher values of discharge at the point of maximum curvature than does the power- function relation, but would be contrary to theory. Nevertheless, the calculated points of maximum curvature are generally consistent with the low discharges at which the transition from a steeply rising to a very small increase in wetted perimeter is seen on the graphs.
No attempt was made during this study to evaluate aquatic-habitat availability at or ecological responses to different discharge and wetted-perimeter conditions at individual stream sections. Future field investigations would be needed to evaluate the response of aquatic biota of streams in Massachusetts to changes in discharge and wetted perimeter.
SUMMARY AND CONCLUSIONS
Relations between discharge and wetted perimeter and other hydraulic-geometry characteristics (channel top width, channel depth, and flow velocity) were developed from streamflow and stream-channel data collected at 24 U.S. Geological Survey streamflow-gaging stations in Massachusetts. In addition, the applicability of the use of the wetted- perimeter threshold method, which is based on the relation between discharge and wetted perimeter at a streamflow-measurement site, to the determination of instream-flow requirements for Massachusetts streams was evaluated. The wetted-perimeter method is one of the methods being considered for establishing
16 Relations Between Discharge and Wetted Perimeter and Other Hydraulic-Geometry Characteristics, Massachusetts

instream-flow requirements for Massachusetts streams. The 24 stations selected for analysis are distributed fairly uniformly throughout Massachusetts and have drainage areas that range from less than 5 to nearly 300 mi2.
Wetted perimeter has a strong positive correlation to channel top width at each of the 24 stations. Linear correlations between discharge and wetted perimeter also are positive but not as strong as those between wetted perimeter and channel top width. Data at most stations show that wetted perimeter tends to increase sharply with increases in discharge at very low discharges and to increase gradually at low to moderate discharges, which is consistent with results of previous investigations. At other stations, wetted perimeter is nearly constant at all discharges. Stations at which there is a substantial increase in wetted perimeter with increases in discharge tend to be in riffle reaches of the streams that have gradual- sloped streambanks. The stations for which wetted perimeter is nearly constant are those at which discharge measurements are made in pools or in stream reaches with little or no bed slopes, and where the streambanks are nearly vertical at water levels up to bankfull conditions.
Power-function regression models (equations) of the form Y = c^Q 2 (where the dependent variable Y is wetted perimeter, channel top width, channel depth, or flow velocity; Q is discharge; and Cj and c2 are coefficients) were used to define relations between discharge and hydraulic-geometry characteristics. The regression models between discharge and wetted perimeter were similar to those between discharge and channel top width because wetted perimeter and channel top width were highly correlated at each station. Mean values of the exponents (c2 ) for the 24 stations were 0.16 for wetted perimeter and channel top width, 0.30 for channel depth, and 0.55 for flow velocity. The mean values for channel top width, channel depth, and flow velocity are consistent with previously determined at-a-station hydraulic-geometry exponents. These results indicate that at the individual stream sections used in this study, wetted perimeter and channel top width tend to change very little with discharge, channel depth changes moderately with discharge, and flow velocity changes most substantially with discharge. This implies that for the most part, the stream sections generally are rectangular and have
channel widths that greatly exceed mean channel depths. At all but the lowest flows, the full base width of the stream channels is wetted. As discharge increases, channel width remains virtually constant or increases very gradually up to bankfull conditions, and depth remains small relative to width. The goodness of fit of the discharge and wetted perimeter regression models, as measured by the adjusted coefficient of determination (/?2«0)t tends to be low; values of R^adj range from 0.05 to 0.73, with a mean of 0.48 for all 24 models.
The transition on the discharge and wetted- perimeter graphs from a steep slope at very low discharges to a gradual slope at higher discharges is identified by a single pair of discharge and wetted- perimeter values at a point that is referred to as the point of maximum curvature. Above this point, increases in discharge result in small increases in wetted perimeter, whereas below this point, decreases in discharge result in large decreases in wetted perimeter. For the 24 stations evaluated, this point generally occurs in the region of lowest discharges. An analytical method used to determine the point of maximum curvature for each of the discharge and wetted-perimeter relations indicated that at 16 of the 24 gaging stations, the point of maximum curvature is at the discharge equaled or exceeded 99 percent of the time or greater for the period of record, and all of the points of maximum curvature are at discharges equaled or exceeded 88 percent of the time or greater. Overall, the point of maximum curvature is somewhat insensitive to discharge, as all of the calculated points are in the lowest region of discharge. Use of a single, regional flow-duration value to estimate the point of maximum curvature for all stream sections in Massachusetts, however, would not adequately represent the variability in flow-duration values at the points of maximum curvature seen in this study. In addition, all of the points are at discharges that are less than the 0.5 (ft3/s)/mi2 Aquatic Base Flow guideline used by the U.S. Fish and Wildlife Service as an estimate of the summer-time minimum discharge per square mile of drainage area required for maintenance of habitat for biota in New England streams. For these reasons, use of the wetted-perimeter threshold method may not be a useful criterion for determining instream- flow requirements for streams in Massachusetts.
Summary and Conclusions 17
REFERENCES CITED
Alien, P.M., Arnold, J.G., and Byars, B.W., 1994,Downstream channel geometry for use in planning- level models: Water Resources Bulletin, v. 30, no. 4, p. 663-671.
Annear, T.C., and Conder, A.L., 1984, Relative bias of several fisheries instream flow methods: North American Journal of Fisheries Management, v. 4, p. 531-539.
Anton, Howard, 1980, Calculus with analytic geometry: New York, John Wiley and Sons, 1099 p.
Benson, M.A., and Dalrymple, Tate, 1967, General field and office procedures for indirect discharge measurements:, U.S. Geological Survey Techniques of Water-Resources Investigations, book 3, chap. Al, 30 p.
Bleed, A.S., 1987, Limitations of concepts used to determine instream flow requirements for habitat maintenance: Water Resources Bulletin, v. 23, no. 6, p. 1173-1178.
Chow, V.T., 1959, Open-channel hydraulics: New York, McGraw-Hill, 680 p.
Gordon, N.D., McMahon, T. A., and Finlayson, B.L., 1992, Stream hydrology :an introduction for ecologists: Chichester, England, John Wiley and Sons, 526 p.
Hedman, E.R., and Osterkamp, W.R., 1982, Streamflow characteristics related to channel geometry of streams in western United States: U.S. Geological Survey Water-Supply Paper 2193,17 p.
Langbein, W.B., 1964, Geometry of river channels: Journal of the Hydraulics Division, Proceedings of the American Society of Civil Engineers, v. 90, no. HY2, p. 301-312.
Leopold, L.B., 1994, A view of the river: Cambridge, Mass. Harvard University Press, 298 p.
Leopold, L.B., and Langbein, W.B., 1962, The concept of entropy in landscape evolution: U.S. Geological Survey Professional Paper 500-A, 20 p.
Leopold, L.B., and Maddock, Thomas, Jr., 1953, The hydraulic geometry of stream channels and some physiographic implications: U.S. Geological Survey Professional Paper 252, 57 p.
Leopold, L.B., Wolman, M.G., and Miller, J.P., 1964, Fluvial processes in geomorphology: San Francisco, California, W.H. Freeman and Company, 522 p.
McMahon, T.A., 1993, Hydrologic design for water use, in Maidment, D.R., ed., Handbook of hydrology: New York, McGraw-Hill, p. 27.1-27.51.
Nelson, F.A., 1984, Guidelines for using the wettedperimeter (WETP) computer program of the Montana Department of Fish, Wildlife and Parks: Bozeman, Montana, Montana Department of Fish, Wildlife and Parks, various pagination.
O'Shea, D.T., 1995, Estimating minimum instream flow requirements for Minnesota streams from hydrologic data and watershed characteristics: North American Journal of Fisheries Management, v. 15, p. 569-578.
Park, C.C., 1977, World-wide variations in hydraulicgeometry exponents of stream channels an analysis and some observations: Journal of Hydrology, v. 33, p. 133-146.
SAS Institute Inc., 1990, SAS/STAT user's guide, version 6, fourth edition: Gary, North Carolina, 1686 p.
Singh, K.P., and Broeren, S.M., 1989, Hydraulic geometry of streams and stream habitat assessment: Journal of Water Resources Planning and Management, v. 115, no. 5, p. 583-597.
Smith, T.R., 1974, A derivation of the hydraulic geometry of steady-state channels from conservation principles and sediment transport laws: Journal of Geology, v. 82, p. 98-104.
U.S. Fish and Wildlife Service, 1981, Interim regional policy of New England stream flow recommendations: Newton Corner, MA.
Wesche, T.A., and Rechard, P.A., 1980, A summary ofinstream flow methods for fisheries and related research needs: Eisenhower Consortium for Western Environmental Forestry Research Bulletin 9,122 p.
Williams, G.P., 1978, Hydraulic geometry of river cross sections theory of minimum variance: U.S. Geological Survey Professional Paper 1029,47 p.
18 Relations Between Discharge and Wetted Perimeter and Other Hydraulic-Geometry Characteristics, Massachusetts

FIGURES 4-27


160.
PERCENT EXCEEDENCE
CALCULATED WETTED PERIMETER AND DISCHARGE MODEL
+ MEASURED WETTED PERIMETER
95-PERCENT CONFIDENCE INTERVALS FOR POINT OF MAXIMUM CURVATURE
UJ UJ
QC UJ
UJ
QC LLJ Q_Q UJ
O LLJ Q UJ
5 UJ O X UJ
10 CCOO UJ
A POINT OF MAXIMUM CURVATURE
40 80 120 160 200 240
DISCHARGE, IN CUBIC FEET PER SECOND280
Figure 4. Discharge, wetted perimeter, and flow duration for Squannacook River near West Groton, Massachusetts (station 01096000).
Figure 4-27 21

PERCENTEXCEEDENCE
CALCULATED WETTED PERIMETER AND DISCHARGE MODEL
MEASURED WETTED PERIMETER
O 95-PERCENT CONFIDENCE INTERVALSFOR POINT OF MAXIMUM CURVATURE
POINT OF MAXIMUM CURVATURE
80 120 160 200 240
DISCHARGE, IN CUBIC FEET PER SECOND
Figure 5. Discharge, wetted perimeter, and flow duration for Assabet River at Maynard, Massachusetts (station 01097000).
22 Relations Between Discharge and Wetted Perimeter and Other Hydraulic-Geometry Characteristics, Massachusetts
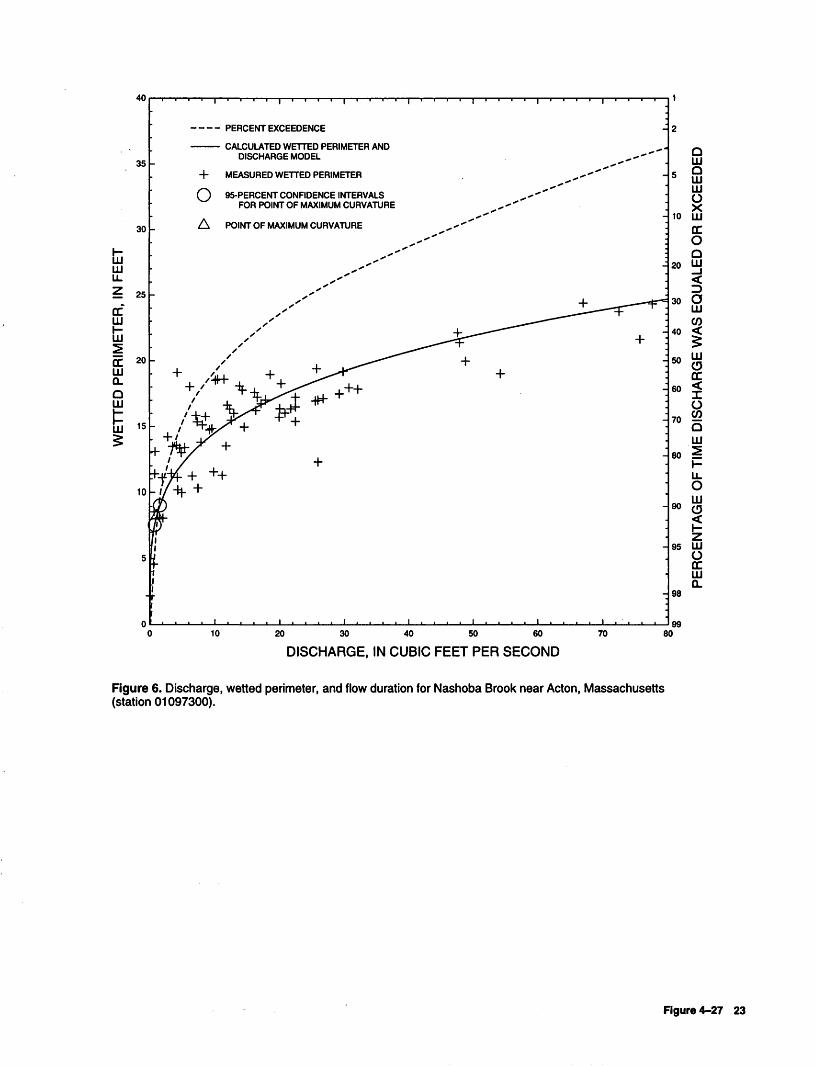
LU UJ
40
35
30
PERCENT EXCEEDENCE
CALCULATED WETTED PERIMETER AND DISCHARGE MODEL
+ MEASURED WETTED PERIMETER
O 95-PERCENT CONFIDENCE INTERVALSFOR POINT OF MAXIMUM CURVATURE
A POINT OF MAXIMUM CURVATURE
10 20 30 40 50 60
DISCHARGE, IN CUBIC FEET PER SECOND
7099
80
Figure 6. Discharge, wetted perimeter, and flow duration for Nashoba Brook near Acton, Massachusetts (station 01097300).
Figure 4-27 23

40
35
PERCENT EXCEEDENCE
CALCULATED WETTED PERIMETER AND DISCHARGE MODEL
+ MEASURED WETTED PERIMETER
O 95-PERCENT CONFIDENCE INTERVALSFOR POINT OF MAXIMUM CURVATURE
A POINT OF MAXIMUM CURVATURE
20 40 60 80 100
DISCHARGE, IN CUBIC FEET PER SECOND
Q LU Q
5 LU LU O X
Figure 7. Discharge, wetted perimeter, and flow duration for Parker River at Byfield, Massachusetts (station 01101000).
24 Relations Between Discharge and Wetted Perimeter and Other Hydraulic-Geometry Characteristics, Massachusetts

ocu
300
280
260
240
UJ 22°
LULLz 200
ofLU 180
&;! 160
LU°- 140
OHI
E 120>
100
8<V
60
40
20
0 (
-
PERCENT EXCEEDENCE
CALCULATED WETTED PERIMETER ANDDISCHARGE MODEL ~
+ MEASURED WETTED PERIMETER ;
O 95-PERCENT CONFIDENCE INTERVALS FOR POINT OF MAXIMUM CURVATURE '
A POINT OF MAXIMUM CURVATURE ':
_..- *"""""
,.- """ |_ ^****"
^^"" -
~~~~~~ '' ~"~ -**""
**^^ ** ]
- *"* ^^**
: ..- '" I^ s
s s
s
/ "f" i _L *4- -1- -P^"| -4- 1
+ JH^ il 1+1+ H 4 ^+ 4: + + ;' {^f\ / 4"VV_x TT /r
) -K// :
/ J/
y
»/
» ;
> 50 100 150 200 250 300 350 400 450 5(
1
2
QLUQ
5 LUUJO X
10 LU CCOo
20 Ij^D
30 Q
0340 ^
LUso (5
CC
60 x
O03
70 Q
LU
.0 =
LLOLU
90 O
z95 g
CCLUQ.
98
99 X)
DISCHARGE, IN CUBIC FEET PER SECOND
Figure 8. Discharge, wetted perimeter, and flow duration for Charles River at Dover, Massachusetts (station 01103500).
Figure 4-27 25

40
35
30
LLJ UJ U_
25
PERCENT EXCEEDENCE
CALCULATED WETTED PERIMETER AND DISCHARGE MODEL
-|- MEASURED WETTED PERIMETER
O 95-PERCENT CONFIDENCE INTERVALSFOR POINT OF MAXIMUM CURVATURE
A POINT OF MAXIMUM CURVATURE
20 40 60 80 100
DISCHARGE, IN CUBIC FEET PER SECOND
50
80O LU
90
95
LU O
UJ 0_
98
99120
Figure 9. Discharge, wetted perimeter, and flow duration for Old Swamp River near South Weymouth, Massachusetts (station 01105600).
26 Relations Between Discharge and Wetted Perimeter and Other Hydraulic-Geometry Characteristics, Massachusetts

80
PERCENT EXCEEDENCE
10
CALCULATED WETTED PERIMETER AND DISCHARGE MODEL
+ MEASURED WETTED PERIMETER
O 95-PERCENT CONFIDENCE INTERVALSFOR POINT OF MAXIMUM CURVATURE
A POINT OF MAXIMUM CURVATURE
40 80 120 160 200
DISCHARGE, IN CUBIC FEET PER SECOND
80 I'
LL O LU
1LU
95 O CC LU QL
98
99240
Figure 10. Discharge, wetted perimeter, and flow duration for Indian Head River at Hanover, Massachusetts (station 01105730).
Rgure4-27 27

CALCULATED WETTED PERIMETER AND DISCHARGE MODEL
35 - + MEASURED WETTED PERIMETER
O 95-PERCENT CONFIDENCE INTERVALSFOR POINT OF MAXIMUM CURVATURE
30
UJ UJ
25CC UJtDg 20Q.Q UJ
is
10
PERCENT EXCEEDENCE
A POINT OF MAXIMUM CURVATURE
10 15 20 25 30
DISCHARGE, IN CUBIC FEET PER SECOND
35
2 QUJoUJLU5 SLU CC10 o oUJ
20
OUJ
30
40
CD50 ^
I
60 00
Q70 UJ
O LUCD
UJ O
95
98
UJ Q_
9940
Figure 11. Discharge, wetted perimeter, and flow duration for Quashnet River at Waquoit Village, Massachusetts (station 011058837).
28 Relations Between Discharge and Wetted Perimeter and Other Hydraulic-Geometry Characteristics, Massachusetts
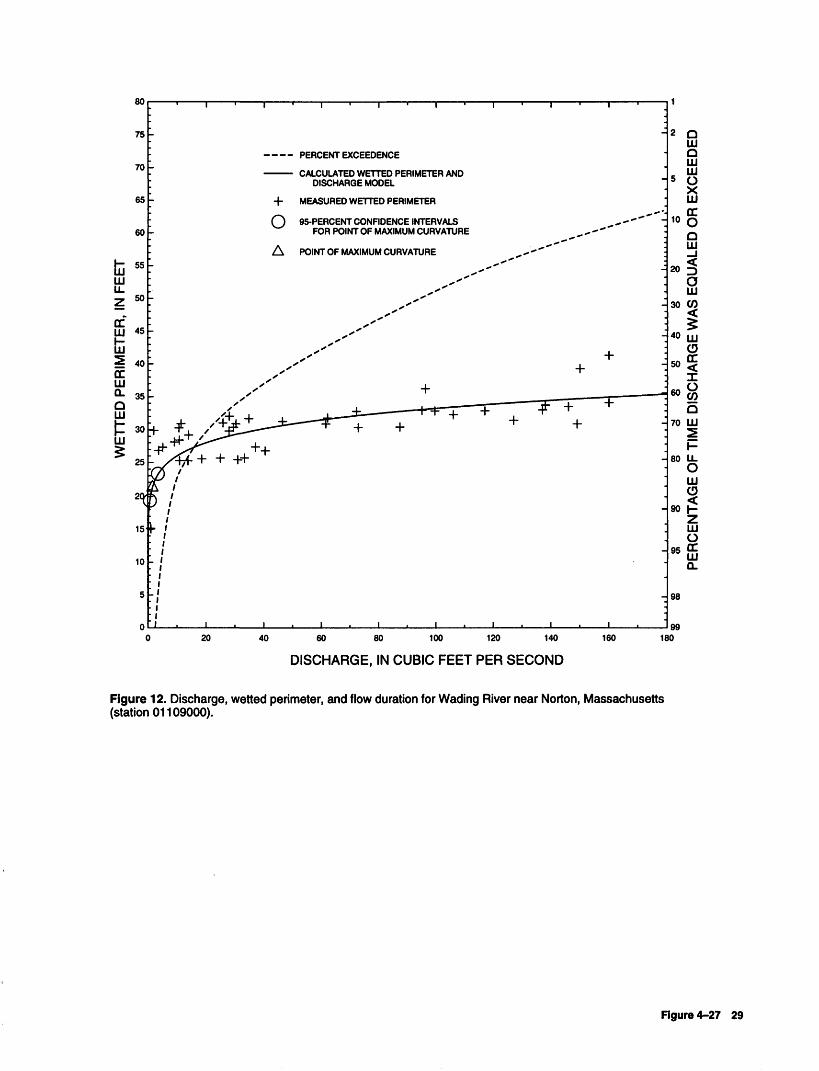
UJ
PERCENT EXCEEDENCE
CALCULATED WETTED PERIMETER AND DISCHARGE MODEL
+ MEASURED WETTED PERIMETER
O 95-PERCENT CONFIDENCE INTERVALSFOR POINT OF MAXIMUM CURVATURE
A POINT OF MAXIMUM CURVATURE
20 40 60 80 100 120 140
DISCHARGE, IN CUBIC FEET PER SECOND
160
2 Q UJ O UJ
io §Q LLJ
20 DOUJ
30 CO
040 QJ
"1
-§Q
70 UJ
80 _oLD
95
UJ O
UJ Q.
98
99180
Figure 12. Discharge, wetted perimeter, and flow duration for Wading River near Norton, Massachusetts (station 01109000).
Figure 4-27 29

LLJ LU
20
15
10
PERCENTEXCEEDENCE
CALCULATED WETTED PERIMETER AND DISCHARGE MODEL
+ MEASURED WETTED PERIMETER
O 95-PERCENT CONFIDENCE INTERVALSFOR POINT OF MAXIMUM CURVATURE
A POINT OF MAXIMUM CURVATURE
20 40 60 80 100 120 140 160 180
DISCHARGE, IN CUBIC FEET PER SECOND
200
10
Q LLJ Q LLJ LLJ O X LLJQC OO LLJ
20 I
IDO
30 LLJ CO
40 >
LLJ50
60 XO CO
70 Q
LLJ
80
O LLJ
90
LU 95 Q
QC LLJ Q.
98
99220
Figure 13. Discharge, wetted perimeter, and flow duration for Ten Mile River at Pawtucket Avenue at East Providence, R.I. (station 01109403).
30 Relations Between Discharge and Wetted Perimeter and Other Hydraulic-Geometry Characteristics, Massachusetts

PERCENT EXCEEDENCE
CALCULATED WETTED PERIMETER AND DISCHARGE MODEL
+ MEASURED WETTED PERIMETER
O 95-PERCENT CONFIDENCE INTERVALSFOR POINT OF MAXIMUM CURVATURE
A POINT OF MAXIMUM CURVATURE
Q HI Q HI HI O X HIccOQ HI
DISCHARGE, IN CUBIC FEET PER SECOND
Figure 14. Discharge, wetted perimeter, and flow duration for West River below West Hill Dam near Uxbridge, Massachusetts (station 01111200).
Figure 4-27 31

40
in u.
cc uj
I5:UJ Q.Q UJ
PERCENT EXCEEDENCE
CALCULATED WETTED PERIMETER AND DISCHARGE MODEL
MEASURED WETTED PERIMETER
O 95-PERCENT CONFIDENCE INTERVALSFOR POINT OF MAXIMUM CURVATURE
POINT OF MAXIMUM CURVATURE
10 15 20 25 30 35 40 45
DISCHARGE, IN CUBIC FEET PER SECOND
50 55
Figure 15. Discharge, wetted perimeter, and flow duration for Nipmuc River near Harrisville, R.I. (station 01111300).
32 Relations Between Discharge and Wetted Perimeter and Other Hydraulic-Geometry Characteristics, Massachusetts

fc111 u_
DC LU
LU2 40DC LLI Q_Q LU
LU
35
PERCENT EXCEEDENCE
CALCULATED WETTED PERIMETER AND DISCHARGE MODEL
+ MEASURED WETTED PERIMETER
O 95-PERCENT CONFIDENCE INTERVALSFOR POINT OF MAXIMUM CURVATURE
A POINT OF MAXIMUM CURVATURE
40 60 80 100 120 140 160
DISCHARGE, IN CUBIC FEET PER SECOND
180
2Q LU Q LU
5 LU
LU 10 DC
OQ LU
20
30
OLLI
CO
LU O
50 CC <
60 Q CO
80U_ O LLI(3
90 <
LU
LU Q.
98
99200
Figure 16. Discharge, wetted perimeter, and flow duration for Priest Brook near Winchendon, Massachusetts (station 01162500).
Figure 4-27 33
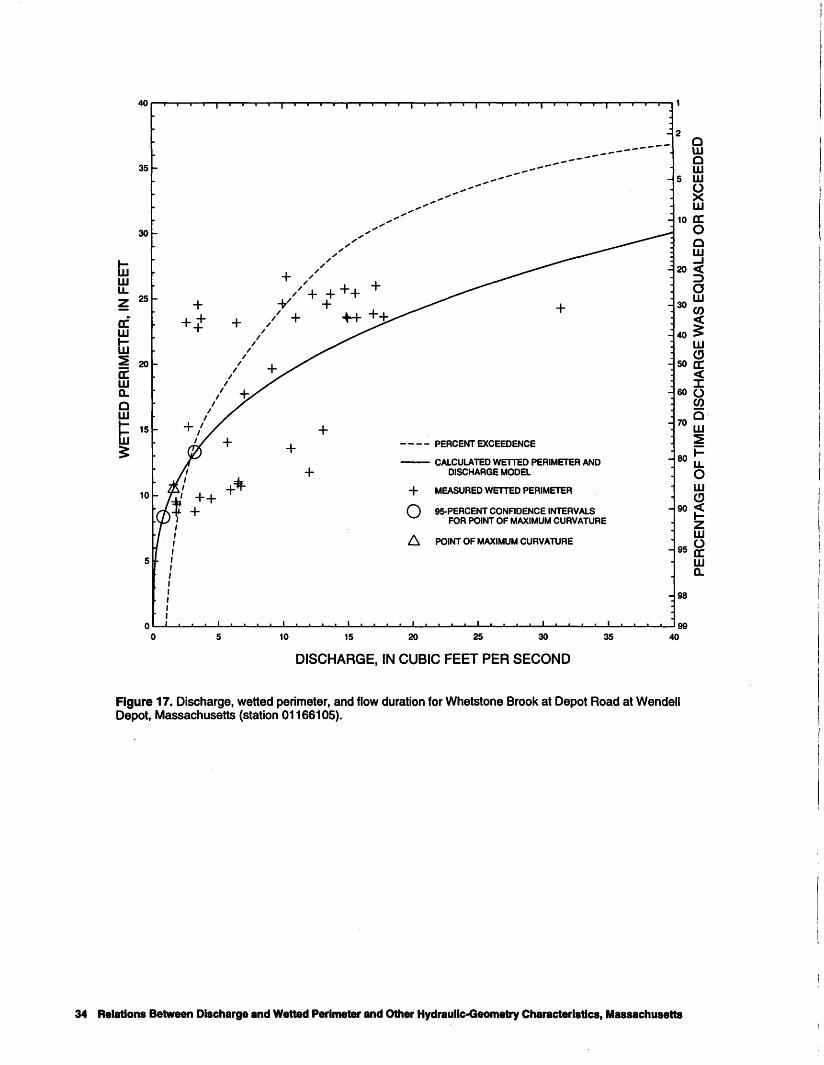
CALCULATED WETTED PERIMETER AND DISCHARGE MODEL
+ MEASURED WETTED PERIMETER
95-PERCENT CONFIDENCE INTERVALS FOR POINT OF MAXIMUM CURVATURE
A POINT OF MAXIMUM CURVATURE
10 15 20 25 30 35
DISCHARGE, IN CUBIC FEET PER SECOND
Figure 17. Discharge, wetted perimeter, and flow duration for Whetstone Brook at Depot Road at Wendell Depot, Massachusetts (station 01166105).
34 Relations Between Discharge and Wetted Perimeter and Other Hydraulic-Geometry Characteristics, Massachusetts
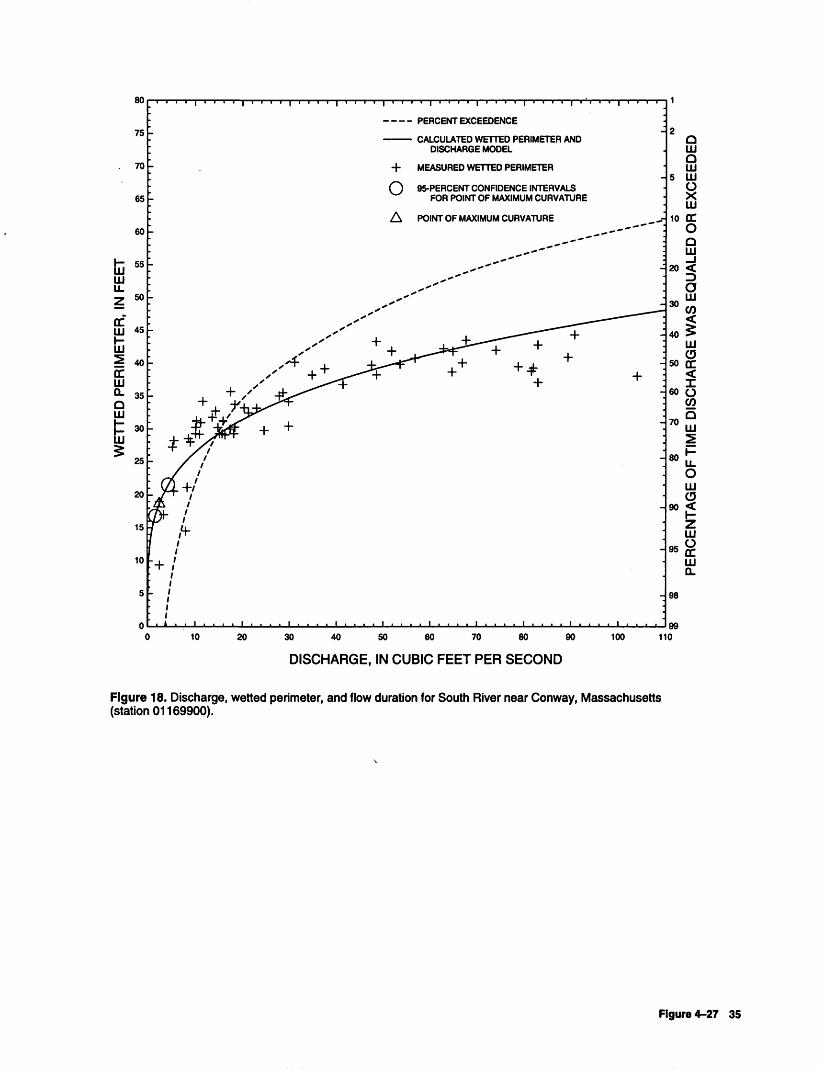
PERCENTEXCEEDENCE
CALCULATED WETTED PERIMETER AND DISCHARGE MODEL
MEASURED WETTED PERIMETER
95-PERCENT CONFIDENCE INTERVALS FOR POINT OF MAXIMUM CURVATURE
POINT OF MAXIMUM CURVATURE
20 30 40 50 60 70 80 90
DISCHARGE, IN CUBIC FEET PER SECOND
too99
110
Figure 18. Discharge, wetted perimeter, and flow duration for South River near Conway, Massachusetts (station 01169900).
Figure 4-27 35

fcLLJ
160
150
140
130
120
110
100
90CC LU
fti 80CCLUQ- 70Q UJ
PERCENTEXCEEDENCE
j!
CALCULATED WETTED PERIMETER AND DISCHARGE MODEL
+ MEASURED WETTED PERIMETER
O 95-PERCENT CONFIDENCE INTERVALSFOR POINT OF MAXIMUM CURVATURE
A POINT OF MAXIMUM CURVATURE
50 100 150 200 250 300
DISCHARGE, IN CUBIC FEET PER SECOND
350
2Q UJ Q UJ
5 UJ O X LU
10 CC OO LU
20 <
Oon
40 > LU O
50 CC
60CO
80 u_ OLU O
90 <
LU-8UJ Q.
98
99400
Rgure 19. Discharge, wetted perimeter, and flow duration for Green River near Colrain, Massachusetts (station 01170100).
36 Relations Between Discharge and Wetted Perimeter and Other Hydraulic-Geometry Characteristics, Massachusetts
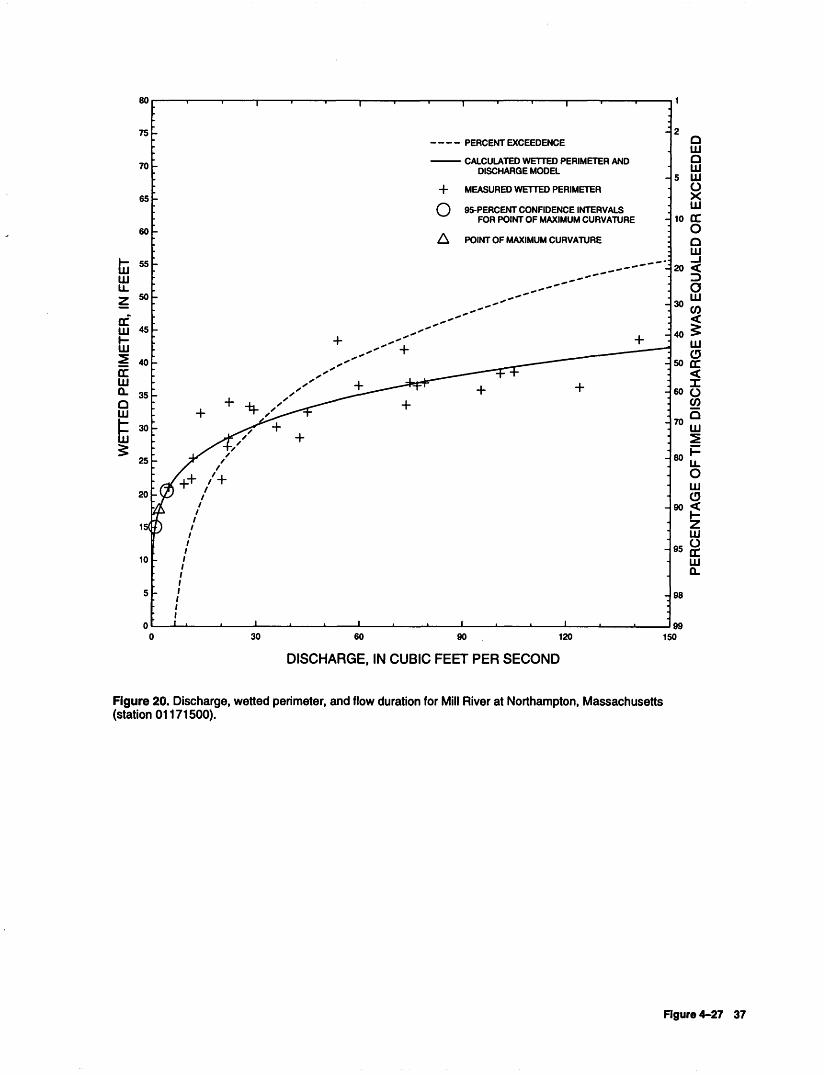
PERCENTEXCEEDENCE
CALCULATED WETTED PERIMETER AND DISCHARGE MODEL
MEASURED WETTED PERIMETER
O 95-PERCENT CONFIDENCE INTERVALSFOR POINT OF MAXIMUM CURVATURE
POINT OF MAXIMUM CURVATURE
60 90 120
DISCHARGE, IN CUBIC FEET PER SECOND
Figure 20. Discharge, wetted perimeter, and flow duration for Mill River at Northampton, Massachusetts (station 01171500).
Figure 4-27 37

40.
-- PERCENT EXCEEDENCE
CALCULATED WETTED PERIMETER AND DISCHARGE MODEL
+ MEASURED WETTED PERIMETER
O 95-PERCENT CONFIDENCE INTERVALSFOR POINT OF MAXIMUM CURVATURE
A POINT OF MAXIMUM CURVATURE
10 20 30 40 50 60 70 80 90 100 110
DISCHARGE, IN CUBIC FEET PER SECOND
2 oUJ Q UJ5 SXUJ
10 CC O O UJ
20 <
OUJ
30 CO<I
40 > UJ CD
50 CC
I60 O
CO
7° 280 U.
OUJ CD
90 <
95
UJ
cC UJa.
99120
Figure 21. Discharge, wetted perimeter, and flow duration for Sevenmile River near Spencer, Massachusetts (station 01175670).
38 Relations Between Discharge and Wetted Perimeter and Other Hydraulic-Geometry Characteristics, Massachusetts

+ + H-
PERCENT EXCEEDENCE
50 100 150 200 250 300 350 400 450
DISCHARGE, IN CUBIC FEET PER SECOND
99500 550
Figure 22. Discharge, wetted perimeter, and flow duration for Quaboag River at West Brimfield, Massachusetts (station 01176000).
Rgure4-27 39

HI
ccUJ
CC HI Q_O UJ
I
160
150
140
130
120
110
100
90
80
70
60
50
40
SO1
10
PERCENT EXCEEDENCE
CALCULATED WETTED PERIMETER AND DISCHARGE MODEL
+ MEASURED WETTED PERIMETER
O 95-PERCENT CONFIDENCE INTERVALSFOR POINT OF MAXIMUM CURVATURE
A POINT OF MAXIMUM CURVATURE
40 320
2O UJ O LU
5 UJ O X UJ
10 CCO O UJ
20 <
.1
50
UJO
60
70
CO Q UJ
80 LL oLU
90 <
zLU
8LU CL
98
99360
Figure 23. Discharge, wetted perimeter, and flow duration for Middle Branch Westfield River at Goss Heights, Massachusetts (station 01180500).
40 Relations Between Discharge and Wetted Perimeter and Other Hydraulic-Geometry Characteristics, Massachusetts
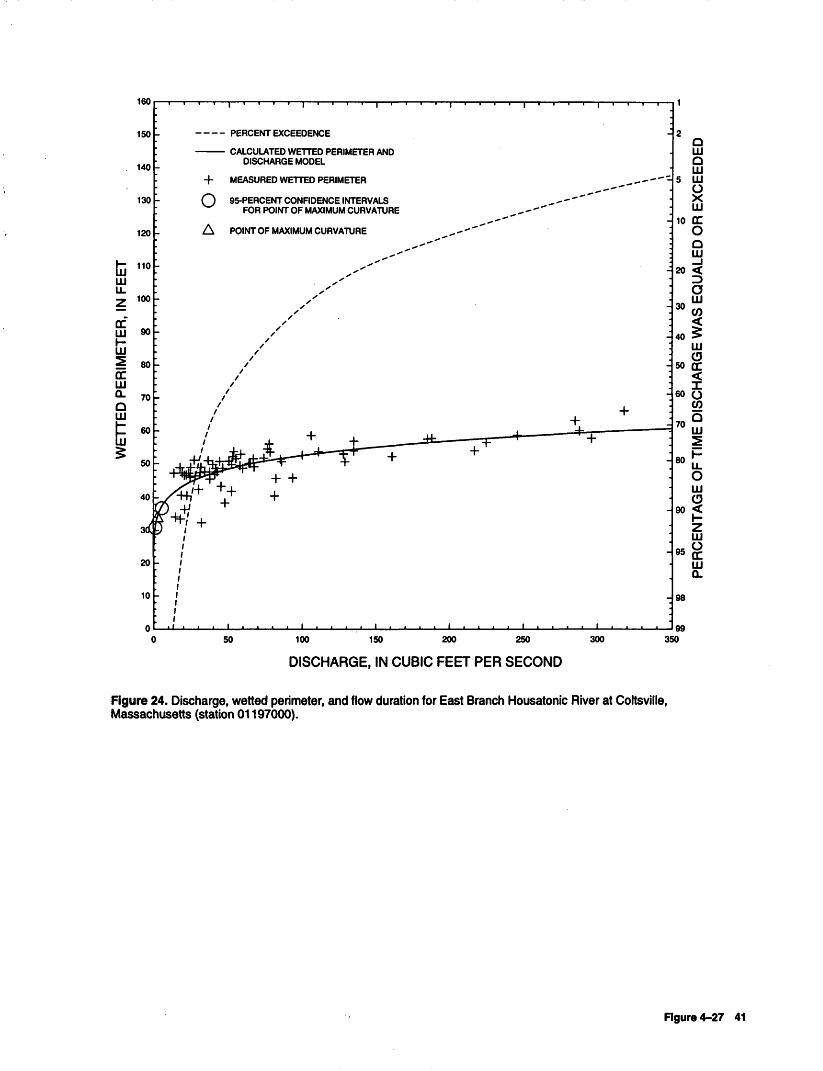
160
150
140
130
120
110
20
10
PERCENT EXCEEDENCE
CALCULATED WETTED PERIMETER AND DISCHARGE MODEL
+ MEASURED WETTED PERIMETER
O 95-PERCENT CONFIDENCE INTERVALSFOR POINT OF MAXIMUM CURVATURE
A POINT OF MAXIMUM CURVATURE
50
2Q LU O UJ
5 UJ
gUJ
10 QCOO UJ
20 <
O
UJ O
50 OC <
60 Q CO
«80
OUJO
90
UJ
2UJ Q.
98
99350
Figure 24. Discharge, wetted perimeter, and flow duration for East Branch Housatonic River at Coltsville, Massachusetts (station 01197000).
Rgure 4-27 41

tn
160
150
140
130
120
no
40
30
20
10
PERCENTEXCEEDENCE
CALCULATED WETTED PERIMETER AND DISCHARGE MODEL
+ MEASURED WETTED PERIMETER
O 95-PERCENT CONFIDENCE INTERVALSFOR POINT OF MAXIMUM CURVATURE
A POINT OF MAXIMUM CURVATURE
80 160 240 320 400 480 560
DISCHARGE, IN CUBIC FEET PER SECOND
Q UJ O UJ UJ O X UJ
10 cc OQ UJ
20 <
Q30 C/><
40 ^ UJ(3so ori
60 O (0Q
70 UJ
80 U_O LLJ O
90 <
95
UJ
CC UJ Q.
98
99640
Figure 25. Discharge, wetted perimeter, and flow duration for Housatonic River near Great Barrington, Massachusetts (station 01197500).
42 Relations Between Discharge and Wetted Perimeter and Other Hydraulic-Geometry Characteristics, Massachusetts

80
PERCENT EXCEEDENCE
CALCULATED WETTED PERIMETER AND DISCHARGE MODEL
MEASURED WETTED PERIMETER
95-PERCENT CONFIDENCE INTERVALS FOR POINT OF MAXIMUM CURVATURE
POINT OF MAXIMUM CURVATURE
40 60 80 100
DISCHARGE, IN CUBIC FEET PER SECOND
Figure 26. Discharge, wetted perimeter, and flow duration for North Branch Hoosic River at North Adams, Massachusetts (station 01332000).
Figure 4-27 43
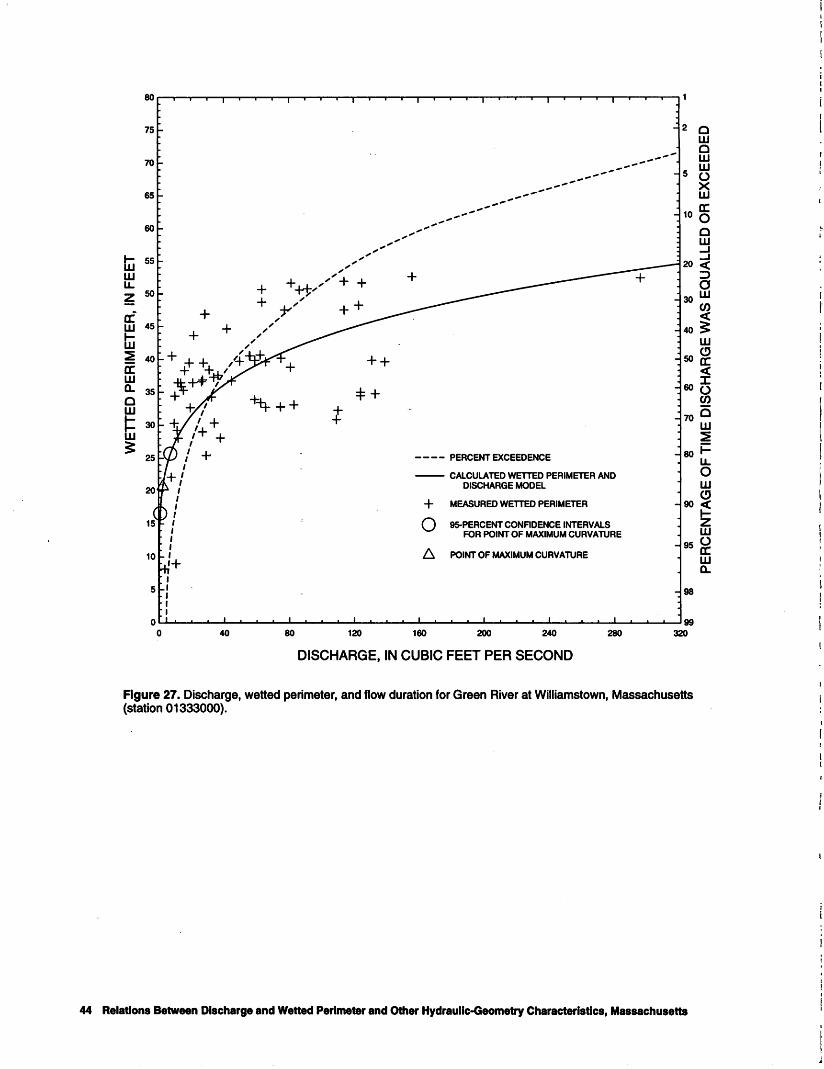
+ . , x' + +
PERCENTEXCEEDENCE
CALCULATED WETTED PERIMETER AND DISCHARGE MODEL
+ MEASURED WETTED PERIMETER
95-PERCENT CONRDENCE INTERVALS FOR POINT OF MAXIMUM CURVATURE
POINT OF MAXIMUM CURVATURE
80 120 160 200 240
DISCHARGE, IN CUBIC FEET PER SECOND
Figure 27. Discharge, wetted perimeter, and flow duration for Green River at Williamstown, Massachusetts (station 01333000).
44 Relations Between Discharge and Wetted Perimeter and Other Hydraulic-Geometry Characteristics, Massachusetts

District Chief,Massachusetts Rhode Island DistrictU.S. Geological SurveyWater Resources Division §28 Lord Rd., Suite 280Marlborough, MA 01752
wf33m
t