Embed Size (px)
Citation preview

U.S. Department of the InteriorU.S. Geological Survey
Quantifying tolerance indicator values for common stream fish
species of the United States
Michael R. Meador and Daren M. Carlisle
U.S. Geological Survey, 12201 Sunrise Valley Drive, MS 413
Reston, VA 20192, USA
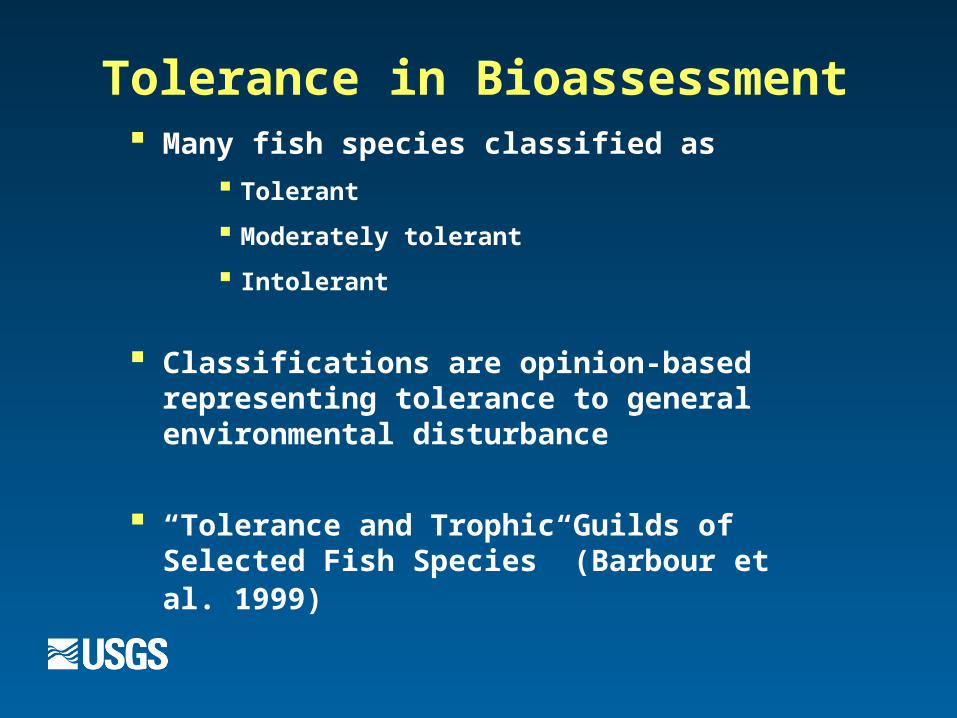
Tolerance in Bioassessment Many fish species classified as
Tolerant
Moderately tolerant
Intolerant
Classifications are opinion-based representing tolerance to general environmental disturbance
“Tolerance and Trophic Guilds of Selected Fish Species” (Barbour et al. 1999)
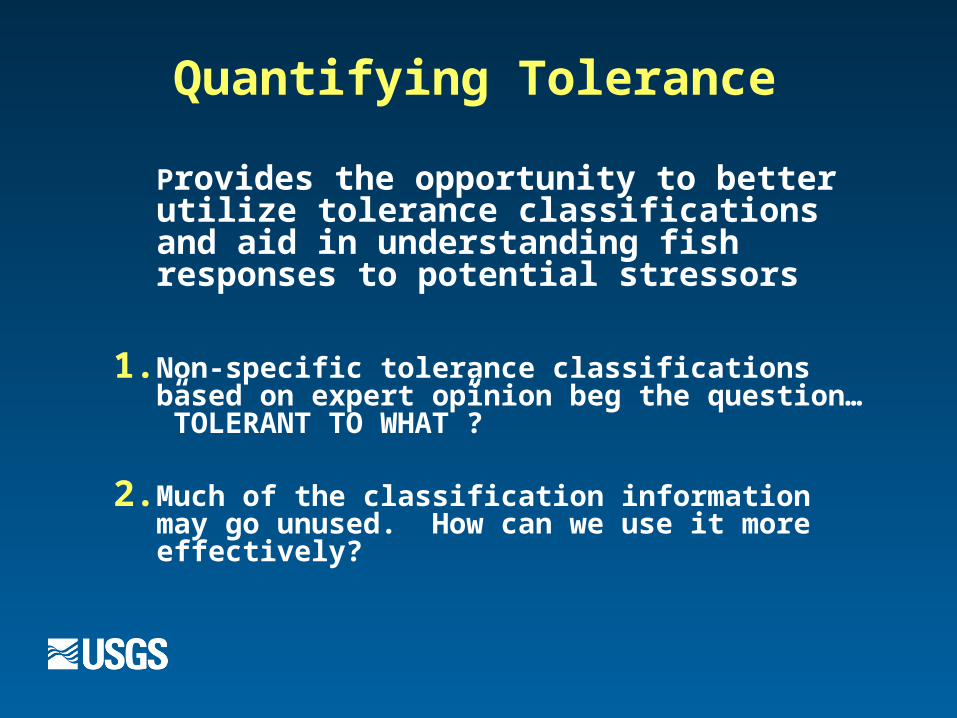
Quantifying Tolerance
Provides the opportunity to better utilize tolerance classifications and aid in understanding fish responses to potential stressors
1. Non-specific tolerance classifications based on expert opinion beg the question…”TOLERANT TO WHAT”?
2. Much of the classification information may go unused. How can we use it more effectively?
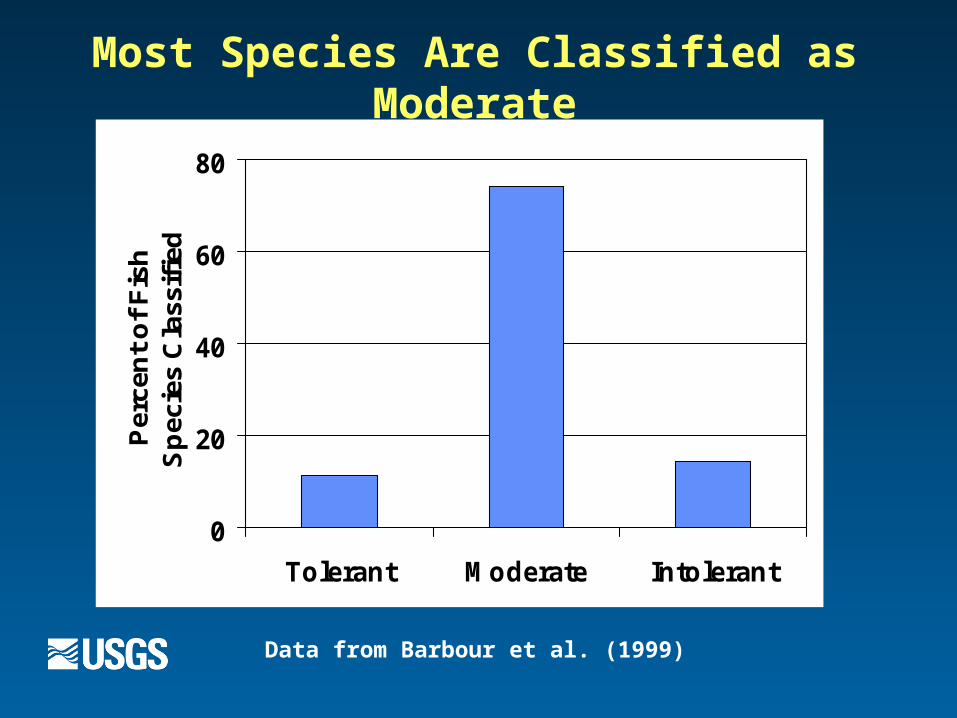
Most Species Are Classified as Moderate
0
20
40
60
80
Tolerant Moderate Intolerant
Per
cen
t o
f F
ish
S
pec
ies
Cla
ssif
ied
Data from Barbour et al. (1999)
Fish species abundance and water-quality data collected from 1993-2004 as part of the USGS National Water-Quality Assessment Program provided the opportunity to quantify fish species tolerances to selected water-quality variables
Objectives
Calculate fish species tolerance indicator values (TIVs) to selected water-quality variables from a national-scale dataset
Assess the ability of TIVs to discriminate among opinion-based tolerance classes
Application example: Use TIVs to assess relations between fish assemblages and urbanization
Study Area
Data were collected from 773 stream sites
Combined these sites are located downstream of basins that drain 43% of the total km of streams and rivers in the Nation

773 Fish and Water-Quality Sampling Sites

Methods
Fish collected during summer low-flow periods using a standard sampling protocol
Water-quality variables sampled during summer low-flow periods using standardized methods and collected within 14 days of fish sampling
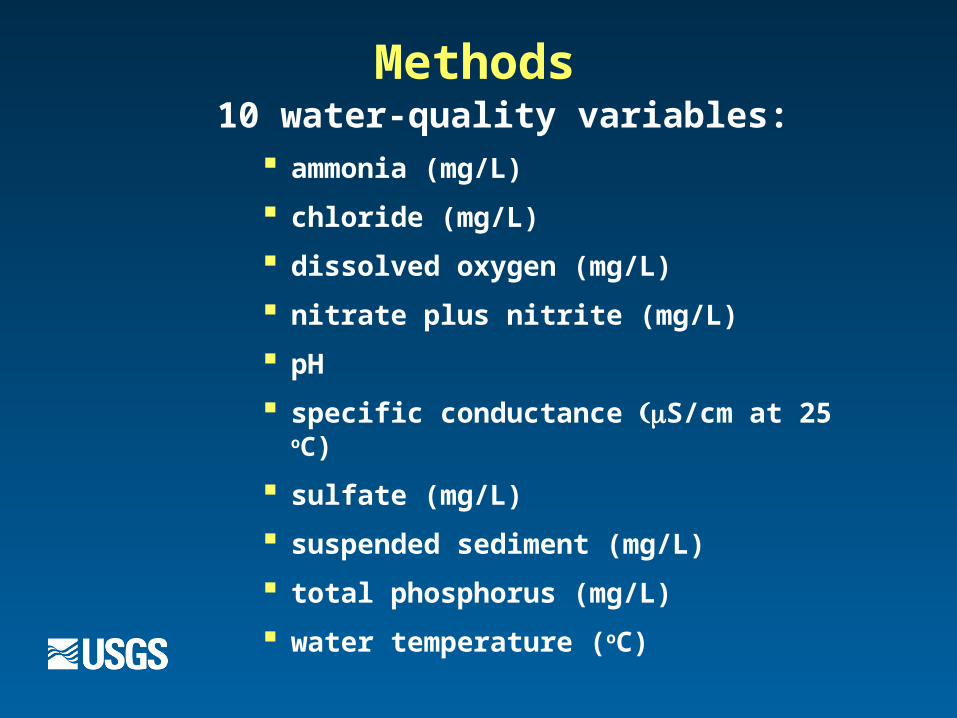
Methods10 water-quality variables:
ammonia (mg/L)
chloride (mg/L)
dissolved oxygen (mg/L)
nitrate plus nitrite (mg/L)
pH
specific conductance S/cm at 25 oC)
sulfate (mg/L)
suspended sediment (mg/L)
total phosphorus (mg/L)
water temperature (oC)
Data Analysis
TIVs calculated as predictors of water-quality (WQ) variables using fish abundance weighted averaging (WA)
Included species collected from > 60 samples and >100 individuals total (all sites combined)

Creating TIVs
Transformed weighted averages to ordinal ranks (1-10)
Ordinal rank of each species was assigned based on the percentiles of WAs across all species for each WQ variable
A rank of 1 reflected the lowest 10% of WAs whereas a rank of 10 reflected the highest 10% of WAs (except for dissolved oxygen)
Data Analysis
Principal components analysis used to assess the ability of TIVs to discriminate among opinion-based tolerance classes
Provides a means to look at patterns in the data and identify factors that help explain those patterns

Results
1,734 fish assemblage samples
583,666 individuals
485 fish species
TIVs were calculated for:
105 fish species
457,882 individuals

moderate
tolerant
intolerant
Axis 1
Axis 2
CHLORIDE
SULFATE
AMMON
PHOS
DO
COND
SUSPSED
TEMP
PH
TIVs Discriminate Among Tolerance Classes
Species

tolerant
intolerantAxis 1
Axis 2
CHLORIDE
SULFATE
AMMON
PHOS
DO
COND
SUSPSED
TEMP
PH
TIVs Distinguish Between Tolerant and Intolerant
Species

Axis 1
Axis 2
CHLORIDE
SULFATE
AMMON
PHOS
DO
COND
SUSPSED
TEMP
PH
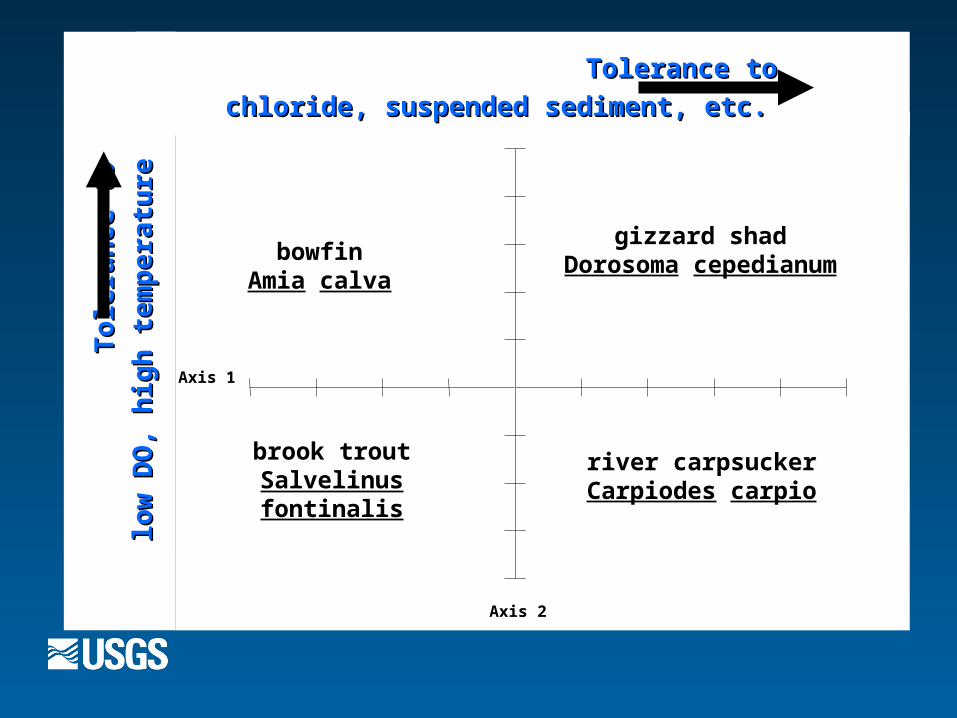
TIVs Can Be Used To Categorize Moderate
Axis 1
Axis 2
bowfinAmia calva
gizzard shadDorosoma cepedianum
brook troutSalvelinus fontinalis
river carpsuckerCarpiodes carpio
Tolerance to Tolerance to
chloride, suspended sediment, etc. chloride, suspended sediment, etc.
To
lera
nce
to
T
ole
ran
ce t
o
l
ow
DO
, hig
h t
em
pe
ratu
re
lo
w D
O, h
igh
te
mp
era
ture

Application example:Using TIVs to assess relations between fish
assemblages and urbanization
Application example: Data Analysis
Species TIVs were averaged for each of 30 sites to determine a mean TIV representing a fish assemblage for each WQ variable
Correlation analysis conducted to assess relations between mean TIVs and road density within a basin
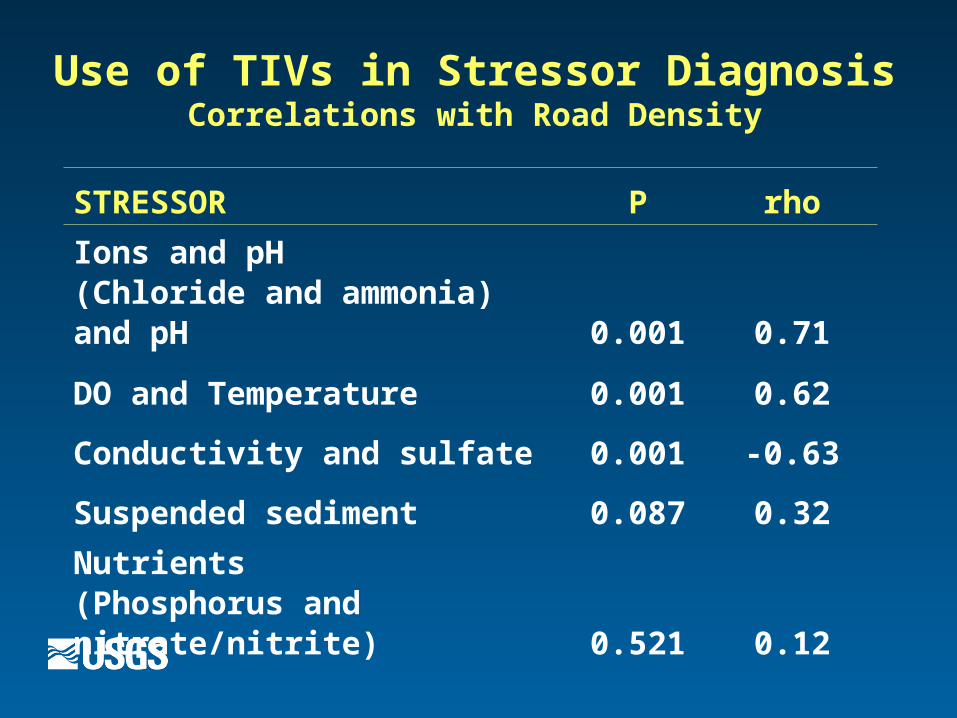
Use of TIVs in Stressor DiagnosisCorrelations with Road Density
STRESSOR P rho
Ions and pH (Chloride and ammonia) and pH 0.001 0.71
DO and Temperature 0.001 0.62
Conductivity and sulfate 0.001 -0.63
Suspended sediment 0.087 0.32
Nutrients(Phosphorus and nitrate/nitrite) 0.521 0.12

Conclusions
1. Tolerant to what? – Tolerance variables identified
2. Can use classifications of moderate more effectively -
Fish species are tolerant to some stressors while less tolerant to others
3. TIVs have potential in stressor diagnosis
Cautions
Opinion-based classifications include habitat
Chemical stressors may co-vary
Wide range of environmental conditions sampled and the ordinal ranking approach robust to geographic variation
Acknowledgments
We thank:
- The NAWQA biologists, hydrologists, and technicians who collected data
- James Falcone for GIS

http://water.usgs.gov/nawqa/ecology