Embed Size (px)
Citation preview

Offsets in Defense Trade
Twenty-First Study
Conducted Pursuant to Section 723 of the Defense
Production Act of 1950, as Amended
U.S. Department of Commerce
Bureau of Industry and Security
DECEMBER 2016

i
Table of Contents
Executive Summary .................................................................................................................... ii
1 Background ............................................................................................................................. 1
2 Defense Export Sales with Offset Agreements ....................................................................... 3
3 Offset Transactions ................................................................................................................. 5
4 Impact of Offsets on the U.S. Industrial Base ........................................................................ 8
5 Utilization of Annual Report ................................................................................................ 21
Annex A (Not For Public Release) ........................................................................................... 22
Annex B (Not For Public Release) ........................................................................................... 23
Annex C – Overview of Offset Transactions by Category, 1993-2015 .................................... 24
Annex D – Department of Defense’s Purchases from Foreign Entities, Fiscal Year
2015 .......................................................................................................................................... 30
Annex E – Glossary and Offset Example ................................................................................. 31

ii
Executive Summary
This is the twenty-first annual report to Congress on the impact of offsets in defense trade
prepared by the U.S. Department of Commerce’s Bureau of Industry and Security (BIS) pursuant
to Section 723 of the Defense Production Act (DPA) of 1950, as amended.1 Offsets in defense
trade encompass a range of industrial compensation arrangements required by foreign
governments as a condition of the purchase of defense articles and services from a non-domestic
source.
BIS collects data annually from U.S. firms involved in defense exports with associated offset
agreements in order to assess the impact of offsets in defense trade.2 In 2015, U.S. defense
contractors reported entering into 38 new offset agreements with 15 countries valued at $3.1
billion. The value of these agreements equaled 38.89 percent of the $8 billion in reported
contracts for sales to foreign entities of defense articles and services with associated offset
agreements. In 2015, U.S. firms also reported 651 offset transactions conducted to fulfill prior
offset agreement obligations with 26 countries at an actual value of $5.0 billion, and an offset
credit value of $5.3 billion.
This report notes that exports of defense articles and services can lower overhead costs for the
Department of Defense; help sustain production facilities, workforce expertise, and the supplier
base to support current and future U.S. defense requirements; promote interoperability of defense
systems, subsystems and components between the United States and friends and allies; and
contribute positively to U.S. international account balances. However, offset agreements and
associated offset transactions can negate some of the potential economic and industrial base
benefits accrued through defense exports if the offset activity displaces work that would
otherwise have been conducted in the United States.
Items offered as part of an offset transaction may require an export license from the relevant U.S.
Government agency. For items that require an export license, such as items controlled for
Missile Technology reasons, exporters are advised to consult with the Departments of
Commerce, Defense, and State to obtain export control policy guidance prior to offering such
items as part of an offset transaction.
1 Codified at 50 U.S.C. § 4568 (2015).
2 Pursuant to 15 CFR Part 701 (2015).

1
1 Background
Offsets in defense trade encompass a range of industrial and commercial benefits provided to
foreign governments as an inducement or condition to purchase military goods or services,
including benefits such as co-production, licensed production, subcontracting, technology
transfer, purchasing, and credit assistance. This mandatory compensation can be directly related
to the purchased defense article or service or it can involve activities or goods unrelated to the
defense sale.
In 1984, the U.S. Congress amended the Defense Production Act (DPA) to require the President
to submit an annual report to Congress on the impact of offsets on the U.S. defense industrial
base.3 The Office of Management and Budget was the first agency appointed as the interagency
coordinator for preparing the report for Congress. In 1992, Congress amended the DPA and
directed that the Secretary of Commerce function as the President’s Executive Agent in
preparing the annual report to Congress.4 Section 723 of the DPA authorizes the Secretary of
Commerce to develop and administer the regulations necessary to collect offset data from U.S.
firms.5 The Secretary of Commerce has delegated this authority to the Bureau of Industry and
Security (BIS). BIS published its offset reporting regulation in 1994.6 BIS amended its offset
regulation in 2009 and in 2016.7
The U.S. Government policy on offsets in defense trade states that the government considers
offsets to be “economically inefficient and trade distorting,” and prohibits any agency of the U.S.
Government from encouraging, entering directly into, or committing U.S. firms to any offset
arrangement in connection with the sale of defense articles or services to foreign governments.8
U.S. defense contractors generally see offsets as a reality of the marketplace for companies
competing for international defense sales. Several U.S. defense contractors have informed BIS
that offsets are usually necessary in order to make defense sales – sales which can help support
the U.S. industrial base.
3 See Pub. L. 98-265, April 17, 1984, 98 Stat. 149.
4 See Pub. L. 102-558, Oct. 28, 1992, 106 Stat. 4198; see also Part IV of Exec. Order No. 12919, 59 Fed. Reg.
29,525 (June 3, 1994) and Part VII of Exec. Order 13603, Fed. Reg. 16,651 (March 22, 2012). 5 Previously, the offset report was submitted pursuant to Sec. 309 of the Defense Production Act of 1950. However,
as a result of the Defense Production Act Reauthorization of 2009, Pub. L. 111-67, which rewrote Title III of the Act
and introduced a new Sec. 723 on offsets, the report is now submitted pursuant to Sec. 723. Section 723 is largely
the same in content as the prior Sec. 309. 6 See 59 Fed. Reg. 61,796 (December 2, 1994) codified at 15 C.F.R. § 701.
7 See 74 Fed. Reg. 68,136 (December 23, 2009) codified at 15 C.F.R. § 701 and 81 Fed. Reg. 40, 10472 (March 1,
2016). 8 Defense Production Act Amendments of 1992 (Pub. L. 102-558, Title I, Part C, §123).

2
This is the twenty-first report to Congress on offsets in defense trade that BIS has prepared. This
report reviews offset data for the 23-year period from 1993-2015.9 BIS structured this report
similarly to reports published in 2008 through 2015; the chapters correspond with the sequence
of events for defense sales involving offsets. In preparing this report, BIS has incorporated data
from other U.S. Government sources, including the Department of Defense (DOD), the Bureau
of the Census (Census), and the Bureau of Economic Analysis (BEA).
On March 1, 2016, BIS published an amendment to its offset regulation in the Federal Register.
The amendment clarifies that companies are required to report offset activity not only for items
controlled under the International Traffic in Arms Regulations (ITAR), but also for items
controlled under the “600 series” of the EAR. The offset regulation had defined defense exports
as being items subject to the ITAR, however, subsequent to the 2009 amendment to the offset
regulation, the Export Control Reform initiative moved certain items formerly controlled under
the ITAR to the EAR under the “600 series” and the amendment made it clear that companies are
required to report offsets associated with the sale of these “600 series” items also.10 BIS has
required reporting of offset agreements in connection with sales of items subject to the ITAR
since the early 1990s.11 Those reporting requirements will continue, unchanged by this rule.12
On April 8, 2016, BIS published a notice in the Federal Register to remind the public that U.S.
firms are required to report annually on contracts for the sale to foreign governments or foreign
firms of defense articles or defense services that are subject to offset agreements exceeding
$5,000,000 in value, and offset transactions completed in performance of existing offset
commitments for which offset credit of $250,000 or more has been claimed by the foreign
representative.13 Twenty-two firms reported offset agreement and transaction data to BIS for
calendar year 2015. The data elements collected each year from industry are listed in Section
701.4 of the BIS offset reporting regulation and were referenced in the Federal Register notice.
BIS prepared this report in consultation with the Departments of Defense, State and Labor, and
the Office of the United States Trade Representative.
9 The initial offsets report, issued in 1996, covered the time period from 1993 to 1994; each subsequent offset report
added an additional year to the reporting period, with the exception of the eighth report, which added two years. 10
See 81 Fed. Reg. 40, 10472 (March 1, 2016). 11
See 81 Fed. Reg. 40, 10472 (March 1, 2016). 12
See 81 Fed. Reg. 40, 10472 (March 1, 2016). 13
See 81 Fed. Reg. 40, 20618 (April 8, 2016).

3
2 Defense Export Sales with Offset Agreements
In 2015, 13 U.S. firms reported entering into 38 contracts that had related offset agreements for
the sale of defense items and services. These contracts, signed with 15 countries, were valued at
$8.1 billion. The offset agreements were valued at $3.1 billion which equaled 38.89 percent of
the value of the signed defense export sales contracts, which is well below the historic average of
approximately 61 percent and is the second lowest annual average offset percentage since BIS
began collecting data in 1993. During 2015, reported offset agreements ranged from a low of 9.9
percent of the defense export sales contract value to a high of 100 percent.
In 2015, nearly 94.74 percent of the signed offset agreements reported by U.S. industry included
penalties for non-performance of the offset obligation. Those penalties included liquidated
damages, increases in the obligation amount or offset requirement, added fees based on unfilled
offset commitments, or bank credit guarantees.
Table 2-1: Summary of Defense Export Sale Contract Values with Related Offset Agreements, 1993-2015
Year Contract Value
($ millions)
Offset
Agreement
Value
($ millions)
Percent of Offset
Agreement to
Contract Value
U.S. Firms
(Number)
Agreements
(Number)
Countries
(Number)/Multi-
Country
Arrangements
1993 $13,935 $4,784 34.33% 17 28 16
1994 $4,792 $2,049 42.75% 18 49 20
1995 $7,632 $6,204 81.30% 21 48 18
1996 $3,120 $2,432 77.94% 16 53 19
1997 $5,925 $3,826 64.56% 15 60 20
1998 $3,079 $1,786 57.99% 14 42 17
1999 $5,657 $3,457 61.11% 11 45 11
2000 $6,576 $5,705 86.75% 10 43 16
2001 $7,116 $5,550 77.99% 12 35 13
2002 $7,406 $6,095 82.29% 12 41 17
2003 $7,293 $9,110 124.92% 11 32 13
2004 $4,928 $4,330 87.87% 14 40 18
2005 $2,260 $1,464 64.79% 8 25 18
2006 $5,265 $3,655 69.42% 15 48 21
2007 $6,736 $5,438 80.73% 11 44 19
2008 $6,435 $3,846 59.77% 17 55 17
2009 $11,033 $6,841 62.01% 15 64 21
2010 $4,012 $2,444 60.91% 15 34 14
2011 $10,882 $5,595 51.41% 9 63 27
2012 $25,661 $10,387 40.48% 12 49 17
2013 $9,959 $5,166 51.87% 17 69 19
2014 $12,936 $7,602 58.76% 14 45 15
2015 $8,059 $3,135 38.89% 13 38 15
Total or
Average $180,696 $110,898 61.37% 55 1,050 50
Source: BIS Offset Database
Note: Due to rounding, totals may not add up exactly. Figures for certain previous years have been revised. The values shown have not been adjusted for inflation.

4
During 1993-2015, 55 U.S. firms reported entering into 1,050 offset-related defense export sales
contracts worth $180.7 billion with 50 countries and three multi-country arrangements. The
associated offset agreements were valued at $110.9 billion.

5
3 Offset Transactions
In 2015, 19 U.S. firms reported concluding 651 offset transactions with 26 countries to fulfill
offset agreement obligations. The offset transactions reported by U.S. firms had an actual value
of $5.0 billion in 2015 and a credit value of $5.3 billion. In 2015, U.S. industry reported that 43
offset transactions (6.61 percent of all transactions completed during the 12 month period) had a
multiplier greater than one applied and three transactions (0.46 percent of all transactions
completed during the 12 month period) had a multiplier of less than one applied.14
Table 3-1: Summary of Offset Transactions15
Year
Actual Offset
Transaction Value
($ millions)
Credit Offset
Transaction Value
($ millions)
U.S. Firms
(Number)
Transactions
(Number)
Countries
(Number)/Multi-
Country
Arrangements
1993 $1,898 $2,214 22 444 27
1994 $1,935 $2,206 21 566 26
1995 $2,890 $3,593 21 711 25
1996 $2,876 $3,098 22 634 26
1997 $2,721 $3,272 19 578 26
1998 $2,312 $2,623 20 582 29
1999 $2,060 $2,808 13 513 25
2000 $2,190 $2,749 16 626 24
2001 $2,543 $3,201 16 616 25
2002 $2,620 $3,148 18 734 26
2003 $3,563 $4,008 17 689 31
2004 $4,935 $5,366 16 710 33
2005 $4,722 $5,439 13 624 30
2006 $4,706 $4,906 16 661 28
2007 $3,805 $4,742 19 633 28
2008 $3,291 $4,768 22 671 30
2009 $3,495 $4,129 23 702 28
2010 $3,608 $4,477 25 707 28
2011 $3,880 $5,062 21 740 31
2012 $3,438 $3,843 22 690 30
2013 $3,189 $3,562 21 546 32
2014 $3,864 $4,289
17 672 29
2015 $5,049 $5,323 19 651 26
Total $75,588 $88,827 62 14,700 47
Source: BIS Offset Database
Note: Due to rounding, totals may not add up exactly. Figures for certain previous years have been revised. The values shown have not been
adjusted for inflation.
14
A multiplier is a factor applied to the actual value of certain offset transactions to calculate the credit value earned.
Foreign purchasers use multipliers to provide firms with incentives to offer offsets that benefit targeted areas of
economic growth. When a multiplier greater than one is applied to the value of a service or product offered as an
offset, the defense firm receives a higher credit value toward fulfillment of an offset obligation than would be the
case without application of a multiplier. Conversely, foreign purchasers apply multipliers less than one to
discourage certain types of transactions. 15
2000-2003 data revised.

6
U.S. firms are required to classify offset transactions by type (direct or indirect) and report to
BIS offset transactions by category specifically describing the nature of the transaction. In the
offset reporting regulation, BIS has categorized offset transactions as one of the following: co-
production, technology transfer, subcontracting, credit assistance, training, licensed production,
investment, purchases, and other.16 See Annex E for definitions of each offset transaction
category.
In 2015, direct offsets (transactions directly related to the defense export sale with an associated
offset agreement) accounted for 41.84 percent of the actual value of reported offset transactions.
Indirect offsets (transactions not directly related to the defense export sale with an associated
offset agreement) accounted for 52.44 percent of the actual value of reported offset transactions.
During 1993-2015, direct offsets accounted for 39.50 percent of the actual value of the reported
offset transactions, with indirect offsets accounting for 58.63 percent.17
The top three offset transaction categories reported by industry for 2015 were purchases,
subcontracting, and “other”. These three categories represented 85.56 percent of all offset
transactions reported for 2015 based on quantity, 78.01 percent of the transactions based on
actual value, and 77.14 percent of the transactions based on credit value.
Based on the total number of transactions reported in 2015 that included a multiplier greater than
one, the top four offset transaction categories were technology transfer, “other”, subcontracting,
and purchases. Technology and “other” transfer accounted for 23.26 percent of these
transactions, subcontracting accounted for 20.93 percent, and purchases accounted for 18.60
percent.
The top three offset transaction categories reported by industry for the 23-year reporting period
(1993-2015) were: purchases, subcontracting, and technology transfer on the basis of quantity,
actual value, and credit value. These three categories represented 81.08 percent of all
transactions based on quantity, 76.50 percent of all transactions based on actual value, and 72.52
percent based on credit value. Purchasing alone accounted for 46.65 percent of all transactions
based on quantity, 38.78 percent based on actual value, and 35.07 percent based on credit value.
From 1993-2015, based on quantity, the top three offset transaction categories that included
16
With respect to the export of any item or technology from the United States, U.S. export control laws apply.
Whether or not an export is associated with an offset agreement, U.S. exporters must comply with U.S. export
control requirements, which include, among other things, licensing requirements. License applications are carefully
reviewed by the appropriate U.S. Government agencies to ensure that the proposed export of an item (commodity,
software or technology) or service is consistent with U.S. laws, regulations, and foreign policy and national security
considerations. Where no license is required, U.S. exporters must comply with end-use and end-user restrictions. 17
The total does not equal 100 percent because a small number of reported offset transactions are not specified as
direct or indirect.

7
multipliers greater than one were purchases, technology transfer, and subcontracting,
respectively.
Annex C presents a summary of reported offset transactions by type, category, value, and with
multipliers on an annual basis during the 23-year reporting period (1993-2015).

8
4 Impact of Offsets on the U.S. Industrial Base
Defense export sales can be an important component of U.S. defense contractors’ revenues and
further U.S. foreign policy and economic interests. Exports of major defense systems can also
lower overhead and unit costs for the Department of Defense (DOD), and help sustain
production facilities, workforce expertise, and the supplier base to support current and future
U.S. defense requirements. Exports also promote interoperability of defense systems between
the United States and friends and allies, and contribute positively to U.S. international trade
account balances. However, offset agreements and associated offset transactions may lessen
some of the potential economic and industrial base benefits accrued through defense exports if
the offset activity associated with defense exports displaces work that otherwise would have
been conducted in the United States and/or if competitors are established in foreign countries.18
Studies and discussions between industry and U.S. Government officials indicate that, at times,
U.S. prime contractors develop long-term supplier relationships with foreign subcontractors
based on short-term offset requirements. These new relationships, combined with the mandatory
offset requirements related to offset agreements, may limit future business opportunities for U.S.
subcontractors and suppliers, and may have negative consequences for the domestic industrial
base. Other kinds of offsets, such as technology transfers, may increase research and
development spending and capital investment in foreign countries for defense or non-defense
industries, thereby may help to create or enhance current and future competitors to U.S. industry.
Export and Offset Activity Trends
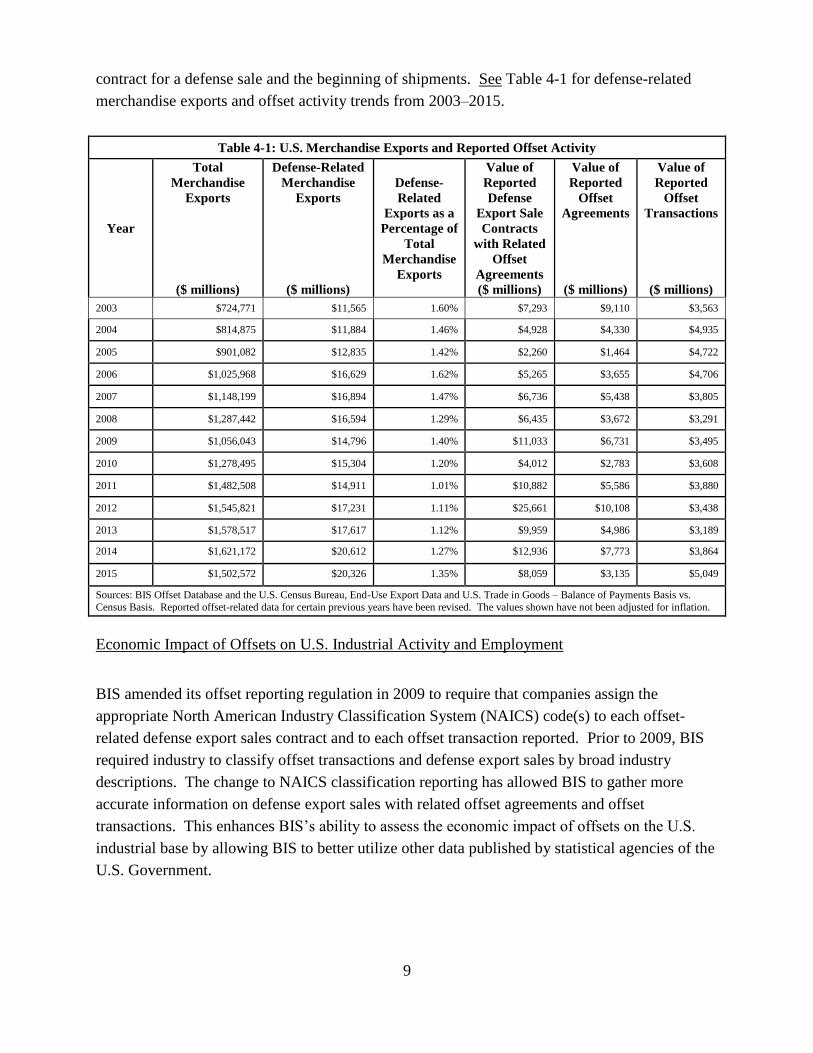
According to Census, the value of U.S. merchandise exports totaled $1.5 trillion in 2015. Based
on end-use export data published by Census, defense-related merchandise exports totaled $20.3
billion in 2015, or 1.35 percent of total U.S. merchandise exports.19 In 2015, U.S. industry
reported entering into offset-related defense export sales contracts worth $8.1 billion. However,
the value of U.S. merchandise exports cannot be directly compared with the value of defense
export sales contracts and offset agreements because export data reflect actual shipments made
during the calendar year and there is usually a lag of several years between the conclusion of a
18
See GAO report on offset activities, “Defense Trade: U.S. Contractors Employ Diverse Activities to Meet Offset
Obligations,” December 1998 (GAO/NSIAD-99-35), pp 4-5. 19
The value of defense exports includes the exports categorized under the following export end-use codes: (50000)
Military aircraft, complete; (50010) Aircraft launching gear, parachutes, etc.; (50020) Engines and turbines for
military aircraft; (50030) Military trucks, armored vehicles, etc.; (50040) Military ships and boats; (50050) Tanks,
artillery, missiles, rockets, guns, and ammunition; (50060) Military apparel and footwear; and (50070) Parts for
military-type goods. The end-use data series does not include exports of defense services. See
www.census.gov/foreign-trade/statistics.
9
contract for a defense sale and the beginning of shipments. See Table 4-1 for defense-related
merchandise exports and offset activity trends from 2003–2015.
Table 4-1: U.S. Merchandise Exports and Reported Offset Activity
Year
Total
Merchandise
Exports
($ millions)
Defense-Related
Merchandise
Exports
($ millions)
Defense-
Related
Exports as a
Percentage of
Total
Merchandise
Exports
Value of
Reported
Defense
Export Sale
Contracts
with Related
Offset
Agreements
($ millions)
Value of
Reported
Offset
Agreements
($ millions)
Value of
Reported
Offset
Transactions
($ millions)
2003 $724,771 $11,565 1.60% $7,293 $9,110 $3,563
2004 $814,875 $11,884 1.46% $4,928 $4,330 $4,935
2005 $901,082 $12,835 1.42% $2,260 $1,464 $4,722
2006 $1,025,968 $16,629 1.62% $5,265 $3,655 $4,706
2007 $1,148,199 $16,894 1.47% $6,736 $5,438 $3,805
2008 $1,287,442 $16,594 1.29% $6,435 $3,672 $3,291
2009 $1,056,043 $14,796 1.40% $11,033 $6,731 $3,495
2010 $1,278,495 $15,304 1.20% $4,012 $2,783 $3,608
2011 $1,482,508 $14,911 1.01% $10,882 $5,586 $3,880
2012 $1,545,821 $17,231 1.11% $25,661 $10,108 $3,438
2013 $1,578,517 $17,617 1.12% $9,959 $4,986 $3,189
2014 $1,621,172 $20,612 1.27% $12,936 $7,773 $3,864
2015 $1,502,572 $20,326 1.35% $8,059 $3,135 $5,049
Sources: BIS Offset Database and the U.S. Census Bureau, End-Use Export Data and U.S. Trade in Goods – Balance of Payments Basis vs.
Census Basis. Reported offset-related data for certain previous years have been revised. The values shown have not been adjusted for inflation.
Economic Impact of Offsets on U.S. Industrial Activity and Employment
BIS amended its offset reporting regulation in 2009 to require that companies assign the
appropriate North American Industry Classification System (NAICS) code(s) to each offset-
related defense export sales contract and to each offset transaction reported. Prior to 2009, BIS
required industry to classify offset transactions and defense export sales by broad industry
descriptions. The change to NAICS classification reporting has allowed BIS to gather more
accurate information on defense export sales with related offset agreements and offset
transactions. This enhances BIS’s ability to assess the economic impact of offsets on the U.S.
industrial base by allowing BIS to better utilize other data published by statistical agencies of the
U.S. Government.
10
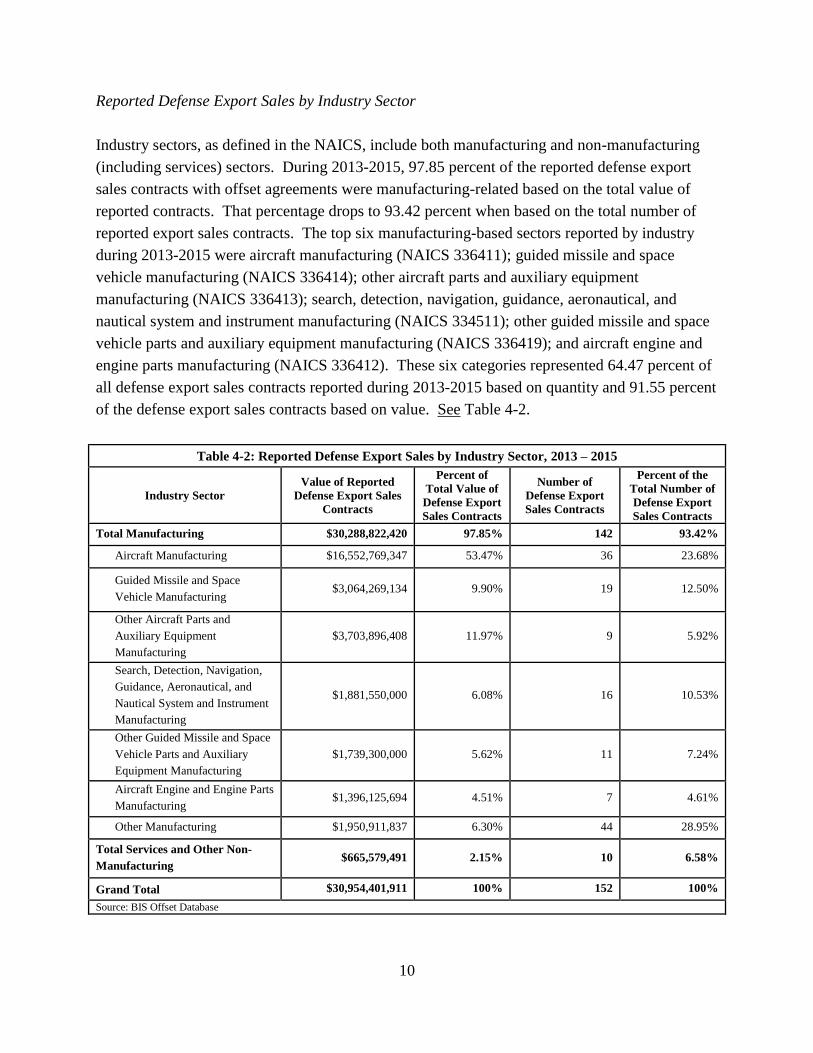
Reported Defense Export Sales by Industry Sector
Industry sectors, as defined in the NAICS, include both manufacturing and non-manufacturing
(including services) sectors. During 2013-2015, 97.85 percent of the reported defense export
sales contracts with offset agreements were manufacturing-related based on the total value of
reported contracts. That percentage drops to 93.42 percent when based on the total number of
reported export sales contracts. The top six manufacturing-based sectors reported by industry
during 2013-2015 were aircraft manufacturing (NAICS 336411); guided missile and space
vehicle manufacturing (NAICS 336414); other aircraft parts and auxiliary equipment
manufacturing (NAICS 336413); search, detection, navigation, guidance, aeronautical, and
nautical system and instrument manufacturing (NAICS 334511); other guided missile and space
vehicle parts and auxiliary equipment manufacturing (NAICS 336419); and aircraft engine and
engine parts manufacturing (NAICS 336412). These six categories represented 64.47 percent of
all defense export sales contracts reported during 2013-2015 based on quantity and 91.55 percent
of the defense export sales contracts based on value. See Table 4-2.
Table 4-2: Reported Defense Export Sales by Industry Sector, 2013 – 2015
Industry Sector
Value of Reported
Defense Export Sales
Contracts
Percent of
Total Value of
Defense Export
Sales Contracts
Number of
Defense Export
Sales Contracts
Percent of the
Total Number of
Defense Export
Sales Contracts
Total Manufacturing $30,288,822,420 97.85% 142 93.42%
Aircraft Manufacturing $16,552,769,347 53.47% 36 23.68%
Guided Missile and Space
Vehicle Manufacturing $3,064,269,134 9.90% 19 12.50%
Other Aircraft Parts and
Auxiliary Equipment
Manufacturing
$3,703,896,408 11.97% 9 5.92%
Search, Detection, Navigation,
Guidance, Aeronautical, and
Nautical System and Instrument
Manufacturing
$1,881,550,000 6.08% 16 10.53%
Other Guided Missile and Space
Vehicle Parts and Auxiliary
Equipment Manufacturing
$1,739,300,000 5.62% 11 7.24%
Aircraft Engine and Engine Parts
Manufacturing $1,396,125,694 4.51% 7 4.61%
Other Manufacturing $1,950,911,837 6.30% 44 28.95%
Total Services and Other Non-
Manufacturing $665,579,491 2.15% 10 6.58%
Grand Total $30,954,401,911 100% 152 100%
Source: BIS Offset Database

11
Reported Offset Transactions by Industry Sector
During 2013-2015, 78.21 percent of reported offset transactions were manufacturing-related
based on the total value of reported offset transactions and 76.35 percent based on the total
number of reported offset transactions. The top six sectors reported by industry during 2013-
2015 were aircraft manufacturing (NAICS 336411); other aircraft parts and auxiliary equipment
manufacturing (NAICS 336413); aircraft engine and engine parts manufacturing (NAICS
336412); search, detection, navigation, guidance, aeronautical, and nautical system and
instrument manufacturing (NAICS 334511); guided missile and space vehicle manufacturing
(NAICS 336414); and military armored vehicle, tank, and tank component (NAICS 336992).
These six categories represented 51.04 percent of all offset transactions reported for 2013-2015
based on quantity and 66.72 percent of offset transactions based on value. See Table 4-3.
Table 4-3: Reported Offset Transactions by Industry Sector, 2013 – 2015
Industry Sector Total Value Percent of the
Total Value
Number of
Transactions
Percent of the
Total Number of
Transactions
Total Manufacturing $9,465,689,917 78.21% 1,427 76.35%
Aircraft Manufacturing $3,378,978,237 27.92% 283 15.14%
Other Aircraft Parts and Auxiliary
Equipment Manufacturing $2,554,366,225 21.11% 399 21.35%
Aircraft Engine and Engine Parts
Manufacturing $778,679,063 6.43% 91 4.87%
Search, Detection, Navigation,
Guidance, Aeronautical, and Nautical
System and Instrument Manufacturing
$565,084,087 4.67% 108 5.78%
Guided Missile and Space Vehicle
Manufacturing $429,546,728 3.55% 49 2.62%
Military Armored Vehicle, Tank, and
Tank Component $367,866,273 3.04% 24 1.28%
Other Manufacturing $1,391,169,304 11.50% 473 25.31%
Total Services and Other Non-
Manufacturing $2,636,588,680 21.79% 442 23.65%
Other Support Activities for Air
Transportation $955,949,806 7.90% 50 2.68%
Engineering Services $439,128,058 3.63% 115 6.15%
Custom Computer Programming
Services $297,252,263 2.46% 87 4.65%
All Others $944,258,553 7.80% 190 10.17%
Grand Total $12,102,278,597 100% 1,869 100%
Source: BIS Offset Database Due to rounding, totals may not add up exactly
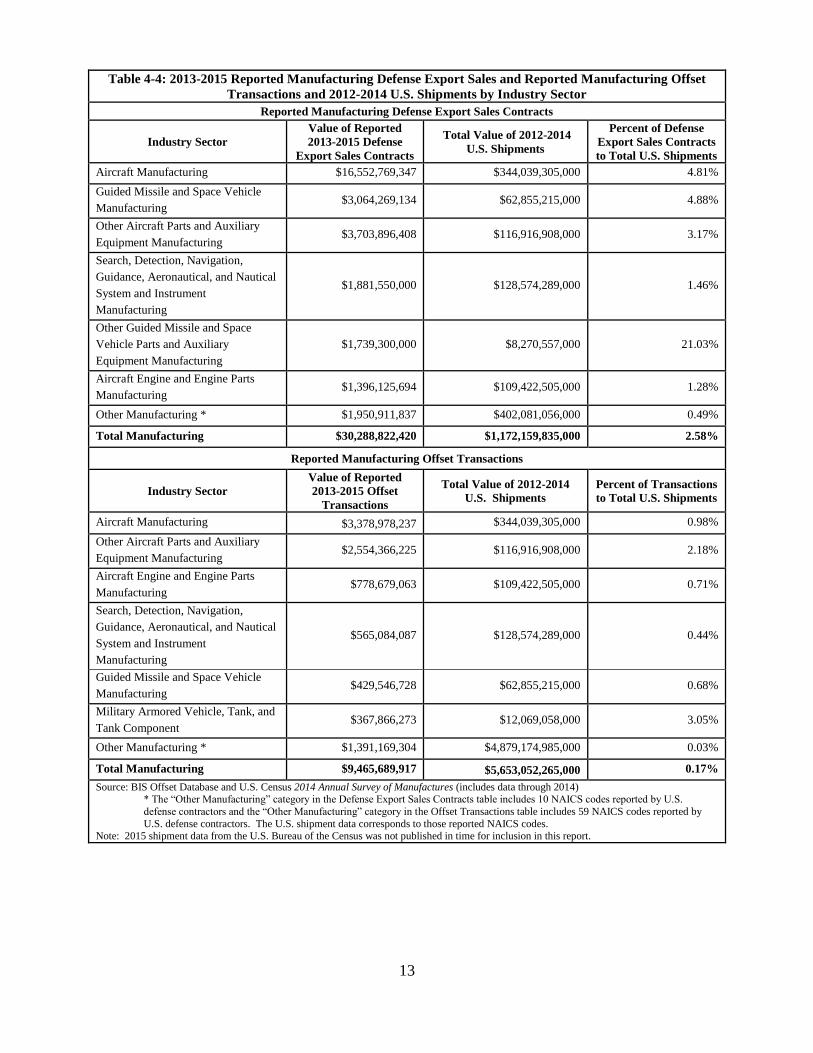
BIS compared defense export sales contracts and offset transactions reported for 2013-2015 with
data published by the Census on total 2012-2014 U.S. shipments of selected manufacturing

12
industry sectors to provide context for the volume of offset activity relative to the U.S.
economy.20 Industry reported defense export sales contracts with 22 NAICS codes and offset
transactions with 116 NAICS codes. The comparison of 2013-2015 offset-related data with
2012-2014 U.S. shipment data highlights that, while the reported defense export sales contracts
accounted for a significant percentage compared to U.S. shipment data in certain manufacturing
industry sectors, reported offset transactions data did not account for a significant percentage in
other manufacturing industry sectors. See Table 4-4.
20
2015 shipment data from the U.S. Bureau of the Census was not published in time for inclusion in this report.
Therefore, Census data for the 2012-2014 period was used for comparison.
13
Table 4-4: 2013-2015 Reported Manufacturing Defense Export Sales and Reported Manufacturing Offset
Transactions and 2012-2014 U.S. Shipments by Industry Sector
Reported Manufacturing Defense Export Sales Contracts
Industry Sector
Value of Reported
2013-2015 Defense
Export Sales Contracts
Total Value of 2012-2014
U.S. Shipments
Percent of Defense
Export Sales Contracts
to Total U.S. Shipments
Aircraft Manufacturing $16,552,769,347 $344,039,305,000 4.81%
Guided Missile and Space Vehicle
Manufacturing $3,064,269,134 $62,855,215,000 4.88%
Other Aircraft Parts and Auxiliary
Equipment Manufacturing $3,703,896,408 $116,916,908,000 3.17%
Search, Detection, Navigation,
Guidance, Aeronautical, and Nautical
System and Instrument
Manufacturing
$1,881,550,000 $128,574,289,000 1.46%
Other Guided Missile and Space
Vehicle Parts and Auxiliary
Equipment Manufacturing
$1,739,300,000 $8,270,557,000 21.03%
Aircraft Engine and Engine Parts
Manufacturing $1,396,125,694 $109,422,505,000 1.28%
Other Manufacturing * $1,950,911,837 $402,081,056,000 0.49%
Total Manufacturing $30,288,822,420 $1,172,159,835,000 2.58%
Reported Manufacturing Offset Transactions
Industry Sector
Value of Reported
2013-2015 Offset
Transactions
Total Value of 2012-2014
U.S. Shipments
Percent of Transactions
to Total U.S. Shipments
Aircraft Manufacturing $3,378,978,237 $344,039,305,000 0.98%
Other Aircraft Parts and Auxiliary
Equipment Manufacturing $2,554,366,225 $116,916,908,000 2.18%
Aircraft Engine and Engine Parts
Manufacturing $778,679,063 $109,422,505,000 0.71%
Search, Detection, Navigation,
Guidance, Aeronautical, and Nautical
System and Instrument
Manufacturing
$565,084,087 $128,574,289,000 0.44%
Guided Missile and Space Vehicle
Manufacturing $429,546,728 $62,855,215,000 0.68%
Military Armored Vehicle, Tank, and
Tank Component $367,866,273 $12,069,058,000 3.05%
Other Manufacturing * $1,391,169,304 $4,879,174,985,000 0.03%
Total Manufacturing $9,465,689,917 $5,653,052,265,000 0.17%
Source: BIS Offset Database and U.S. Census 2014 Annual Survey of Manufactures (includes data through 2014) * The “Other Manufacturing” category in the Defense Export Sales Contracts table includes 10 NAICS codes reported by U.S.
defense contractors and the “Other Manufacturing” category in the Offset Transactions table includes 59 NAICS codes reported by
U.S. defense contractors. The U.S. shipment data corresponds to those reported NAICS codes. Note: 2015 shipment data from the U.S. Bureau of the Census was not published in time for inclusion in this report.

14
Offset-Related Impact Analysis
Given the variety of the reported defense export sales contracts and the number of reported offset
transactions, it is not possible to determine precisely the impact of the defense export sales
contracts, offset agreements, and offset transactions on industrial activity and employment.
However, utilizing the Bureau of Economic Analysis’ (BEA) Benchmark Input-Output Accounts
of the United States (I/O accounts),21 and Census’ Annual Survey of Manufactures data,22 BIS
has developed a method to approximate the value added shipment and employment impact of
offset activities across the United States’ economic sectors.
During 2013-2015, industry reported defense export sales contracts involving offsets valued at
$30.3 billion in manufacturing industry sectors for which Census publishes annual employment
and value-added data by NAICS code. Based on the I/O accounts, the value of “inputs” from all
other industry sectors associated with the $30.3 billion in defense export sales contracts was
$37.4 billion as shown in Table 4-5.23 BIS estimates, using Census’ Annual Survey of
Manufactures data, this $37.4 billion in inputs would create or sustain 146,541 employment
opportunities.24 As shown in Table 4-5, the I/O accounts also demonstrate how these defense
export sales contracts have a positive multiplier effect not only on selected U.S. manufacturing
industry sectors but on hundreds of other U.S. economic sectors that supply inputs related to the
export sales contracts. This analysis assumes that all the work associated with the defense export
sales contracts is conducted in the United States.
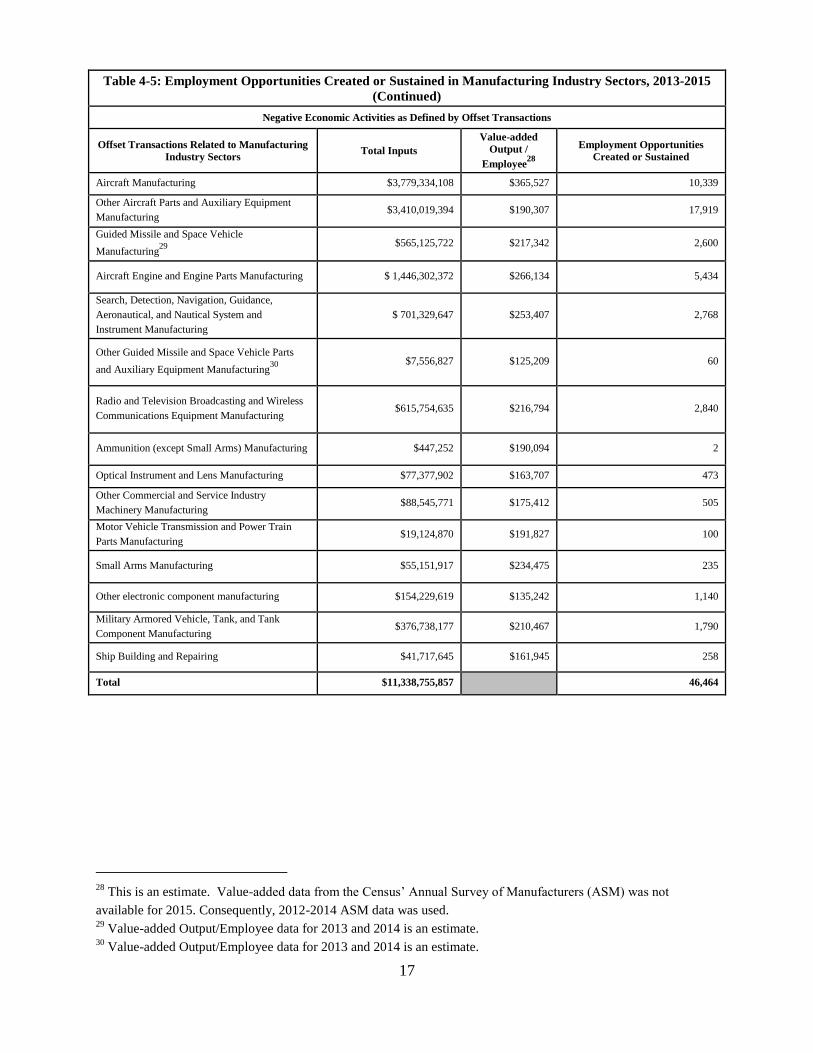
However, offset transactions generally have a negative impact on U.S. inputs because they are
primarily conducted outside the United States and represent activity that is not provided by the
U.S. economy. For the purpose of this analysis, BIS has also assumed that all the work
associated with offset transactions would have been conducted in the United States if there were
no offset agreement in place. This is not necessarily an accurate assumption. BIS estimates,
using Census’ Annual Survey of Manufactures data and reported offset transaction data supplied
21
The I/O accounts show the dollar value of inputs from all industries required to produce a dollar’s worth of an
industry’s output. The I/O accounts provide an extensive accounting of the production of goods and services by
each industry, which includes the goods and services purchased by each industry, the income earned in each
industry, and the distribution of sales for all goods and services to industries and final uses. 22
With the availability of 2015 offset data, BIS analysis under the revised method of measuring offset-related
impact is based on three years of data, which will compensate somewhat for annual fluctuations. The basis for
estimating the impact of offset activity on industrial activity and employment utilizes the NAICS codes data
reported by Census and the I/O accounts. 23
The multiplier effect in the I/O model occurs because the total inputs supplied to an industry sector consist of
direct inputs (the product and services directly used in generating the output) supplied to that industry sector plus the
indirect inputs (additional economic activities) created by the supplying industry sectors. 24
BIS analysis utilizes the Manufacturing: Industry Series: Product or Service Statistics for the United States: 2010
through 2012, United States Census Bureau.

15
by U.S. prime defense contractors, the $8.7 billion in reported offset transactions during 2013-
2015 for which Census publishes annual employment and value-added data by NAICS code
(valued at $11.3 billion with the I/O multiplier applied), could have created or sustained 46,464
employment opportunities if the work associated with those transactions were performed in the
United States. As shown in Table 4-5, the I/O accounts provides an approximation of the
multiplier effect across all U.S. economic sectors had these transactions been performed in the
United States.
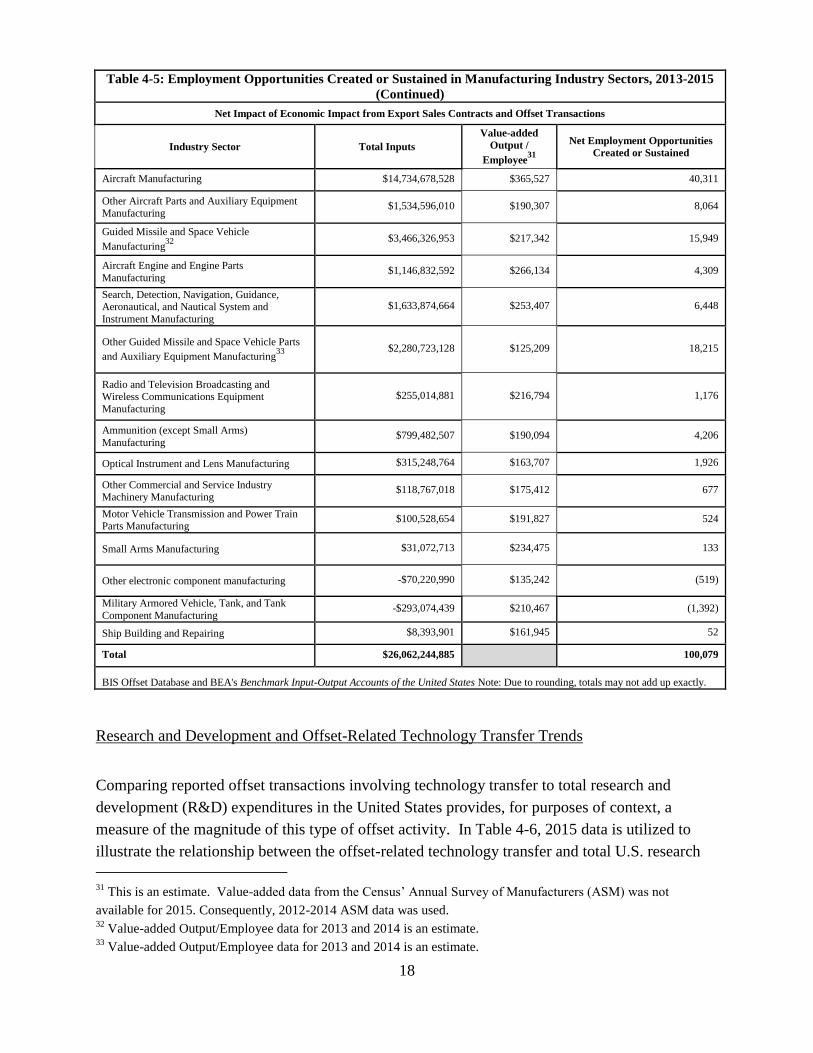
Table 4-5 also shows the net impact in inputs across all sectors of the U.S. economy resulting
from offset-related defense export sales contracts. BIS derived this information by subtracting
the reported offset transaction-related data from the reported defense export sales contracts-
related data. In 15 manufacturing industry sectors shown in Table 4-5, the data indicate a
negative impact on U.S. employment opportunities. However, the results indicate an overall net
gain on U.S. manufacturing opportunities arising from export sales contracts with associated
offset agreements, resulting in a positive $26.1 billion in added “input” opportunities for the U.S.
industrial base, and a net gain of 100,007 in employment opportunities created or sustained
during the 2013-2015 period. As a caveat, as noted above, certain NAICS categories associated
with offset-related export contracts and transactions are not included in the I/O data provided by
BEA. Therefore, the net employment impact analysis may be slightly understated for both
reported export sales contracts and reported offset transactions.

16
Table 4-5: Employment Opportunities Created or Sustained in Manufacturing Industry Sectors, 2013-2015
Positive Economic Activities as Defined by Export Sales Contracts Benefiting U. S. Prime Contractors
Export Sales Contracts in Manufacturing
Industry Sectors Total Inputs
Value-added
Output /
Employee25
Employment Opportunities
Created or Sustained
Aircraft Manufacturing $18,514,012,636 $365,527 50,650
Other Aircraft Parts and Auxiliary Equipment
Manufacturing $4,944,615,404 $190,307 25,982
Guided Missile and Space Vehicle
Manufacturing26
$4,031,452,674 $217,342 18,549
Aircraft Engine and Engine Parts Manufacturing $2,593,134,964 $266,134 9,744
Search, Detection, Navigation, Guidance,
Aeronautical, and Nautical System and Instrument
Manufacturing
$2,335,204,311 $253,407 9,215
Other Guided Missile and Space Vehicle Parts
and Auxiliary Equipment Manufacturing27
$2,288,279,955 $125,209 18,276
Radio and Television Broadcasting and Wireless
Communications Equipment Manufacturing $870,769,516 $216,794 4,017
Ammunition (except Small Arms) Manufacturing $799,929,759 $190,094 4,208
Optical Instrument and Lens Manufacturing $392,626,665 $163,707 2,398
Other Commercial and Service Industry
Machinery Manufacturing $207,312,788 $175,412 1,182
Motor Vehicle Transmission and Power Train
Parts Manufacturing $119,653,525 $191,827 624
Small Arms Manufacturing $86,224,630 $234,475 368
Other electronic component manufacturing $84,008,628 $135,242 621
Military Armored Vehicle, Tank, and Tank
Component Manufacturing $83,663,739 $210,467 398
Ship Building and Repairing $50,111,547 $161,945 309
Total $37,401,000,742 146,541
25
This is an estimate. Value-added data from the Census’ Annual Survey of Manufacturers (ASM) was not
available for 2015. Consequently, 2012-2014 ASM data was used. 26
Value-added Output/Employee data for 2013 and 2014 is an estimate. 27
Value-added Output/Employee data for 2013 and 2014 is an estimate.
17
Table 4-5: Employment Opportunities Created or Sustained in Manufacturing Industry Sectors, 2013-2015
(Continued)
Negative Economic Activities as Defined by Offset Transactions
Offset Transactions Related to Manufacturing
Industry Sectors Total Inputs
Value-added
Output /
Employee28
Employment Opportunities
Created or Sustained
Aircraft Manufacturing $3,779,334,108 $365,527 10,339
Other Aircraft Parts and Auxiliary Equipment
Manufacturing $3,410,019,394 $190,307 17,919
Guided Missile and Space Vehicle
Manufacturing29
$565,125,722 $217,342 2,600
Aircraft Engine and Engine Parts Manufacturing $ 1,446,302,372 $266,134 5,434
Search, Detection, Navigation, Guidance,
Aeronautical, and Nautical System and
Instrument Manufacturing
$ 701,329,647 $253,407 2,768
Other Guided Missile and Space Vehicle Parts
and Auxiliary Equipment Manufacturing30
$7,556,827 $125,209 60
Radio and Television Broadcasting and Wireless
Communications Equipment Manufacturing $615,754,635 $216,794 2,840
Ammunition (except Small Arms) Manufacturing $447,252 $190,094 2
Optical Instrument and Lens Manufacturing $77,377,902 $163,707 473
Other Commercial and Service Industry
Machinery Manufacturing $88,545,771 $175,412 505
Motor Vehicle Transmission and Power Train
Parts Manufacturing $19,124,870 $191,827 100
Small Arms Manufacturing $55,151,917 $234,475 235
Other electronic component manufacturing $154,229,619 $135,242 1,140
Military Armored Vehicle, Tank, and Tank
Component Manufacturing $376,738,177 $210,467 1,790
Ship Building and Repairing $41,717,645 $161,945 258
Total $11,338,755,857
46,464
28
This is an estimate. Value-added data from the Census’ Annual Survey of Manufacturers (ASM) was not
available for 2015. Consequently, 2012-2014 ASM data was used. 29
Value-added Output/Employee data for 2013 and 2014 is an estimate. 30
Value-added Output/Employee data for 2013 and 2014 is an estimate.
18
Table 4-5: Employment Opportunities Created or Sustained in Manufacturing Industry Sectors, 2013-2015
(Continued)
Net Impact of Economic Impact from Export Sales Contracts and Offset Transactions
Industry Sector Total Inputs
Value-added
Output /
Employee31
Net Employment Opportunities
Created or Sustained
Aircraft Manufacturing $14,734,678,528 $365,527 40,311
Other Aircraft Parts and Auxiliary Equipment Manufacturing
$1,534,596,010 $190,307 8,064
Guided Missile and Space Vehicle
Manufacturing32
$3,466,326,953 $217,342 15,949
Aircraft Engine and Engine Parts
Manufacturing $1,146,832,592 $266,134 4,309
Search, Detection, Navigation, Guidance, Aeronautical, and Nautical System and
Instrument Manufacturing
$1,633,874,664 $253,407 6,448
Other Guided Missile and Space Vehicle Parts
and Auxiliary Equipment Manufacturing33
$2,280,723,128 $125,209 18,215
Radio and Television Broadcasting and Wireless Communications Equipment
Manufacturing
$255,014,881 $216,794 1,176
Ammunition (except Small Arms)
Manufacturing $799,482,507 $190,094 4,206
Optical Instrument and Lens Manufacturing $315,248,764 $163,707 1,926
Other Commercial and Service Industry Machinery Manufacturing
$118,767,018 $175,412 677
Motor Vehicle Transmission and Power Train Parts Manufacturing
$100,528,654 $191,827 524
Small Arms Manufacturing $31,072,713 $234,475 133
Other electronic component manufacturing -$70,220,990 $135,242 (519)
Military Armored Vehicle, Tank, and Tank
Component Manufacturing -$293,074,439 $210,467 (1,392)
Ship Building and Repairing $8,393,901 $161,945 52
Total $26,062,244,885 100,079
BIS Offset Database and BEA's Benchmark Input-Output Accounts of the United States Note: Due to rounding, totals may not add up exactly.
Research and Development and Offset-Related Technology Transfer Trends
Comparing reported offset transactions involving technology transfer to total research and
development (R&D) expenditures in the United States provides, for purposes of context, a
measure of the magnitude of this type of offset activity. In Table 4-6, 2015 data is utilized to
illustrate the relationship between the offset-related technology transfer and total U.S. research
31
This is an estimate. Value-added data from the Census’ Annual Survey of Manufacturers (ASM) was not
available for 2015. Consequently, 2012-2014 ASM data was used. 32
Value-added Output/Employee data for 2013 and 2014 is an estimate. 33
Value-added Output/Employee data for 2013 and 2014 is an estimate.

19
and development expenditures. As shown in Table 4-6, in 2015, the value of reported offset
transactions that involved technology transfers was $554 million, equivalent to 0.11 percent of
total R&D spending in the United States.34
Table 4-6: Trends in U.S. R&D Spending and Reported Offset Transactions Involving Technology Transfer,
2004-2015
Year Reported Technology Transfer
Offset Transactions
Total Private and Federal R&D
Expenditures
Technology Transfer Transactions as a
Percentage of R&D Spending
2004 $669,457,809 $302,503,000,000 0.22%
2005 $1,479,648,075 $324,993,000,000 0.46%
2006 $717,679,906 $352,567,000,000 0.20%
2007 $709,925,212 $379,454,000,000 0.19%
2008 $958,313,688 $406,952,000,000 0.24%
2009 $986,715,904 $405,343,000,000 0.24%
2010 $874,836,815 $409,037,000,000 0.21%
2011 $672,618,738 $428,675,000,000 0.16%
2012 $612,402,005 $436,151,000,000 0.14%
2013 $873,225,615 $456,584,000,000 0.19%
2014 $374,540,811 $477,708,000,000 0.08%
2015 $553,653,292 $499,299,000,000 0.11%
Sources: BIS Offset Database and the National Science Foundation, National Center for Science and Engineering Statistics: 2015. National Patterns of R&D Resources: 2008-2015 Data Update, September 2016.
Note: Some 2014 R&D expenditure data are preliminary and may later be revised. The data for 2015 are estimates and will later be revised. The values shown are in current $millions.
BIS does not collect data from industry on the specific technologies transferred as a result of
offset agreements and offset transactions. However, anecdotal information obtained from
industry suggests that “cutting edge” or nascent technologies under development in the United
States are less likely to be transferred to foreign companies in fulfillment of offset obligations
than are mature technologies. Regardless, any transfer of export-controlled technology must be
approved through the U.S. Government’s export licensing processes. The existence of an offset
agreement does not allow companies to circumvent the established licensing processes managed
by the Departments of Commerce and State, in consultation with DOD.
34
This figure does not mean that U.S. industry lost 0.11 percent of its R&D spending in 2015. Rather, the number
indicates that the actual value of offset transactions involving technology transfer was equivalent to 0.11 percent of
domestic R&D spending.
20
Domestic Defense Productive Capability
DOD has stated that the industrial base on which it draws must be reliable, cost-effective, and
sufficient to meet strategic objectives. DOD’s ultimate objective is to have reliable, cost-
effective, and sufficient industrial capabilities to develop, produce, and support the defense
material necessary to support national defense.35
DOD is willing to use reliable foreign suppliers when such use offers comparative advantages in
performance, cost, schedule, or coalition operations. DOD has negotiated bilateral Reciprocal
Defense Procurement Memoranda of Understanding (RDP MOUs) with 25 countries. The RDP
MOUs include procurement principles and procedures that provide transparency and access for
each country’s industry to the other country’s defense market. The RDP MOU relationship
facilitates defense cooperation and promotes rationalization, standardization, and interoperability
of defense equipment. Based on these RDP MOUs, the Secretary of Defense or Deputy
Secretary of Defense has made blanket public interest exceptions to the Buy American Act (41
U.S.C. 10a-d) for 22 of the 25 RDP MOU partners. As a result of these blanket exceptions, these
22 countries’ products are evaluated on the same basis as domestic products in competitive DOD
procurements.
Despite the capabilities that may accrue to foreign firms resulting from offset agreements signed
with U.S. industry, purchases from foreign firms do not represent a significant share of DOD’s
total purchases. According to DOD data on its purchases from foreign entities, its procurement
actions during Fiscal Year 2015 totaled approximately $273 billion, of which $11.3 billion or 4.1
percent was expended on purchases from foreign entities. Defense equipment constituted
approximately 13 percent of the purchases from foreign entities. Fuel, services, construction,
and subsistence accounted for 79 percent, with the remaining eight percent covering a variety of
other categories.36
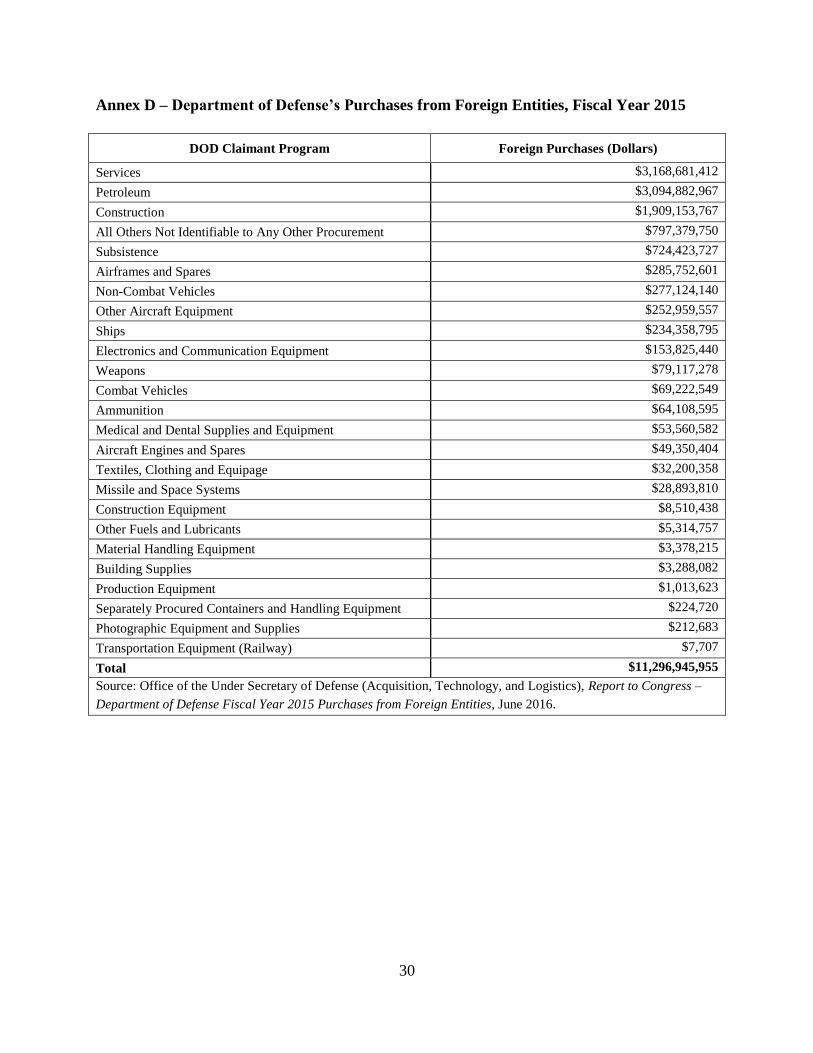
See Annex D for an overview of DOD’s Fiscal Year 2015 purchases from foreign entities by
claimant programs.
35
See Office of the Under Secretary of Defense (Acquisition, Technology, and Logistics), Office of Manufacturing
and Industrial Base Policy, Annual Industrial Capabilities Report to Congress, October 2013. 36
See Office of the Under Secretary of Defense (Acquisition, Technology, and Logistics), Report to Congress –
Department of Defense Fiscal Year 2015 Purchases from Foreign Entities, June 2016.
21
5 Utilization of Annual Report
The data contained in this report is considered and utilized by BIS and other representatives of
the United States during bilateral and multilateral discussions with foreign governments to limit
the adverse effects of offsets. For instance, BIS discussed offsets with representatives from the
European Defense Agency (EDA) and the European Commission (EC) during the year. In 2015,
U.S. firms reported entering into three new offset agreements with members of the EDA valued
at $35.5 million. EDA members accounted for 7.89 percent of the new offset agreements
reported by U.S. firms in 2015 based on quantity and 0.45 percent based on value. In 2015, U.S.
firms reported 177 offset transactions with EDA members with an actual value of $683.1 million,
and an offset credit value of $805.3 million. The EDA members accounted for 27.19 percent of
all offset transactions reported by U.S. firms in 2015 based on quantity and for 13.53 percent of
the overall offset transaction value.

22
Annex A (Not For Public Release)

23
Annex B (Not For Public Release)

24
Annex C – Overview of Offset Transactions by Category, 1993-2015
Table C-1: Offset Transactions by Type Year Total Direct Indirect Unspecified Direct Indirect Unspecified
Actual Value ($ millions) % Distribution 1993 $1,898 $637 $1,197 $64 33.55% 63.09% 3.36%
1994 $1,935 $628 $1,202 $104 32.47% 62.14% 5.39%
1995 $2,890 $1,109 $1,757 $25 38.36% 60.78% 0.86%
1996 $2,876 $1,249 $1,626 $1 43.42% 56.53% 0.05%
1997 $2,721 $1,042 $1,658 $21 38.29% 60.93% 0.79%
1998 $2,312 $1,470 $842 $0 63.56% 36.43% 0.01%
1999 $2,060 $700 $1,349 $11 33.97% 65.47% 0.55%
2000 $2,190 $767 $1,412 $11 35.04% 64.48% 0.49%
2001 $2,543 $928 $1,615 $0 36.49% 63.51% 0.00%
2002 $2,620 $958 $1,660 $1 36.58% 63.37% 0.05%
2003 $3,563 $1,110 $2,447 $6 31.17% 68.68% 0.16%
2004 $4,935 $2,536 $2,398 $1 51.39% 48.60% 0.01%
2005 $4,722 $1,798 $2,924 $0 38.07% 61.93% 0.00%
2006 $4,706 $1,689 $2,999 $18 35.89% 63.72% 0.39%
2007 $3,805 $1,890 $1,906 $9 49.68% 50.09% 0.23%
2008 $3,291 $1,571 $1,719 $1 47.74% 52.24% 0.02%
2009 $3,495 $1,299 $2,191 $5 37.17% 62.68% 0.15%
2010 $3,608 $1,194 $2,277 $137 33.10% 63.11% 3.80%
2011 $3,880 $1,907 $1,899 $74 49.14% 48.95% 1.91%
2012 $3,438 $1,188 $1,635 $615 34.56% 47.56% 17.88%
2013 $3,189 $1,088 $2,086 $15 34.13% 65.41% 0.46%
2014 $3,864 $990 $2,867 $7 25.63% 74.20% 0.17%
2015 $5,049 $2,113 $2,648 $289 41.84% 52.44% 5.72%
Total $75,588 $29,860 $44,313 $1,415 39.5% 58.63% 1.87%
Credit Value ($ millions) % Distribution 1993 $2,214 $737 $1,408 $69 33.31% 63.59% 3.10%
1994 $2,206 $802 $1,295 $109 36.38% 58.69% 4.93%
1995 $3,593 $1,303 $2,251 $39 36.26% 62.65% 1.09%
1996 $3,098 $1,182 $1,880 $36 38.15% 60.68% 1.16%
1997 $3,272 $1,183 $2,039 $50 36.17% 62.31% 1.52%
1998 $2,623 $1,629 $991 $3 62.11% 37.79% 0.10%
1999 $2,808 $1,134 $1,604 $70 40.38% 57.12% 2.50%
2000 $2,749 $1,049 $1,689 $11 38.16% 61.45% 0.39%
2001 $3,201 $1,219 $1,982 $0 38.08% 61.92% 0.00%
2002 $3,148 $1,128 $2,019 $1 35.83% 64.13% 0.04%
2003 $4,008 $1,213 $2,783 $12 30.26% 69.44% 0.30%
2004 $5,366 $2,665 $2,700 $1 49.66% 50.33% 0.01%
2005 $5,439 $1,871 $3,568 $0 34.40% 65.60% 0.00%
2006 $4,906 $1,635 $3,258 $14 33.32% 66.40% 0.28%
2007 $4,742 $2,499 $2,226 $17 52.70% 46.95% 0.35%
2008 $4,768 $2,756 $2,009 $3 57.79% 42.14% 0.07%
2009 $4,129 $1,645 $2,478 $5 39.84% 60.03% 0.13%
2010 $4,477 $1,799 $2,639 $39 40.18% 58.94% 0.87%
2011 $5,062 $2,789 $2,198 $74 55.11% 43.43% 1.46%
2012 $3,843 $1,301 $1,674 $868 33.85% 43.57% 22.58%
2013 $3,563 $1,329 $2,219 $15 37.29% 62.29% 0.42%
2014 $4,289 $1,143 $3,133 $13 26.65% 73.04% 0.31%
2015 $5,323 $2,221 $2,809 $293 41.73% 52.76% 5.50%
Total $88,826 $36,232 $50,853 $1,434 40.79% 57.25% 1.796%
Source: BIS Offset Database
Note: Due to rounding, totals may not add up exactly. Figures for certain previous years have been revised. The values shown have not been adjusted for inflation.

25
Table C-2: Number of Offset Transactions by Type and with Multipliers
Year
Number of Transactions Transactions with Multipliers
Greater than 1
Total Direct Indirect Unspecified Number of
Transactions
Percent of
Total
Transactions
1993 444 160 280 4 66 14.86%
1994 566 178 383 5 83 14.66%
1995 711 204 505 2 110 15.47%
1996 634 228 404 2 64 10.09%
1997 578 202 372 4 61 10.55%
1998 582 241 340 1 87 14.95%
1999 513 212 296 5 87 16.96%
2000 626 215 409 2 82 13.10%
2001 616 223 393 0 113 18.34%
2002 734 200 533 1 83 11.31%
2003 689 179 506 4 64 9.29%
2004 710 375 334 1 74 10.42%
2005 624 210 414 0 52 8.33%
2006 661 288 371 2 33 4.99%
2007 633 294 337 2 88 13.90%
2008 671 226 443 2 73 10.88%
2009 702 261 440 1 112 15.95%
2010 707 210 496 1 114 16.12%
2011 740 256 467 17 77 10.41%
2012 690 213 402 75 73 10.58%
2013 546 191 354 1 45 8.24%
2014 672 180 488 4 75 11.16%
2015 651 205 444 2 43 6.61%
Total 14,700 5,151 9,411 138 1,759 11.97%
Source: BIS Offset Database
Note: Because of rounding, totals may not add up exactly. Figures for certain previous years have been revised.
26
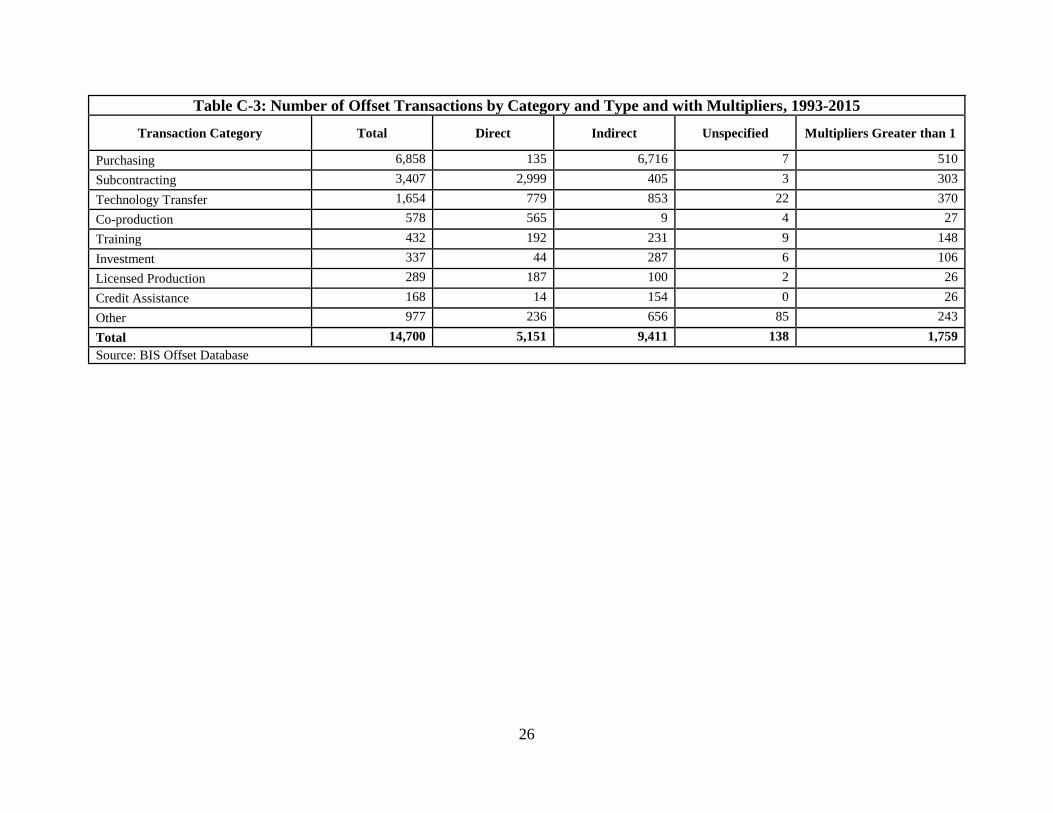
Table C-3: Number of Offset Transactions by Category and Type and with Multipliers, 1993-2015
Transaction Category Total Direct Indirect Unspecified Multipliers Greater than 1
Purchasing 6,858 135 6,716 7 510
Subcontracting 3,407 2,999 405 3 303
Technology Transfer 1,654 779 853 22 370
Co-production 578 565 9 4 27
Training 432 192 231 9 148
Investment 337 44 287 6 106
Licensed Production 289 187 100 2 26
Credit Assistance 168 14 154 0 26
Other 977 236 656 85 243
Total 14,700 5,151 9,411 138 1,759
Source: BIS Offset Database

27
Table C-4: Offset Transactions by Category, Type, and Value, 1993-2015
Transaction
Category
Actual Values ($ millions) Percent by Column Total
Total Dir. Ind. Unsp. Total Dir. Ind. Unsp.
Co-production $3,787.24 $3,734.39 $11.10 $41.76 5.01% 12.51% 0.03% 2.95%
Credit Assistance $2,081.39 $220.86 $1,860.53 - 2.75% 0.74% 4.20% -
Investment $2,241.41 $471.72 $1,679.02 $90.67 2.97% 1.58% 3.79% 6.41%
Licensed Production $2,248.93 $1,234.50 $990.40 $24.03 2.98% 4.13% 2.23% 1.70%
Other $5,492.26 $1,148.10 $3,445.45 $898.71 7.27% 3.84% 7.78% 63.53%
Purchase $29,316.21 $1,509.00 $27,771.57 $35.64 38.78% 5.05% 62.67% 2.52%
Subcontracting $14,970.86 $14,034.13 $923.40 $13.33 19.81% 47.00% 2.08% 0.94%
Technology Transfer $13,536.82 $6,815.27 $6,415.93 $305.62 17.91% 22.82% 14.48% 21.60%
Training $1,912.59 $691.76 $1,215.96 $4.87 2.53% 2.32% 2.74% 0.34%
Total $75,587.71 $29,859.72 $44,313.35 $1,414.63 100.00% 100.00% 100.00% 100.00%
Transaction
Category
Credit Values ($ millions) Percent by Column Total
Total Dir. Ind. Unsp. Total Dir. Ind. Unsp.
Co-production $4,263.21 $4,210.35 $11.10 $41.76 4.80% 11.62% 0.02% 2.40%
Credit Assistance $2,340.68 $290.11 $2,050.57 - 2.64% 0.80% 4.03% -
Investment $3,810.16 $849.17 $2,819.61 $141.37 4.29% 2.34% 5.54% 8.12%
Licensed Production $2,780.80 $1,566.40 $1,183.17 $31.23 3.13% 4.32% 2.33% 1.79%
Other $8,047.28 $2,402.97 $4,427.47 $1,216.84 9.06% 6.63% 8.71% 69.90%
Purchase $31.150.21 $1,537.88 $29,570.04 $42.29 35.07% 4.24% 58.15% 2.43%
Subcontracting $16,966.45 $15,907.03 $1,046.09 $13.33 19.10% 43.90% 2.06% 0.77%
Technology Transfer $16,304.90 $7,974.27 $8,094.64 $235.99 18.36% 22.01% 15.92% 13.56%
Training $3,163.23 $1,494.33 $1,650.79 $18.10 3.56% 4.12% 3.25% 1.04%
Total 88,826.922 $36,232.52 $50,853.49 $1,740.91 100.00% 100.00% 100.00% 100.00%
Source: BIS Offset Database
Note: Due to rounding, totals may not add up precisely. The values shown have not been adjusted for inflation.

28
Table C-5: Offset Transactions by Category ($ thousands)
Year
Co-Production Credit Assistance Investment Licensed Production All Others
Actual
Value
Credit
Value
Total
Number
Actual
Value
Credit
Value
Total
Number
Actual
Value
Credit
Value
Total
Number
Actual
Value
Credit
Value
Total
Number
Actual
Value
Credit
Value
Total
Number
1993 $35,550 $35,550 6 $340,492 $366,794 12 $41,499 $41,500 13 $37,851 $41,451 8 $50,967 $68,168 17
1994 $111,895 $112,185 10 $3,494 $21,639 3 $93,265 $98,474 17 $45,424 $67,629 15 $148,742 $163,370 36
1995 $86,898 $86,898 11 $374,248 $468,930 20 $117,152 $363,556 9 $5,110 $4,965 2 $197,760 $295,647 51
1996 $16,952 $22,052 3 $244,270 $258,970 15 $10,656 $10,656 2 $26,425 $26,425 1 $113,266 $257,647 42
1997 $28,339 $28,339 22 $168,410 $168,410 20 $85,126 $271,538 6 $0 $0 0 $454,159 $487,010 64
1998 $94,332 $98,283 30 $43,920 $43,920 4 $0 $0 0 $0 $0 0 $144,550 $157,246 54
1999 $47,803 $47,803 19 $16,888 $16,888 3 $28,475 $219,079 9 $460 $23,000 2 $303,704 $713,077 65
2000 $27,691 $27,691 15 $9,952 $9,952 2 $52,343 $69,621 7 $9,816 $9,816 1 $302,950 $388,093 50
2001 $16,575 $80,300 2 $4,726 $8,027 3 $59,933 $72,945 7 $25,000 $25,000 1 $48,656 $82,960 14
2002 $0 $0 0 $29,453 $29,453 1 $24,484 $85,234 12 $0 $0 0 $135,848 $149,847 28
2003 $260,250 $266,465 18 $51,610 $51,610 6 $172,683 $226,215 13 $1,500 $0 1 $145,262 $297,232 34
2004 $1,395,766 $1,268,666 105 $141,234 $170,453 20 $162,077 $393,819 15 $13,679 $13,679 3 $211,266 $273,924 33
2005 $309,409 $322,204 74 $61,028 $76,828 10 $185,819 $192,387 19 $123,836 $268,326 5 $95,146 $152,360 34
2006 $383,587 $432,089 93 $442,028 $453,521 28 $118,733 $124,593 17 $62,000 $64,000 3 $174,010 $136,966 29
2007 $398,250 $496,255 83 $76,997 $84,164 8 $106,953 $158,986 21 $2,972 $2,972 1 $662,926 $1,046,377 64
2008 $243,888 $519,084 51 $41,641 $54,171 5 $116,063 $168,033 22 $10,393 $10,393 2 $226,486 $626,110 44
2009 $107,080 $107,080 13 $6,377 $6,377 3 $111,923 $160,883 17 $207,742 $214,696 43 $118,210 $242,668 31
2010 $148,300 $237,583 2 $8,745 $19,700 2 $185,338 $306,236 25 $380,277 $398,213 45 $116,107 $222,297 38
2011 $13,943 $13,943 3 $0 $0 0 $112,643 $272,628 35 $307,095 $535,101 56 $165,737 $179,051 27
2012 $58,304 $58,304 12 $15,872 $30,872 3 $43,226 $43,226 7 $308,339 $308,339 34 $754,223 $1,015,158 80
2013 $1,999 $1,365 5 $0 $0 0 $77,457 $83,457 13 $259,362 $347,618 31 $115,434 $126,582 17
2014 $432 $432 1 $0 $0 0 $201,418 $307,478 30 $259,362 $259,362 26 $180,795 $236,431 42
2015 $0 $0 0 $0 $0 0 $134,147 $139,613 21 $159,817 $159,817 9 $626,059 $729,059 83
Source: BIS Offset Database
Note: Figures for certain previous years have been revised. The values shown have not been adjusted for inflation.
29
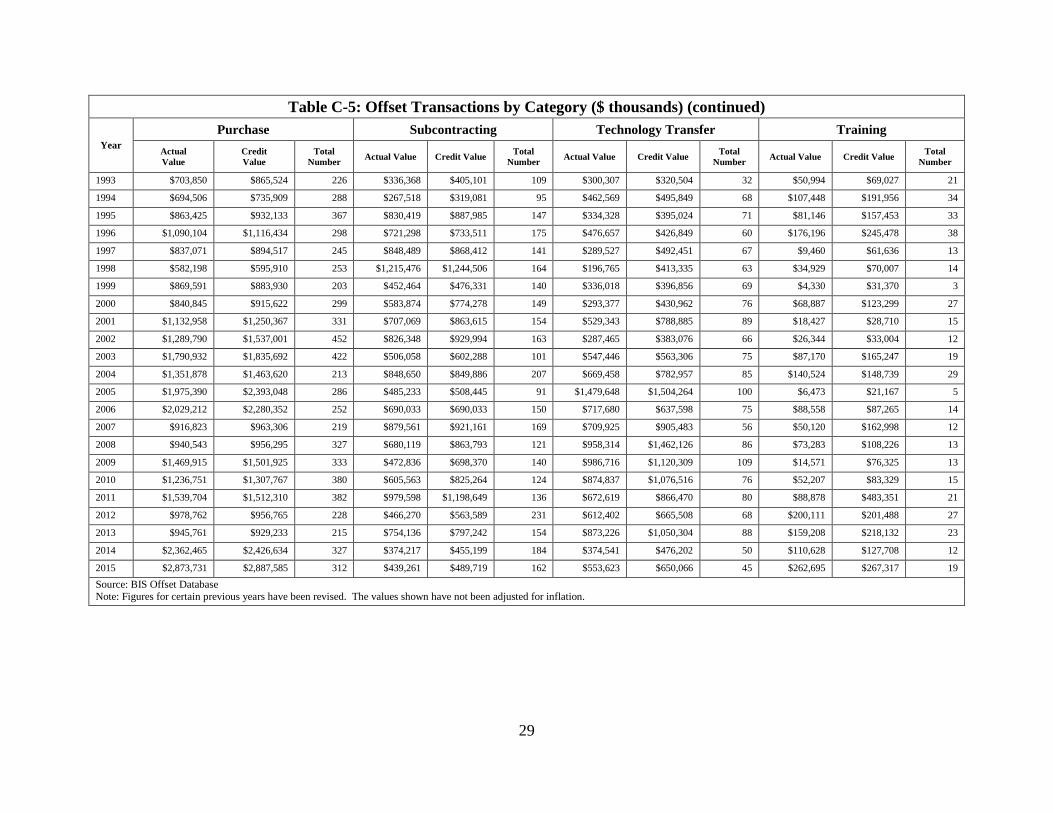
Table C-5: Offset Transactions by Category ($ thousands) (continued)
Year
Purchase Subcontracting Technology Transfer Training
Actual
Value
Credit
Value
Total
Number Actual Value Credit Value
Total
Number Actual Value Credit Value
Total
Number Actual Value Credit Value
Total
Number
1993 $703,850 $865,524 226 $336,368 $405,101 109 $300,307 $320,504 32 $50,994 $69,027 21
1994 $694,506 $735,909 288 $267,518 $319,081 95 $462,569 $495,849 68 $107,448 $191,956 34
1995 $863,425 $932,133 367 $830,419 $887,985 147 $334,328 $395,024 71 $81,146 $157,453 33
1996 $1,090,104 $1,116,434 298 $721,298 $733,511 175 $476,657 $426,849 60 $176,196 $245,478 38
1997 $837,071 $894,517 245 $848,489 $868,412 141 $289,527 $492,451 67 $9,460 $61,636 13
1998 $582,198 $595,910 253 $1,215,476 $1,244,506 164 $196,765 $413,335 63 $34,929 $70,007 14
1999 $869,591 $883,930 203 $452,464 $476,331 140 $336,018 $396,856 69 $4,330 $31,370 3
2000 $840,845 $915,622 299 $583,874 $774,278 149 $293,377 $430,962 76 $68,887 $123,299 27
2001 $1,132,958 $1,250,367 331 $707,069 $863,615 154 $529,343 $788,885 89 $18,427 $28,710 15
2002 $1,289,790 $1,537,001 452 $826,348 $929,994 163 $287,465 $383,076 66 $26,344 $33,004 12
2003 $1,790,932 $1,835,692 422 $506,058 $602,288 101 $547,446 $563,306 75 $87,170 $165,247 19
2004 $1,351,878 $1,463,620 213 $848,650 $849,886 207 $669,458 $782,957 85 $140,524 $148,739 29
2005 $1,975,390 $2,393,048 286 $485,233 $508,445 91 $1,479,648 $1,504,264 100 $6,473 $21,167 5
2006 $2,029,212 $2,280,352 252 $690,033 $690,033 150 $717,680 $637,598 75 $88,558 $87,265 14
2007 $916,823 $963,306 219 $879,561 $921,161 169 $709,925 $905,483 56 $50,120 $162,998 12
2008 $940,543 $956,295 327 $680,119 $863,793 121 $958,314 $1,462,126 86 $73,283 $108,226 13
2009 $1,469,915 $1,501,925 333 $472,836 $698,370 140 $986,716 $1,120,309 109 $14,571 $76,325 13
2010 $1,236,751 $1,307,767 380 $605,563 $825,264 124 $874,837 $1,076,516 76 $52,207 $83,329 15
2011 $1,539,704 $1,512,310 382 $979,598 $1,198,649 136 $672,619 $866,470 80 $88,878 $483,351 21
2012 $978,762 $956,765 228 $466,270 $563,589 231 $612,402 $665,508 68 $200,111 $201,488 27
2013 $945,761 $929,233 215 $754,136 $797,242 154 $873,226 $1,050,304 88 $159,208 $218,132 23
2014 $2,362,465 $2,426,634 327 $374,217 $455,199 184 $374,541 $476,202 50 $110,628 $127,708 12
2015 $2,873,731 $2,887,585 312 $439,261 $489,719 162 $553,623 $650,066 45 $262,695 $267,317 19
Source: BIS Offset Database Note: Figures for certain previous years have been revised. The values shown have not been adjusted for inflation.
30
Annex D – Department of Defense’s Purchases from Foreign Entities, Fiscal Year 2015
DOD Claimant Program Foreign Purchases (Dollars)
Services $3,168,681,412
Petroleum $3,094,882,967
Construction $1,909,153,767
All Others Not Identifiable to Any Other Procurement $797,379,750
Subsistence $724,423,727
Airframes and Spares $285,752,601
Non-Combat Vehicles $277,124,140
Other Aircraft Equipment $252,959,557
Ships $234,358,795
Electronics and Communication Equipment $153,825,440
Weapons $79,117,278
Combat Vehicles $69,222,549
Ammunition $64,108,595
Medical and Dental Supplies and Equipment $53,560,582
Aircraft Engines and Spares $49,350,404
Textiles, Clothing and Equipage $32,200,358
Missile and Space Systems $28,893,810
Construction Equipment $8,510,438
Other Fuels and Lubricants $5,314,757
Material Handling Equipment $3,378,215
Building Supplies $3,288,082
Production Equipment $1,013,623
Separately Procured Containers and Handling Equipment $224,720
Photographic Equipment and Supplies $212,683
Transportation Equipment (Railway) $7,707
Total $11,296,945,955
Source: Office of the Under Secretary of Defense (Acquisition, Technology, and Logistics), Report to Congress –
Department of Defense Fiscal Year 2015 Purchases from Foreign Entities, June 2016.

31
-Co-production
-Subcontracting
-Credit Assistance
-Investment
-Licensed Production
-Technology Transfer
-Training
-Other
Either or Both
-Purchases
Direct
Offsets
Indirect
Offsets
Annex E – Glossary and Offset Example
Actual Value of Offset Transactions: The U.S. dollar value of the offset transaction without
taking into account multipliers or intangible factors.
Co-production: Transactions that are based upon government-to-government agreements
authorizing the transfer of technology to permit foreign companies to manufacture all or part of
U.S.-origin defense articles. Such transactions are based upon an agreement specifically
referenced in Foreign Military Sales (FMS) Letters of Offer and Acceptance (LOA) and a
government-to-government Memorandum of Understanding (MOU). Co-production is always
classified as a direct offset.
Credit Assistance: Credit assistance includes direct loans, brokered loans, loan guarantees,
assistance in achieving favorable payment terms, credit extensions, and lower interest rates.
Credit assistance specifically excludes the use of “banked” offset credits (credits that exceed the
requirement of the offset agreement and are permitted, by the terms of the agreement, to be
applied to future offset obligations). Credit assistance is nearly always classified as an indirect
offset transaction but can also be direct.
Credit Value of Offset Transactions: The U.S. dollar value credited for the offset transaction by
application of a multiplier, any intangible factors, or other methods. The credit value may be
greater than, equal to, or less than the actual value of the offset.
Direct Offsets: An offset transaction directly related to the article(s) or service(s) exported or to
be exported pursuant to the military export sales agreement. The diagram below illustrates how
each category may be classified as direct and/or indirect offsets.
Indirect Offsets: An offset transaction unrelated to the article(s) or service(s) exported or to be
exported pursuant to the military export sales agreement. The diagram below illustrates how
each category may be classified as direct and/or indirect offsets.

32
Investment: Investment arising from an offset agreement, often taking the form of capital
dedicated to the establishment of a foreign entity unrelated to the defense sale or to expanding
the U.S. firm’s subsidiary or joint venture in the foreign country. Investment can be either a
direct or indirect offset.
Licensed Production: Overseas production of a U.S.-origin defense article based upon transfer of
technical information under direct commercial arrangements between a U.S. manufacturer and a
foreign government or producer. Licensed production is not pursuant to a co-production
government-to-government MOU. In addition, licensed production almost always involves a
part or component for a defense system, rather than a complete defense system. Licensed
production transactions can be either direct or indirect offsets.
Multiplier: A factor applied to the actual value of certain offset transactions to calculate the
credit value earned. Foreign purchasers use multipliers to provide firms with incentives to offer
offsets that benefit targeted areas of economic growth. When a “positive” multiplier is applied to
the price of a service or product offered as an offset, the defense firm receives a higher credit
value toward fulfillment of an offset obligation than would be the case without application of a
multiplier. Conversely, foreign purchasers apply “negative” multipliers to discourage certain
types of transactions not thought to be in the best economic interest of the receiving entity.
Example: A foreign government interested in a specific technology may offer a multiplier of
“six” for offset transactions providing access to that technology. A U.S. defense company
with a 120 percent offset obligation from a $1 million sale of defense systems ordinarily
would be required to provide technology transfer through an offset equaling $1.2 million.
With a multiplier of six, however, the U.S. company could offer only $200,000 (actual value)
in technology transfer and earn $1.2 million in credit value, fulfilling its entire offset
obligation under the agreement.
Offset Agreement: Any offset as defined under “offsets” that the U.S. firm agrees to in order to
conclude a military export sales contract. This includes all offsets, whether they are “best effort”
agreements or are subject to penalty clauses.
Offset Transaction: Any activity for which the U.S. firm claims credit for full or partial
fulfillment of the offset agreement. Activities to implement offset agreements are categorized as
co-production, technology transfer, subcontracting, credit assistance, training, licensed
production, investment, purchases, and other.
Offsets: Compensation practices required as a condition of purchase in either government-to-
government or commercial sales of: (1) Defense articles and/or defense services as defined by
the Arms Export Control Act (22 U.S.C. § 2778) and the International Traffic in Arms
Regulations (22 C.F.R. §§ 120-130); or (2) Items controlled under an Export Control
Classification Number (ECCN) that has the numeral ‘‘6’’ as its third character in the Commerce
Control List found in Supplement No. 1 to part 774 of this chapter other than semisubmersible
and submersible vessels specially designed for cargo transport and parts, components,
accessories and attachments specially designed therefor controlled under ECCN 8A620.b; test,

33
inspection and production equipment controlled in ECCN 8B620.b, software controlled in ECCN
8D620.b and technology controlled in ECCN 8E620.b.
Other: An offset transaction other than co-production, credit assistance, licensed production,
investment, purchases, subcontracting, technology transfer, or training.
Purchases: Purchases involve the procurement of off-the-shelf items from the offset recipient.
Purchases are indirect offset transactions.
Subcontracting: In the offset context, subcontracting is the overseas production of a part or
component of a U.S.-origin defense article. The subcontract does not necessarily involve license
of technical information. Instead, it is usually a direct commercial arrangement between the
defense prime contractor and a foreign producer.
Technology Transfer: Transfer of technology that occurs as a result of an offset agreement and
that may take the form of research and development conducted abroad, technical assistance
provided to the subsidiary or joint venture of overseas investment, or other activities under direct
commercial arrangement between the defense prime contractor and a foreign entity.
Training: Generally includes training related to the production or maintenance of the exported
defense item. Training, which can be either direct or indirect offset, may be required in
unrelated areas, such as computer training, foreign language skills, or engineering capabilities.
OFFSET EXAMPLE
This example is for illustrative purposes only and in no way represents an actual offset
agreement. Nation A purchased ten KS-340 jet fighters from a U.S. defense firm, Company B
for a total of $500 million with a related 100 percent offset agreement. In other words, the offset
agreement obligated Company B to fulfill offsets equal to the value of the contract, or $500
million. The government of Nation A decided what would be required of Company B in order to
fulfill its offset obligation, which would include both direct and indirect offsets. The government
also assigned the credit value for each category.
Direct Offsets (i.e., related to the production of the export item, the KS-340 jet fighter)
Technology Transfer: The technology transfer requirement was assigned 36 percent of the total
offset obligation. Company B agreed to transfer all the necessary technology and know-how to
firms in Nation A in order to repair and maintain the jet fighters. The government of Nation A
deemed this capability to be vital to national security and, therefore, gave a multiplier of six. As
a result, the transfer of technology actually worth $30 million was given a credit value of $180
million.
Licensed Production: Firms from Nation A manufactured some components of the KS-340 jet
fighters, totaling $240 million, which accounted for 48 percent of the offset obligation. There
was no multiplier associated with this activity.

34
Indirect Offsets (i.e., not related to the production of the export item, the KS-340 jet fighter)
Purchase: Company B purchased marble statues from manufacturers from Nation A for
eventual resale. These purchases accounted for nine percent of the offset obligation, or $45
million. There was no multiplier associated with this activity.
Technology Transfer: Company B provided submarine technology to firms from Nation A,
which accounted for seven percent of the offset obligation, or $35 million. There was no
multiplier associated with this activity.