Embed Size (px)
Citation preview

U.S. District Court: Vermont
Auto Dealers & Manufacturers versus Vermont Agency of Natural Resources
Declaration of James E. Hansen
03 May 2007
Burlington, Vermont


CO2, CH4 and temperature records from Antarctic ice core dataSource: Vimeux, F., K.M. Cuffey, and Jouzel, J., 2002, "New insights into Southern Hemisphere temperature changes from Vostok ice cores using deuterium excess correction", Earth and Planetary Science Letters, 203, 829-843.

Ice Age ForcingsImply Global Climate Sensitivity ~ ¾°C per W/m2.
Source: Hansen et al., Natl. Geogr. Res. & Explor., 9, 141, 1993.


Proxy record of Plio-Pleistocene (3.5 million years) temperature and ice volume. Based on oxygen isotope preserved in shells of benthic (deep ocean dwelling) foraminifera.

CO2,CH4 and estimated global temperature (Antarctic ΔT/2 in ice core era)0 = 1880-1899 mean.
Source: Hansen, Clim. Change, 68, 269, 2005.

Implications of Paleo Forcings and Response
1. Chief mechanisms for paleoclimate change GHGs & ice sheet area, as feedbacks.
2. Chief instigator of climate change was earth orbital change, a very weak forcing.
3. Climate on long time scales is very sensitive to even small forcings.
4. Human-made forcings dwarf natural forcings that drove glacial-interglacial climate change.
5. Humans now control global climate, for better or worse.

Source: Earth's energy imbalance: Confirmation and implications. Science308, 1431, 2005.
(A) Forcingsused to drive climate simulations.
(B) Simulated and observed surface temperature change.

21st Century Global Warming
Climate Simulations for IPCC 2007 Report
► Climate Model Sensitivity 2.7-2.9ºC for 2xCO2(consistent with paleoclimate data & other models)
► Simulations Consistent with 1880-2003 Observations(key test = ocean heat storage)
► Simulated Global Warming < 1ºC in Alternative Scenario
Conclusion: Warming < 1ºC if additional forcing ~ 1.5 W/m2
Source: Hansen et al., to be submitted to J. Geophys. Res.

United Nations Framework Convention on Climate Change
Aim is to stabilize greenhouse gas emissions…
“…at a level that would prevent
dangerous anthropogenic interference with the climate system.”

Metrics for “Dangerous” ChangeIce Sheet Disintegration: Global Sea Level
1. Long-Term Change from Paleoclimate Data2. Ice Sheet Response Time
Extermination of Animal & Plant Species1. Extinction of Polar and Alpine Species2. Unsustainable Migration Rates
Regional Climate Disruptions1. Increase of Extreme Events2. Shifting Zones/Freshwater Shortages

SST in Pacific Warm Pool (ODP site 806B, 0°N, 160°E) in past millennium. Time scale expanded in recent periods. Data after 1880 is 5-year mean.Source: Medina-Elizalde and Lea, ScienceExpress, 13 October 2005;data for 1880-1981 based on Rayner et al., JGR, 108, 2003, after 1981 on Reynolds and Smith, J. Climate, 7, 1994.
kyr Before Present Date

Increasing Melt Area on Greenland
• 2002 all-time record melt area • Melting up to elevation of 2000 m• 16% increase from 1979 to 2002 70 meters thinning in 5 years
Satellite-era record melt of 2002 was exceeded in 2005.Source: Waleed Abdalati, Goddard Space Flight Center

Melt descending into a moulin, a vertical shaftcarrying water to ice sheet base.
Source: Roger Braithwaite, University of Manchester (UK)
Surface Melt on Greenland

Jakobshavn Ice Stream in Greenland
Discharge from major Greenland ice streams is accelerating markedly.
Source: Prof. Konrad Steffen, Univ. of Colorado

Greenland Mass Loss – From Gravity Satellite

Location and frequency of glacial earthquakes on Greenland. Seismic magnitudes are in range 4.6 to 5.1.Source: Ekstrom, Nettles and Tsai, Science, 311, 1756, 2006.
Earthquake Locations Annual Number of Quakes*
* 2005 bars capture only first 10 months of 2005
Glacial Earthquakes on Greenland

Areas Under Water: Four Regions
Paleoclimate Sea Level Data
1. Rate of Sea Level Rise- Data reveal numerous cases of rise of several m/century (e.g., MWP 1A)
2. “Sub-orbital” Sea Level Changes- Data show rapid changes ~ 10 m within interglacial & glacial periods
Ice Sheet Models Do Not Produce These
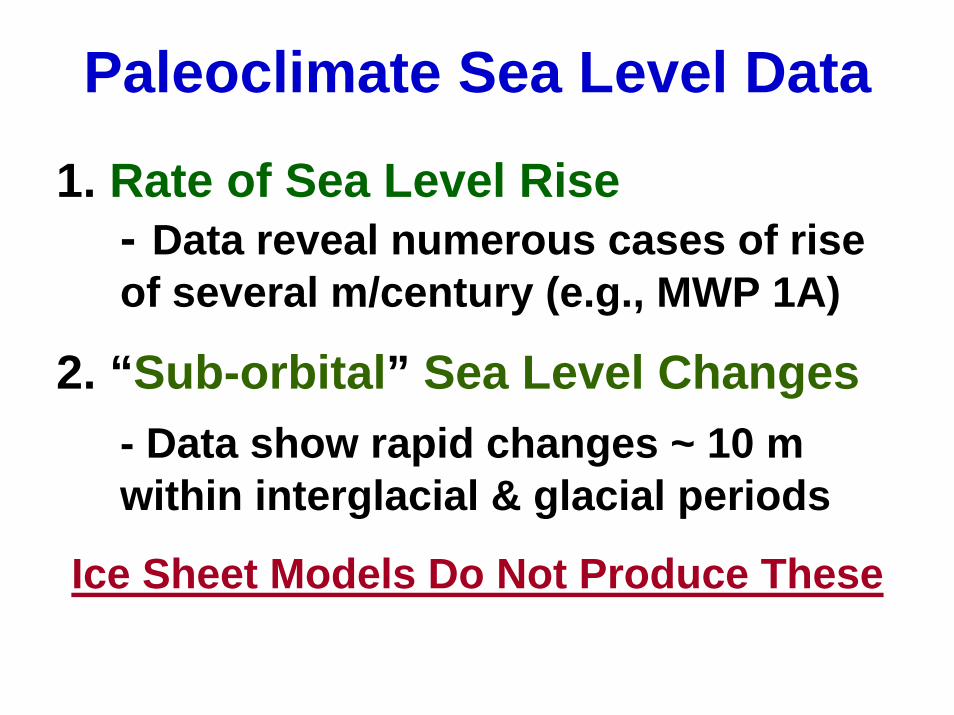
Summary: Ice Sheets1. Human Forcing Dwarfs Paleo Forcing
and Is Changing Much Faster
2. Ice Sheet Disintegration Starts Slowly but Multiple Positive Feedbacks Can Lead to Rapid Non-Linear Collapse
3. Equilibrium Sea Level Rise for ~3C Warming (25±10 m = 80 feet) Implies the Potential for Us to Lose Control

Extermination of Species (a.k.a. decrease of biological diversity)
1. Distributions of plants and animals reflect climate
2. Extinctions occurring due to a variety of stresses
3. Added stress of climate change forces migrations
4. Some paths blocked by natural/human barriers
5. Migrations (~6 km/decade) < isotherm movement
6. Non-linear because of species extinctions
large difference between BAU/alternative scenarios

Mt. Graham Red Squirrel
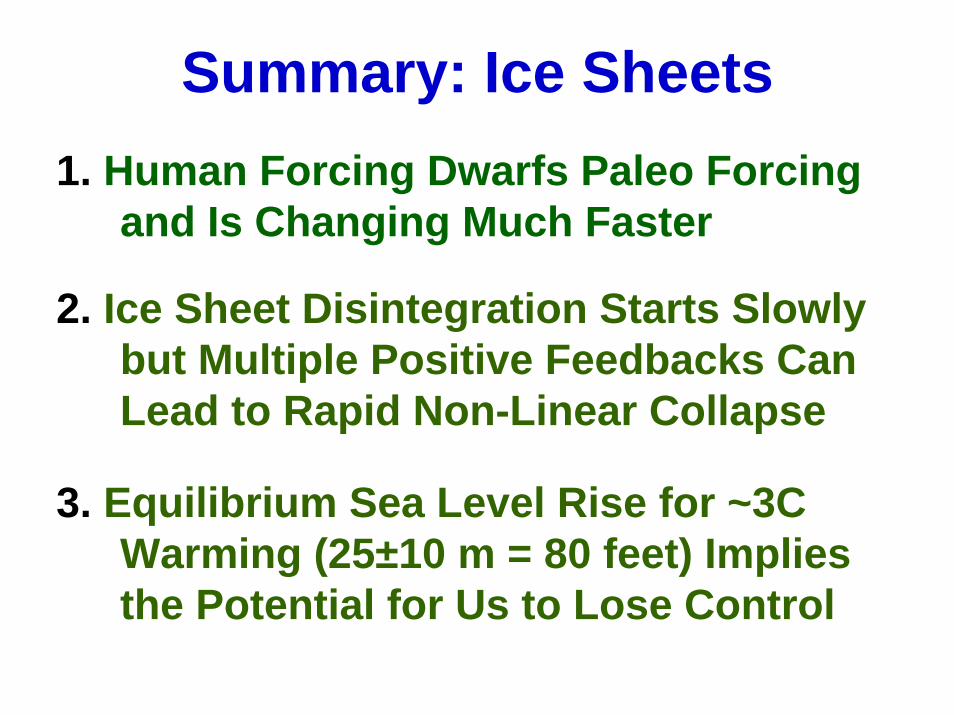
Arctic Climate Impact Assessment (ACIA)
Sources: Claire Parkinson and Robert Taylor

Simulated precipitation change in response to climate forcings estimated for 1880-2000.Source: Hansen et al., JGR 110, D18104, 2005.

Expected Precipitation Changes1. Increased Precipitation
- Tropical Rain-Belt over Ocean- Polar Regions
2. Increased Drought in Subtropics- Western United States- Mediterranean Region- Parts of Africa/Southern Australia
BAU Super-Drought in U.S. WestIncreased Extremes & Fire Intensity

Growth rate of atmospheric CO2 (ppm/year).Source: Hansen and Sato, PNAS, 101, 16109, 2004.


U.S. Auto & Light Truck CO2 Emissions
Source: On the Road to Climate Stability, Hansen, J., D. Cain and R. Schmunk., to be submitted.
“Moderate Action” is NRC “Path 1.5” by 2015 and “Path 2.5” by 2030.
“Strong Action” adds hydrogen-powered vehicles in 2030 (30% of 2050 fleet). Hydrogen produced from non-CO2 sources only.

Responsibility for CO2 Emissions and Climate Change

Summary: Is There Still Time?Yes, But:
Alternative Scenario is Feasible,But It Is Not Being Pursued
Action needed now. A decade of Business-as-Usual eliminates Alternative Scenario