Embed Size (px)
Citation preview
ITJ 18(1) #13915
U.S. ECONOMIC SANCTIONS:
An Empirical Study
Jiawen YangHossein Askari
John ForrerHildy Teegen
Using a gravity model, we conduct an empirical analysis ofthe impact of U.S. economic sanctions on U.S. trade with targetcountries and on third countries. Our findings show that theimpact on U.S. trade is very sensitive to how the sanctionedcountry list is identified and selected. We find no significantimpact of U.S. economic sanctions on trade between the UnitedStates and countries that are subject to selective sanctions. Foronly countries subject to comprehensive sanctions have we found asignificant reduction in bilateral trade; and these same sanctionsincreased trade between target countries and the EU or Japan.Using a sample that includes only the formerly planned economiesthat were long the target of U.S. economic sanctions in recenthistory, our results show that U.S. economic sanctions have a
Jiawen Yang is an Associate Professor of International Businessand International Affairs at The George Washington University.
Hossein Askari is the Iran Professor of International Businessand International Affairs at The George Washington University.
John Forrer is a Research Professor and Director of the Center forthe Study of Globalization at The George Washington University.
Hildy Teegen is an Associate Professor of International Businessand International Affairs at The George Washington University.
ISSN: 0885-3908 print/1521-0545 online. DOI: 10.1080/08853900490277341THE INTERNATIONAL TRADE JOURNAL, Volume XVIII, No. 1, Spring 2004 23
24 THE INTERNATIONAL TRADE JOURNAL
significant impact on U.S. exports, imports, and total trade withthese countries, and these effects have lingered for more than adecade after the Cold War had ended.
* * * * *
I. INTRODUCTION
The United States has relied heavily on unilateral economicsanctions as an instrument of its foreign policy. The focus ofthe literature on unilateral economic sanctions has been two-fold: their effectiveness and their impacts on the sender (thesanction imposing) country. Two basic research methods havebeen employed: case studies and econometric estimations. Asto effectiveness, most studies conclude that unilateral economicsanctions are ineffective. As is pointed out in a recent studyby the Center for Strategies and International Studies (CSIS),if the purpose of the unilateral sanctions is to compel othercountries to change their behavior, the unfortunate reality isthat they rarely work (CSIS, 1999). But that does not meanunilateral economic sanctions have no impact on the senderor the target countries. For the United States, comprehensiveeconomic sanctions cut public and private economic interactionwith the target country and constrain most forms of politicalengagement. In addition, unilateral sanctions place a burden onU.S. companies and workers and on the economy as a whole—tothe benefit of their international competitors (CSIS, 1999). Forthe target countries, these sanctions cause isolation, reductionin trade and investment flows, and deterioration in their overalleconomic welfare.
The literature on economic sanctions seems, however, tobe somewhat unbalanced. There are more case studies thaneconometric analysis; the studies are more focused on the sender
Yang et al.: U.S. Economic Sanctions . . . 25
countries than the target countries. Hufbauer et al. (1997) isamong the few empirical studies of U.S. unilateral economicsanctions using comprehensive economic (trade) data to quantifythe impact of economic sanctions.
Using a so-called “gravity model,” a common method ineconomics for analyzing bilateral flows of goods, Hufbauer et al.(1997) estimated the reduction of U.S. exports to a number oftarget countries, claiming that the reduction in U.S. exportsin 1995 may have eliminated 200,000 high-paid jobs with anassociated loss of nearly $1 billion a year in export sectorwage premiums. Their findings suggest a relatively high cost ofeconomic sanctions to the U.S. economy while sanctions are inplace.
Our objective is to conduct a comprehensive empirical anal-ysis of U.S. unilateral economic sanctions and measure the eco-nomic impact on the United States and on third countries. Wefollow Hufbauer et al. (1997) in adopting the gravity model foreconometric estimation, but extend their study in several as-pects. First, we will employ a much longer time series for ourstudy—from 1980 to 1998. Second, we will estimate the cost ofU.S. economic sanctions on U.S. exports, imports, and total tradeseparately. Third, we will use the European Union and Japan,the two main competitors for U.S. trade, to analyze the third-country effect of U.S. unilateral economic sanctions.
The remainder of the article is organized as follows. InSection II we provide a description of the gravity model andits application in the study of economic sanctions, particularlythe Hufbauer et al. (1997) study. In Section III we lay out theempirical model and specify the data we use in our study. Inthe ensuing section we provide estimates from our model anddiscuss the impact of U.S. unilateral sanctions on the U.S. trade.Whether the European Union and Japan have served as third-country conduits for target countries and benefited from U.S.
26 THE INTERNATIONAL TRADE JOURNAL
economic sanctions is examined in Section V. In the final sectionwe summarize our findings and provide directions for futureresearch.
II. THE GRAVITY MODEL AND ITSAPPLICATION IN ECONOMICSANCTION STUDIES
Newton’s theory of gravitation has been used for a longtime in social sciences and is considered especially useful forthe analysis of bilateral trade flows because it provides anempirically tractable framework. The application in internationaltrade is based on the premise that large economic entitiessuch as countries or cities exert pulling power on people ortheir products. The simplest form of the gravity model forinternational trade posits that the volume of exports between anytwo trading partners is an increasing function of their nationalincomes, and decreasing function of the distance between them(Wall, 1999). The idea is that countries with a larger economytend to trade more in absolute terms, while geographical distance(a proxy for transportation costs) should depress bilateral trade(Dell’Ariccia, 1999).
The gravity equation has been used in the analysis ofa variety of international trade issues. Gould (1994) used amodified gravity model to study the empirical implications ofimmigrant links to their home country for U.S. bilateral tradeflows. Aturupane (1999) developed a model that incorporatedcorruption in international trade and derived a gravity equationthat related exports to the degree of corruption in the importingcountry as well as to other factors that determined trade flows.Dell’Ariccia (1999) used a gravity model and panel data fromWestern Europe to analyze the effects of exchange rate volatility
Yang et al.: U.S. Economic Sanctions . . . 27
on bilateral trade flows. Exchange rate uncertainty was found tohave a negative effect on international trade.
The gravity model has also been a major empirical frame-work for studies of economic sanctions and other discriminatorytrade arrangements. Oguledo and Macphee (1994) used gravitymodels to estimate trade flows from 162 countries into 11 majorimporting countries for 1976. A major innovation of their studywas that both tariffs and dummy variables for discriminatory ar-rangements were incorporated. In his quantitative assessment ofU.S. export disincentives, Richardson (1993) estimated the lossesof U.S. exports based on the gravity model. He found that themost severe U.S. export disincentives appeared to be export con-trols on shipments to countries due to antiproliferation and ColdWar considerations and by U.S. embargoes and sanctions aimedat enforcing foreign policy. The estimated forgone U.S. exports inhis study ranged from $1.7 billion to $19.9 billion in 1989 for theformer Soviet Union, China, and Eastern Europe, and from $2.4billion to $3.1 billion for other countries subject to U.S. foreignpolicy sanctions.
The work of Hufbauer and his colleagues (Hufbauer et al.,1997) is among the most prominent empirical studies of U.S.economic sanctions. They used a gravity model to investigatethe impact of U.S. economic sanctions on U.S. exports, employ-ment, and wages. Like most other users of the model, they pre-dicted that the amount of trade between two countries wouldbe positively related to the size of their economic outputs, andnegatively related to the distance between them. In addition tosize and distance, Hufbauer et al. (1997) examined other vari-ables and predicted that bilateral trade would increase if thetwo countries shared a common border or a common language,or were both members of the same trade bloc. They employeddummy variables to represent different severities of economic
28 THE INTERNATIONAL TRADE JOURNAL
sanctions (extensive, moderate, and limited sanctions) and tocapture their effect on bilateral trade flows. Their data set in-cluded bilateral trade (exports plus imports) among 88 countriesfor 1985, 1990, and 1995, and U.S. exports to selected countriesfor 1995.
The Hufbauer et al. (1997) study produced a number ofinteresting findings. First, when economic sanctions are in place,extensive sanctions had a large impact on bilateral trade flows,consistently reducing them by around 90 percent. There wasmore variance in the estimated impact of moderate and limitedsanctions and the results were not quite as robust, but theysuggested an average reduction in bilateral trade of roughly aquarter to a third.
Second, contrary to common belief, there was only limitedevidence that sanctions continue to depress trade after theyhave been lifted. The authors attributed this finding to thehighly aggregated nature of the data they used. Long-termeffects of sanctions might be expected to be relatively moresevere for particular sectors, such as sophisticated equipment andinfrastructure, than for exports in the aggregate.
Third and most importantly, they found that U.S. economicsanctions in 1995 might have reduced U.S. exports to 26 targetcountries by as much as $15 billion to $19 billion. If there were nooffsetting increase in exports to other markets, that would mean areduction of more than 200,000 jobs in the relatively higher-wageexport sector and consequent loss of nearly $1 billion annuallyin export sector wage premiums. This was, the study claimed, arelatively high cost to the U.S. economy while sanctions were inplace.
While Hufbauer et al.’s (1997) work is deservedly the best-known econometric work on the subject, it is still open to anumber of questions. First, U.S. sanctions can be on exportsto a target country, on imports from a target country or on
Yang et al.: U.S. Economic Sanctions . . . 29
both exports and imports. Moreover, the United States canbe a major source of imports to a target country, a majordestination of exports from a target country, or both. Thus itwould be most useful to examine the impact of sanctions onexports and imports separately. Hufbauer et al. (1997) mademore extensive use of total bilateral trade (exports to andimports from a target country) but examined exports separatelyfor only one year. Second, a priori, we expect that econometricresults would be highly sensitive to the sanction classification(limited, moderate, extensive) used. We, therefore, need to trya number of classification schemes to test the sensitivity of theresults to sanction classification. Third, Hufbauer et al. (1997)used data for three years over the period of a decade (1985, 1990,1995). Three years may be too limited for broad generalizationsand a span of a decade may be too short to incorporate changesin international trade patterns over time.
From an empirical perspective, some explanatory variablesincluded in the Hufbauer et al. (1997) study may presentmulticollinearity problems, which are not explicitly discussedin their paper. The variables representing distance, adjacency,shared language, and trading bloc may be correlated with oneanother. For example, adjacency (countries sharing a commonborder) is likely to be highly correlated with distance. It alsoseems to be obvious that countries that are members of thesame trading bloc tend to be geographically adjacent and closein distance.
We cannot incorporate modifications to account for all ofthese shortcomings, but we will endeavor to incorporate anumber of these elements into our estimation. Specifically, wewill study the impact of U.S. economic sanctions on U.S. totalbilateral trade, exports, and imports separately. We will also lookinto the third-country effects by examining how U.S. economicsanctions have affected EU and Japan’s trade.
30 THE INTERNATIONAL TRADE JOURNAL
III. THE EMPIRICAL MODEL, DATA, ANDMETHODOLOGY
Following conventional wisdom, particularly the Hufbaueret al. (1997) study, we adopt the gravity model as our basicempirical framework to analyze the impact of U.S. unilateraleconomic sanctions. Controlling for GDP and distance, themodel allows the user to isolate the effects of anomalies ininternational trade such as economic sanctions and other traderestrictions. More specifically, we have two objectives. First, wewould like to investigate the impact of U.S. economic sanctionson the U.S. itself—on its total bilateral trade (exports plusimports) and its exports and imports separately. Second, we willlook into the third-country effects of U.S. unilateral economicsanctions. It is believed that in the aftermath of U.S. sanctions,the sanctioned countries switch their trade from the UnitedStates to other countries. To the extent that trade is switched,these third-country effects may very well render U.S. unilateralsanctions ineffective. We have selected the European Union andJapan as our third country examples, as they are importantalternate trading partners (and main U.S. competitors) in manysectors.
Besides economic size and geographical distance, we willalso include two other variables that are expected to influencebilateral trade flows. One is a country’s income level as measuredby GDP per capita, and the other is an indicator that identifieswhether a country belongs to a trade bloc, promoting intra-bloctrade.
Ordinary-least-squares (OLS) regression is used to estimatethe gravity equations. As stated in Hufbauer et al. (1997), themain advantage of OLS analysis is that it can be used to estimatethe independent effect of each factor, holding constant the effectsof the other variables in the equation.
Yang et al.: U.S. Economic Sanctions . . . 31
While the methodological setting of our study resembles thatof the Hufbauer et al. (1997) study, our focus and coverage differfrom theirs in several aspects.
First, Hufbauer et al. (1997) used different samples for theiranalysis of bilateral trade (exports + imports) and U.S. exports.For bilateral trade, Hufbauer et al. (1997) included 88 countriesand more than three thousand country pairs, but narrowed theirsample to include only the U.S. and its trade partners for theirexport analysis. In this study, we will focus on the United Statesto examine more closely the determinants of U.S. trade flows(exports, imports, as well as total trade) and the impact of U.S.economic sanctions on U.S. trade.
Second, we will use different classification or measures of thesanction variable to see if the results are sensitive to differentclassifications.
Third, Hufbauer et al. (1997) used 1985, 1990, and 1995 datafor their analysis of bilateral trade, and only 1995 for analysis ofexports. They included time lags for the sanctions variables tocapture any lingering effects of U.S. economic sanctions. We willnot use these lagged variables.
Instead, we will employ a much longer and continuous timeseries for our study. Specifically, we will use 19 years (1980–1998)of annual data for U.S. exports, imports, and bilateral trade.This longer time series of data will allow us to investigate, froma historical perspective, any trend changes in U.S. trade andany lingering effects of the impact of economic sanctions on U.S.trade.
Fourth, in their analysis of possible third-country effects,Hufbauer et al. (1997) examined OECD exports. We will includeinstead the European Union and Japan, as they represent twodistinct geographical (or geopolitical) areas. Finally, our samplesize for each year includes all countries whose trade statistics
32 THE INTERNATIONAL TRADE JOURNAL
are available in the CD version of the IMF’s Direction of TradeStatistics. Therefore, the sample size for each year is much largerthan the 88 countries included in the Hufbauer et al. (1997)study.
Our basic empirical model takes the following general format:
(1) ln(TRADEij) = α + β1 ln(GDPi ∗GDPj)
+ β2 ln(GDPPCi ∗GDPPCj)
+ β3 ln(DISTij) + β4SANO
+ β5SANX+ εij
where:
TRADEij is the bilateral trade between country i and countryj. As specified previously, there are three measures for thisvariable—export from country i to country j, import incountry i from country j, and total trade (exports plusimports) between country i and country j. The bilateral tradedata are taken from Direction of Trade Statistics (IMF). Ourtrade data sample spans 19 years from 1980 to 1998.
GDPi ∗ GDPj is the product of GDP of countries i and j. TheGDP data are obtained from World Development Indicators(World Bank). Data are in current U.S. dollars. Dollarfigures for GDP are derived from domestic currencies usingsingle year official exchange rates. Given the gravity modelprediction that two large countries trade more among eachother than smaller countries do, we expect the estimatedcoefficient for this variable to be positive.
GDPPCi ∗ GDPPCj is the product of GDP per capita betweencountries i and j. This variable captures the income effect ininternational trade. Trade tends to rise at a faster rate thanGDP as a country becomes richer, and at a slower rate than
Yang et al.: U.S. Economic Sanctions . . . 33
GDP if the driving force behind a larger economy is simply anincrease in population. One reason is that, as per capita in-come rises, individuals consume a wider variety of goods andservices, which increases the demand for differentiated prod-ucts. The hypothesis that rich countries trade more amongthemselves is also embedded in the intra-industry trade theo-ries which help explain why industrial countries, with similarfactor endowments, trade more among themselves than withdeveloping countries as would be suggested by the Heckscher-Ohlin theory. In addition, wealthier countries tend to havelower trade barriers than poorer ones, which is another rea-son why higher incomes and higher trade levels go together(Hufbauer et al., 1997). The GDP per capita data are takenfromWorld Development Indicators (World Bank). The dataare based on purchasing power parity (PPP).
DISTij is the distance between the countries i and j. Greaterdistance tends to decrease trade, as transport costs andconvenience favor closer sources and markets. We followthe conventional wisdom in using the geographical distancebetween capital cities of the countries included in our samplefor this variable. The data is obtained from John A. Byers,Swedish University of Agricultural Sciences at Alnarp atthe following web site: http://www.vsv.slu.se/johnb/java/lat-long.htm.
SANX and SANO are the sanction variables used as dummies inthe empirical specification. All the countries in the world aredivided into three categories:
(1) countries that are subject to selected or specific U.S.sanctions;
(2) countries that are subject to overall or comprehensiveU.S. economic sanctions; and
(3) countries that are not subject to U.S. economic sanctions.
34 THE INTERNATIONAL TRADE JOURNAL
SANX represents selective sanctions, assuming a value of1 for category 1 countries and 0 for all other countries,while SANO represents overall, or comprehensive sanctions,assuming a value of 1 for category 2 countries and 0 for allother countries.1
The specification of SANX proves to be a challenging task forthe study as there is no consistent identification or classificationin the literatures. We will employ three samples (or definitions)for this variable based on available information. The first sample,denoted as SANN, is obtained from Sanctions.Net and the U.S.State Department’s Embargo Reference Chart.2 This is a fairlybroad list including countries that have been sanctioned by theUnited States in recent history. We include in this sample allcountries from the source except those that are subject to U.S.embargo or overall sanctions. The latter group of countries, tobe discussed shortly, are isolated to form a separate sanctionvariable, SANO. The second sample, denoted as SANH, is thelist used in the Hufbauer et al. (1997) study. The third sample,denoted as SANC, is comprised of a list of “controlled countries”established by the U.S. president as required by the ExportAdministration Act of 1979.3 This list includes most of what havebeen referred to as “former planned economies” or “communist
1Selective economic sanctions, by definition, are not aimed at restricting overalltrade, but only on a range of goods for specific reasons. For detailed discussionsof different types of sanctions and their objectives and efficacies, see Askari et al.(2003).
2Sanctions.Net was a web site on U.S. economic sanctions. It was maintainedand copyrighted by James Orr Associates. The web site was no longer accessibleas of 11 June 2002. See www.pmdtc.org/country.htm for U.S. State DepartmentEmbargo Reference Chart (accessed April 29, 2001).
3The list of “controlled countries” is available from the U.S. Congress: HouseReport 105-851 (Report of the Select Committee on U.S. National Security andMilitary/Commercial Concern with the People’s Republic of China, submitted byMr. Cox of California, Chairman).
Yang et al.: U.S. Economic Sanctions . . . 35
countries.” We believe this third sample is more representative ofU.S. economic sanctions, as these economies have been subject toU.S. sanctions throughout our sample time period (1980–1998).4
Hufbauer et al. (1997) included 26 target countries that weredivided into three groups:
(1) countries under limited financial, travel, or trade restric-tions—15 countries;
(2) countries under broader trade or financial restrictions—5 countries; and
(3) countries under comprehensive trade and financial re-strictions—6 countries.
The 6 countries under comprehensive sanctions fit our SANOvariable definition and are included in our SANO sample. Inaddition, we reclassified the 5 countries in the second group intoeither SANH or SANO. Specifically, we put Pakistan into selectedsanctions group based on our judgment that U.S. trade withPakistan has been less restrictive than the other four countries—Angola, Myanmar, Sudan, and Syria—which will be put in thecomprehensive sanction group. Moreover, although Vietnam was
4Countries included to form the SANN variable are the following (24 coun-tries): Armenia, Azerbaijan, Belarus, Burundi, Cambodia, China (Mainland),Democratic Republic of Congo, Republic of Congo, Cyprus, The Gambia, Guate-mala, Haiti, India, Indonesia, Liberia, Mauritania, Nigeria, Pakistan, Rwanda,Somalia, Tajikistan, Turkey, Ukraine, and People’s Democratic Republic of Yemen.Countries included to form the SANC variable are the following (20 countries):Albania, Azerbaijan, Belarus, Bulgaria, Cambodia, China (Mainland), Estonia,Georgia, Kazakhstan, Kyrgyz Republic, Lao People’s Democratic Republic, Latvia,Lithuania, Moldova, Mongolia, Romania, Russia, Tajikistan, Ukraine, and Uzbek-istan. The original list also includes Cuba, North Korea, and Vietnam, which weput in the group of countries subject to comprehensive U.S. economic sanctions.Armenia is excluded from SANC group as well, as the country has been a recipientof large-scale U.S. assistance in the 1990s. Turkmenistan is another country thathas been excluded from SANC as it is not included in any other place as a countrybeing sanctioned by the United States.
36 THE INTERNATIONAL TRADE JOURNAL
included in the limited restrictions group by Hufbauer et al.(1997), we believe it should be included in the comprehensivesanction group—SANO—as Vietnam was under comprehensivetrade restrictions by the United States for much of the timeperiod that our study covers.5
We had also included a trade bloc variable in our preliminaryanalysis, as a dummy variable indicating whether a countrybelongs to a trade bloc with the U.S. Any country whoseimports are in general eligible for “duty free” treatment fromthe U.S. was considered to be in a trade bloc with the U.S. andassigned a value of “1” for the variable. Twenty-nine countrieswere classified into this group.6 Our preliminary empirical resultshowed a strong multicollinearity between the bloc and thedistance variables. When the explanatory variables are highlyintercorrelated, it becomes difficult to disentangle the separateeffects of each of the explanatory variables on the explained
5Countries included to form the SANH variable are the following (15 coun-tries): Bulgaria, China (Mainland), Czech Republic, Ecuador, The Gambia,Guatemala, Hungary, India, Indonesia, Nigeria, Pakistan, Peru, Poland, Romania,and Russia. Countries included to form the SANO variable are as follows (12 coun-tries): Afghanistan, Angola, Cuba, Iran, Iraq, Libya, Myanmar, North Korea,Sudan, Syrian Arab Republic, Vietnam, and Yugoslavia. Trade and other economicdata for some of these countries are not available from the previously mentionedsources. Therefore, subject to limited availability, data have been gathered fromother sources, such as CNN’s web sites, In some cases, missing data for individ-ual years have been extrapolated from adjacent years to bridge the gap. Althoughthese data may not necessarily be comparable to those used for other countries,they should provide the necessary information to study the impact of U.S. eco-nomic sanctions on trade between the United States and these countries.
6Countries included in this group belong to one of the following designations:(1) Countries designated as least-developed beneficiary developing countries
within the Generalized System of Preferences (GSP);(2) Countries designated as beneficiary countries for purposes of the Caribbean
Basin Economic Recovery Act (CBERA);(3) Countries designated as beneficiary countries for purpose of the Andean
Trade Preference Act (ATPA); and(4) Countries that have free trade agreements with the United States.
Yang et al.: U.S. Economic Sanctions . . . 37
variable (Maddala, 1992). To highlight the impact of distancein the model, we run the regressions in our subsequent analysiswithout the BLOC variable.7
IV. IMPACT OF U.S. ECONOMIC SANCTIONSON U.S. TRADE
We will examine the impact of U.S. economic sanctions onthe U.S. from three perspectives:
(1) bilateral trade (exports plus imports between the UnitedStates and all its trade partners,
(2) U.S. exports, and(3) U.S. imports.
Impact of U.S. Economic Sanctions on U.S. BilateralTrade (Exports + Imports)
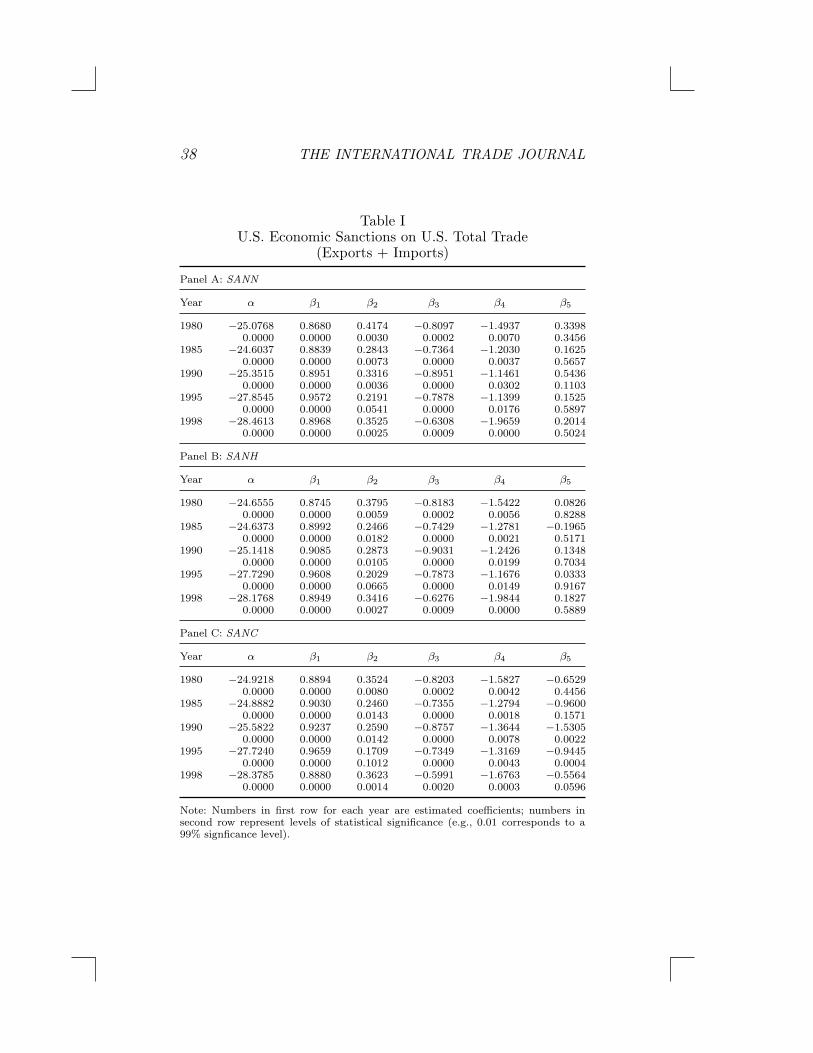
The results for U.S. bilateral trade are presented in the threepanels of Table I, corresponding to the three selective sanctionsamples (SANN, SANH, and SANC) respectively.8 The coeffi-cients for the two main factors of the gravity equation—productof trade partners’ GDPs and distance—throughout the samplesall bear the expected signs and are highly significant statistically(at the 99 percent confidence level or better), conforming to the
7Maddala (1992, p. 280) suggested that if multicollinearity is a serious problem,the predictions from the model would be worse than those from a model thatincludes only a subset of the set of explanatory variables. So dropping the tradebloc variable may provide a reasonable estimate of the effects of distances in theregressions. Our empirical results show that dropping the trade bloc variable doesnot materially affect our estimates for other variables except for distance. Resultswith the trade bloc variable are available upon request.
8To save space, Table I and subsequent tables report empirical results for 1980,1985, 1990, 1995, and 1998 only. Results for all years from 1980 to 1998 are availableupon request.
38 THE INTERNATIONAL TRADE JOURNAL
Table IU.S. Economic Sanctions on U.S. Total Trade
(Exports + Imports)
Panel A: SANN
Year α β1 β2 β3 β4 β5
1980 −25.0768 0.8680 0.4174 −0.8097 −1.4937 0.33980.0000 0.0000 0.0030 0.0002 0.0070 0.3456
1985 −24.6037 0.8839 0.2843 −0.7364 −1.2030 0.16250.0000 0.0000 0.0073 0.0000 0.0037 0.5657
1990 −25.3515 0.8951 0.3316 −0.8951 −1.1461 0.54360.0000 0.0000 0.0036 0.0000 0.0302 0.1103
1995 −27.8545 0.9572 0.2191 −0.7878 −1.1399 0.15250.0000 0.0000 0.0541 0.0000 0.0176 0.5897
1998 −28.4613 0.8968 0.3525 −0.6308 −1.9659 0.20140.0000 0.0000 0.0025 0.0009 0.0000 0.5024
Panel B: SANH
Year α β1 β2 β3 β4 β5
1980 −24.6555 0.8745 0.3795 −0.8183 −1.5422 0.08260.0000 0.0000 0.0059 0.0002 0.0056 0.8288
1985 −24.6373 0.8992 0.2466 −0.7429 −1.2781 −0.19650.0000 0.0000 0.0182 0.0000 0.0021 0.5171
1990 −25.1418 0.9085 0.2873 −0.9031 −1.2426 0.13480.0000 0.0000 0.0105 0.0000 0.0199 0.7034
1995 −27.7290 0.9608 0.2029 −0.7873 −1.1676 0.03330.0000 0.0000 0.0665 0.0000 0.0149 0.9167
1998 −28.1768 0.8949 0.3416 −0.6276 −1.9844 0.18270.0000 0.0000 0.0027 0.0009 0.0000 0.5889
Panel C: SANC
Year α β1 β2 β3 β4 β5
1980 −24.9218 0.8894 0.3524 −0.8203 −1.5827 −0.65290.0000 0.0000 0.0080 0.0002 0.0042 0.4456
1985 −24.8882 0.9030 0.2460 −0.7355 −1.2794 −0.96000.0000 0.0000 0.0143 0.0000 0.0018 0.1571
1990 −25.5822 0.9237 0.2590 −0.8757 −1.3644 −1.53050.0000 0.0000 0.0142 0.0000 0.0078 0.0022
1995 −27.7240 0.9659 0.1709 −0.7349 −1.3169 −0.94450.0000 0.0000 0.1012 0.0000 0.0043 0.0004
1998 −28.3785 0.8880 0.3623 −0.5991 −1.6763 −0.55640.0000 0.0000 0.0014 0.0020 0.0003 0.0596
Note: Numbers in first row for each year are estimated coefficients; numbers insecond row represent levels of statistical significance (e.g., 0.01 corresponds to a99% signficance level).
Yang et al.: U.S. Economic Sanctions . . . 39
empirical findings in the literature. The explanatory power of ourempirical models (R2) is very stable, ranging mostly above 0.80.
Since all regressions are logarithmic, the coefficients on theexplanatory variables can be interpreted as elasticities. Ourfindings yield a number of interesting results as compared withthose estimated by Hufbauer et al. (1997). First, we haverelatively larger estimates for the elasticity of trade with respectto the GDP-product variable (GDPi∗GDPj). The estimates were0.77, 0.79, and 0.81 for 1985, 1990, and 1995, respectively, inthe Hufbauer et al. (1997) study. Our estimates are consistentlylarger than 0.85 throughout the years from 1980 to 1998. Oneplausible explanation for this difference may be due to the sampleselection. Hufbauer et al. (1997) included 88 countries and 3,827different country pairs in their data set. We use all 225 countriesrepresented in the IMF Direction of Trade Statistics (the specificnumber of countries for each individual year varies in our sampledue to missing values), but we limit our country pairs to only theUnited States and its trade partners, allowing us to focus on U.S.trade alone. The relatively larger elasticity we have obtained mayreflect the fact that the United States is more open to trade thanaverage and is the largest trading nation in the world.9 While wemay not be able to draw inferences on world trade from oursamples, we are able to more closely estimate U.S. trade andthus the impact of economic sanctions.
The estimated coefficients for the second control variable inour regression model, the product of GDP per capita (GDPPCi ∗GDPPCj), are all positive and mostly significant at the 90%confidence interval or better. The estimates range from 0.18in 1997 to 0.42 in 1980 for the SANN sample, from 0.18 in
9There are certainly different measures of openness of an economy. Tariff ratesmay serve as one indication. The simple average tariff rates were about 10% for theEU in 1996, and 9.4% for Japan in 1997, while that for the United States was 6.3%in 1996 (the World Trade Organization, Trade Policy Reviews, various issues).
40 THE INTERNATIONAL TRADE JOURNAL
1991 to 0.38 in 1980 for the SANH sample, and from 0.16in 1991 to 0.36 in 1998 for the SANC sample. For the samevariable—GDPPCi ∗ GDPPCj , the estimates in Hufbauer et al.(1997) were 0.21 for 1985 and 0.09 for both 1990 and 1995.Again our estimates are consistently greater, reflecting possiblythe specific characteristics of U.S. trade. The positive estimatesprovides further evidence that richer countries trade more withthe United States in comparison with poorer countries’ tradewith the United States.
The coefficients for the distance variable are persistentlynegative and statistically significant at better than the 99%interval, ranging from −0.5896 in the SANC sample for 1994to −0.9380 in the SANH sample for 1991. A historical trendseems to appear for the estimated coefficients for the distancevariable. While geographical distance is still a major hindranceto international trade in today’s modern world, as suggested bythe high statistical significance of our estimates, the results seemto indicate a more or less declining trend in the importance ofdistance between the United States and its trade partners forbilateral trade. Indeed, as policy-inflicted trade barriers are beingtorn down, geographical distances between trade partners mayremain a prominent natural trade barrier between nations. Buttechnological improvements in international transportation andreduction in international transportation costs should reduce theadverse impact of distance on trade.
Our primary interest in this research is in the estimates forthe sanction variables. As stated earlier, we divide all countriesthat are subject to U.S. economic sanctions into two groups:those with selective sanctions (SANX) and those with compre-hensive sanctions (SANO). The parameter estimates for thesetwo dummy variables are supposed to capture the direct impactof U.S. economic sanctions on bilateral trade between the UnitedStates and these two groups of countries, respectively.
Yang et al.: U.S. Economic Sanctions . . . 41
A number of observations can be made through examiningthe results presented in Table I. First, the estimates showno statistically significant impact of U.S. economic sanctionson bilateral trade between the United States and the targetcountries when the SANN and SANH samples are used. Forthe SANN sample, the estimates are mostly positive—contraryto what is expected, albeit statistically insignificant except forthat of 1982. Only two negative but insignificant estimatesare obtained for 1992 and 1994. For the SANH sample, morenegative estimates are obtained but none of the estimates is, nomatter negative or positive, statistically significant at the 90%level or better. Based on these two samples, we conclude thatselective economic sanctions imposed by the United States haveno noticeable impact on the bilateral trade flows between theUnited States and these sanctioned countries.
This finding is in sharp contrast with those obtained in Huf-bauer et al. (1997). For all the three categories of sanctions theyused—limited sanctions, moderate sanctions, and comprehensivesanctions—their estimated coefficients on the dummy variablesrepresenting the presence of these sanctions in the base years1985, 1990, and 1995 were negative with high statistical signifi-cance (at the 99 percent confidence level or better) with two ex-ceptions, moderate sanctions in 1990, which are still significantat the 95 percent level, and limited sanctions in 1995, which arestatistically significant just below the 90 percent level.
The difference between our results for the SANN and SANHsamples and those in Hufbauer et al. (1997) may be due totwo reasons. First, as mentioned before, the data set used inHufbauer et al. (1997) included country pairs among 88 countrieswhile ours include only the United States and its trade partners.Second and maybe more importantly, there is a significantdiscrepancy between our SANN sample and their sample intarget country identification, although some overlapping does
42 THE INTERNATIONAL TRADE JOURNAL
exist. Countries subject to selective U.S. sanctions in our sample(SANN variable) corresponds more or less to countries subjectto limited and moderate U.S. sanctions in the Hufbauer et al.(1997) sample. Both samples included Angola, Burma, China,Guatemala, India, Indonesia, Nigeria, Pakistan, and The Gambia(9 countries). Bulgaria, Czech Republic, Ecuador, Hungary, Peru,Poland, Romania, and Russia (8 countries) were included inthe Hufbauer et al. (1997) sample, but are not included in ourSANN sample. On the other hand, Armenia, Azerbaijan, Belarus,Burundi, Cambodia, Congo, Cyprus, Haiti, Liberia, Mauritania,Rwanda, Somalia, Tajikistan, Turkey, Ukraine, Yemen, and Zaire(17 countries) are included in our sample, but were not includedin theirs. What is perplexing is that we cannot get a result closeto theirs even when we use the same sample they had used intheir study. It seems that the estimated impact of economicsanctions on bilateral trade depends crucially on the selectionor identification of the target countries and the datasets beingused.
Second, our SANC sample, however, has produced resultsthat are more in line with our expectations. As shown inTable I, the estimates for this variable are consistently negativethroughout the years, and are statistically significant at the 90%level or better for 1987 to 1997. The estimates vary substantiallyfrom year to year, ranging among the statistically significantestimates from −0.5564 in 1998 to −2.04 in 1992, indicatinga trade reduction of about 42% to 87% for these two years,respectively.10
10The reduction in trade flows due to sanctions can be calculated by takingthe exponent of the coefficient value for the sanction dummy and subtracting 1.For example, if the estimated coefficient is −0.5, the value of the natural numbere taken to the power of −0.5 is 0.61. This indicates that bilateral trade was only61% of what it should be in the normal case. In other words, the economic sanctioncauses a 39% reduction in the bilateral trade flow.
Yang et al.: U.S. Economic Sanctions . . . 43
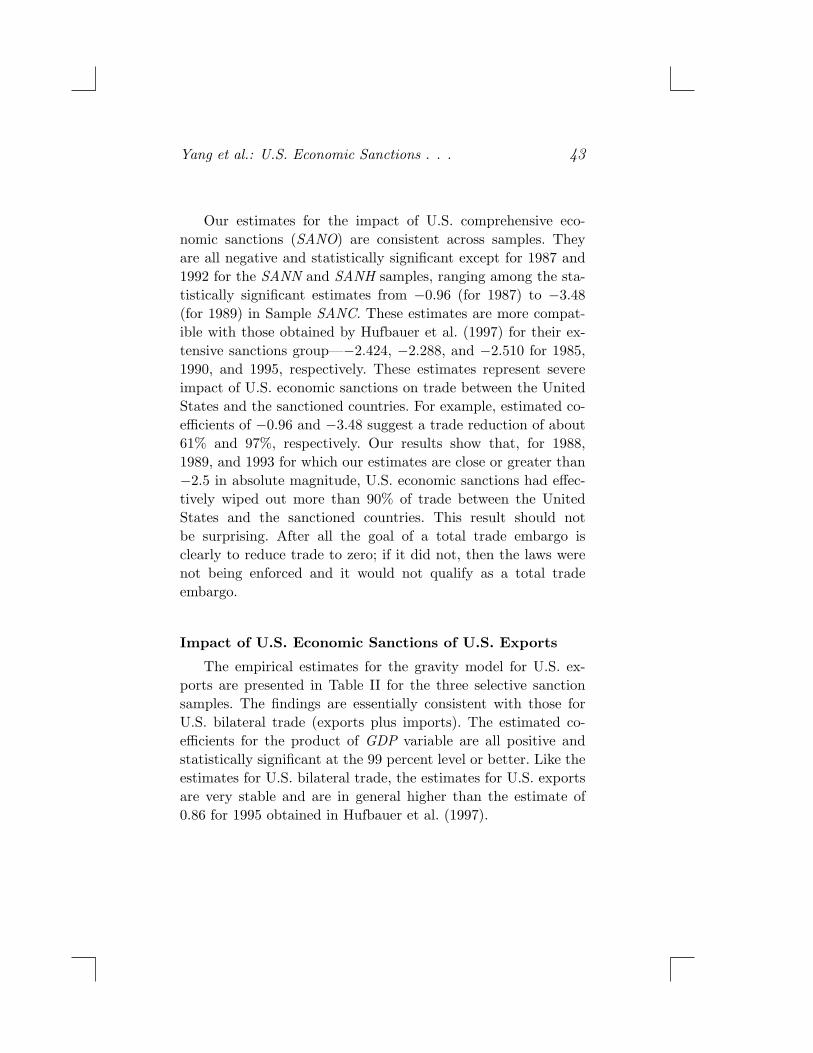
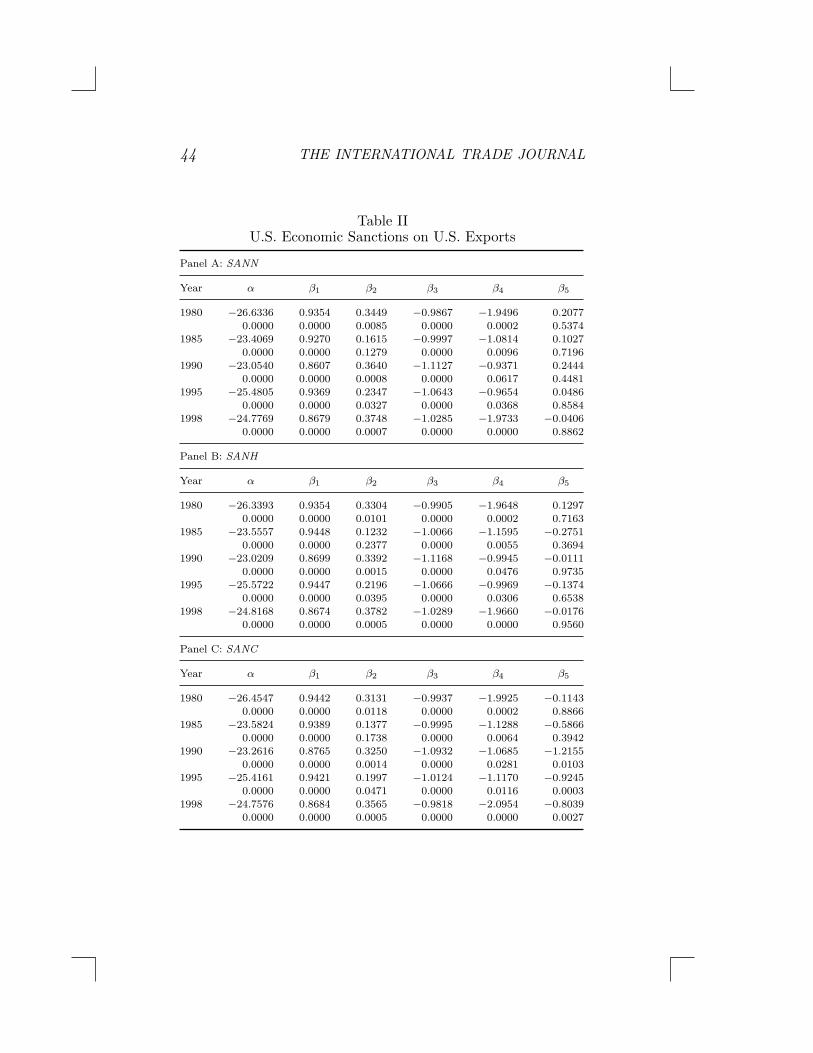
Our estimates for the impact of U.S. comprehensive eco-nomic sanctions (SANO) are consistent across samples. Theyare all negative and statistically significant except for 1987 and1992 for the SANN and SANH samples, ranging among the sta-tistically significant estimates from −0.96 (for 1987) to −3.48(for 1989) in Sample SANC. These estimates are more compat-ible with those obtained by Hufbauer et al. (1997) for their ex-tensive sanctions group—−2.424, −2.288, and −2.510 for 1985,1990, and 1995, respectively. These estimates represent severeimpact of U.S. economic sanctions on trade between the UnitedStates and the sanctioned countries. For example, estimated co-efficients of −0.96 and −3.48 suggest a trade reduction of about61% and 97%, respectively. Our results show that, for 1988,1989, and 1993 for which our estimates are close or greater than−2.5 in absolute magnitude, U.S. economic sanctions had effec-tively wiped out more than 90% of trade between the UnitedStates and the sanctioned countries. This result should notbe surprising. After all the goal of a total trade embargo isclearly to reduce trade to zero; if it did not, then the laws werenot being enforced and it would not qualify as a total tradeembargo.
Impact of U.S. Economic Sanctions of U.S. Exports
The empirical estimates for the gravity model for U.S. ex-ports are presented in Table II for the three selective sanctionsamples. The findings are essentially consistent with those forU.S. bilateral trade (exports plus imports). The estimated co-efficients for the product of GDP variable are all positive andstatistically significant at the 99 percent level or better. Like theestimates for U.S. bilateral trade, the estimates for U.S. exportsare very stable and are in general higher than the estimate of0.86 for 1995 obtained in Hufbauer et al. (1997).
44 THE INTERNATIONAL TRADE JOURNAL
Table IIU.S. Economic Sanctions on U.S. Exports
Panel A: SANN
Year α β1 β2 β3 β4 β5
1980 −26.6336 0.9354 0.3449 −0.9867 −1.9496 0.20770.0000 0.0000 0.0085 0.0000 0.0002 0.5374
1985 −23.4069 0.9270 0.1615 −0.9997 −1.0814 0.10270.0000 0.0000 0.1279 0.0000 0.0096 0.7196
1990 −23.0540 0.8607 0.3640 −1.1127 −0.9371 0.24440.0000 0.0000 0.0008 0.0000 0.0617 0.4481
1995 −25.4805 0.9369 0.2347 −1.0643 −0.9654 0.04860.0000 0.0000 0.0327 0.0000 0.0368 0.8584
1998 −24.7769 0.8679 0.3748 −1.0285 −1.9733 −0.04060.0000 0.0000 0.0007 0.0000 0.0000 0.8862
Panel B: SANH
Year α β1 β2 β3 β4 β5
1980 −26.3393 0.9354 0.3304 −0.9905 −1.9648 0.12970.0000 0.0000 0.0101 0.0000 0.0002 0.7163
1985 −23.5557 0.9448 0.1232 −1.0066 −1.1595 −0.27510.0000 0.0000 0.2377 0.0000 0.0055 0.3694
1990 −23.0209 0.8699 0.3392 −1.1168 −0.9945 −0.01110.0000 0.0000 0.0015 0.0000 0.0476 0.9735
1995 −25.5722 0.9447 0.2196 −1.0666 −0.9969 −0.13740.0000 0.0000 0.0395 0.0000 0.0306 0.6538
1998 −24.8168 0.8674 0.3782 −1.0289 −1.9660 −0.01760.0000 0.0000 0.0005 0.0000 0.0000 0.9560
Panel C: SANC
Year α β1 β2 β3 β4 β5
1980 −26.4547 0.9442 0.3131 −0.9937 −1.9925 −0.11430.0000 0.0000 0.0118 0.0000 0.0002 0.8866
1985 −23.5824 0.9389 0.1377 −0.9995 −1.1288 −0.58660.0000 0.0000 0.1738 0.0000 0.0064 0.3942
1990 −23.2616 0.8765 0.3250 −1.0932 −1.0685 −1.21550.0000 0.0000 0.0014 0.0000 0.0281 0.0103
1995 −25.4161 0.9421 0.1997 −1.0124 −1.1170 −0.92450.0000 0.0000 0.0471 0.0000 0.0116 0.0003
1998 −24.7576 0.8684 0.3565 −0.9818 −2.0954 −0.80390.0000 0.0000 0.0005 0.0000 0.0000 0.0027
Yang et al.: U.S. Economic Sanctions . . . 45
The estimated coefficient for the product of GDP per capita(GDPPCi∗GDPPCj) are similar to those for U.S. bilateral trade,all positive and mostly significant at the 90% confidence intervalor better. The results seem to demonstrate two interestingcharacteristics. First, they are generally smaller than thoseobtained for U.S. bilateral trade. This is consistent with theresults for the product of GDP variable. It seems that althoughper capita income and GDP size have a positive and significantimpact on U.S. exports, their impact is smaller than that onU.S. total trade. Second, all the estimates are higher than whatHufbauer et al. (1997) obtained (0.14) for the same variable forU.S. exports in 1995. In fact their estimate was not statisticallysignificant.
Our estimates for the distance variable in the regressions areall negative and statistically significant at the 99% confidencelevel or better, ranging around −1.0. These numbers are gener-ally higher in absolute terms than those obtained for U.S. bilat-eral trade, which are mostly under 0.90 (see Table I). This resultindicates that U.S. exports are more distance-sensitive than isoverall U.S. bilateral trade.
Our estimates show that selective U.S. economic sanctionshave no obvious impact on U.S. exports based on the resultsobtained for the SANN and SANH samples (see Panels A and Bin Table II). As one reviewer of this article points out, this findingaddresses an important policy issue. Several governments oftargeted countries claim that U.S. selective sanctions harm theireconomic development. That claim may not be substantiated byour empirical results.
In contrast, the SANC sample presents very different findings(see Panel C of Table II): The parameter estimates are consis-tently negative and statistically significant at the 90% level orbetter for 1987 through 1998. The estimates range from −0.67in 1996 to −2.25 in 1989, indicating, respectively, an average
46 THE INTERNATIONAL TRADE JOURNAL
export reduction of 49% and 89% for 1996 and 1989, respec-tively, from what they should have been if no sanctions were inplace. This finding differs from Hufbauer et al. (1997) who foundlimited evidence that sanctions continue to depress trade afterthey had been lifted. The difference in our finding illustrates theimportance of different classifications of the target groups of U.S.economic sanctions. Our findings are, however, consistent withthose of Richardson (1993) who found “the former communistbloc” to be a large negative outliers in U.S. exports.
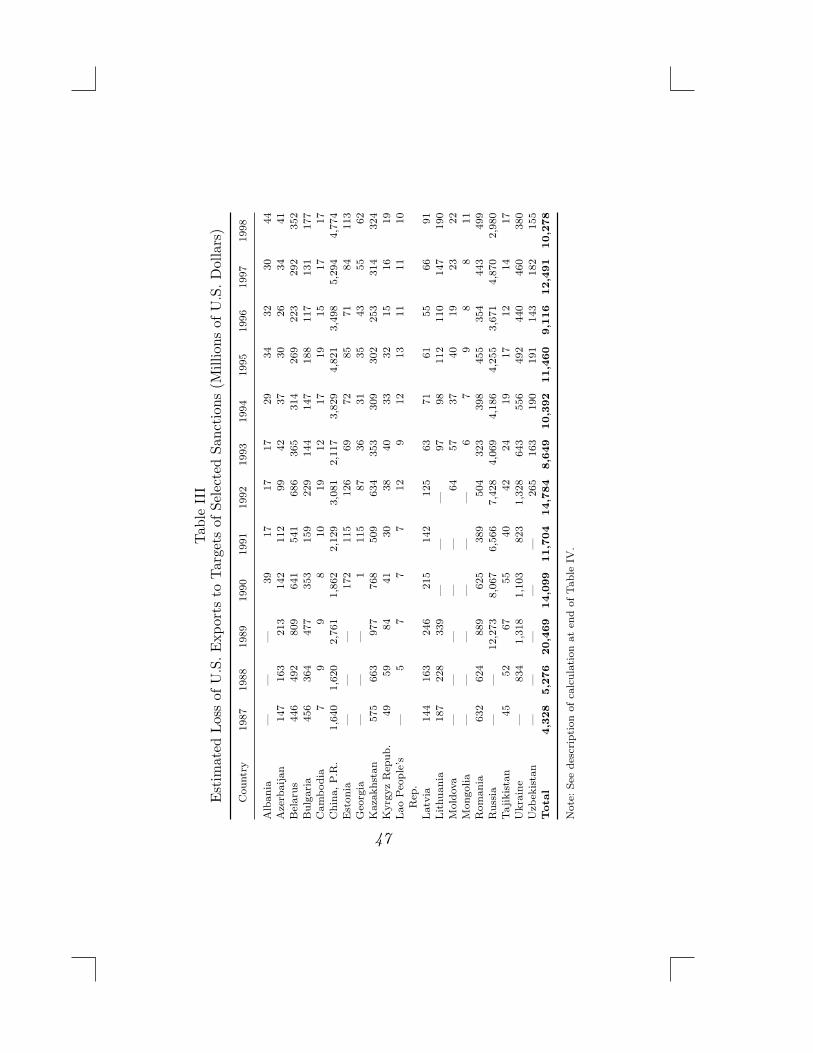
The empirical literature on economic sanctions has empha-sized the magnitude of export losses because of sanctions. Ourestimated losses of U.S. exports to targeted countries of U.S.selective economic sanctions for years 1987 through 1998, forwhich the estimated coefficients for the sanction variable SANCare statistically significant, are presented in Table III. For the 20countries that are included in the SANC sample, the total lossesvary widely across years, ranging from $4.3 billion in 1987 to$20.5 billion in 1989. Russia and China are the two countries forwhich U.S. export losses have been the largest among the coun-tries in the group. This is, again, consistent with Richardson’s(1993) estimates.
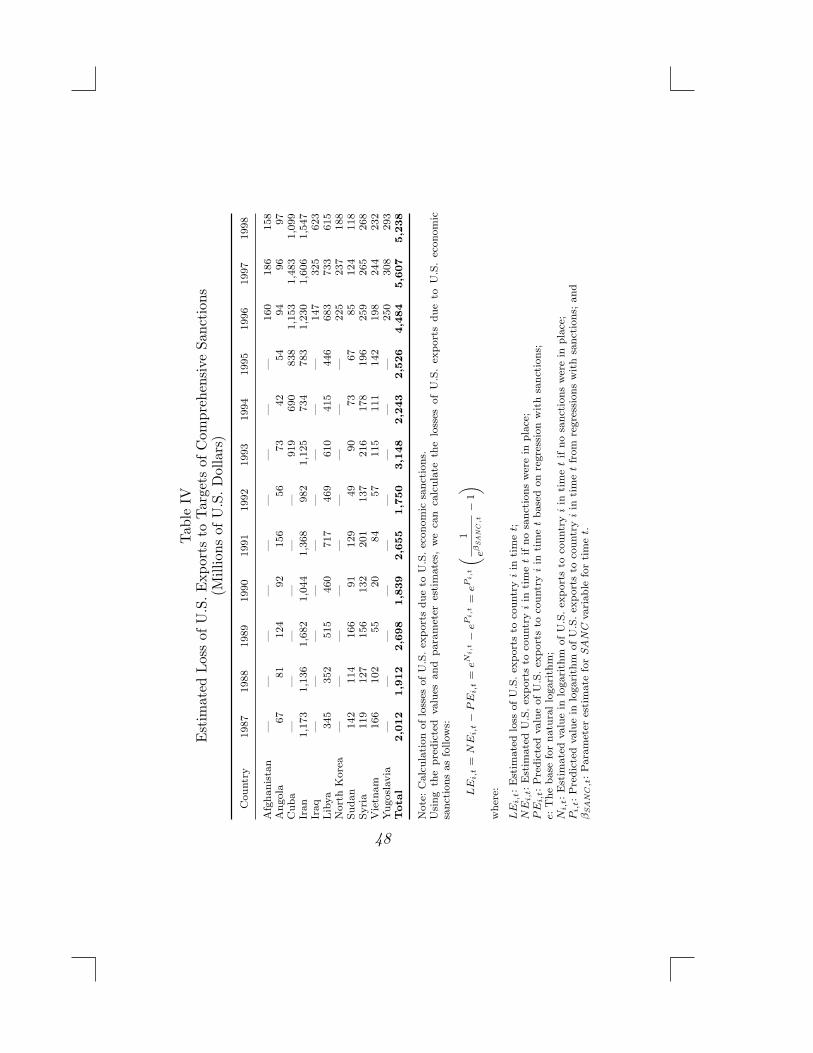
U.S. export losses to target countries subject to U.S. compre-hensive economic sanctions (SANO) are calculated in the sameway and the results are presented in Table IV. The export lossto this group of countries ranges from $1.8 billion in 1992 to$5.6 billion in 1997. U.S. export losses to Iran and Cuba are thelargest in this group. Two caveats should be noted in interpretingthese estimates. First, the estimates do not present a full assess-ment of the losses, as they do not include Myanmar for the entiretime series or several other countries for most of the time perioddue to missing values in the dataset. Second, as mentioned inHufbauer et al. (1997), the estimated coefficients for the sanction
Tab
leIII
Estim
ated
Lossof
U.S.Exp
orts
toTargets
ofSelected
Sanction
s(M
illions
ofU.S.Dollars)
Cou
ntry
1987
1988
1989
1990
1991
1992
1993
1994
1995
1996
1997
1998
Alb
ania
——
—39
1717
1729
3432
3044
Aze
rbai
jan
147
163
213
142
112
9942
3730
2634
41B
elar
us44
649
280
964
154
168
636
531
426
922
329
235
2B
ulga
ria
456
364
477
353
159
229
144
147
188
117
131
177
Cam
bod
ia7
99
810
1912
1719
1517
17C
hina
,P.R
.1,
640
1,62
02,
761
1,86
22,
129
3,08
12,
117
3,82
94,
821
3,49
85,
294
4,77
4E
ston
ia—
——
172
115
126
6972
8571
8411
3G
eorg
ia—
——
111
587
3631
3543
5562
Kaz
akhs
tan
575
663
977
768
509
634
353
309
302
253
314
324
Kyr
gyz
Rep
ub.
4959
8441
3038
4033
3215
1619
Lao
Peo
ple’
s—
57
77
129
1213
1111
10R
ep.
Lat
via
144
163
246
215
142
125
6371
6155
6691
Lit
huan
ia18
722
833
9—
——
9798
112
110
147
190
Mol
dova
——
——
—64
5737
4019
2322
Mon
golia
——
——
——
67
98
811
Rom
ania
632
624
889
625
389
504
323
398
455
354
443
499
Rus
sia
——
12,2
738,
067
6,56
67,
428
4,06
94,
186
4,25
53,
671
4,87
02,
980
Taj
ikis
tan
4552
6755
4042
2419
1712
1417
Ukr
aine
—83
41,
318
1,10
382
31,
328
643
556
492
440
460
380
Uzb
ekis
tan
——
——
—26
516
319
019
114
318
215
5Tota
l4,3
28
5,2
76
20,4
69
14,0
99
11,7
04
14,7
84
8,6
49
10,3
92
11,4
60
9,1
16
12,4
91
10,2
78
Not
e:Se
ede
scri
ptio
nof
calc
ulat
ion
aten
dof
Tab
leIV
.
47
Tab
leIV
Estim
ated
Lossof
U.S.Exp
orts
toTargets
ofCom
prehensive
Sanctions
(Millions
ofU.S.Dollars)
Cou
ntry
1987
1988
1989
1990
1991
1992
1993
1994
1995
1996
1997
1998
Afg
hani
stan
——
——
——
——
—16
018
615
8A
ngol
a67
8112
492
156
5673
4254
9496
97C
uba
——
——
——
919
690
838
1,15
31,
483
1,09
9Ir
an1,
173
1,13
61,
682
1,04
41,
368
982
1,12
573
478
31,
230
1,60
61,
547
Iraq
——
——
——
——
—14
732
562
3L
ibya
345
352
515
460
717
469
610
415
446
683
733
615
Nor
thK
orea
——
——
——
——
—22
523
718
8Su
dan
142
114
166
9112
949
9073
6785
124
118
Syri
a11
912
715
613
220
113
721
617
819
625
926
526
8V
ietn
am16
610
255
2084
5711
511
114
219
824
423
2Y
ugos
lavi
a—
——
——
——
——
250
308
293
Tota
l2,0
12
1,9
12
2,6
98
1,8
39
2,6
55
1,7
50
3,1
48
2,2
43
2,5
26
4,4
84
5,6
07
5,2
38
Not
e:C
alcu
lati
onof
loss
esof
U.S
.ex
por
tsdu
eto
U.S
.ec
onom
icsa
ncti
ons.
Usi
ngth
epr
edic
ted
valu
esan
dpa
ram
eter
esti
mat
es,
we
can
calc
ulat
eth
elo
sses
ofU
.S.
expor
tsdu
eto
U.S
.ec
onom
icsa
ncti
ons
asfo
llow
s:
LE
i,t
=N
Ei,
t−
PE
i,t
=eN
i,t
−eP
i,t
=eP
i,t
(1
eβSANC
,t−
1)
whe
re:
LE
i,t:E
stim
ated
loss
ofU
.S.ex
por
tsto
coun
try
iin
tim
et;
NE
i,t:E
stim
ated
U.S
.ex
por
tsto
coun
try
iin
tim
et
ifno
sanc
tion
sw
ere
inpl
ace;
PE
i,t:P
redi
cted
valu
eof
U.S
.ex
por
tsto
coun
try
iin
tim
et
base
don
regr
essi
onw
ith
sanc
tion
s;e:
The
base
for
natu
rallo
gari
thm
;N
i,t:E
stim
ated
valu
ein
loga
rith
mof
U.S
.ex
por
tsto
coun
try
iin
tim
et
ifno
sanc
tion
sw
ere
inpl
ace;
Pi,
t:P
redi
cted
valu
ein
loga
rith
mof
U.S
.ex
por
tsto
coun
try
iin
tim
et
from
regr
essi
ons
wit
hsa
ncti
ons;
and
βSANC
,t:P
aram
eter
esti
mat
efo
rSA
NC
vari
able
for
tim
et.
48
Yang et al.: U.S. Economic Sanctions . . . 49
variables represent averages, so caution should be exercised ininterpreting the country-by-country results.
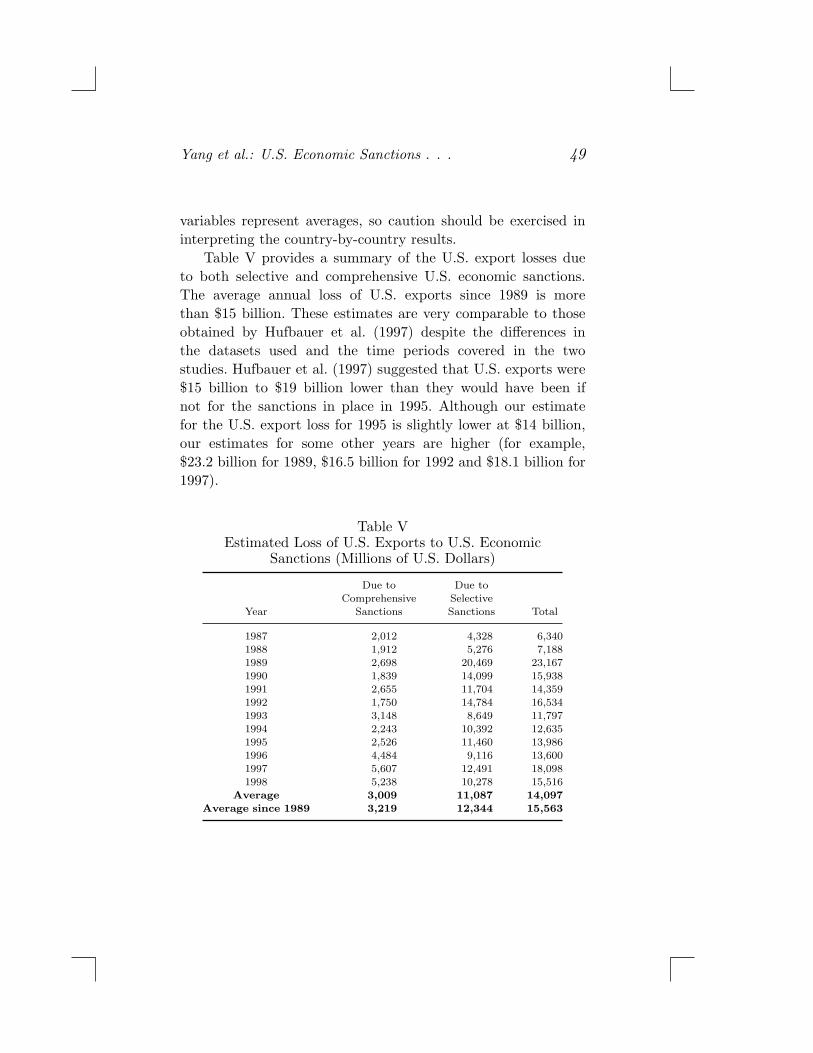
Table V provides a summary of the U.S. export losses dueto both selective and comprehensive U.S. economic sanctions.The average annual loss of U.S. exports since 1989 is morethan $15 billion. These estimates are very comparable to thoseobtained by Hufbauer et al. (1997) despite the differences inthe datasets used and the time periods covered in the twostudies. Hufbauer et al. (1997) suggested that U.S. exports were$15 billion to $19 billion lower than they would have been ifnot for the sanctions in place in 1995. Although our estimatefor the U.S. export loss for 1995 is slightly lower at $14 billion,our estimates for some other years are higher (for example,$23.2 billion for 1989, $16.5 billion for 1992 and $18.1 billion for1997).
Table VEstimated Loss of U.S. Exports to U.S. Economic
Sanctions (Millions of U.S. Dollars)
Due to Due toComprehensive Selective
Year Sanctions Sanctions Total
1987 2,012 4,328 6,3401988 1,912 5,276 7,1881989 2,698 20,469 23,1671990 1,839 14,099 15,9381991 2,655 11,704 14,3591992 1,750 14,784 16,5341993 3,148 8,649 11,7971994 2,243 10,392 12,6351995 2,526 11,460 13,9861996 4,484 9,116 13,6001997 5,607 12,491 18,0981998 5,238 10,278 15,516
Average 3,009 11,087 14,097Average since 1989 3,219 12,344 15,563
50 THE INTERNATIONAL TRADE JOURNAL
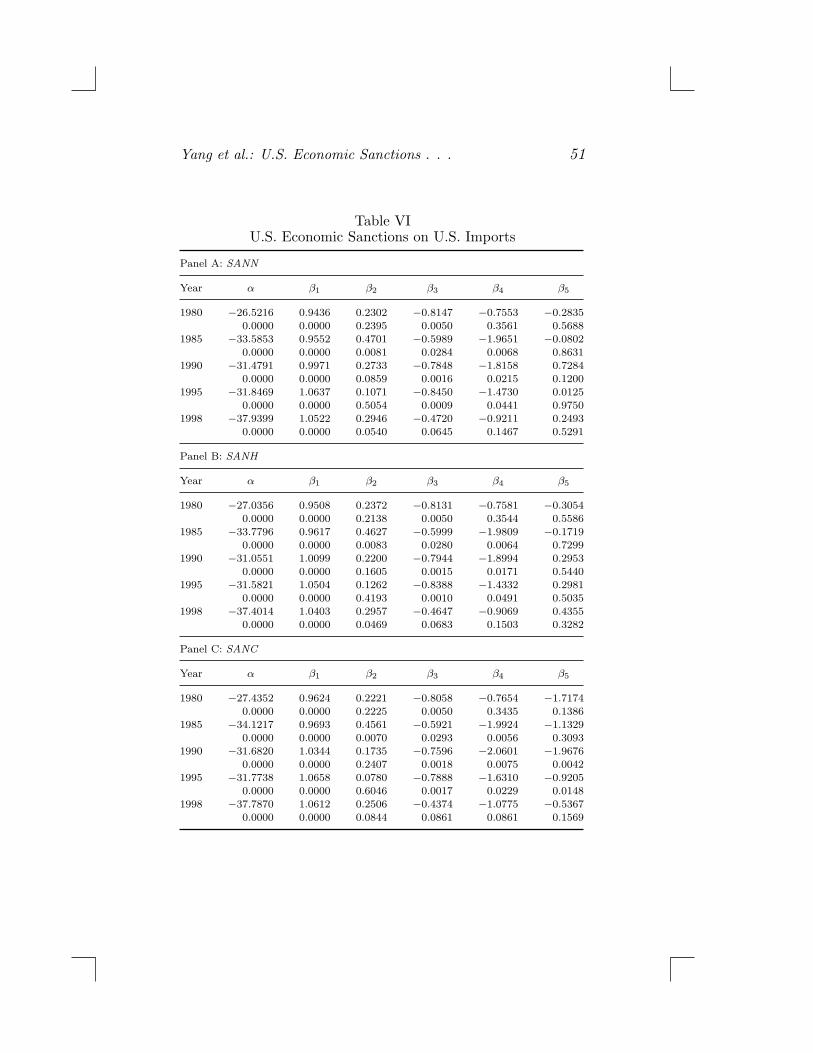
Impact of U.S. Economic Sanctions of U.S. Imports
The estimated impact of U.S. economic sanctions on U.S.imports is presented in Table VI for the three sanction samples.Estimates of the GDP product coefficients are all positive andstatistically significant at the 99% level or better. The estimatespresent a clear upward trend for the elasticity of U.S. importswith respect to the economic size of U.S. import sources, contraryto that for U.S. exports. They are on average larger than theestimates for U.S. bilateral trade and U.S. exports, indicatingU.S. imports are more sensitive to the size of the partner’seconomy.
The estimates for the GDP per capita variable, GDPPC, areas robust as the GDP aggregate variable. They are all positivebut statistically significant for only about half of the cases. Itseems that U.S. imports are not affected by the income level ofthe source countries as much as U.S. exports and total trade are.The results for the distance and the BLOC variables in the U.S.import case follow very much the same patterns as those for U.S.total trade and U.S. exports. Estimates for the distance variableare consistently negative and statistically significant.
The identification of sanctioned countries is again a crucialfactor in evaluating the impact of U.S. economic sanctions onU.S. imports. For the SANN and SANH samples, the parameterestimates for the selective sanction variable have mixed signsand only one of the negative estimates (the expected sign)show statistical significance at the 90% level. The estimatesfor the SANC sample are, however, consistently negative andstatistically significant at the 90% level or better for years 1987 to1997 (except for 1991). The magnitude of the estimates for theseyears ranges from −0.69 in 1997 to −2.60 in 1992, indicating thatU.S. imports from these sanctioned countries were only 50% andless that 8% of what they would have been if these sanctions were
Yang et al.: U.S. Economic Sanctions . . . 51
Table VIU.S. Economic Sanctions on U.S. Imports
Panel A: SANN
Year α β1 β2 β3 β4 β5
1980 −26.5216 0.9436 0.2302 −0.8147 −0.7553 −0.28350.0000 0.0000 0.2395 0.0050 0.3561 0.5688
1985 −33.5853 0.9552 0.4701 −0.5989 −1.9651 −0.08020.0000 0.0000 0.0081 0.0284 0.0068 0.8631
1990 −31.4791 0.9971 0.2733 −0.7848 −1.8158 0.72840.0000 0.0000 0.0859 0.0016 0.0215 0.1200
1995 −31.8469 1.0637 0.1071 −0.8450 −1.4730 0.01250.0000 0.0000 0.5054 0.0009 0.0441 0.9750
1998 −37.9399 1.0522 0.2946 −0.4720 −0.9211 0.24930.0000 0.0000 0.0540 0.0645 0.1467 0.5291
Panel B: SANH
Year α β1 β2 β3 β4 β5
1980 −27.0356 0.9508 0.2372 −0.8131 −0.7581 −0.30540.0000 0.0000 0.2138 0.0050 0.3544 0.5586
1985 −33.7796 0.9617 0.4627 −0.5999 −1.9809 −0.17190.0000 0.0000 0.0083 0.0280 0.0064 0.7299
1990 −31.0551 1.0099 0.2200 −0.7944 −1.8994 0.29530.0000 0.0000 0.1605 0.0015 0.0171 0.5440
1995 −31.5821 1.0504 0.1262 −0.8388 −1.4332 0.29810.0000 0.0000 0.4193 0.0010 0.0491 0.5035
1998 −37.4014 1.0403 0.2957 −0.4647 −0.9069 0.43550.0000 0.0000 0.0469 0.0683 0.1503 0.3282
Panel C: SANC
Year α β1 β2 β3 β4 β5
1980 −27.4352 0.9624 0.2221 −0.8058 −0.7654 −1.71740.0000 0.0000 0.2225 0.0050 0.3435 0.1386
1985 −34.1217 0.9693 0.4561 −0.5921 −1.9924 −1.13290.0000 0.0000 0.0070 0.0293 0.0056 0.3093
1990 −31.6820 1.0344 0.1735 −0.7596 −2.0601 −1.96760.0000 0.0000 0.2407 0.0018 0.0075 0.0042
1995 −31.7738 1.0658 0.0780 −0.7888 −1.6310 −0.92050.0000 0.0000 0.6046 0.0017 0.0229 0.0148
1998 −37.7870 1.0612 0.2506 −0.4374 −1.0775 −0.53670.0000 0.0000 0.0844 0.0861 0.0861 0.1569
52 THE INTERNATIONAL TRADE JOURNAL
not in place in the respective years. The different results acrosssamples also indicate that U.S. economic sanctions on formallyplanned economies have a consistent impact on U.S. imports fromthese countries.
Finally, the estimates for the comprehensive sanction vari-able, SANO, are all negative and statistically significant at the99% level or better for most years. The magnitude of some es-timates for several years is well over −2.5 in absolute values,representing virtually over 90% reduction of U.S. imports fromthe countries being sanctioned.
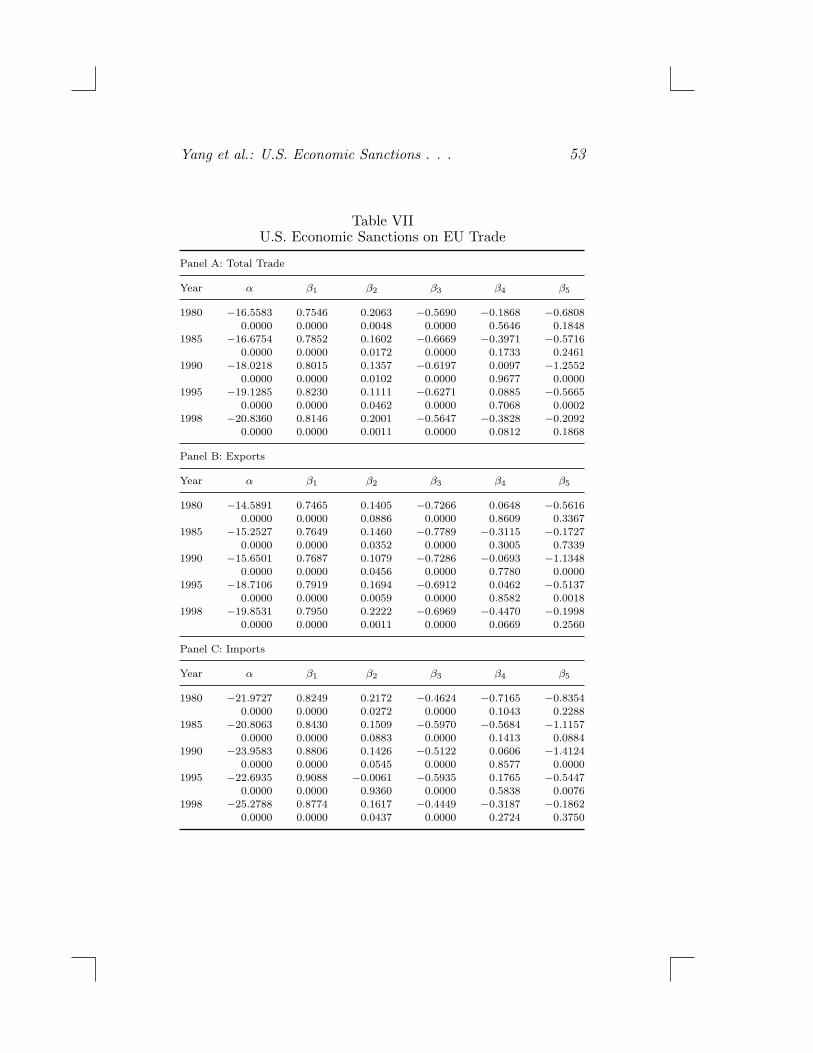
V. U.S. ECONOMIC SANCTIONS: Impact on theEU and Japan
Since the SANC variable is statistically more significant inmeasuring the impact of U.S. economic sanctions on U.S. trade(bilateral trade, exports and imports), we use only this variable inour empirical analyses for the impact of U.S. economic sanctionson trade for the European Union (EU) and Japan. As specifiedbefore, the SANC variable represents a list of countries that haveoften been referred to as former planned economies, or what arenow called “economies in transition.”
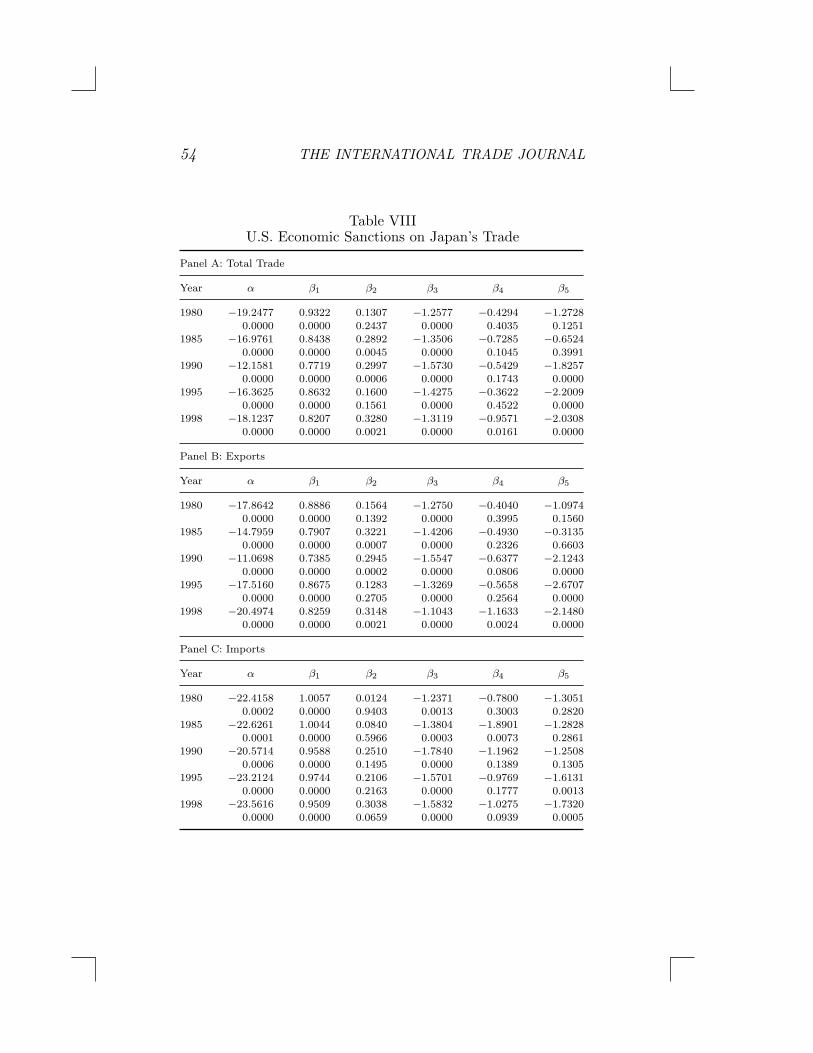
The estimated coefficients for the two pillars of the gravitymodel (product of GDP and geographical distances) for theEU and Japan are consistent with those for the United Statesin terms of the expected signs and statistical significance (seeTables VII and VIII). While the estimates for the GDP variableare generally smaller as compared with those for the UnitedStates, the numbers for Japan are on average larger than thoseobtained for the EU, indicating economic size of trading partnershas a relatively greater impact on Japan’s trade than on that forthe EU. Comparison of the estimates between the two economicentities also seems to suggest that this impact has a declining
Yang et al.: U.S. Economic Sanctions . . . 53
Table VIIU.S. Economic Sanctions on EU Trade
Panel A: Total Trade
Year α β1 β2 β3 β4 β5
1980 −16.5583 0.7546 0.2063 −0.5690 −0.1868 −0.68080.0000 0.0000 0.0048 0.0000 0.5646 0.1848
1985 −16.6754 0.7852 0.1602 −0.6669 −0.3971 −0.57160.0000 0.0000 0.0172 0.0000 0.1733 0.2461
1990 −18.0218 0.8015 0.1357 −0.6197 0.0097 −1.25520.0000 0.0000 0.0102 0.0000 0.9677 0.0000
1995 −19.1285 0.8230 0.1111 −0.6271 0.0885 −0.56650.0000 0.0000 0.0462 0.0000 0.7068 0.0002
1998 −20.8360 0.8146 0.2001 −0.5647 −0.3828 −0.20920.0000 0.0000 0.0011 0.0000 0.0812 0.1868
Panel B: Exports
Year α β1 β2 β3 β4 β5
1980 −14.5891 0.7465 0.1405 −0.7266 0.0648 −0.56160.0000 0.0000 0.0886 0.0000 0.8609 0.3367
1985 −15.2527 0.7649 0.1460 −0.7789 −0.3115 −0.17270.0000 0.0000 0.0352 0.0000 0.3005 0.7339
1990 −15.6501 0.7687 0.1079 −0.7286 −0.0693 −1.13480.0000 0.0000 0.0456 0.0000 0.7780 0.0000
1995 −18.7106 0.7919 0.1694 −0.6912 0.0462 −0.51370.0000 0.0000 0.0059 0.0000 0.8582 0.0018
1998 −19.8531 0.7950 0.2222 −0.6969 −0.4470 −0.19980.0000 0.0000 0.0011 0.0000 0.0669 0.2560
Panel C: Imports
Year α β1 β2 β3 β4 β5
1980 −21.9727 0.8249 0.2172 −0.4624 −0.7165 −0.83540.0000 0.0000 0.0272 0.0000 0.1043 0.2288
1985 −20.8063 0.8430 0.1509 −0.5970 −0.5684 −1.11570.0000 0.0000 0.0883 0.0000 0.1413 0.0884
1990 −23.9583 0.8806 0.1426 −0.5122 0.0606 −1.41240.0000 0.0000 0.0545 0.0000 0.8577 0.0000
1995 −22.6935 0.9088 −0.0061 −0.5935 0.1765 −0.54470.0000 0.0000 0.9360 0.0000 0.5838 0.0076
1998 −25.2788 0.8774 0.1617 −0.4449 −0.3187 −0.18620.0000 0.0000 0.0437 0.0000 0.2724 0.3750
54 THE INTERNATIONAL TRADE JOURNAL
Table VIIIU.S. Economic Sanctions on Japan’s Trade
Panel A: Total Trade
Year α β1 β2 β3 β4 β5
1980 −19.2477 0.9322 0.1307 −1.2577 −0.4294 −1.27280.0000 0.0000 0.2437 0.0000 0.4035 0.1251
1985 −16.9761 0.8438 0.2892 −1.3506 −0.7285 −0.65240.0000 0.0000 0.0045 0.0000 0.1045 0.3991
1990 −12.1581 0.7719 0.2997 −1.5730 −0.5429 −1.82570.0000 0.0000 0.0006 0.0000 0.1743 0.0000
1995 −16.3625 0.8632 0.1600 −1.4275 −0.3622 −2.20090.0000 0.0000 0.1561 0.0000 0.4522 0.0000
1998 −18.1237 0.8207 0.3280 −1.3119 −0.9571 −2.03080.0000 0.0000 0.0021 0.0000 0.0161 0.0000
Panel B: Exports
Year α β1 β2 β3 β4 β5
1980 −17.8642 0.8886 0.1564 −1.2750 −0.4040 −1.09740.0000 0.0000 0.1392 0.0000 0.3995 0.1560
1985 −14.7959 0.7907 0.3221 −1.4206 −0.4930 −0.31350.0000 0.0000 0.0007 0.0000 0.2326 0.6603
1990 −11.0698 0.7385 0.2945 −1.5547 −0.6377 −2.12430.0000 0.0000 0.0002 0.0000 0.0806 0.0000
1995 −17.5160 0.8675 0.1283 −1.3269 −0.5658 −2.67070.0000 0.0000 0.2705 0.0000 0.2564 0.0000
1998 −20.4974 0.8259 0.3148 −1.1043 −1.1633 −2.14800.0000 0.0000 0.0021 0.0000 0.0024 0.0000
Panel C: Imports
Year α β1 β2 β3 β4 β5
1980 −22.4158 1.0057 0.0124 −1.2371 −0.7800 −1.30510.0002 0.0000 0.9403 0.0013 0.3003 0.2820
1985 −22.6261 1.0044 0.0840 −1.3804 −1.8901 −1.28280.0001 0.0000 0.5966 0.0003 0.0073 0.2861
1990 −20.5714 0.9588 0.2510 −1.7840 −1.1962 −1.25080.0006 0.0000 0.1495 0.0000 0.1389 0.1305
1995 −23.2124 0.9744 0.2106 −1.5701 −0.9769 −1.61310.0000 0.0000 0.2163 0.0000 0.1777 0.0013
1998 −23.5616 0.9509 0.3038 −1.5832 −1.0275 −1.73200.0000 0.0000 0.0659 0.0000 0.0939 0.0005
Yang et al.: U.S. Economic Sanctions . . . 55
trend for Japan but an increasing trend for the EU. A plausibleexplanation for this observation may be that Japan has graduallydiversified its trade to developing countries, particularly thosewithin Asia. On the other hand, integration among the EUcountries has increased trade among members whose economicsize is among the largest in the world. As Pollard (2001) pointsout, the European Union is the most highly integrated regionaltrade area. In 1980, 57 percent of the total merchandise trade(exports plus imports) of the European Union was within theregion. This share increased to 66 percent in 1990 but hasdeclined somewhat since then (partly as a result of increasedtrade with the former Soviet block countries).
Estimates for the distance variable also show a remarkabledifference between the EU and Japan. For Japan, the estimatesfor all types of trade (total, exports, and imports) are greaterthan 1 in absolute value for all years. This indicates thatgeographical distance has major impact on Japan’s trade. Thisfinding may also be attributed to the fact that Japan tradesrelatively more with neighboring Asian economies. The estimatesfor the EU, on the other hand, vary within the −0.50 and −0.70range, indicating that EU’s trade is much less affected by physicaldistance with its trade partners.
The GDP per capita variable, GDPPC, has shown mixedresults for both Japan and the EU. For the EU, this factorseems to affect its exports and total trade more significantlythan its imports. But it seems the opposite is true for Japan—the estimates for its imports and total trade have shown greaterstatistical significance than its exports.
One of our objectives in this study is to see if U.S. economicsanctions have caused a shift in trade from the U.S. to othermajor trading nations in the world. Our findings do not supportthis common belief. The estimates for the SANC variable areconsistent for both the EU and Japan and across all trade
56 THE INTERNATIONAL TRADE JOURNAL
measures: total trade, exports and imports—all negative andmostly statistically significant at the 90% level or better foryears since the late 1980s. The magnitude of the estimates isalso compatible with those obtained for the United States. Theimpact seems to be more striking for the EU in 1992. All itsexports, imports, and total trade with the sanctioned countriesfor that year are estimated at about only 8% of what they wouldhave been if the sanctions were not in place.
An interesting finding in our results is that the overallsanction variable, SANO, does not show a consistent sign, andis no longer statistically significant for Japan or the EU, inall measures of trade. In fact, for some years, the estimatedcoefficients are significantly positive. This is an indication thatU.S. comprehensive economic sanctions have some third-countryeffects. That is, while U.S. comprehensive economic sanctionshave caused significant reduction of trade between the UnitedStates and the target countries, these same sanctions have causedexpansion of trade between the EU or Japan and the targetcountries.
The difference in the third country effects between the SANCand SANO groups is due to lingering effects of multilateral eco-nomic sanctions imposed on the SANC countries during the ColdWar. Some U.S. economic sanctions against the SANC coun-tries have been historically part of some multilateral arrange-ments in which the EU member countries and Japan had alsoparticipated.11 Although the EU countries and Japan have liftedmost of these sanctions since the end of the Cold War, trade flowsbetween the EU countries or Japan with the SANC countrieshave not reached their normal levels as suggested by the gravity
11One example of such multilateral arrangements was the Coordinating Com-mittee on Multilateral Export Controls (COCOM), which was the primary multi-national organization to control exports to proscribed countries—mainly the SANCcountries until its dissolution in 1994.
Yang et al.: U.S. Economic Sanctions . . . 57
model. As one of the reviewers of this article points out, someSANC economies often had trouble absorbing external resources.The persistence of related internal structures even after the col-lapse of command system, such as state-owned enterprises, mayexplain why trade appears lower than the gravity model wouldpredict. In the case of some SANO countries, such as Iran, U.S.economic sanctions are unilateral in nature, allowing for third-country effects.
VI. SUMMARY OF FINDINGS ANDFUTURE RESEARCH
Our empirical study yields a number of interesting and im-portant findings. First, our results render robust support for thegravity model. The estimated coefficients for the GDPi ∗ GDPj
variable are positive and statistically significant throughout dif-ferent samples for all years covered in our study, showing thattwo large countries, all else equal, have a higher volume of tradethan two small countries. This is not only the case for U.S. bi-lateral trade flows (exports plus imports), but it is also true forU.S. exports and U.S. imports separately. The results for theGDPPCi ∗ GDPPCj variable are also positive and statisticallysignificant in most cases, indicating that countries with higherper capita income tends to trade more than countries with lowerper capital income. The distance variable is consistently nega-tive and statistically significant. The impact of economic sizeand geographical distance on trade varies across the U.S., EU,and Japan in their trade with other countries and also variesbetween bilateral trade, exports, and imports for each of thesethree countries or groups of countries.
Second, the impact of U.S. economic sanctions on U.S.trade (bilateral trade, exports alone, or imports alone) is verysensitive to how the sanctioned country list is identified and
58 THE INTERNATIONAL TRADE JOURNAL
selected. This is particularly true for countries specified as targetsof U.S. selective economic sanctions. For the three differentclassifications we have used in our study, two of them show noconsistent statistical significance. Many countries in these groupshave been subject to some form of U.S. export controls (forexample, Indonesia faces restrictions on U.S. military equipmentexports but is not restricted otherwise and even benefits fromU.S. GSP). This may provide an explanation for the weak overalleffect of selective sanctions—they simply are in too narrow arange of products to have much impact on overall imports,exports, or bilateral trade flows. Using a sample (SANC) thatincludes the formerly planned economies that were long thetarget of U.S. economic sanctions in recent history, we have foundthat U.S. economic sanctions have a significant impact on U.S.exports, imports, and total trade. This negative impact may beexplained by a number of possible factors—the inward lookingpolicies adopted by some of these countries, the low level of U.S.investment in these countries (another impact of the sanctions),and difficulties in absorbing external resources even after someeconomic reforms.
Third, U.S. comprehensive economic sanctions have a signif-icant negative impact on U.S. bilateral trade, exports, and im-ports, with target countries subject to these sanctions. Not sur-prisingly, Iran and Cuba are among the countries most severelyaffected by U.S. economic sanctions.
Fourth, our estimated U.S. export losses due to U.S. eco-nomic sanctions are basically consistent with those found in theHufbauer et al. (1997) study. Adding together the effects of U.S.economic sanctions on U.S. exports to both the formerly plannedeconomies and to those that have been subject to comprehensiveeconomic sanctions, we find that the U.S. export loss averagedmore than $15 billion per year between 1989 and 1998, rangingfrom about $12 billion to over $23 billion.
Yang et al.: U.S. Economic Sanctions . . . 59
Fifth, the persistent negative impact of U.S. economic sanc-tions on the formerly planned economies and on countries sub-ject to comprehensive U.S. economic sanctions shows a stronglingering effect on trade between the United States and the tar-get countries. Even after more than a decade has passed sincethe Cold War ended, the negative impact on trade between theUnited States and these countries were still felt toward the endof the 20th century.
Sixth, we have found very different results for the third-country effects for the two groups of countries affected byU.S. economic sanctions. For the group of formerly plannedeconomies, their trade (including bilateral trade, exports alone,and imports alone) with the EU and Japan has been similarlyaffected by U.S. economic sanctions as their trade with theUnited States. This is a clear indication that U.S. economicsanctions were part of a multilateral effort in sanctioning thosecountries. On the other hand, in the case of countries subjectto comprehensive economic sanctions imposed by the UnitedStates, there is no significant impact on these countries’ tradewith the EU or Japan. In some cases, we found that thesesanctions have actually promoted trade between these countriesand the EU or Japan. This is a clear indication of third-countryeffect.
Our findings for the aggregate study suggest a number ofshortcomings and new directions for further research. First,while the impact of comprehensive, or overall, U.S. economicsanctions may be sufficiently captured by aggregate studies suchas ours, missing data for some sanctioned countries, like Cubaand North Korea, from publicly available data sources proves tobe a challenge. A more complete data set for these countries willshed more light on the impact of U.S. economic sanction.
Second, the selection of sanctioned countries that form thedummy variable for selective sanctions needs to be based on more
60 THE INTERNATIONAL TRADE JOURNAL
refined classifications as the sanction structure is very complexand the results are highly sensitive to sanction classification.
Third, most economic sanctions are industry- or product-specific. The impact of industry- or product-specific sanctionsmay not be detected in aggregate studies; disaggregated studiesare called for. For example, U.S. economic sanctions on Chinaare mainly in the area of export restrictions on products thatrepresents high technology or can be used for dual (military aswell as civilian) uses. Disaggregated trade data on industries orproducts like high performance computers, nuclear power equip-ment, and communication satellites may allow us to examine theimpact of U.S. sanctions on trade between the United States andChina in these areas.
Fourth, our empirical study, as well as that by Hufbauerand his colleagues (1997), has focused on the impact of U.S.economic sanctions on U.S. trade and the U.S. economy. Itdoes not provide detailed analysis of the impact on the targetcountries. Fifth, most of economic sanctions, if not all, have animpact on the target economy beyond just merchandise trade.They explicitly or implicitly affect international capital flowsand trade in services between the sender countries and targetcountries as well. Yet most empirical studies, including ours, havefocused on trade alone. We will attempt to include internationalfinancing and service trade as much as data availability permitsus to in our future studies.
VII. ACKNOWLEDGMENTS
An earlier version of this article appeared in the OccasionalPaper Series (24 February 2003), The George Washington Centerfor the Study of Globalization. We wish to thank seminarparticipants at the International Business Department, TheGeorge Washington University, and at the annual conference of
Yang et al.: U.S. Economic Sanctions . . . 61
Academy of International Business (San Juan, 2002) for helpfulcomments. We greatly appreciate comments of Alain Verbeke ofUniversity of Oxford, Lorraine Eden of Texas A&M University,and the three anonymous reviewers. Huiping Dong, Haiyan Yin,and Lili Zhu provided valuable research assistance. We aregrateful for financial support from the Center for the Study ofGlobalization (CSG) and for support and cooperation from theInstitute for Global Management and Research (IGMR), both atThe George Washington University. We alone are responsible forany errors.
REFERENCES
Askari, H. G., Forrer, J. Teegen, H., and Yang, J. 2003. Eco-nomic Sanctions: Examining Their Philosophy and Efficacy.Westport, CT: Praeger Publishers.
Aturupane, C. 1999. Corruption and International Trade.Work-ing paper. Department of Economics, Palo Alto, CA: StanfordUniversity.
CSIS. 1999. Altering U.S. Sanctions Policy—Final Report of theCSIS Project on Unilateral Economic Sanctions (February).Washington, D.C.: The CSIS Press.
Dell’Ariccia, G. 1999. Exchange Rate Fluctuations and TradeFlows: Evidence from the European Union. IMF Staff Papers46(3)(September/December):315–334.
Gould, D. M. 1994. Immigrant Links to the Home Country: Em-pirical Implications for U.S. Bilateral Trade Flows. Review ofEconomics and Statistics 76(May):302–316.
Hufbauer, G. C., Elliott, K. A., Cyrus, T., and Winston, E.1997. U.S. Economic Sanctions: Their Impact on Trade, Jobsand Wages. Working paper. Washington, D.C.: Institute forInternational Economics.
62 THE INTERNATIONAL TRADE JOURNAL
IMF. Various issues. Direction of Trade Statistics.Maddala, G. S. 1992. Introduction to Econometrics, 2nd ed.
Englewood Cliffs, N.J.: Prentice-Hall.Oguledo, V. I., and Macphee, C. R. 1994. Gravity Models: A
Reformulation and an Application to Discriminatory TradeArrangements. Applied Economics 26(2):107–120.
Pollard, P. S. 2001. Trade in the Neighborhood. InternationalEconomics Trends, Annual edition (July): 1. St. Louis, MO:Federal Reserve Bank of St. Louis.
Richardson, J. D. 1993. Sizing Up U.S. Export Disincentives.Washington, D.C.: Institute for International Economics.
Wall, H. J. 1999. Using the Gravity Model to Estimate theCosts of Protection. Review. 81(1) (January/February):33–40. St. Louis, MO: Federal Reserve Bank of St. Louis.
World Bank. Various issues. World Development Indicators.


![STAVROS FISCAL INTERMEDIARY SERVICES II ITJ … 121317.pdf · II Payroll Period From Sunday Through Saturday ITJ I ITJ I [I] ITJ I ITJ I ITJ Employer Information Number: I I I I Name](https://img.pdfslide.net/doc/110x75/5b61801f7f8b9a31488c8ab1/stavros-fiscal-intermediary-services-ii-itj-121317pdf-ii-payroll-period-from.jpg)


![Itj Practice Probs Kinematics [16 marks]](https://img.pdfslide.net/doc/110x75/61af535c83d10f0100554060/itj-practice-probs-kinematics-16-marks.jpg)