Embed Size (px)
Citation preview
•
•
• The Certificates of Analysis for the test substances can be found in Figures 1 and 2. The above standards were obtained from Dow AgroSciences LLC .
Dow AgroSciences LLC Study ID: 141124 Batte lie Study ID: I 00057852
Page 12 of 113
Independent Laboratory Validation for the Determination of Residues ofNitrapyrin in Ground, Surface, and Drinking Water by Gas Chromatography with Mass Spectrometry and 6
Chloropicolinic Acid (6-CPA) in Ground, Surface, and Drinking Water by Liquid Chromatography with Tandem Mass Spectrometry
INTRODUCTION
Separate methods are applicable for the quantitative determination of residues of nitrapyrin and its metabolite 6-chloropicolinic acid (6-CPA) in ground, surface, and drinking water. The nitrapyrin method was validated over the concentration range of 0.05-1 µg/L with a validated limit of quantitation (LOQ) of 0.05 µg/L. The 6-CP A method was validated over the concentration range of 0.05-1 µg/L with a validated LOQ of 0.05 µg/L. Common names, chemical names, and molecular formulas for the analytes are given in Table 1.
This study was conducted to fulfill data requirements outlined in the EPA Residue Chemistry Test Guidelines, OCSPP 850.6100 (J). The independent validation also complies with the requirements of EU Council Regulation (EC) No. 1107/2009 with particular regard to SANC0/825/00 rev.8.1 (2).
Method Principle
The residue ofnitrapyrin is extracted from water samples with two portions of 1:1 (v/v) hexane:toluene. The combined hexane:toluene extracts are evaporated to less than 1 mL and cleaned up on a deactivated silica solid-phase extraction (SPE) column. The SPE eluate containing nitrapyrin is analyzed by gas chromatography with electron-impact mass spectrometry (GC/EI-MS).
The residue of 6-CPA is extracted from water samples using C 18 solid phase extraction (SPE) cartridges. The residue is eluted from the SPE cartridges with acetonitrile, the sample is brought to dryness, then reconstituted with 25/75 (v/v) methanol/DI water. The final sample is analyzed by liquid chromatography coupled with negative-ion electrospray tandem mass spectrometry (LC-MS/MS).
Test Substances/Reference Compounds/ Analytical Standards
Test Substance
TSN Percent Purity
Recertification Date
Reference
Nitrapyrin AGR023966 99.9 11 July 2015 F APC 11-285444 6-CPA TSN301485 99 07 July 2015 F APC 13-000236
•
•
•
Dow AgroSciences LLC Study ID: 141124 Battelle Study ID: I00057852
Page 13 of 113
EXPERIMENTAL
Sample Origin, Numbering, Preparation, Storage, and Characterization
Untreated control samples were obtained by Battelle from local sources. All samples were tracked in the Battelle-Norwell Laboratory Information Management System (LIMS) database. Unique reagent, sample and batch numbers were assigned to track reagents and samples during receipt, storage, and analysis following Battelle SOPs 6-007 "Chemistry Laboratory Sample Identification" and 5-015 "Solvent/Reagent Inventory and Contaminant Residue Checks."
Samples were prepared for nitrapyrin analysis following the method described in Appendix 1 "Determination ofNitrapyrin in Water by Gas Chromatography-Mass Spectrometry", which represents the method provided by the sponsor (3) with slight modifications to account for differences in laboratory equipment and changes glassware substitutions and concentration of fortification solutions. Samples were prepared for 6-CP A analysis following the method described in Appendix 2 "Determination of 6-Chloropicolinic Acid ( 6-CP A) in Water by Liquid Chromatography with Tandem Mass Spectrometry Detection," which represents the method provided by the sponsor (4) with slight modifications to account for differences in differences in laboratory equipment or instrumentation. Changes to both methods provided by the sponsor are described in the "Changes to Method" section.
Samples were stored refrigerated at approximately 4 °C after the time of sampling and during the course of the independent laboratory validation study, except when they were removed for taking aliquots for sample preparation and analysis.
Samples were characterized in compliance with 40 CFR Part 160. The following table lists critical water quality parameters. Complete source documentation and water quality reports are included in the study file.
Water Type pH Hardness
(mg equiv. CaC03/L)
Total Suspended
Solids (ppm)
Total Organic Carbon (ppm)
Dissolved Organic Carbon (ppm)
Drinking Water (Tap) 8.0 70 LO 0.8 0.1 Ground Water (Monitoring Well) 6.9 32 12 0.5 0.5 Surface Water (Pond) 6.6 37 6 2.9 2.5
Instrumentation
For the detection of nitrapyrin, an Agilent Technologies 7890A GC System, equipped with a 7693 Autosampler and 5975C inert MSD was used. The following GC/EI-MS parameters were used to determine the concentration of nitrapyrin in sample extract solutions.
GC System: Agilent 7890A Injector: Agilent Model 7693 with 150 sample capacity autosampler tray Detector: Agilent Model 5975C mass spectrometer Column: Agilent DB-5MS (30 m x 0.25 mm ID x 1.00 µm film)
Dow AgroSciences LLC Study ID: 141124 Battelle Study ID: 100057852
•
• The following LC-MS/MS parameters are used to determine 6-CP A concentrations .
LC System: Agilent 1260 SL HPLC system (including a vacuum solvent degasser, binary HPLC pump, and column oven) and CTC Analytics HTC-Pal Autosampler MS Detector: Applied Biosystems MDS Sciex API 5500 linear ion trap MS/MS system with Turbolonspray (ESI) source
Oven Method: Column
Carrier Gas: Constant Flow
Injection: Injector Temperature Injection Volume Purge flow
Detection Method: Source Temperature Quad Temperature
Ions Monitored: Quantitation Confirmation (Primary) Confirmation (Secondary)
Page 14 of 113
130 °C for 1.0 minute 130 °C to 210 °Cat 10 °C/minute 210 °C to 280 °C at 15 °C/minute 280 °C for 2.0 minute Helium 1 mL/min Splitless 180 °C 2 µL 40.0 mL/min Positive-ion Electron-Impact ionization mode 250 °C 180 °C Ion Dwell m/z 194 50 msec m/z 196 50 msec m/z 198 50 msec
HPLC Conditions: Column Column Temperature
Injection Volume
Mobile Phase
Waters XSelect® HSS T3 3.5 µm, 3.0 x 100 mm 40°c 10 µL for batches 14-0606, 15-0003, 14-0618, 15-0002, 14-0625 and 15-0001 5 µL for batches 15-0016, 15-0027 and 15-0028 A: 0.01 % (v/v) Acetic Acid B: Methanol
•
•
•
•
Dow AgroSciences LLC Study ID: 141124 Battelle Study ID: I 00057852
Page 15 of 113
HPLC Gradient Program: Time
(minutes) %A %B Curve
Flow (mL/minute)
0.00 95 5 1 0.40 0.10 95 5 1 0.40 4.00 30 70 6 0.40 4.50 30 70 1 0.40 4.51 5 95 1 0.40 6.50 5 95 1 0.40 6.51 95 5 1 0.40 8.50 95 5 1 0.40
Divert flow to waste from Oto 0.5 minutes. Direct flow to the MS detector from 0.5 to 8.5 minutes. Divert flow to waste again at end of run.
Ion Source Conditions: Source temperature 350 °C Gas supply (GS 1 ): 40 Gas supply (GS 2) 60 Curtain gas: 30 CAD gas: Medium ESI Polarity: Negative Entrance potential: -10 V Ionspray Voltage -4000 V
MS/MS Conditions for 6-CP A : Quantification MS/MS transition 155.8/111.9
Collision energy (CE): -13 V Cell exit potential (CXP): -13 V Dwell time: 100 ms Declustering potential (DP): -50 V
Confirmation MS/MS transition 157.9/ 114.0 Collision energy (CE): -13 V Cell exit potential (CXP): -13 V Dwell time: 100 ms Declustering potential (DP): -50 V
Note that samples analyzed before 13 January 2015, utilized slightly different HPLC conditions and samples analyzed before 08 January 2015 has slightly different MS conditions. These conditions are described below:
HPLC Conditions: Column Water HSS T3 1.8 µm , 2.1 x 100 mm Column Temperature Same as above Injection Volume Same as above Mobile Phase A: Same as above
•
•
•
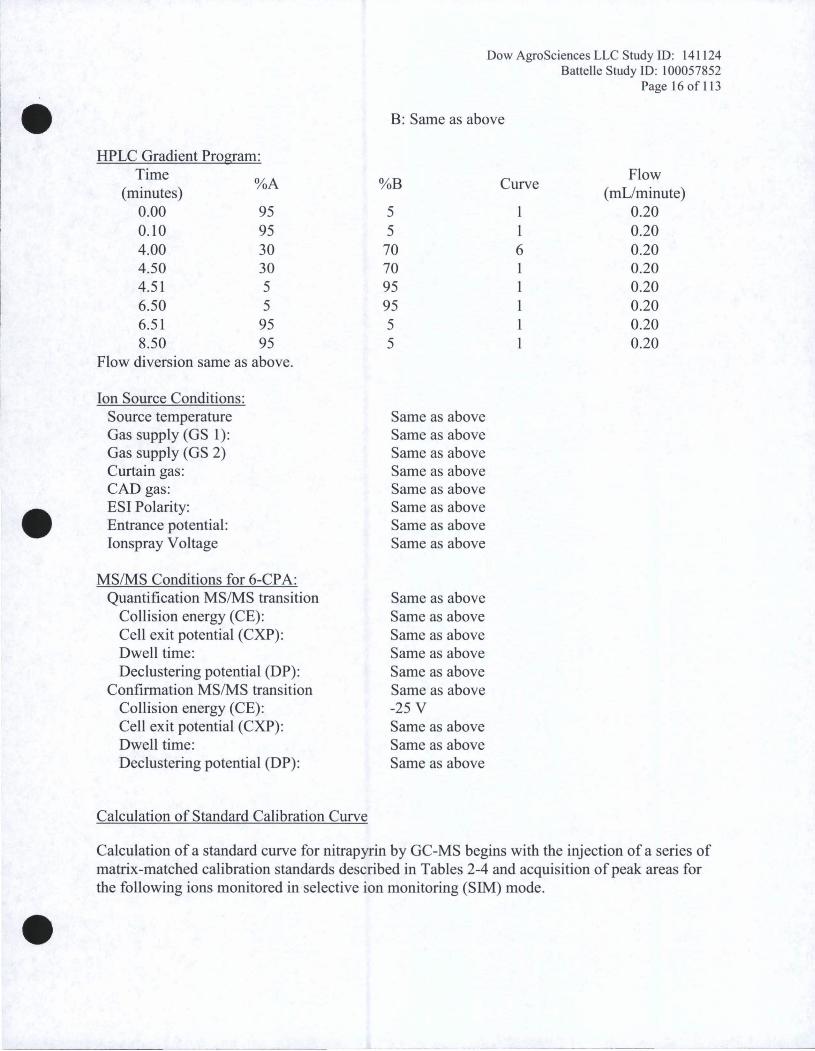
HPLC Gradient Program: Time
(minutes) %A
0.00 95 0.10 95 4.00 30 4.50 30 4.51 5 6.50 5 6.51 95 8.50 95
Flow diversion same as above.
Ion Source Conditions: Source temperature Gas supply (GS 1): Gas supply (GS 2) Curtain gas: CAD gas: ESI Polarity: Entrance potential: Ionspray Voltage
MS/MS Conditions for 6-CP A : Quantification MS/MS transition
Collision energy (CE): Cell exit potential (CXP): Dwell time: Declustering potential (DP):
Confirmation MS/MS transition Collision energy (CE): Cell exit potential (CXP): Dwell time: Declustering potential (DP):
Calculation of Standard Calibration Curve
Calculation of a standard curve for nitrapyrin by GC-MS begins with the injection of a series of matrix-matched calibration standards described in Tables 2-4 and acquisition of peak areas for the following ions monitored in selective ion monitoring (SIM) mode .
Dow AgroSciences LLC Study ID: 141124 Battelle Study ID: l 00057852
Page 16 of 113
B: Same as above
Flow%8 Curve
(mL/minute) 5 1 0.20 5 1 0.20
70 6 0.20 70 1 0.20 95 1 0.20 95 1 0.20 5 1 0.20 5 1 0.20
Same as above Same as above Same as above Same as above Same as above Same as above Same as above Same as above
Same as above Same as above Same as above Same as above Same as above Same as above -25 V Same as above Same as above Same as above
Dow AgroSciences LLC Study ID: 141124 Batte lie Study ID: l 00057852
Page 17 of 113
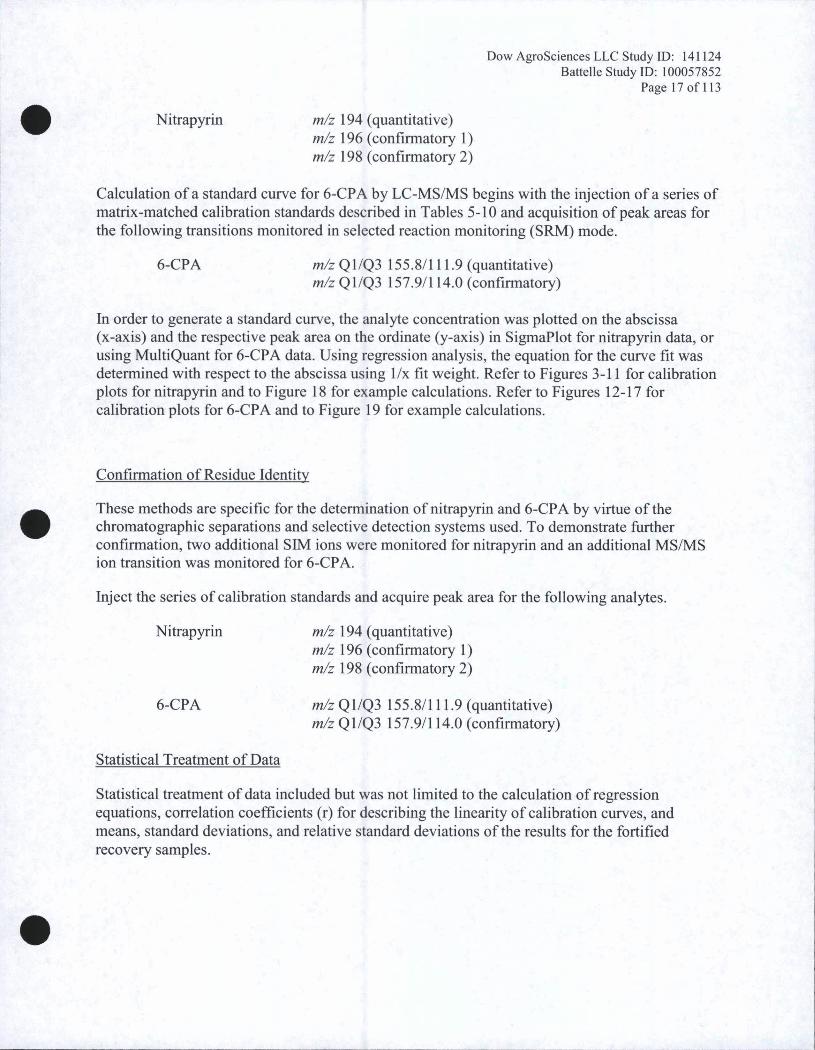
• Nitrapyrin m/z 194 (quantitative) m/z 196 ( confirmatory l) m/z 198 ( confirmatory 2)
Calculation of a standard curve for 6-CPA by LC-MS/MS begins with the injection of a series of matrix-matched calibration standards described in Tables 5-10 and acquisition of peak areas for the following transitions monitored in selected reaction monitoring (SRM) mode.
6-CPA m/z Ql /Q3 155.8/111.9 (quantitative) m/z Ql/Q3 157.9/ 114.0 (confirmatory)
In order to generate a standard curve, the analyte concentration was plotted on the abscissa (x-axis) and the respective peak area on the ordinate (y-axis) in SigmaPlot for nitrapyrin data, or using MultiQuant for 6-CPA data. Using regression analysis, the equation for the curve fit was determined with respect to the abscissa using 1/x fit weight. Refer to Figures 3-11 for calibration plots for nitrapyrin and to Figure 18 for example calculations. Refer to Figures 12-17 for calibration plots for 6-CPA and to Figure 19 for example calculations.
Confirmation of Residue Identity
These methods are specific for the determination of nitrapyrin and 6-CP A by virtue of the chromatographic separations and selective detection systems used. To demonstrate further confirmation, two additional SIM ions were monitored for nitrapyrin and an additional MS/MS • ion transition was monitored for 6-CP A.
Inject the series of calibration standards and acquire peak area for the following analytes.
Nitrapyrin m/z 194 (quantitative) m/z 196 ( confirmatory 1) m/z 198 (confirmatory 2)
6-CPA m/z Ql/Q3 155.8/111.9 (quantitative) m/z Ql/Q3 157.9/114.0 (confirmatory)
Statistical Treatment of Data
Statistical treatment of data included but was not limited to the calculation of regression equations, correlation coefficients (r) for describing the linearity of calibration curves, and means, standard deviations, and relative standard deviations of the results for the fortified recovery samples .
•
Dow AgroSciences LLC Study ID: 141124 Battelle Study ID: I 00057852
Page 21 of 113
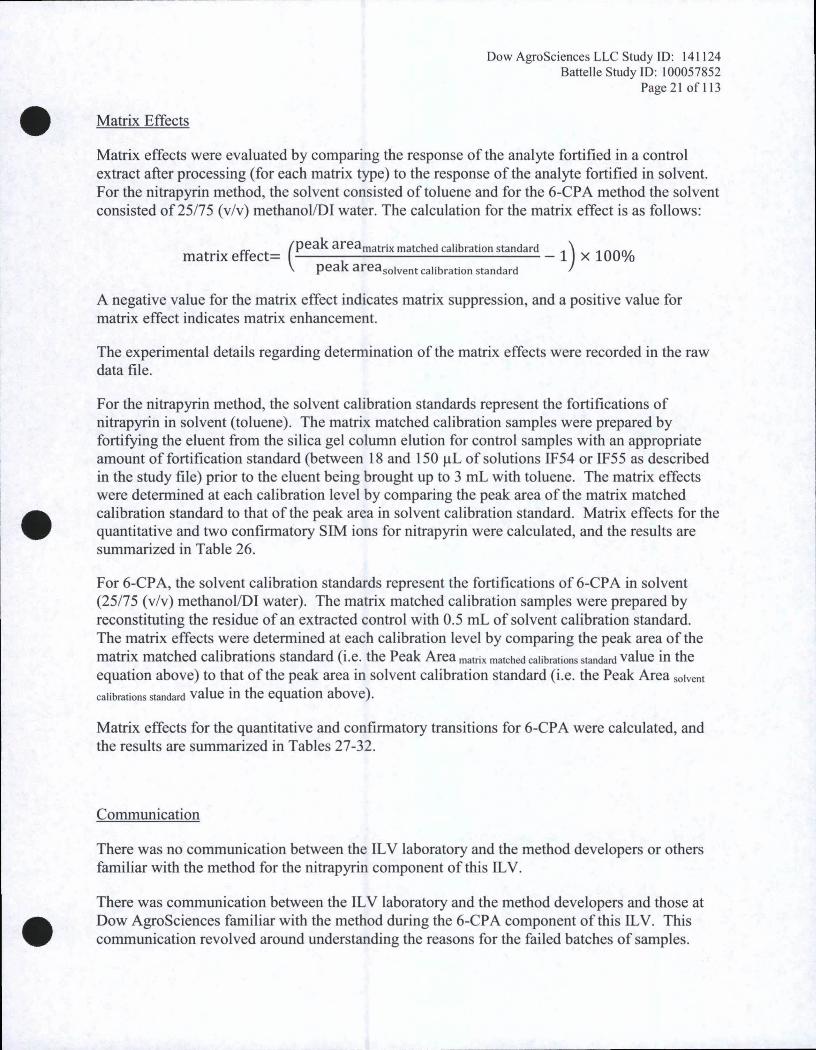
• Matrix Effects
Matrix effects were evaluated by comparing the response of the analyte fortified in a control extract after processing (for each matrix type) to the response of the analyte fortified in solvent. For the nitrapyrin method, the solvent consisted of toluene and for the 6-CPA method the solvent consisted of 25/75 (v/v) methanol/DI water. The calculation for the matrix effect is as follows:
. fC t (peak areamatrix matched calibration standard l) lOOOt. matnx e ,ec = - x ;,opeak areasolvent calibration standard
A negative value for the matrix effect indicates matrix suppression, and a positive value for matrix effect indicates matrix enhancement.
The experimental details regarding determination of the matrix effects were recorded in the raw data file.
•
For the nitrapyrin method, the solvent calibration standards represent the fortifications of nitrapyrin in solvent (toluene). The matrix matched calibration samples were prepared by fortifying the eluent from the silica gel column elution for control samples with an appropriate amount of fortification standard (between 18 and 150 µL of solutions IF54 or IF55 as described in the study file) prior to the eluent being brought up to 3 mL with toluene. The matrix effects were determined at each calibration level by comparing the peak area of the matrix matched calibration standard to that of the peak area in solvent calibration standard. Matrix effects for the quantitative and two confirmatory SIM ions for nitrapyrin were calculated, and the results are summarized in Table 26.
For 6-CPA, the solvent calibration standards represent the fortifications of 6-CPA in solvent (25/75 (v/v) methanol/DI water). The matrix matched calibration samples were prepared by reconstituting the residue of an extracted control with 0.5 mL of solvent calibration standard. The matrix effects were determined at each calibration level by comparing the peak area of the matrix matched calibrations standard (i.e. the Peak Area matrix matched calibrat ions standard value in the equation above) to that of the peak area in solvent calibration standard (i.e. the Peak Area solvent
ca librations standard value in the equation above).
Matrix effects for the quantitative and confirmatory transitions for 6-CP A were calculated, and the results are summarized in Tables 27-32.
Communication
There was no communication between the IL V laboratory and the method developers or others familiar with the method for the nitrapyrin component of this ILV.
• There was communication between the IL V laboratory and the method developers and those at Dow AgroSciences familiar with the method during the 6-CPA component of this ILV. This communication revolved around understanding the reasons for the failed batches of samples.
Dow AgroSciences LLC Study ID: 141124 Battelle Study ID: 100057852
• Page 22 of 113
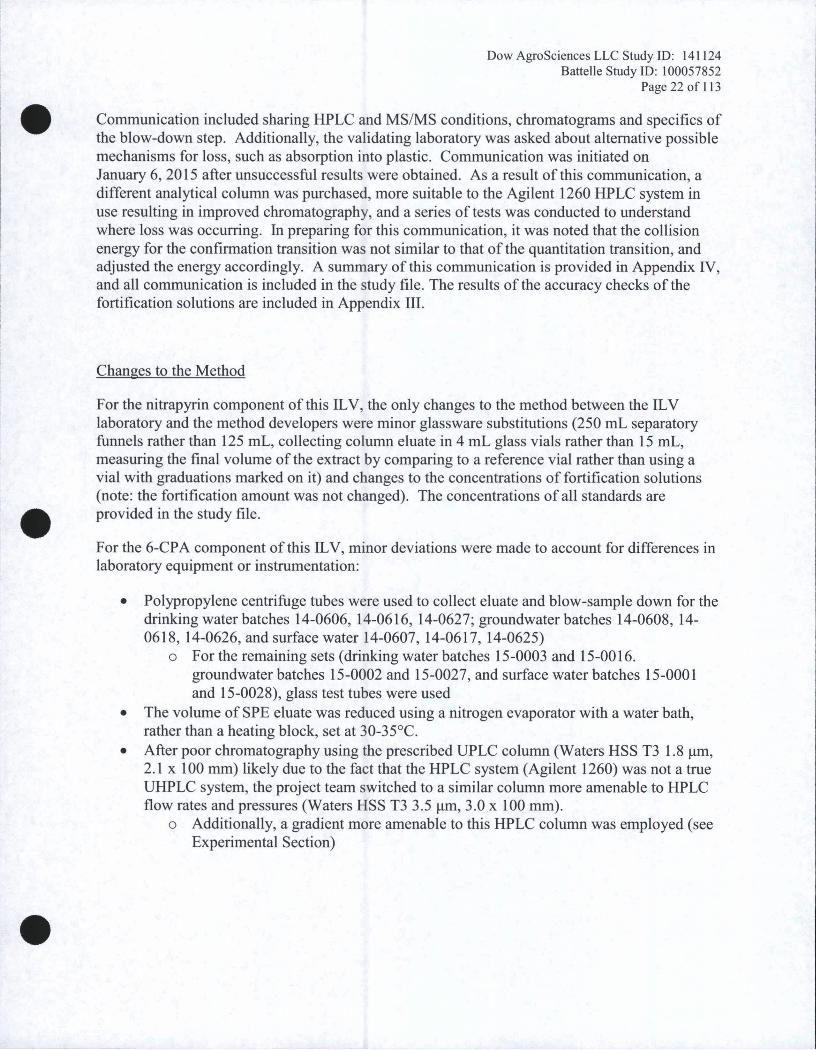
Communication included sharing HPLC and MS/MS conditions, chromatograms and specifics of the blow-down step. Additionally, the validating laboratory was asked about alternative possible mechanisms for loss, such as absorption into plastic. Communication was initiated on January 6, 2015 after unsuccessful results were obtained. As a result of this communication, a different analytical column was purchased, more suitable to the Agilent 1260 HPLC system in use resulting in improved chromatography, and a series of tests was conducted to understand where loss was occurring. In preparing for this communication, it was noted that the collision energy for the confirmation transition was not similar to that of the quantitation transition, and adjusted the energy accordingly. A summary of this communication is provided in Appendix IV, and all communication is included in the study file. The results of the accuracy checks of the fortification solutions are included in Appendix III.
Changes to the Method
For the nitrapyrin component of this IL V, the only changes to the method between the IL V laboratory and the method developers were minor glassware substitutions (250 mL separatory funnels rather than 125 mL, collecting column eluate in 4 mL glass vials rather than 15 mL, measuring the final volume of the extract by comparing to a reference vial rather than using a vial with graduations marked on it) and changes to the concentrations of fortification solutions
• (note: the fortification amount was not changed). The concentrations of all standards are provided in the study file .
For the 6-CPA component of this ILV, minor deviations were made to account for differences in laboratory equipment or instrumentation:
• Polypropylene centrifuge tubes were used to collect eluate and blow-sample down for the drinking water batches 14-0606, 14-0616, 14-0627; groundwater batches 14-0608, 140618, 14-0626, and surface water 14-0607, 14-0617, 14-0625)
o For the remaining sets (drinking water batches 15-0003 and 15-0016. groundwater batches 15-0002 and 15-0027, and surface water batches 15-0001 and 15-0028), glass test tubes were used
• The volume of SPE eluate was reduced using a nitrogen evaporator with a water bath, rather than a heating block, set at 30-35°C.
• After poor chromatography using the prescribed UPLC column (Waters HSS T3 1.8 µm, 2.1 x 100 mm) likely due to the fact that the HPLC system (Agilent 1260) was not a true UHPLC system, the project team switched to a similar column more amenable to HPLC flow rates and pressures (Waters HSS T3 3.5 µm, 3.0 x 100 mm).
o Additionally, a gradient more amenable to this HPLC column was employed (see Experimental Section)
•
Dow AgroSciences LLC Study ID: 141124 Battelle Study ID: I 00057852
• Page 25 of 113
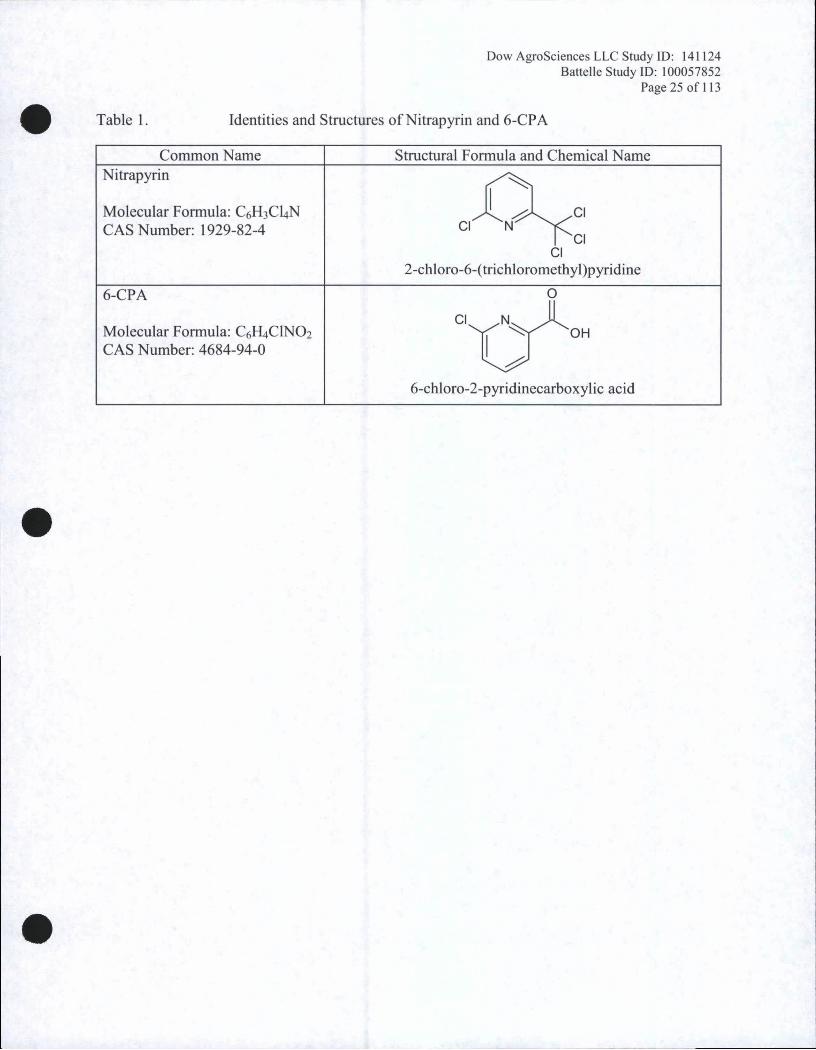
Table 1. Identities and Structures of Nitrapyrin and 6-CPA
Common Name Structural Formula and Chemical Name Nitrapyrin
Molecular Formula: C6H3C4N Cl ClCAS Number: 1929-82-4
Cl Cl
2-chloro-6-(trichloromethyl)pyridine
06-CPA
Cl Molecular Formula: C6H4ClN02 CAS Number: 4684-94-0
OH
6-chloro-2-pyridinecarboxylic acid
•
•
Dow AgroSciences LLC Study ID: 141124 Battelle Study ID: l 00057852
• Page 74 of 113
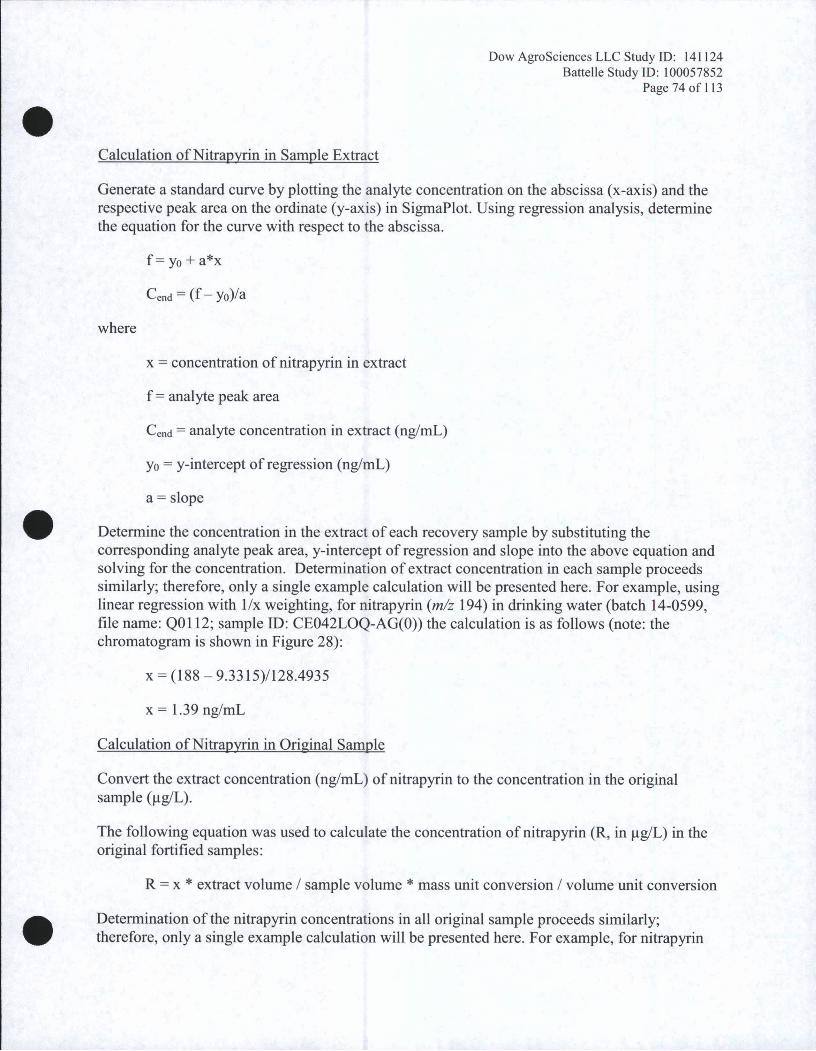
Calculation ofNitrapyrin in Sample Extract
Generate a standard curve by plotting the analyte concentration on the abscissa (x-axis) and the respective peak area on the ordinate (y-axis) in SigmaPlot. Using regression analysis, determine the equation for the curve with respect to the abscissa.
f=yo+a*x
Cenct = (f - Yo)/a
•
where
x = concentration of nitrapyrin in extract
f = anal yte peak area
Cend = analyte concentration in extract (ng/mL)
Yo = y-intercept of regression (ng/mL)
a= slope
Determine the concentration in the extract of each recovery sample by substituting the corresponding analyte peak area, y-intercept of regression and slope into the above equation and solving for the concentration. Determination of extract concentration in each sample proceeds similarly; therefore, only a single example calculation will be presented here. For example, using linear regression with l/x weighting, for nitrapyrin (m/z 194) in drinking water (batch 14-0599, file name: QOl 12; sample ID: CE042LOQ-AG(O)) the calculation is as follows (note: the chromatogram is shown in Figure 28):
X = (188- 9.3315)/128.4935
x = 1.39 ng/mL
Calculation ofNitrapyrin in Original Sample
Convert the extract concentration (ng/mL) of nitrapyrin to the concentration in the original sample (µg/L) .
The following equation was used to calculate the concentration of nitrapyrin (R, in µg/L) in the original fortified samples :
R = x * extract volume / sample volume * mass unit conversion/ volume unit conversion
• Determination of the nitrapyrin concentrations in all original sample proceeds similarly; therefore, only a single example calculation will be presented here. For example, for nitrapyrin
Dow AgroSciences LLC Study lD: 141124 Battelle Study ID: I 00057852
• Page 75 of 113
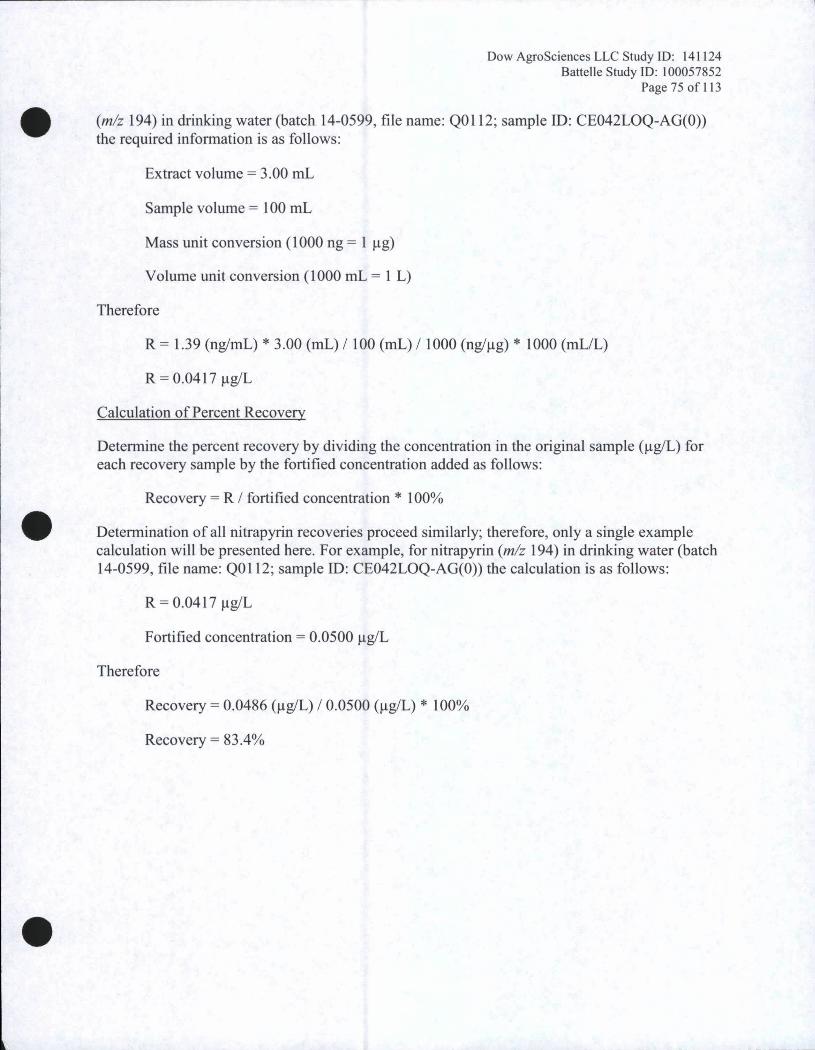
(m/z 194) in drinking water (batch 14-0599, file name: QOl 12; sample ID: CE042LOQ-AG(O)) the required information is as follows:
Extract volume= 3.00 rnL
Sample volume = l 00 rnL
Mass unit conversion (1000 ng = 1 µg)
Volume unit conversion (1000 rnL = 1 L)
Therefore
R = l.39 (ng/mL) * 3.00 (mL) / 100 (mL) / 1000 (ng/µg) * 1000 (mL/L)
R = 0.0417 µg/L
•
Calculation of Percent Recovery
Determine the percent recovery by dividing the concentration in the original sample (µg/L) for each recovery sample by the fortified concentration added as follows:
Recovery = R I fortified concentration * l 00%
Determination of all nitrapyrin recoveries proceed similarly; therefore, only a single example calculation will be presented here. For example, for nitrapyrin (m/z 194) in drinking water (batch 14-0599, file name: QOl 12; sample ID: CE042LOQ-AG(O)) the calculation is as follows :
R = 0.0417 µg/L
Fortified concentration = 0.0500 µg/L
Therefore
Recovery = 0.0486 (µg/L) / 0.0500 (µg/L) * 100%
Recovery = 83 .4%
•
Dow AgroSciences LLC Study ID: 141124 Battelle Study ID: 100057852
• Page 76 of 113
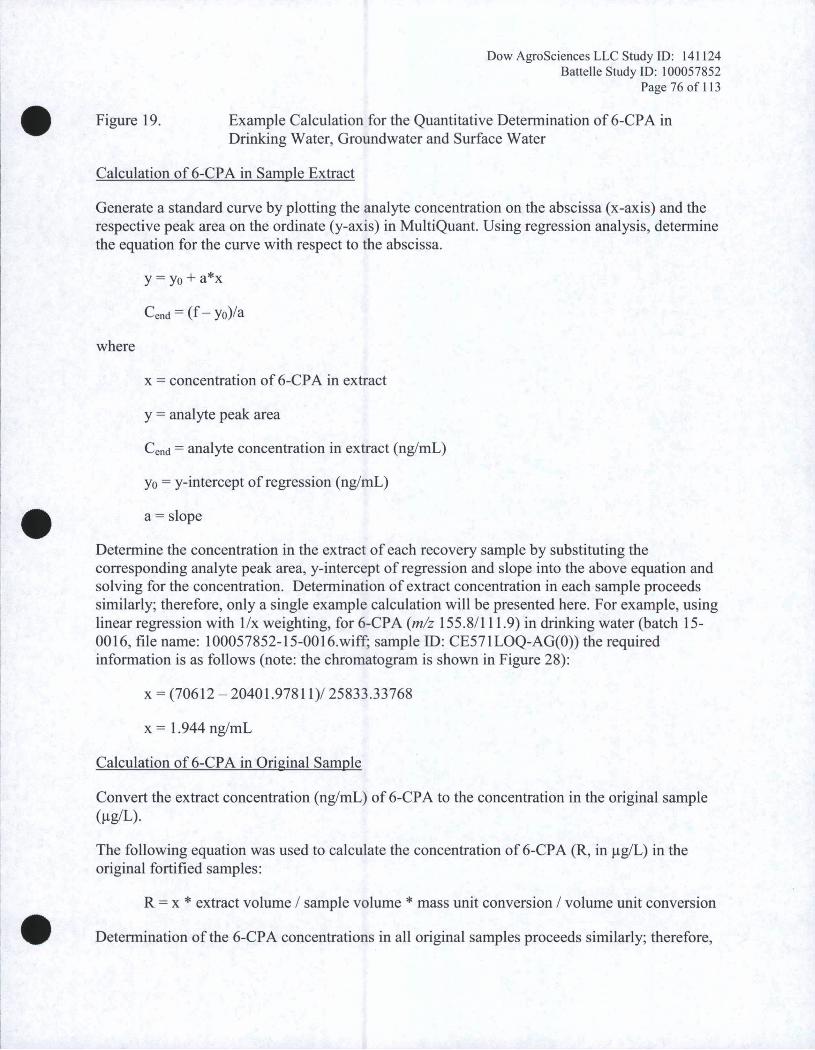
Figure 19. Example Calculation for the Quantitative Determination of 6-CP A in Drinking Water, Groundwater and Surface Water
Calculation of 6-CPA in Sample Extract
Generate a standard curve by plotting the analyte concentration on the abscissa (x-axis) and the respective peak area on the ordinate (y-axis) in MultiQuant. Using regression analysis, determine the equation for the curve with respect to the abscissa.
y = yo+a*x
Cend = (f - Yo)/a
where
x = concentration of 6-CP A in extract
y = analyte peak area
Cend= analyte concentration in extract (ng/mL)
Yo = y-intercept of regression (ng/mL)
• a = slope
Determine the concentration in the extract of each recovery sample by substituting the corresponding analyte peak area, y-intercept of regression and slope into the above equation and solving for the concentration. Determination of extract concentration in each sample proceeds similarly; therefore, only a single example calculation will be presented here. For example, using linear regression with 1/x weighting, for 6-CPA (m/z 155.8/111.9) in drinking water (batch 150016, file name: 100057852-15-0016.wiff; sample ID: CE571LOQ-AG(O)) the required information is as follows (note: the chromatogram is shown in Figure 28):
X = (70612 - 20401.97811)/ 25833.33768
x = 1.944 ng/mL
Calculation of 6-CP A in Original Sample
Convert the extract concentration (ng/mL) of 6-CPA to the concentration in the original sample (µg/L).
The following equation was used to calculate the concentration of 6-CPA (R, in µg/L) in the original fortified samples:
• R = x * extract volume I sample volume * mass unit conversion / volume unit conversion
Determination of the 6-CP A concentrations in all original samples proceeds similarly; therefore,
Dow AgroSciences LLC Study ID: 141124 Batte lie Study ID: 100057852
• Page 77 of 113
only a single example calculation will be presented here. For example, for 6-CPA (rn/z 155.8/111.9) in drinking water (batch 15-0016), file name: 100057852-15-0016.wiff; sample ID: CE571LOQ-AG(O)) the required information is as follows:
Extract volume = 0.500 mL
Sample volume = 20.0 mL
Mass unit conversion (1000 ng = 1 µg)
Volume unit conversion (1000 mL = 1 L)
Therefore
R = 1.944 (ng/mL) * 0.500 (mL) / 20.0 (mL) / 1000 (ng/µg) * 1000 (mL/L)
R = 0.0486 µg/L
Determine the percent recovery by dividing the concentration in the original sample (µg/L) for each recovery sample by the fortified concentration added as follows :
• Recovery = R I fortified concentration x 100%
Determination of all nitrapyrin and 6-CP A recoveries proceed similarly; therefore, only a single example calculation will be presented here. For example, for 6-CPA (rn/z 155.8/111.9) in drinking water (batch 15-0016), file name: 100057852-15-0016.wiff; sample ID: CE571LOQAG(O)) the required information is as follows :
R = 0.0486 µg/L
Fortified concentration = 0.0505 µg/L
Therefore
Recovery = 0.0486 (µg/L) / 0.0505 (µg/L) x 100%
Recovery= 96.2%
•
Dow AgroSciences LLC Study ID: 141 124 Batte Ile Study ID: I 00057852
• Page 93 of 113
Determination ofNitrapyrin in Water by Gas Chromatography-Mass Spectrometry
Note: the method described herein was modified from EPL-BAS Method No. 205G907 A to account for differences in differences in laboratory equipment or instrumentation. Changes to both methods provided by the sponsor are described in the "Changes to Method" section.
Safety Precautions
Each analyst must be acquainted with the potential hazards of the equipment, reagents, products, solvents, and procedures used in this method before commencing laboratory work. Sources of information include operation manuals, material safety data sheets, literature, and other related data. Safety information should be obtained from the supplier. Disposal of waste materials, reagents, reactants, and solvents must be in compliance applicable governmental requirements.
Acetonitrile, hexane, and toluene are flammable and should be used in well-ventilated areas away from ignition sources. Sulfuric acid is corrosive and can cause severe bums. It is imperative that proper eye and personal protection equipment be worn when handling these reagents.
Laboratory Equipment
• Balance, analytical, Mettler A T201
Nitrogen evaporator, Organomation N-evap 115
Orbital shaker table, New Brunswick Scientific G-10
Pipet, 2-20 uL capacity, Rainin RL-20R
Pipet, 20-200 uL capacity, Rainin RL-200R
Pipet, 100-1000 uL capacity, Rainin R-lOOOR
Pipet, 200-2000 uL capacity, Rainin R-2000R
Pipet, 1-10 mL capacity, Rainin RL-lOML
Vortex mixer, Benchmark Scientific BVlOOO
GC-MS and LC-MS/MS systems
• GC-MS system, Agilent 7890A
Dow AgroSciences LLC Study ID: 141124 Battelle Study ID: 100057852
Page 94 of 113
• GC-MS Autosampler, Agilent 7693
GC-MS Detector, Agilent 5975C
Capillary GC column, Agilent DB-5MS (30m, 0.25mm ID, 1.00µm film)
GC-MS quantitation software, Agilent MSD ChemStation E.02.02.1431
•
Glassware and Materials
Vials, glass, 25 mL, catalogue number 06451173 , Wheaton
Vials, glass, 4 mL, catalogue number C4015-1, Thermo Scientific
Vials, autosampler, 2 mL, catalogue number 03-375-3CC, National Scientific
Vial caps, PTFE-lined polypropylene, catalogue number B7815-24, National Scientific
Vial caps, PTFE-lined polypropylene, catalogue number B7815-13, Thermo Scientific
Vial cap, for autosampler vial, catalogue number 11-0030A-B, MicroLiter Analytical
Centrifuge tubes, polypropylene, 50 mL, catalogue number 05-539-9, Fisher Scientific
Disposable transfer pipette, glass, catalogue number 13-678-30, Fisher Scientific
Glass wool, 8 µm fiber diameter, catalogue number 3950, Coming Life Sciences Glass
Separatory funnels , 125 mL
Graduated cylinders, glass, class A, 10-100 mL
Volumetric flasks , class A, 10-1000 mL
Beakers, glass, various sizes
Reagents
Hexane, Doe & Ingalls (catalogue number 9262-03), lot 0000082837
Toluene, Fisher Scientific HPLC grade (catalogue number T290SK-4), lot 144492
• Acetonitrile, Fisher Optima LC/MS grade (catalogue number A955-4), lot 145298
Sulfuric acid, Doe & Ingalls (catalogue number 9673-00), lot 095813
Dow AgroSciences LLC Study ID: 141124 Battelle Study ID: I 00057852
Page 95 of 113
• Silica gel, Sigma-Aldrich (catalogue number 214477), lot BCBNI456V
Prepared Solutions
4: 1 (v/v) Hexane:Toluene Solution
For each liter of solution prepared, combine 800 mL of hexane and 200 mL of toluene and mix well.
1: 1 (v/v) Hexane:Toluene Solution
For each 4 liters of solution prepared, combine 2000 mL of hexane and 2000 mL of toluene and mix well.
6N Sulfuric Acid
• For each 1 liter of solution prepared, slowly add 168 mL of concentrated sulfuric acid to a 1 L class A volumetric flask containing approximately 500 mL of deionized water. Slowly add deionized water to the base of the neck and mix. The solution will be very hot. Allow the solution to cool to room temperature and dilute to volume with additional deionized water. Mix well.
Stock Standard, 1000 µg/mL
Weigh 0.1 g of the neat nitrapyrin reference standard into a 100 mL volumetric flask and dilute to volume with 4: 1 (v/v) hexane:toluene.
Working Standard, 50 µg/mL
Pipette 5 mL of the 1000 µg/mL nitrapyrin stock solution into a 100 mL volumetric flask and dilute to volume with 4: 1 (v/v) hexane:toluene.
Working Standard, 5 µg/mL
Pipette 10 mL of the 50 µg/mL working solution into a 100 mL volumetric flask and dilute to volume with 4: 1 (v/v) hexane:toluene.
Working Standard, 1 µg/mL
Pipette 10 mL of the 5 µg/mL working solution into a 50 mL volumetric flask and dilute to volume with 4: 1 (v/v) hexane:toluene.
Working Standard, O. lµg/mL
• Pipette 1 mL of the 1 µg/mL working solution into a 10 mL volumetric flask and dilute to volume with 4: 1 (v/v) hexane:toluene.
•
•
Dow AgroSciences LLC Study ID: 141124 Battelle Study ID: 100057852
Page 96 of 113
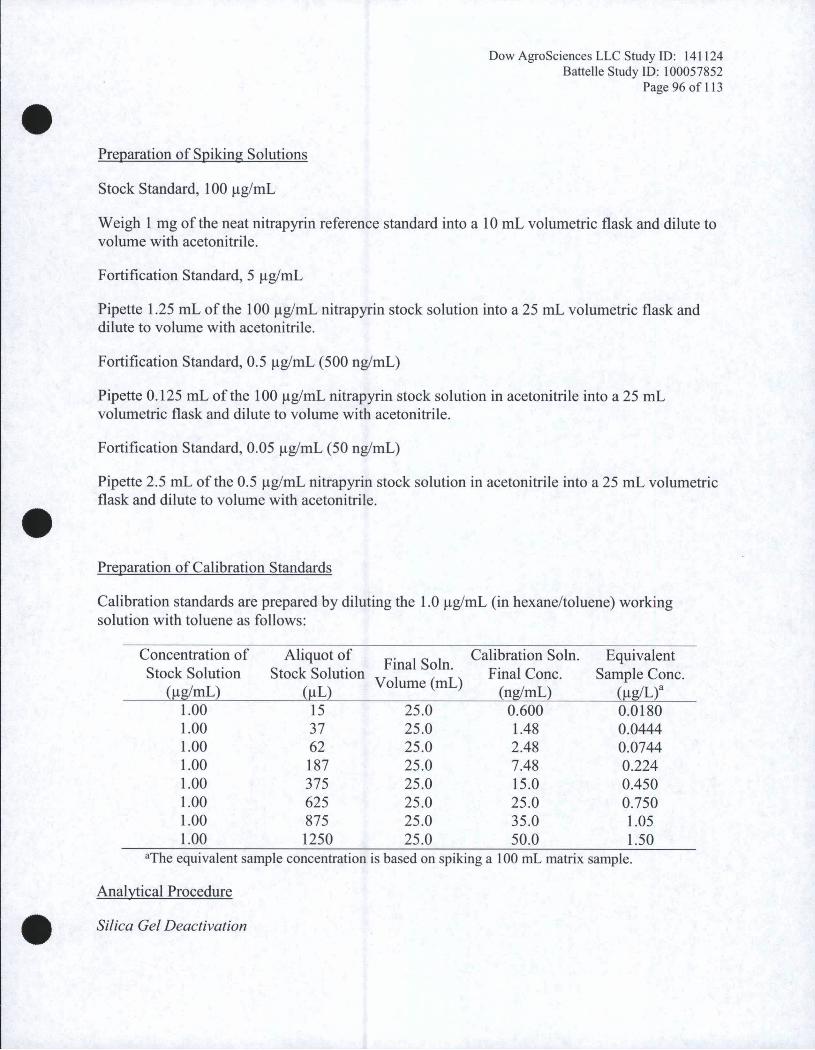
Preparation of Spiking Solutions
Stock Standard, 100 µg/mL
Weigh 1 mg of the neat nitrapyrin reference standard into a 10 mL volumetric flask and dilute to volume with acetonitrile.
Fortification Standard, 5 µg/mL
Pipette 1.25 mL of the 100 µg/mL nitrapyrin stock solution into a 25 mL volumetric flask and dilute to volume with acetonitrile.
Fortification Standard, 0.5 µg/mL (500 ng/mL)
Pipette 0.125 mL of the 100 µg/mL nitrapyrin stock solution in acetonitrile into a 25 mL volumetric flask and dilute to volume with acetonitrile .
Fortification Standard, 0.05 µg/mL (50 ng/mL)
Pipette 2.5 mL of the 0.5 µg/mL nitrapyrin stock solution in acetonitrile into a 25 mL volumetric flask and dilute to volume with acetonitrile .
Preparation of Calibration Standards
Calibration standards are prepared by diluting the 1.0 µg/mL (in hexane/toluene) working solution with toluene as follows:
Concentration of Aliquot of Calibration Soln. EquivalentFinal Soln.
Stock Solution Stock Solution Final Cone. Sample Cone. Volume (mL)
(µg/mL) (µL) (ng/mL) (µg/L)8 15 37 62 187 375 625 875 1250
3 The equivalent sample concentration is based on spiking a 100 mL matrix sample.
Analytical Procedure
•
1.00 1.00 1.00 1.00 1.00 1.00 1.00 1.00
Silica Gel Deactivation
25 .0 25 .0 25.0 25.0 25.0 25.0 25.0 25.0
0.600 1.48 2.48 7.48 15.0 25.0 35.0 50.0
0.0180 0.0444 0.0744 0.224 0.450 0.750 1.05 1.50
Dow AgroSciences LLC Study ID: 141124 Battelle Study ID: I 00057852
• Page 97 of 113
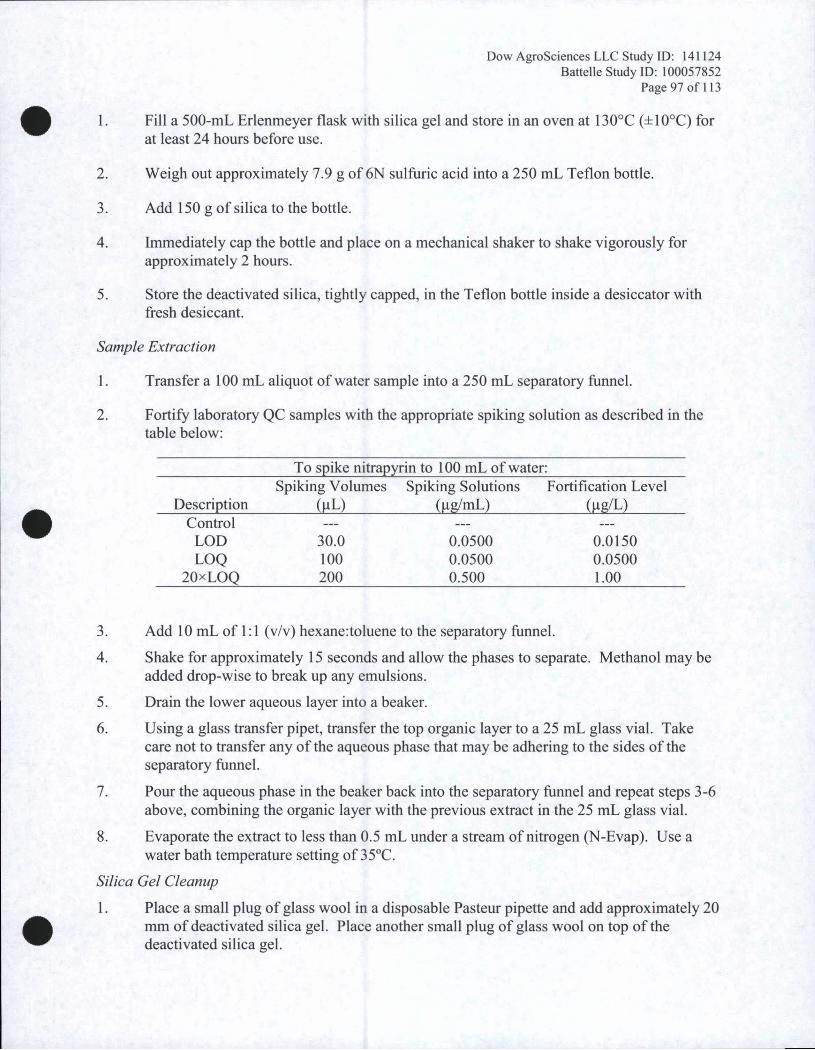
3. Add 150 g of silica to the bottle.
4. Immediately cap the bottle and place on a mechanical shaker to shake vigorously for approximately 2 hours.
5. Store the deactivated silica, tightly capped, in the Teflon bottle inside a desiccator with fresh desiccant.
Sample Extraction
1. Transfer a 100 mL aliquot of water sample into a 250 mL separatory funnel.
2. Fortify laboratory QC samples with the appropriate spiking solution as described in the table below:
1. Fill a 500-mL Erlenmeyer flask with silica gel and store in an oven at 130°C (±10°C) for at least 24 hours before use.
2. Weigh out approximately 7 .9 g of 6N sulfuric acid into a 250 mL Teflon bottle.
To spike nitrapyrin to 100 mL of water:
• Spiking Volumes Spiking Solutions Fortification Level
Description (µL) (µg/mL) (µg/L) Control
LOD 30.0 0.0500 0.0150 LOQ 100 0.0500 0.0500
20xLOQ 200 0.500 1.00
3. Add 10 mL of 1: 1 (v/v) hexane:toluene to the separatory funnel.
4. Shake for approximately 15 seconds and allow the phases to separate. Methanol may be added drop-wise to break up any emulsions.
5. Drain the lower aqueous layer into a beaker.
6. Using a glass transfer pipet, transfer the top organic layer to a 25 mL glass vial. Take care not to transfer any of the aqueous phase that may be adhering to the sides of the separatory funnel.
7. Pour the aqueous phase in the beaker back into the separatory funnel and repeat steps 3-6 above, combining the organic layer with the previous extract in the 25 mL glass vial.
8. Evaporate the extract to less than 0.5 mL under a stream of nitrogen (N-Evap). Use a water bath temperature setting of 35°C.
Silica Gel Cleanup
• 1. Place a small plug of glass wool in a disposable Pasteur pipette and add approximately 20 mm of deactivated silica gel. Place another small plug of glass wool on top of the deactivated silica gel.
Dow AgroSciences LLC Study ID: 141124 Battelle Study ID: 100057852
• Page 98 of 113
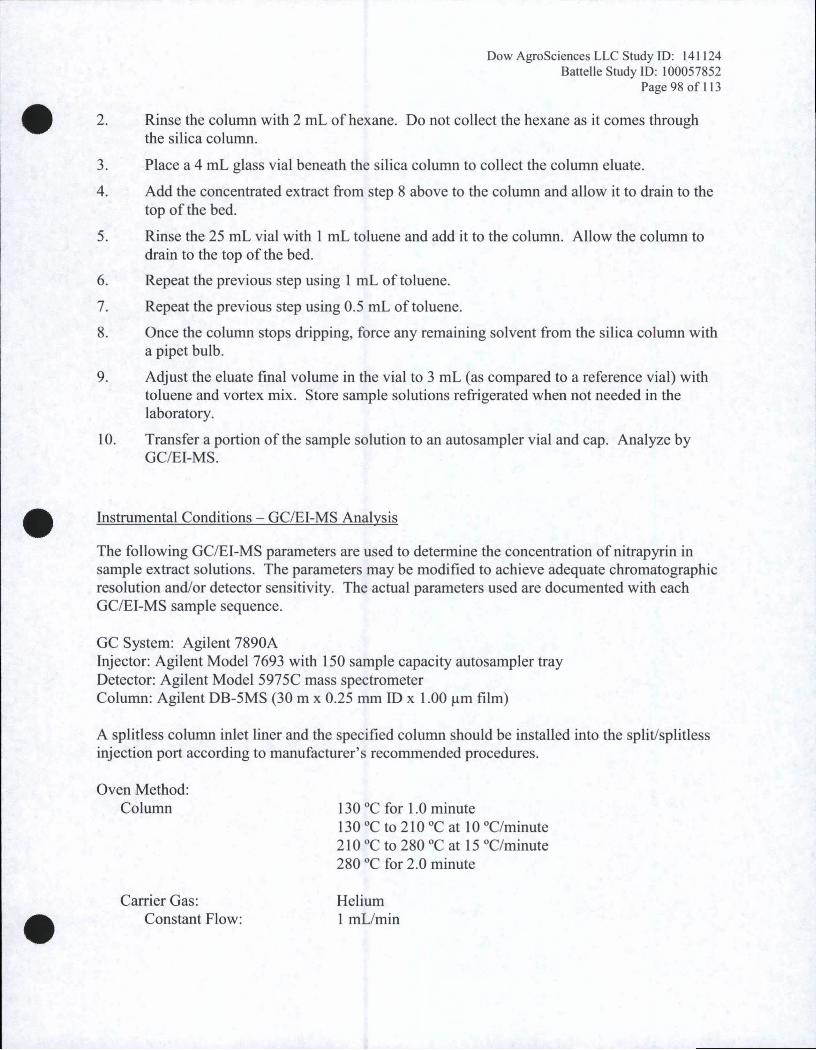
2. Rinse the column with 2 mL of hexane. Do not collect the hexane as it comes through the silica column.
3. Place a 4 mL glass vial beneath the silica column to collect the column eluate.
4. Add the concentrated extract from step 8 above to the column and allow it to drain to the top of the bed.
5. Rinse the 25 mL vial with 1 mL toluene and add it to the column. Allow the column to drain to the top of the bed.
6. Repeat the previous step using 1 mL of toluene.
7. Repeat the previous step using 0.5 mL of toluene.
8. Once the column stops dripping, force any remaining solvent from the silica column with a pipet bulb.
9. Adjust the eluate final volume in the vial to 3 mL (as compared to a reference vial) with toluene and vortex mix. Store sample solutions refrigerated when not needed in the laboratory.
10. Transfer a portion of the sample solution to an autosampler vial and cap. Analyze by GC/EI-MS .
• Instrumental Conditions - GC/EI-MS Analysis
The following GC/EI-MS parameters are used to determine the concentration of nitrapyrin in sample extract solutions. The parameters may be modified to achieve adequate chromatographic resolution and/or detector sensitivity. The actual parameters used are documented with each GC/EI-MS sample sequence.
GC System: Agilent 7890A Injector: Agilent Model 7693 with 150 sample capacity autosampler tray Detector: Agilent Model 5975C mass spectrometer Column: Agilent DB-5MS (30 m x 0.25 mm ID x 1.00 µm film)
A splitless column inlet liner and the specified column should be installed into the split/splitless injection port according to manufacturer' s recommended procedures.
Oven Method: Column 130 °C for 1.0 minute
130 °C to 210 °Cat 10 °C/minute 210 °C to 280 °C at 15 °C/minute 280 °C for 2.0 minute
• Carrier Gas: Helium
Constant Flow: 1 mL/min
Dow AgroSciences LLC Study ID: 141124 Battelle Study ID: I 00057852
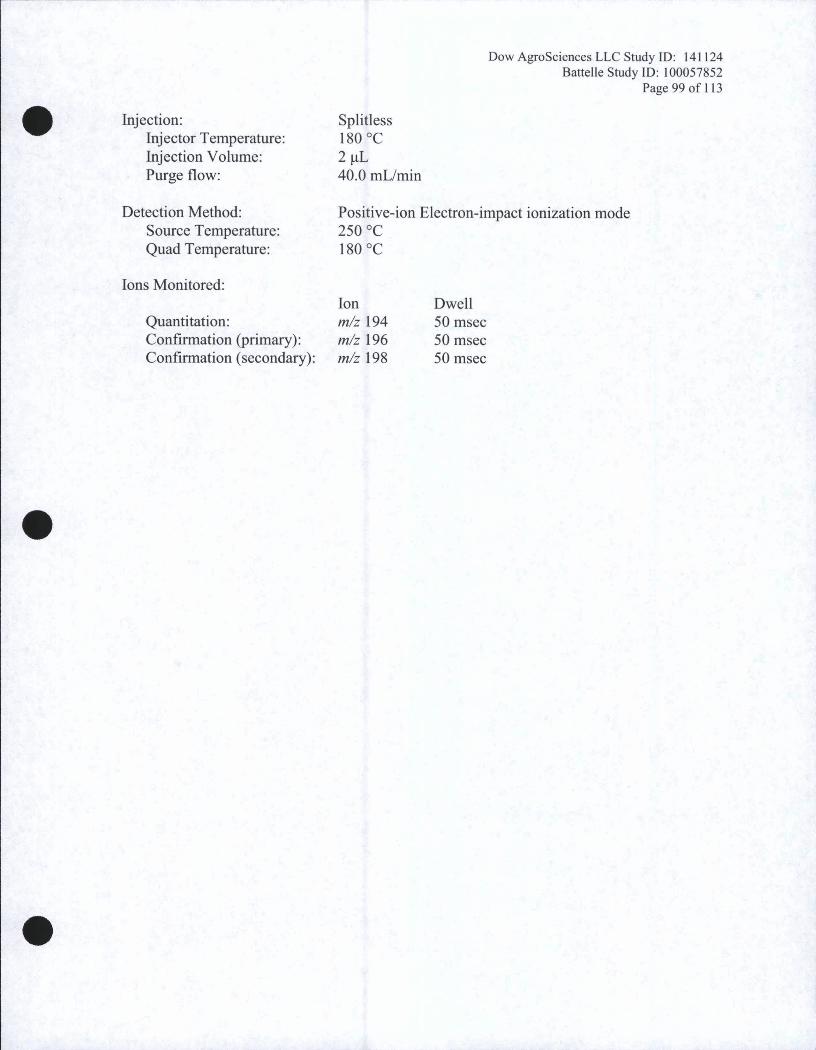
• Injection: Injector Temperature: Injection Volume: Purge flow:
Detection Method: Source Temperature: Quad Temperature:
Ions Monitored:
Quantitation: Confirmation (primary): Confirmation (secondary):
•
Splitless 180 °C 2 µL 40.0 mL/min
Positive-ion Electron-impact ionization mode 250 °C 180 °C
Ion Dwell m/z 194 50 msec m/z 196 50 msec mlz 198 50 msec
Page 99 of 113
•
Dow AgroSciences LLC Study ID: 141124 Battelle Study ID: l 00057852
• Page 101 of 113
Determination of 6-Chloropicolinic Acid (6-CPA) in Water by Liquid Chromatography with Tandem Mass Spectrometry Detection
Note: the method described herein was modified from EPL-BAS Method No. 205G907B Draft 11/25/14 to account for differences in differences in laboratory equipment or instrumentation. Changes to both methods provided by the sponsor are described in the "Changes to Method" section.
Method Summary:
6-CPA is extracted from water samples (20 mL) by C18 solid-phase extraction (SPE). 6-CPA is eluted from the SPE cartridge with acetonitrile. The acetonitrile eluate is evaporated to dryness . The dried residues are dissolved in 25/75 (v/v) methanol/DI water and submitted for liquid chromatography-tandem mass spectrometry analysis. The limit of quantitation for 6-CP A in water is 0.05 µg/L. The limit of detection is 0.015 µg/L.
Reference Substance and Reference Substance Solutions
• Volumes given may be adjusted as necessary as long as proportionality is maintained. Additional working and calibration standard concentrations may be used as needed.
Stock Standard Solution, 1,000 µg/mL
A stock solution of 6-CPA is prepared at a target concentration of 1,000 µg/rnL. Weigh 0.010 g of the neat reference substance into a 10 mL volumetric flask and dilute to volume with methanol.
Working Standard Solution, 10 µg/mL
Pi pet 0.1 rnL of the 1,000 µg/mL stock solution into a 10 rnL volumetric flask and bring to volume with methanol. Maintain refrigerated up to 365 days when not needed in the laboratory.
Working/Fortification Standard Solution, 1 µg/mL (1,000 ng/mL)
Pipet 1 rnL of the 1,000 µg/mL stock solution into a 10 mL volumetric flask and bring to volume with methanol. Maintain refrigerated up to 365 days when not needed in the laboratory.
Common Name 6-Chloropicolinic acid ( 6-CP A) CAS Number 4684-94-0
Purity(%) >95 Storage Conditions Ambient
• Fortification Standard Solution, 0.1 µg/mL (100 ng/mL)
Dow AgroSciences LLC Study ID: 141124 Battelle Study ID: I 00057852
• Page 102 of 113
Pipet 0.1 mL of the 10 µg/mL working solution into a 10 mL volumetric flask and bring to volume with methanol. Maintain refrigerated up to 365 days when not needed in the laboratory.
Fortification Standard Solution, 0. 03 µg/mL (30 ng/mL)
Pipet 0.3 mL of the l µg/mL working solution into a 10 mL volumetric flask and bring to volume with methanol. Maintain refrigerated up to 365 days when not needed in the laboratory.
Calibration Standard Solution, 100 nglmL
Pi pet 0.1 mL of the 10 µg/mL working solution into a 10 mL volumetric flask and bring to volume with 25/75 (v/v) methanol/DI water. Maintain refrigerated up to 365 days when not needed in the laboratory.
Calibration Standard Solution, 50 ng/mL
Pipet 0.05 mL of the 10 µg/mL working solution into a 10 mL volumetric flask and bring to volume with 25/75 (v/v) methanol/DI water. Maintain refrigerated up to 365 days when not needed in the laboratory.
Calibration Standard Solution, 10 ng/mL
• Pipet 0.1 mL of the 1 µg/mL working solution into a 10 mL volumetric flask and bring to volume with 25/75 (v/v) methanol/DI water. Maintain refrigerated up to 365 days when not needed in the laboratory.
Calibration Standard Solution, 5 ng/mL
Pipet 0.05 mL of the 1 µg/mL working solution into a 10 mL volumetric flask and bring to volume with 25/75 (v/v) methanol/DI water. Maintain refrigerated up to 365 days when not needed in the laboratory.
Calibration Standard Solution, 2 ng/mL
Pi pet 0.2 mL of the 0.1 µg/mL working solution into a 10 mL volumetric flask and bring to volume with 25/75 (v/v) methanol/DI water. Maintain refrigerated up to 365 days when not needed in the laboratory.
Calibration Standard Solution, 1 ng/mL
Pipet 0.1 mL of the 0.1 µg/mL working solution into a 10 mL volumetric flask and bring to volume with 25/75 (v/v) methanol/DI water. Maintain refrigerated up to 365 days when not needed in the laboratory.
• Calibration Standard Solution, 0. 5 ng/mL
• Dow AgroSciences LLC Study ID: 141124
Battelle Study ID: I 00057852 Page 103 of 113
Pipet 0.05 mL of the 0.1 µg/mL working solution into a 10 mL volumetric flask and bring to volume with 25/75 (v/v) methanol/DI water. Maintain refrigerated up to 365 days when not needed in the laboratory
Reagents and Reagent Solutions
A. Reagents
Acetic acid, glacial, reagent grade Acetonitrile, HPLC grade Methanol, HPLC grade Milli-Q filtered water Hydrochloric acid, concentrated (36.5-38.0%), reagent grade (used to prepare IN and O. lN HCl below)
I .ON Hydrochloric acid, prepared internally O. lN Hydrochloric acid, prepared internally
B. Reagent Solutions
IN Hydrochloric Acid
Fill a 1000 mL volumetric flask most of the way with Milli-Q water. Add 42.5 mL of concentrated hydrochloric acid and bring to volume with water. Mix well. The solution is stored ambient for up to 365 days.
0.1N Hydrochloric Acid
Fill a 1000 mL volumetric flask partially with Milli-Q water. Add 100 mL of lN hydrochloric acid, bring to volume with water, and mix well. The solution is stored ambient for up to 365 days.
•
25/75 (v/v) Methanol/DI Water
Combine 250 mL of methanol with 750 mL of DI water. The solution is stored ambient for up to 365 days.
0.01% (v/v) Acetic Acid
Pipet 0.1 mL of glacial acetic acid into 1,000 mL of DI water and mix. The solution is stored ambient for up to 180 days.
Laboratory Equipment
Balance, analytical, capable of weighing to the nearest 0.01 mg •
Dow AgroSciences LLC Study ID: 141124 Battelle Study ID: 100057852
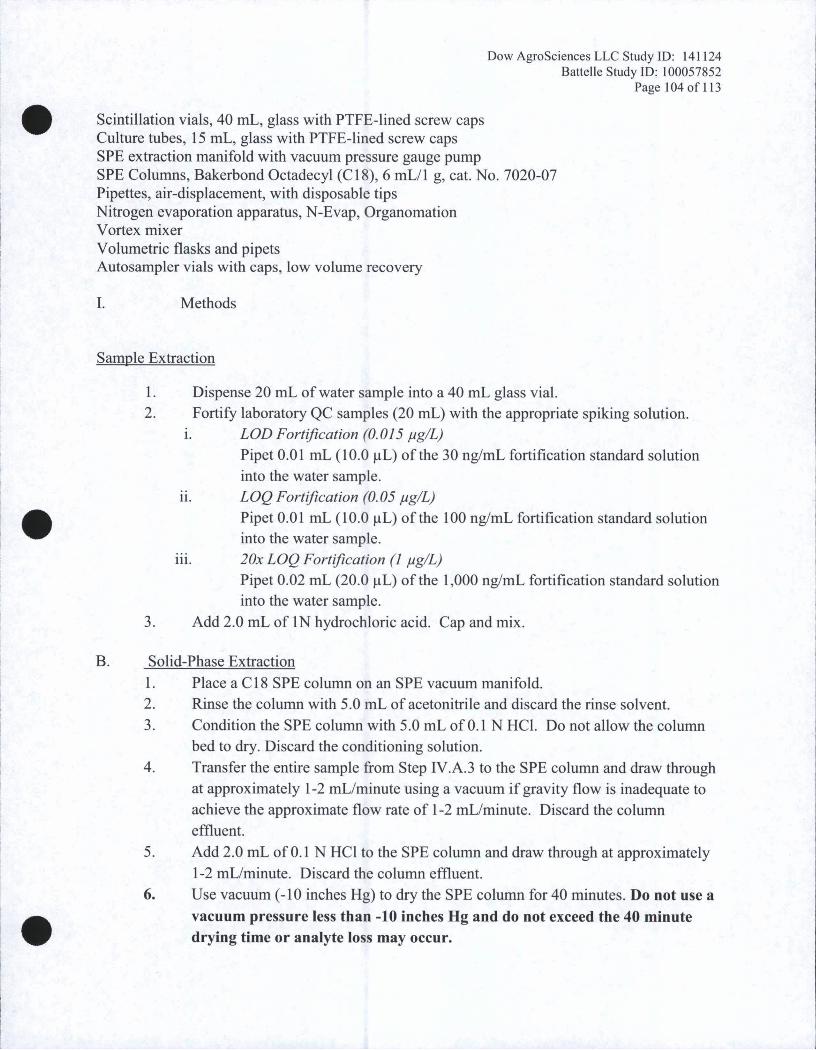
• Scintillation vials, 40 mL, glass with PTFE-lined screw caps Culture tubes, 15 mL, glass with PTFE-lined screw caps SPE extraction manifold with vacuum pressure gauge pump SPE Columns, Bakerbond Octadecyl (C18), 6 mL/1 g, cat. No. 7020-07 Pipettes, air-displacement, with disposable tips Nitrogen evaporation apparatus, N-Evap, Organomation Vortex mixer Volumetric flasks and pipets Autosampler vials with caps, low volume recovery
I. Methods
Sample Extraction
1. Dispense 20 mL of water sample into a 40 mL glass vial. 2. Fortify laboratory QC samples (20 mL) with the appropriate spiking solution.
1. LOD Fortification (0.015 µg/L)
Pipet 0.01 mL (10.0 µL) of the 30 ng/mL fortification standard solution into the water sample.
• 11. LOQ Fortification (0.05 µg/L)
Pipet 0.01 mL (10.0 µL) of the 100 ng/mL fortification standard solution into the water sample.
111. 20x LOQ Fortification (I µg/L)
Pipet 0.02 mL (20.0 µL) of the 1,000 ng/mL fortification standard solution into the water sample.
Page 104 of l 13
3. Add 2.0 mL of IN hydrochloric acid. Cap and mix.
B. Solid-Phase Extraction
1. Place a Cl8 SPE column on an SPE vacuum manifold. 2. Rinse the column with 5.0 mL of acetonitrile and discard the rinse solvent. 3. Condition the SPE column with 5.0 mL ofO.l N HCl. Do not allow the column
bed to dry. Discard the conditioning solution. 4. Transfer the entire sample from Step IV.A.3 to the SPE column and draw through
at approximately 1-2 mL/minute using a vacuum if gravity flow is inadequate to achieve the approximate flow rate of 1-2 mL/minute. Discard the column effluent.
5. Add 2.0 mL of 0.1 N HCl to the SPE column and draw through at approximately 1-2 mL/minute. Discard the column effluent.
• 6. Use vacuum (-10 inches Hg) to dry the SPE column for 40 minutes. Do not use a
vacuum pressure less than -10 inches Hg and do not exceed the 40 minute drying time or analyte loss may occur.
Dow AgroSciences LLC Study ID: 141124 Battelle Study ID: I 00057852
• Page 105 of 113
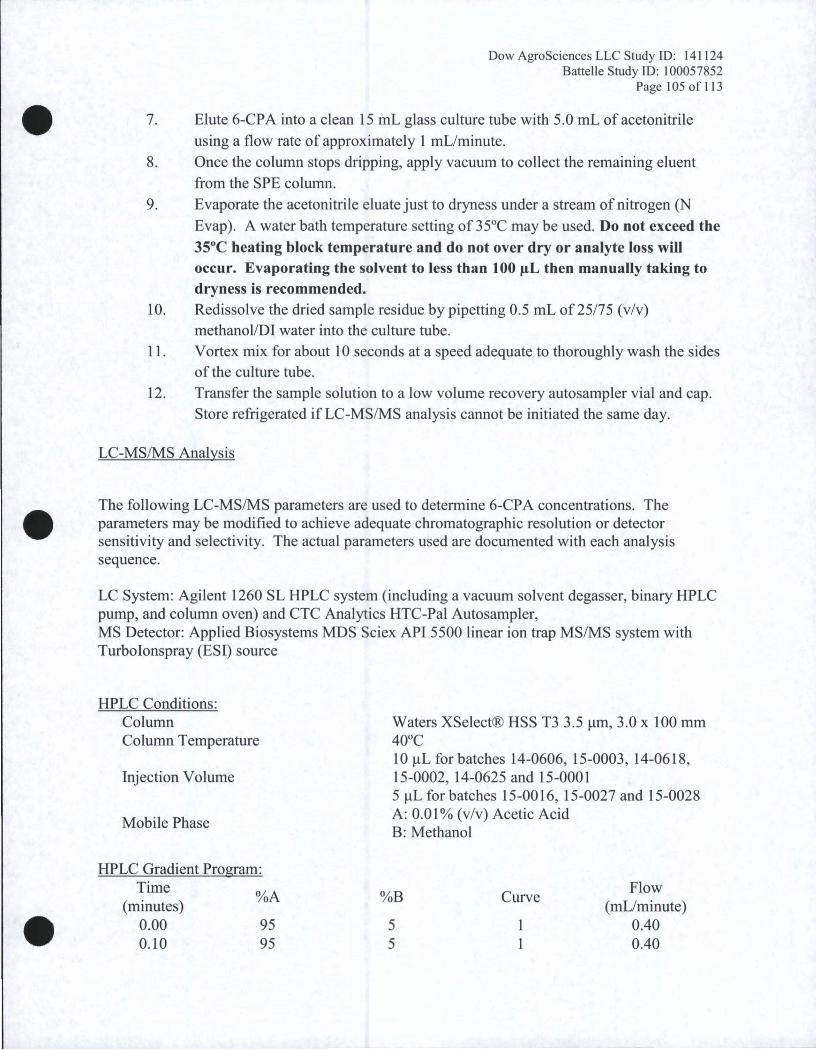
Elute 6-CPA into a clean 15 mL glass culture tube with 5.0 mL of acetonitrile
using a flow rate of approximately 1 mL/minute.
Once the column stops dripping, apply vacuum to collect the remaining eluent
from the SPE column.
9. Evaporate the acetonitrile eluate just to dryness under a stream of nitrogen (N
Evap). A water bath temperature setting of 35°C may be used. Do not exceed the 35°C heating block temperature and do not over dry or analyte loss will occur. Evaporating the solvent to less than 100 µL then manually taking to dryness is recommended.
10. Redissolve the dried sample residue by pipetting 0.5 mL of 25/75 (v/v) methanol/DI water into the culture tube.
11. Vortex mix for about 10 seconds at a speed adequate to thoroughly wash the sides of the culture tube.
12. Transfer the sample solution to a low volume recovery autosampler vial and cap.
Store refrigerated if LC-MS/MS analysis cannot be initiated the same day.
LC-MS/MS Analysis
7.
8.
• The following LC-MS/MS parameters are used to determine 6-CP A concentrations. The parameters may be modified to achieve adequate chromatographic resolution or detector sensitivity and selectivity. The actual parameters used are documented with each analysis sequence.
LC System: Agilent 1260 SL HPLC system (including a vacuum solvent degasser, binary HPLC pump, and column oven) and CTC Analytics HTC-Pal Autosampler, MS Detector: Applied Biosystems MDS Sciex API 5500 linear ion trap MS/MS system with Turbolonspray (ESI) source
HPLC Conditions: Column Waters XSelect® HSS T3 3.5 µm, 3.0 x 100 mm Column Temperature 40°c
10 µL for batches 14-0606, 15-0003, 14-0618, Injection Volume 15-0002, 14-0625 and 15-0001
5 µL for batches 15-0016, 15-0027 and 15-0028 A: 0.01 % (v/v) Acetic Acid
Mobile Phase B: Methanol
HPLC Gradient Program: Time Flow
• %A %B Curve
(minutes) (mL/minute) 0.00 95 5 1 0.40 0.10 95 5 1 0.40
Dow AgroSciences LLC Study ID: 141124 Battelle Study ID: I 00057852
Page 106 of 113
0.40 0.40 0.40 0.40 0.40 0.40
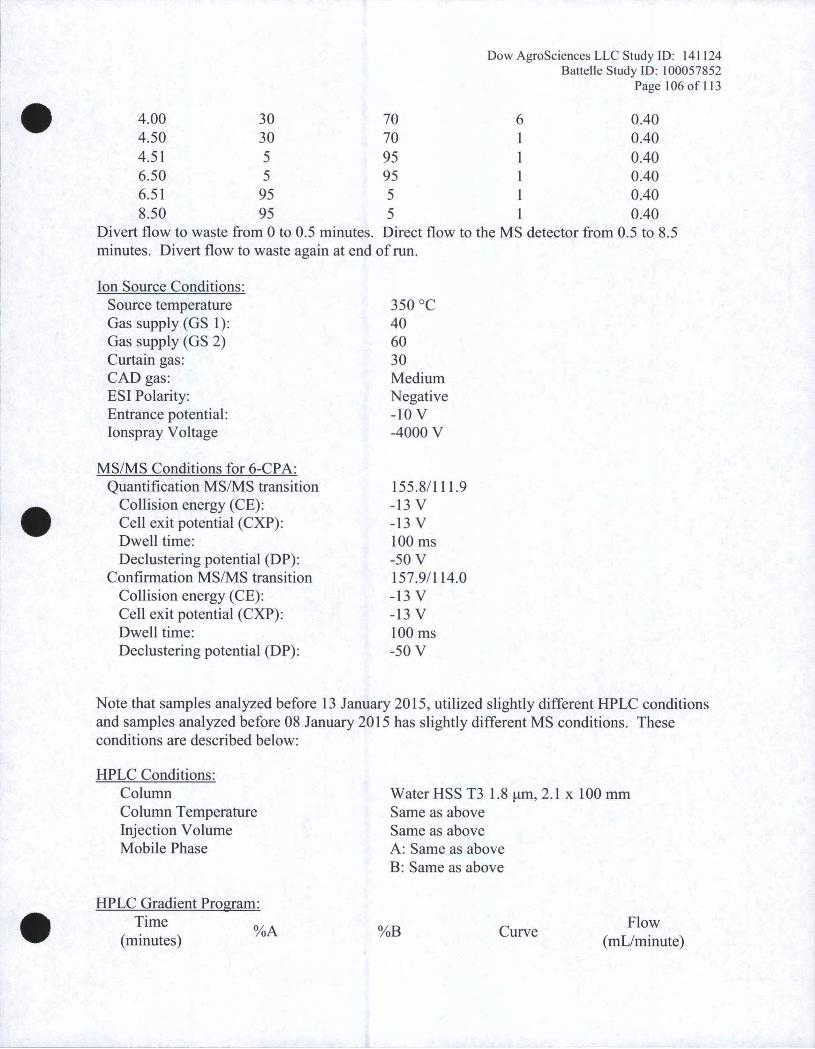
• 4.00 30 70 6 4.50 30 70 1 4.51 5 95 1 6.50 5 95 1 6.51 95 5 1 8.50 95 5 1
Divert flow to waste from Oto 0.5 minutes. Direct flow to the MS detector from 0.5 to 8.5 minutes. Divert flow to waste again at end of run.
Ion Source Conditions: Source temperature Gas supply (GS 1): Gas supply (GS 2) Curtain gas: CAD gas: ESI Polarity: Entrance potential: Ionspray Voltage
MS/MS Conditions for 6-CPA: Quantification MS/MS transition
Collision energy (CE): Cell exit potential (CXP): Dwell time: Declustering potential (DP):
Confirmation MS/MS transition Collision energy (CE): Cell exit potential (CXP): Dwell time: Declustering potential (DP):
Note that samples analyzed before 13 January 2015 , utilized slightly different HPLC conditions and samples analyzed before 08 January 2015 has slightly different MS conditions. These conditions are described below:
HPLC Conditions: Column Column Temperature Injection Volume Mobile Phase
Water HSS T3 1.8 µm , 2.1 x 100 mm Same as above Same as above A: Same as above B: Same as above
• HPLC Gradient Program:
Time Flow%A %B Curve
(minutes) (mL/minute)
350 °C 40 60 30 Medium Negative -10 V -4000 V
155.8/ 111.9 -13 V -13 V 100 ms -50 V 157.9/ 114.0 -13 V -13 V 100 ms -50 V
•
Dow AgroSciences LLC Study ID: 141124 Battelle Study ID: l 00057852
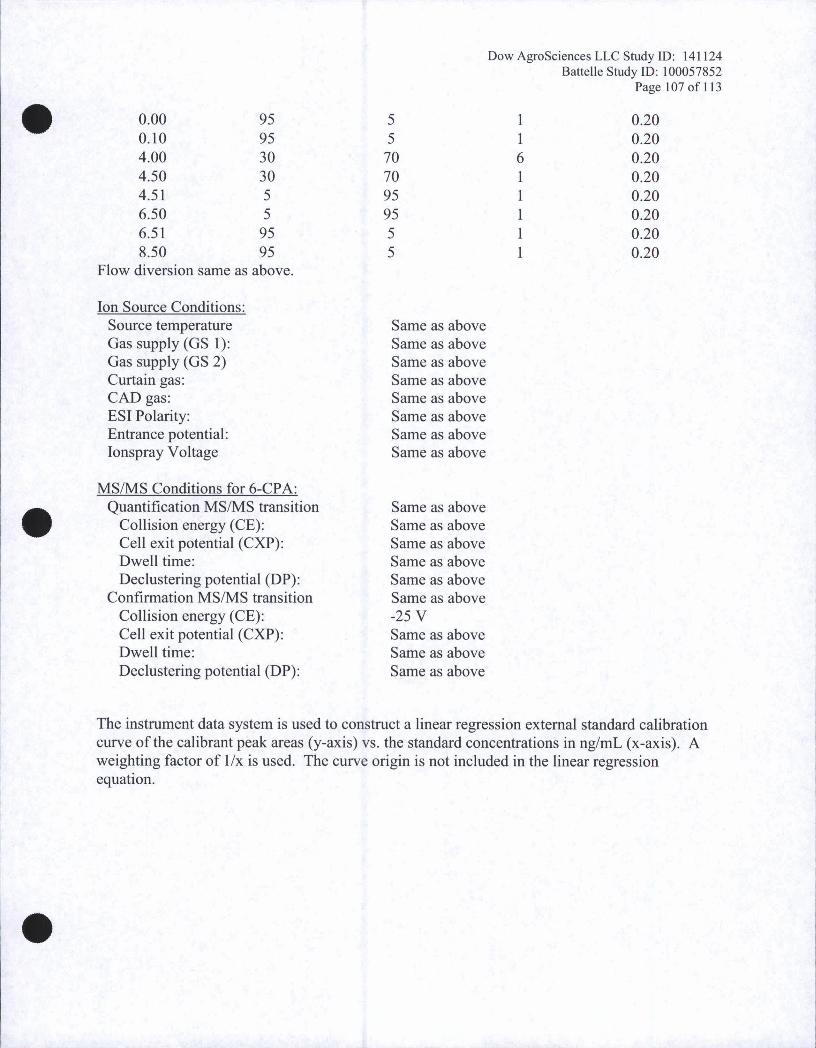
Flow diversion same as above.
Ion Source Conditions: Source temperature Gas supply (GS 1): Gas supply (GS 2) Curtain gas: CAD gas: ESI Polarity: Entrance potential: Ionspray Voltage
MS/MS Conditions for 6-CP A: Quantification MS/MS transition
Collision energy (CE): Cell exit potential (CXP): Dwell time: Declustering potential (DP):
Confirmation MS/MS transition Collision energy (CE): Cell exit potential (CXP): Dwell time: Declustering potential (DP):
5 5
70 70 95 95 5 5
1 1 6 1 1 1 1 1
Same as above Same as above Same as above Same as above Same as above Same as above Same as above Same as above
Same as above Same as above Same as above Same as above Same as above Same as above -25 V Same as above Same as above Same as above
Page 107 of 113
0.20 0.20 0.20 0.20 0.20 0.20 0.20 0.20
•
•
0.00 95 0.10 95 4.00 30 4.50 30 4.51 5 6.50 5 6.51 95 8.50 95
The instrument data system is used to construct a linear regression external standard calibration curve of the calibrant peak areas (y-axis) vs. the standard concentrations in ng/mL (x-axis). A weighting factor of 1/x is used. The curve origin is not included in the linear regression equation .
•