Embed Size (px)
Citation preview

March 4, 2008
U.S. EPA’s Vapor Intrusion Database: Preliminary Evaluation of Attenuation Factors
Office of Solid Waste U.S. Environmental Protection Agency
Washington, DC 20460

[This page intentionally left blank.]

DISCLAIMER
This draft is distributed solely for the purpose of pre-dissemination peer review. The findings and conclusions should not be construed to represent any Agency determination or policy. Mention of trade names or commercial products does not constitute endorsement or recommendation for use.

[This page intentionally left blank.]

March 4, 2008 Table of Contents
The findings and conclusions in this report have not been formally disseminated by EPA and should not be construed to represent any Agency determination or policy.
iii
Table of Contents 1.0 Introduction......................................................................................................................... 1
2.0 Database Development ....................................................................................................... 2
3.0 Database Structure .............................................................................................................. 3
4.0 Database Contents............................................................................................................... 3
5.0 Database Evaluation Considerations................................................................................... 4 5.1 Data Quality ............................................................................................................... 4 5.2 Handling Data Below Reporting Limits .................................................................... 5 5.3 Differences in Site Conditions and Data.................................................................... 6 5.4 Spatial and Temporal Variability............................................................................... 7 5.5 Background Indoor Air Concentrations..................................................................... 8
6.0 Statistical Analysis of Attenuation Factors....................................................................... 10 6.1 Groundwater-to-Indoor-Air Attenuation Factors..................................................... 11 6.2 Soil-Gas-to-Indoor-Air Attenuation Factors............................................................ 12 6.3 Subslab-to-Indoor-Air Attenuation Factors ............................................................. 12 6.4 Crawlspace-to-Indoor-Air Attenuation Factors ....................................................... 13
7.0 Summary and Conclusions ............................................................................................... 13
8.0 Future Research ................................................................................................................ 15
9.0 References......................................................................................................................... 15
Attachment A – Vapor Intrusion Access Database Design Documents
Attachment B – Vapor Intrusion Spreadsheet Documentation
Attachment C – Vapor Intrusion Database Site Information

March 4, 2008 Table of Contents
The findings and conclusions in this report have not been formally disseminated by EPA and should not be construed to represent any Agency determination or policy.
iv
List of Tables [note that the tables are all at the end of the text]
1 Summary of Changes in EPA’s Vapor Intrusion Database Between 2002 and
2008....................................................................................................................................16 2 Summary of Information in EPA’s Vapor Intrusion Database..........................................17 3 Summary of Attenuation Factors Remaining After Each Successive Data
Screening Step ...................................................................................................................20 4a Background Indoor Air Concentrations Measured in North American Residences
Since 1990 and Indoor Air Concentrations in Residences Included in EPA’s Vapor Intrusion Database ..................................................................................................21
4b Background Indoor Air Concentrations Measured in North American Residences Since 1990 and Indoor Air Concentrations in Residences Included in EPA’s Vapor Intrusion Database ..................................................................................................22
List of Figures [note that the figures are all at the end of the text, following the tables]
1 Soil gas vs. subslab concentrations for buildings with both types of data in EPA’s
2008 vapor intrusion database. ..........................................................................................23 2 Box-and-whisker plot of selected background indoor air concentrations in North
American residences sampled since 1990 and indoor air concentrations in residences included in EPA’s vapor intrusion database ....................................................24
3 Empirical attenuation factors for individual chemicals in two buildings at the Endicott Site, NY. ..............................................................................................................24
4 Indoor air versus groundwater concentrations...................................................................25 5 Cumulative percentile plots of groundwater-to-indoor-air attenuation factors. ................26 6 Summary statistics for groundwater-to-indoor-air attenuation factors..............................27 7 Indoor air versus soil gas concentrations. ..........................................................................28 8 Cumulative percentile plots of soil-gas-to-indoor-air attenuation factors. ........................29 9 Summary statistics for soil-gas-to-indoor-air attenuation factors......................................30 10 Indoor air versus subslab concentrations. ..........................................................................31 11 Cumulative percentile plots of subslab-to-indoor-air attenuation factors..........................32 12 Summary statistics for subslab-to-indoor-air attenuation factors. .....................................33 13 Indoor air versus crawlspace concentrations. ....................................................................34 14 Cumulative percentile plots of crawlspace-to-indoor-air attenuation factors....................35 15 Summary statistics for crawlspace-to-indoor-air attenuation factors. ...............................36 16 Attenuation factor distributions for groundwater, soil gas, subslab, and crawlspace
data in Data Set 1 (2008). ..................................................................................................37

March 4, 2008 U.S. EPA’s Vapor Intrusion Database
The findings and conclusions in this report have not been formally disseminated by EPA and should not be construed to represent any Agency determination or policy.
1
1.0 Introduction
In 2002, the U.S. Environmental Protection Agency (EPA) issued draft vapor intrusion guidance (Draft Guidance for Evaluating the Vapor Intrusion to Indoor Air Pathway from Groundwater and Soils; U.S. EPA, 2002) that was based on the understanding of vapor intrusion at that time. A critical piece of that document, the generic attenuation values used for Tier 2 screening of concentrations in subsurface media, was based on a statistical analysis of a limited number of observations from a few sites (see U.S. EPA, 2002, Appendix F). Since 2002, EPA has been collecting additional observations from vapor intrusion sites to improve our knowledge and understanding of vapor intrusion, and in particular, the attenuation of vapors between the subsurface and indoor air. More specifically, EPA has designed, developed, and managed a database to store and analyze data collected at vapor intrusion sites. This report provides updated information about the database (i.e., design, structure, and content) and some example analyses using data from the database that could be useful for regulators, responsible parties, and others assessing and managing vapor intrusion investigation programs.1
Vapor attenuation occurs as a result of the processes that control vapor transport in soil (e.g., diffusion, advection, sorption, transformation reactions) coupled with the dilution that occurs when the vapors enter a building and mix with indoor air (Johnson and Ettinger, 1991). The sum of these physical and chemical attenuation mechanisms can be quantified through the use of a vapor intrusion attenuation factor (AFVI), which is defined as the ratio of the indoor air concentration arising from vapor intrusion (CIA-VI) to the subsurface vapor concentration (CSV) at a point or depth of interest in the vapor intrusion pathway:
SV
VIIAVI C
CAF −= Equation 1
At a conceptual level, the attenuation factor definition is simple. However, the process by which vapors migrate to and into buildings is complex, is dependent on site-specific conditions, and can vary over time and space. In particular, the spatial and temporal variability in observed subsurface and indoor air concentrations among buildings and within buildings mean that for every site and every structure at a site, a range of empirical attenuation factors would likely be calculated from a series of discrete indoor air and subsurface vapor concentrations measured at different points in space or at different times. Considering this variability, a statistical approach to characterizing the empirical attenuation factors was adopted in the 2002 guidance and continues to be used in this report.
Subsurface vapor concentrations may be measured directly under a building (often called subslab), measured exterior to a building at varying depths in the unsaturated zone (called soil gas), or derived from groundwater concentrations by converting the dissolved concentration to a
1 This study was conducted by the U.S. Environmental Protection Agency’s Vapor Intrusion Workgroup for the Office of Solid Waste and Emergency Response. The primary investigator and author of the report was Helen Dawson (U.S. EPA, Region 8, Denver, CO), with contributions from several members of the Vapor Intrusion Workgroup, including Henry Schuver (U.S. EPA, Office of Solid Waste, Washington DC) and William Wertz (New York State Department of Environmental Conservation, NY, USA).
March 4, 2008 U.S. EPA’s Vapor Intrusion Database
The findings and conclusions in this report have not been formally disseminated by EPA and should not be construed to represent any Agency determination or policy.
2
vapor concentration assuming equilibrium conditions (i.e., by multiplying the groundwater concentration by the chemical’s dimensionless Henry’s law constant). Subfloor vapor concentrations may also be measured in building crawlspaces. Although crawlspace samples are not considered subsurface samples, they represent the vapor concentration underlying a building’s living space. Thus, crawlspace samples may be evaluated in a manner similar to subsurface vapor samples.
Indoor air in most buildings will contain detectable levels of organic compounds whether or not the building overlies a subsurface source of vapors (see, for example, U.S. EPA, 2008), because there are numerous potential indoor sources (often called background sources) of these compounds (e.g., consumer products, building materials, combustion sources). Thus, evaluation of empirical attenuation factors should consider the potential contribution of background sources to indoor air concentrations and the potential impact of these background sources on the distribution of attenuation factors.
The following sections describe the development of the database, its structure and contents, the issues to consider when using vapor intrusion data, and a preliminary evaluation of the attenuation factors calculated from data in the database.
2.0 Database Development
Shortly after the 2002 draft guidance was released, EPA initiated efforts to improve the 2002 vapor intrusion database by adding sites and additional site-related information to better represent vapor intrusion in a broader cross-section of the country. In 2003, EPA met with a team of experts and state regulators to lay out the content, design, and quality assurance requirements for the database. Information fields were added to capture important site information, such as geologic setting, soil characteristics, foundation type, and other building characteristics, as well as more detailed information on the sampling and analysis. The number of fields has been significantly expanded relative to the 2002 database.
Also, starting in 2003, EPA held a series of national workshops to provide investigators across the country a forum to share data and experiences from a variety of vapor intrusion sites. Data were gathered from consultants and state regulators, and also through EPA’s Regional offices.
As a result of these efforts, EPA has significantly expanded the database—from 4 states to 15, from 15 sites to 41, from 73 buildings to 913, and from 408 paired measurements of subsurface and indoor air concentrations to 2,989. Table 12 shows the increase in number of sites, buildings, and calculated attenuation factors in the vapor intrusion database from 2002 to 2008 for the four types of attenuation factors—groundwater-to-indoor-air, soil-gas-to-indoor-air, subslab-to-indoor-air, and crawlspace-to-indoor-air—in the database. As in 2002, most of the sites in the current database are sites where the vapor source beneath a building is groundwater contaminated with chlorinated solvents.3 The most notable increase in data between 2002 and 2008 was for subslab data, which increased from 1 site to 15, from 9 buildings to 424, and from
2 All tables and figures are provided at the end of the report, followed by Attachments A, B, and C. 3 Chlorinated hydrocarbons (CHC) such as trichloroethene (TCE) or perchloroethylene (PCE)

March 4, 2008 U.S. EPA’s Vapor Intrusion Database
The findings and conclusions in this report have not been formally disseminated by EPA and should not be construed to represent any Agency determination or policy.
3
86 calculated attenuation factors to 1,584, but the data sets for all types of data were substantially increased.
3.0 Database Structure
EPA’s vapor intrusion database currently is compiled in two formats: a Microsoft Access database and a Microsoft Excel spreadsheet. The relational structure and data dictionary for the Access database are provided in Attachment A. The Excel spreadsheet was designed to facilitate calculation, evaluation, analysis, and presentation of the attenuation factors in the vapor intrusion database, and was used to perform the analyses described in this report. The data in the spreadsheet can be screened on the basis of site characteristics, chemicals analyzed, and data quality parameters. Graphs are linked to the data to allow the user to view the effects of screening and to visually evaluate the relationships between paired measurements for selected screening criteria. The spreadsheet includes a brief user’s guide, the chemical properties used in calculations, the background indoor air values used in the data evaluations, and a data dictionary. The user’s guide and data dictionary for the spreadsheet version are provided in Attachment B. The spreadsheet calculates and presents the following descriptive statistics for the attenuation factor distributions: percentiles (5th, 25th, 50th, 75th, and 95th), mean, standard deviation, and 95th percentile upper confidence level (UCL) about the mean. The statistics are generated using the Kaplan-Meier method, a robust non-parametric method described by Helsel (2005a) as appropriate for considering data below reporting limits, particularly when there are multiple reporting limits. For comparison, statistics calculated using the more common substitution method of dealing with data below reporting limits also are shown. The substitution statistics are calculated using Microsoft Excel’s statistical functions. The Kaplan-Meier statistics are generated using a spreadsheet provided by Helsel (2005a), which was expanded to include 5th and 95th percentile calculations and modified to enable its use within the vapor intrusion spreadsheet.
4.0 Database Contents
EPA’s vapor intrusion database currently contains indoor air measurements of volatile organic compounds (VOCs) paired with groundwater, soil gas, subslab, or crawlspace measurements for 913 buildings at 41 sites in 15 states. A substantial number of the buildings have multiple paired measurements (e.g., several chemicals may be reported for the same sample, multiple sampling events may be reported for the same building, or several types of subsurface samples may be paired with an indoor air measurement). As a result, the database contains 2,989 paired measurements, of which 35 percent are paired groundwater and indoor air measurements, 8 percent are paired soil gas and indoor air measurements, 53 percent are paired subslab and indoor air measurements, and 4 percent are paired crawlspace and indoor air measurements. The building types represented include residential (85 percent), institutional or commercial (10 percent), and multi-use (residential and non-residential) buildings (5 percent). Chlorinated and petroleum hydrocarbons are both included in the database, but petroleum hydrocarbons make up only 3 percent of the data set. The database does not currently include other compounds—such as semi-volatile organic compounds or mercury—that may also produce vapors that can potentially pose a risk to human health through vapor intrusion.

March 4, 2008 U.S. EPA’s Vapor Intrusion Database
The findings and conclusions in this report have not been formally disseminated by EPA and should not be construed to represent any Agency determination or policy.
4
The current database also includes site-specific information such as geologic setting, soil type, vapor source type (e.g., groundwater, soil, non-aqueous phase liquids in the unsaturated zone), building foundation type, and the vertical and horizontal distance between the building and vapor source. Table 2 summarizes the information contained in the database for individual sites, and Attachment C provides more detailed information for each site in the database.
5.0 Database Evaluation Considerations
Several factors were considered in evaluating the vapor intrusion data in EPA’s database:
# Data quality
# Handling of data reported below a given reporting limit
# Differences in site conditions and the types of data compiled
# Spatial and temporal variability in media concentrations
# Background indoor air concentrations.
Each of these factors can potentially influence attenuation factors calculated from the empirical data, and each is discussed in the following subsections.
5.1 Data Quality
Sampling design information was evaluated to ensure that appropriate methods were used to characterize the site (e.g., groundwater data was obtained from wells screened at or near the water table; soil gas samples were collected when an unsaturated zone vapor source was present). Vapor (indoor air and soil gas) analytical methods were reviewed to determine if the analyses were conducted according to U.S. EPA Methods (e.g., TO-14, TO-15, TO-17). Data with inappropriate sampling design or analytical methods were not included in the database.
The concurrency of paired subsurface vapor and indoor air data was also evaluated; concurrent was taken to mean within 48 hours for subslab and shallow soil gas data paired with indoor air data, within a week for paired deep soil gas (near the source) and indoor air data, and within a few weeks for paired groundwater and indoor air data. The longer time frames for the deeper vapor sources were used because these samples tend to exhibit less temporal variation. Non-concurrent data were not included in the database.
For the majority of the data in the database, sufficient information was available to evaluate data quality. For some sites, however, the sampling documentation was limited; these sites were nevertheless included provided appropriate analytical methods were used and the paired samples met the concurrency criteria.
To ensure accurate data transfer, data entry checks were performed on all the data, and the contributors of the original data were asked to review the data. Information regarding data quality for individual sites is provided in Attachment C.

March 4, 2008 U.S. EPA’s Vapor Intrusion Database
The findings and conclusions in this report have not been formally disseminated by EPA and should not be construed to represent any Agency determination or policy.
5
After removing data that did not meet the above criteria, there remained in the database 1,058 paired groundwater and indoor air concentrations, 237 paired soil gas and indoor air concentrations, 1,584 paired subslab and indoor air concentrations, and 110 paired crawlspace and indoor air concentrations (as shown in Table 3). This subset of data is referred to as the Data Quality Screen data set and comprises the baseline 2008 vapor intrusion database.
5.2 Handling Data Below Reporting Limits
Concentrations of chemicals less than a quantitative threshold limit may be reported as below a given reporting limit or as J-qualified data, which are detected concentrations less than the reporting limit and are estimated. In 2002, all such data were excluded from the statistical analysis of attenuation factors. For reasons described below, the indoor air concentrations with values less than reporting limits were considered in the statistical evaluations presented in this report, but subsurface concentrations below reporting limits were not.
The method most commonly used by environmental professionals to deal with data below reporting limits is to substitute some fraction (often one-half) of the reporting limit. Numerous EPA guidance documents recommend substituting one-half the reporting limit, particularly if less than 15 percent of the data set is below the reporting limit (e.g., U.S. EPA, 1998). However, studies by Helsel (2005b, 2006) and Singh et al. (2006) have shown that substitution of such fixed values may be problematic when the proportion of data below reporting limits is high, and may lead to biases in the calculated statistics.
Because a number of sites in the database have substantial proportions of the data reported as below a reporting limit (i.e., greater than 15 percent), and based on the findings of Helsel (2005b, 2006), we decided to use the Kaplan-Meier method described by Helsel (2005a) to estimate descriptive statistics. This method is a robust non-parametric method capable of considering data sets with substantial proportions of data below reporting limits, as well as multiple reporting limits and J-qualified values. The Kaplan-Meier method assigns a percentile value to each detected observation, starting at the largest value and working down, on the basis of the number of observations above and below that observation. Percentiles are not assigned to data that are below reporting limits, but these data affect the percentiles calculated for the observations that are above reporting limits.
EPA’s vapor intrusion database contains both subsurface and indoor air samples with concentrations reported as less than a laboratory’s given reporting limit. For all such data, the actual reporting limit was substituted in the concentration field, as recommended by Helsel (2005a), and the data were flagged as being below the reporting limit. Because data from multiple laboratories and various analytical methods are included in the database, reporting limits for any given chemical in the database may vary by more than an order of magnitude for a given sample media.
Indoor air concentrations below reporting limits (including J-qualified values) were included in the statistical evaluation of attenuation factors. These low-level indoor air concentrations were included because, when they occur in buildings overlying subsurface vapor sources, they are considered to represent cases where significant attenuation is occurring along the vapor intrusion pathway, and the corresponding attenuation factor is very low. Exclusion of

March 4, 2008 U.S. EPA’s Vapor Intrusion Database
The findings and conclusions in this report have not been formally disseminated by EPA and should not be construed to represent any Agency determination or policy.
6
these data would unnecessarily bias the attenuation factor distributions upwards (i.e., towards higher-valued, more conservative attenuation factors). Attenuation factors based on indoor air concentrations below reporting limits were treated in the same way as concentrations below reporting limits when calculating statistics: they were flagged as being below the calculated attenuation factor and statistically analyzed using the Kaplan-Meier method. An exception was made for cases where attenuation factors calculated from below-reporting-limit indoor air concentrations were greater than the highest attenuation factor calculated from detected indoor air concentrations at a site or in a building; these anomalously high attenuation factors were flagged and excluded from further analysis.
Subsurface samples with concentrations less than the reporting limit were flagged (but not removed from the database) and excluded from further analysis. Such low-level subsurface concentrations were considered to represent cases where the chemical either is not present in the subsurface under a building or is present at levels unlikely to pose a health risk via the vapor intrusion pathway. Nevertheless, the same chemical may be present in the indoor air of an overlying building due to background indoor sources, which would lead to an artificially high attenuation factor. Thus, subsurface concentrations less than reporting limits were not used to calculate attenuation factors. These samples represent 3 percent of the groundwater data, 5 percent of the soil gas data, and 2 percent of the subslab data; none of the crawlspace samples in the database had concentrations less than reporting limits. After this screening was applied to the Data Quality Screen data set, there remained 1,026 paired groundwater and indoor air concentrations, 226 paired soil gas and indoor air concentrations, 1,553 paired subslab and indoor air concentrations, and 110 paired crawlspace and indoor air concentrations (as shown in Table 3). This subset of data is referred to as the Subsurface Concentration Screen data set.
5.3 Differences in Site Conditions and Data
EPA’s vapor intrusion database contains a range of site conditions and types of data. At some sites, the source of vapors is groundwater, while at other sites the vapor source is contaminated soil. Some sites include information only from residential settings, while others include information from commercial settings, and a few include information from both. At some sites, the indoor air measurements are paired only with groundwater measurements, while at other sites the indoor air measurements are paired only with soil gas measurements. Approximately half of the sites (21 out of 41) have more than one type of paired data.
The number of buildings sampled at individual sites ranges from one to hundreds of buildings. Of the 41 sites in the database, 31 have fewer than 10 sampled buildings, 8 sites have between 10 and 50 sampled buildings, and 2 sites (Redfield and Endicott) have more than 200 sampled buildings. As a consequence, a relatively high percentage of data points come from a small group of sites (see Table 2).
In some cases, electronic data were available and the entire data set for a site was entered into the database. In other cases, only site reports and maps with plotted concentrations were available, from which a select subset of data, typically from the highest concentration areas, were entered. Consequently, some sites include all reported measurements for all detected chemicals, which can facilitate evaluation of attenuation factors, while other sites include only a partial set of measurements for a single chemical.

March 4, 2008 U.S. EPA’s Vapor Intrusion Database
The findings and conclusions in this report have not been formally disseminated by EPA and should not be construed to represent any Agency determination or policy.
7
These differences in site conditions and types of data should be considered when evaluating statistics generated from combined sets of site data. Because the number of sites and types of sites included in the database has been substantially expanded since the 2002 database, these differences lead to expanded ranges in the attenuation factor distributions for the combined site data sets.
5.4 Spatial and Temporal Variability
Spatial and temporal variability in concentrations for each media contribute to the variability of the empirically derived attenuation factors.
Groundwater concentrations typically are not measured directly below buildings. In some cases, interpolated values are used; in other cases, the value of the nearest sample is used. The result is the possible introduction of high or low bias in concentration when a nearby or interpolated value does not accurately represent conditions under the building. Interpolation of groundwater concentrations underlying buildings is particularly difficult when steep concentration gradients are present. Additional variability may be introduced by varying groundwater well-screen lengths and sampling depths and by temporal variability in groundwater concentrations.
Soil gas concentrations (measured exterior to buildings) can exhibit substantial spatial and temporal variability. For example, EPA’s vapor intrusion database shows that soil gas concentrations sampled on all four sides of buildings at the Grants Site, NM, may differ by up to three orders of magnitude, and soil gas data for the Endicott Site, NY, exhibit temporal variability on the order of one order of magnitude. The spatial variability can be attributed to heterogeneity in soil types and soil properties, and the temporal variability can be attributed to daily and seasonal variations in climatic conditions. Sample collection issues also can influence soil gas concentrations.
Subslab concentrations may also exhibit considerable spatial and temporal variability. Information in the database for the Lowry Air Force Base shows that subslab samples collected from adjacent homes may differ by more than three orders of magnitude, and subslab samples collected every two months for a year in individual buildings may exhibit temporal variability ranging up to one order of magnitude.
There also can be significant differences between subslab concentrations and soil gas concentrations taken exterior to and at approximately the same depth as the base of the building. For example, there are eight sites with a total of 113 buildings in EPA’s vapor intrusion database for which concentrations were measured in both subslab (beneath the building foundation) and soil gas (exterior to the building) samples. At five of these sites (which have a total of 83 buildings), the subslab concentrations exceed the measured soil gas concentrations at 30 of the 83 buildings (36 percent) (see Figure 1). Thus, soil gas concentrations measured exterior to a building may not be representative of soil gas concentrations measured directly beneath the building foundation (i.e., subslab). The bias introduced by these factors may be high or low depending on climatic and building conditions and the extent to which the samples accurately represent the spatial and temporal variability of concentrations under the building.

March 4, 2008 U.S. EPA’s Vapor Intrusion Database
The findings and conclusions in this report have not been formally disseminated by EPA and should not be construed to represent any Agency determination or policy.
8
Indoor air concentrations also can exhibit considerable spatial and temporal variability. Information in the database for many sites shows that indoor air concentrations measured during the same time span in adjacent buildings at a site can vary by one or two orders of magnitude. Variations in indoor air concentrations may not correlate with the variations in soil gas or subslab concentrations, likely due to differences in building construction, ventilation, and occupant habits.
Because of the variability exhibited by individual media, attenuation factors calculated from pairs of individual media will likely exhibit even greater variability.
5.5 Background Indoor Air Concentrations
Most volatile chemicals of potential concern at contaminated sites are also found indoors due to sources unrelated to subsurface contamination. These sources may include emissions from consumer products, home furnishings, building materials, combustion sources, and outdoor sources. Contributions of volatile chemicals from sources other than vapor intrusion are considered to be “background.” Thus, to determine the extent to which vapor intrusion impacts indoor air concentrations, it is appropriate to consider the contributions of background sources to the indoor air concentrations.
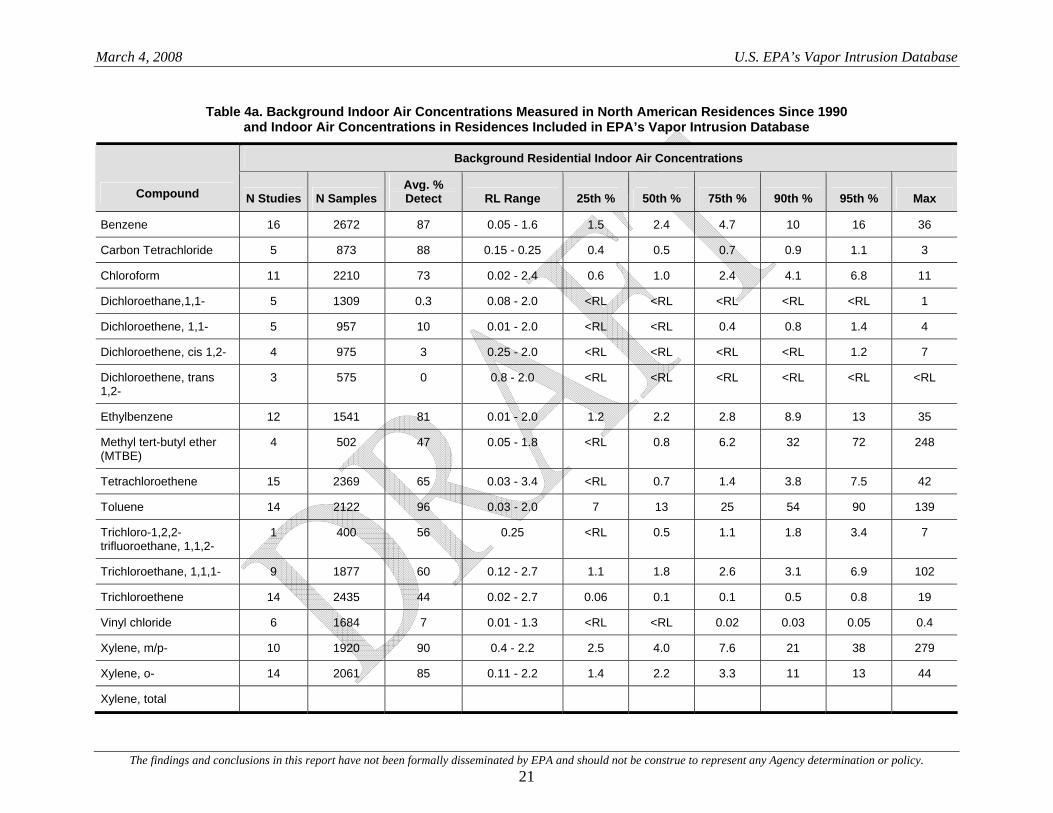
Table 4 compares the measured indoor air concentrations in residences at vapor intrusion sites in the database to background indoor air concentrations obtained from a compilation of indoor air quality studies in North American residences (U.S. EPA, 2008). The background statistics presented in Table 4 are based on studies where samples were taken after 1990, because before 1990, background concentrations for many VOCs were typically higher. This comprehensive compilation of more recent indoor air quality studies was not available in 2002. Table 4 shows that for most chemicals—including tetrachloroethene; 1,1,1-trichloroethane; and the petroleum hydrocarbons—the indoor air concentrations at the vapor intrusion sites in the database are roughly equivalent in range to the background indoor air concentrations. Vapor intrusion evaluations of these chemicals are likely to yield empirical attenuation factors that are biased high (indicating less attenuation than is actually occurring) if the background concentrations in any given setting are equivalent to or higher than the concentrations due to vapor intrusion. For other chemicals—such as 1,1-dichloroethane; 1,1-dichloroethene; cis-1,2-dichloroethene; and trichloroethene—a substantial proportion of the indoor air concentrations at the vapor intrusion sites in EPA’s database tend to be higher than background. In fact, the background concentrations of these chemicals often are lower than the typical laboratory reporting limits. Vapor intrusion evaluations of these chemicals are expected to yield relatively unbiased attenuation factors. Figure 2 illustrates these relationships for the four chemicals in Table 4 with the greatest number of measurements in the database: 1,1-dichloroethene; tetrachloroethene (also known as perchloroethylene); 1,1,1-trichloroethane; and trichloroethene.
The influence of background indoor air concentrations (CIA-BKGD) on empirical attenuation factors AFEMP) can be anticipated by modifying Equation 1 as follows:
( )
SV
BKGDIAVI
SV
BKGDIAVIIAEMP C
CAF
CCC
AF −−− +=+
= Equation 2

March 4, 2008 U.S. EPA’s Vapor Intrusion Database
The findings and conclusions in this report have not been formally disseminated by EPA and should not be construed to represent any Agency determination or policy.
9
When background indoor air concentrations are equivalent to or greater than the concentration contributed by vapor intrusion, the empirical attenuation factor will be biased high relative to the true attenuation factor (i.e., towards higher, more conservative values) by the contribution of background sources to indoor air. The bias varies in proportion to the relative contribution of background sources to the total indoor air concentration. Equation 2 shows that the empirical attenuation factor is most likely to represent the attenuation due to vapor intrusion when the indoor air concentration from vapor intrusion is substantially greater than the background indoor air concentration, which is most likely to occur when subsurface vapor concentrations are high.
Several methods were used to identify indoor air samples, and therefore attenuation factors, likely to be biased by background concentrations. These methods included reviewing field sampling notes and evaluating the consistency of chemical concentrations in paired indoor and subsurface samples. For example, indoor air samples taken in buildings for which field notes indicate the presence of background sources of organic chemicals (such as open solvent or gas containers) or recent significant use of chemicals (such as painting or new carpets) clearly are likely to be biased by background for certain compounds. Paired samples in the database with information indicating the possibility of such indoor sources were flagged and excluded from further analysis.
Indoor air concentrations that are greater than their corresponding subsurface vapor concentrations also suggest that background sources may be influencing the concentration. Because of the attenuation and dilution that occur as vapors migrate from the subsurface upwards through soil and into a ventilated building, indoor air concentrations resulting from vapor intrusion are expected to be considerably less than the subsurface concentration. Consequently, vapor intrusion attenuation factors are expected to be significantly less than one. For example, Johnson (2002) suggests a reasonable upper limit of 0.05 for subslab-to-indoor-air attenuation factors based on a review of vapor attenuation coefficients reported for radon studies and vapor intrusion case studies. Even lower values of attenuation factors are expected for vapor concentrations measured at greater depths under the building or exterior to the building in the unsaturated zone or in groundwater below the building, because these vapors are attenuated more than subslab vapors by transport through soil. For these reasons, calculated attenuation factors equal to or greater than one were flagged as not representative of vapor intrusion and excluded from further analysis.
Background influence also can be determined by evaluating the consistency in attenuation factors among chemicals if more than one chemical is reported for a given sample. Attenuation factors are expected to be similar for chemicals with similar vapor fate and transport properties, which is the case for most chlorinated VOCs. For example, Figure 3(a) shows the similarity in attenuation factors for several chemicals analyzed in a single pair of subslab and indoor air samples from a building where background influences are not present or are insignificant. In contrast, Figure 3(b) suggests that background sources influence some of the chemicals’ measured indoor air concentrations and result in notably different attenuation factors. Because of analytical uncertainty, particularly for chemicals with concentrations near the reporting limit, and because of differences in the diffusion coefficients of chemicals, the calculated ratios are not expected to be exactly the same value for each chemical. Rather, a propagation of error analysis suggests the attenuation factors for chemicals with similar fate and

March 4, 2008 U.S. EPA’s Vapor Intrusion Database
The findings and conclusions in this report have not been formally disseminated by EPA and should not be construed to represent any Agency determination or policy.
10
transport properties are expected to be within a factor of five to ten of each other. Thus, attenuation factors more than an order of magnitude higher than the lowest calculated attenuation factor or group of attenuations factors considered to be valid (e.g., subsurface and indoor air concentrations greater than two or three times their reporting limits) were considered to be biased by background sources; these were flagged and excluded from further analysis.
Together, the screening criteria described above (field notes indicating background sources, indoor air concentrations greater than subsurface vapor concentrations, and inconsistent attenuation factors) combined with the previous screening of subsurface concentrations less than reporting limits resulted in flagging and excluding from statistical analysis 14 percent of the groundwater data, 8 percent of the soil gas data, and 37 percent of the subslab data; no crawlspace data were excluded. After this level of screening, there remained 910 paired groundwater and indoor air concentrations, 218 paired soil gas and indoor air concentrations, 991 paired subslab and indoor air concentrations, and 110 paired crawlspace and indoor air concentrations (as shown in Table 3). This subset of data, referred to as the Data Consistency Screen data set (and also as Data Set 1 [2008]), is considered to be a reasonably large set of data and sufficient to support the statistical analyses presented here.
The potential influence of background on the calculated attenuation factors in Data Set 1 (the Data Consistency Screen described above) can then be evaluated by further screening the data to identify those attenuation factors calculated from indoor air concentrations that are greater than the 95th percentile of the background indoor air concentrations in Table 4 or the reporting limit (if higher than the 95th percentile). This subset of data, referred to as the Background Screen data set (and also as Data Set 2 [2008]), is the second subset of data analyzed statistically in the following sections. This approach is similar to that taken by EPA in its 2002 draft guidance to analyze the attenuation factors.
6.0 Statistical Analysis of Attenuation Factors
Because of the inherent spatial and temporal variability in media concentrations, attenuation factors calculated for a site or a group of sites will also exhibit considerable variability and span a large range of values. For this reason, a statistical approach was used to characterize the distribution of empirical attenuation factors in EPA’s vapor intrusion database. Descriptive order statistics—the 5th, 25th, 50th, 75th and 95th percentiles—were calculated using the Kaplan-Meier method described earlier for groundwater-, soil gas-, subslab-, and crawlspace-to-indoor-air attenuation factors. The results were plotted and analyzed using cumulative percentile plots and box-and-whisker plots.
Two subsets of data from the 2008 database were evaluated for each type of attenuation factor: Data Set 1 (2008)–the Data Consistency Screen subset of data described above and in Table 3 and Data Set 2 (2008)–the Background Screen subset of data also described above and in Table 3.
In the 2002 draft guidance, none of the data below reporting limits were considered, and attenuation factor distribution statistics were developed only for the groundwater and subslab data. For those analyses, the groundwater and subslab data were split into two subsets of data: (1) the subset of data (here called Data Set 1 [2002]) for which the subsurface and indoor air

March 4, 2008 U.S. EPA’s Vapor Intrusion Database
The findings and conclusions in this report have not been formally disseminated by EPA and should not be construed to represent any Agency determination or policy.
11
concentrations were above reporting limits, and (2) the subset of that data (here called Data Set 2 [2002]) for which the indoor air concentrations were above the geometric mean of the background indoor air concentrations included in Appendix F of EPA’s draft vapor intrusion guidance (U.S. EPA, 2002). The statistical distributions derived in the 2002 draft guidance are compared to those derived with the 2008 database in the sections below, with the recognition that the screening criteria were somewhat different for the two databases. There were insufficient soil gas and crawlspace data in 2002 to perform a statistical analysis; therefore no comparison of the 2002 and 2008 soil gas and crawlspace data is provided below.
6.1 Groundwater-to-Indoor-Air Attenuation Factors
Groundwater-to-indoor-air attenuation factors are calculated by dividing a measured indoor air concentration by the vapor concentration calculated from the estimated groundwater concentration underlying the building. The 2008 vapor concentration emitted by the groundwater was estimated by multiplying the groundwater concentration by a chemical’s dimensionless Henry’s law constant. The vapor intrusion database contains a total of 1,229 groundwater-to-indoor-air attenuation factors from 36 sites. Data Set 1 (2008) contains 910 groundwater-to-indoor-air attenuation factors from 36 sites. Data Set 2 (2008) contains 596 groundwater-to-indoor-air attenuation factors from 27 sites.
Scatter-plots in Figure 4, cumulative percentile plots in Figure 5, and box plots in Figure 6 illustrate the distribution of groundwater attenuation factors for the two subsets of data described above. These figures show that most of the groundwater attenuation factors in the 2008 database fall between 0.00001 and 0.001. The median groundwater attenuation factor is about 0.0001 with an interquartile range (the range from the 25th to 75th percentile) spanning about an order of magnitude around the median. The 95th percentile groundwater attenuation factor is about 0.001. There is little difference in the upper end statistical measures (75th and 95th percentiles) between the two data sets, suggesting that the influence of background sources on the groundwater attenuation factor in the database is limited.
Figures 5 and 6 show that the spread and interquartile ranges of the 2002 and 2008 groundwater-to-indoor-air attenuation factor distributions are very similar, particularly when comparing the data sets screened against background indoor air concentrations (Data Sets 2). In the 2002 draft guidance, the 95th percentile of Data Set 2 was used to define an upper bound attenuation factor of 0.001. Considering the similarity of the 2002 and 2008 distributions, the upper bound attenuation factor defined in 2002 appears to apply to the larger set of sites included in the 2008 database.
The range of the groundwater-to-indoor-air attenuation factors is more than five orders of magnitude. A large range is expected, because this distribution represents a compilation of all the available data from sites with a relatively wide range of conditions, which may differ in soil type, depth to groundwater, groundwater monitoring well design, climate, building size, and foundation type, each of which can contribute to variations in the attenuation of concentrations across the water table, through the unsaturated zone, and upon entry to buildings. Attenuation across the capillary fringe is unique to the groundwater attenuation factors (i.e., does not affect soil gas, subslab, or crawlspace attenuation factors), so a broader range in groundwater attenuation factors is to be expected.

March 4, 2008 U.S. EPA’s Vapor Intrusion Database
The findings and conclusions in this report have not been formally disseminated by EPA and should not be construed to represent any Agency determination or policy.
12
6.2 Soil-Gas-to-Indoor-Air Attenuation Factors
Soil gas attenuation factors in the database are calculated by dividing the measured indoor air concentration by the soil gas concentration measured exterior to the building. The 2008 vapor intrusion database contains a total of 239 soil-gas-to-indoor-air attenuation factors from 18 sites. Data Set 1 contains 218 soil-gas-to-indoor-air attenuation factors from 17 sites. Data Set 2 contains 86 soil-gas-to-indoor-air attenuation factors from 12 sites.
Scatter-plots in Figure 7, cumulative percentile plots in Figure 8, and box plots in Figure 9 illustrate the distribution of soil gas attenuation factors for the two subsets of data described above. These figures show that the soil gas attenuation factors in the 2008 database span a range of more than six orders of magnitude. The median soil gas attenuation factor is about 0.01, with an interquartile range (25th to 75th percentiles) spanning about two orders of magnitude around the median. The 95th percentile soil gas attenuation factor is about 0.3.
The overall range of soil gas attenuation factors is larger than that observed for groundwater. Considering that groundwater attenuation factors are influenced by a greater number of factors than soil gas attenuation factors, the larger range in soil gas attenuation factors may be a reflection of the variability in soil gas sampling and analysis methods, heterogeneity in soil properties, or generally higher levels of temporal variability in shallower subsurface samples. The large range of soil gas attenuation factors observed here suggests that research is needed to understand and minimize sources of variability in soil gas data to the extent practical.
6.3 Subslab-to-Indoor-Air Attenuation Factors
Subslab-to-indoor-air attenuation factors are calculated by dividing a measured indoor air concentration by the vapor concentration measured directly underneath a building’s foundation slab. The 2008 vapor intrusion database contains a total of 1,584 subslab-to-indoor-air attenuation factors representing 15 sites. Data Set 1 contains 991 subslab-to-indoor-air attenuation factors from 15 sites. Data Set 2 contains 311 subslab-to-indoor-air attenuation factors from 13 sites.
Scatter-plots in Figure 10, cumulative percentile plots in Figure 11, and box plots in Figure 12 illustrate the distribution of subslab attenuation factors for the two subsets of data described above. These figures show that the subslab attenuation factors in the 2008 database have a range of over four orders of magnitude, with a median value of about 0.005 and an interquartile range (25th to 75th percentiles) of about an order of magnitude around the median. Figure 10 shows that the majority of the subslab attenuation factors fall between 0.001 and 0.01 at higher indoor air and subslab concentrations. At lower indoor air and subslab concentrations (Figure 10(a)), a large fraction of the attenuation factors fall between 1.0 and 0.01, suggesting that background indoor concentrations are biasing the attenuation factors. In the data set screened against background indoor air concentrations (Figure 10(b)), most of the very high attenuation factors have been removed, and the spread of the distribution narrows. This effect is also illustrated in Figures 11(b) and 12. The 95th percentile of the data set screened against background indoor air concentrations is 0.1.
March 4, 2008 U.S. EPA’s Vapor Intrusion Database
The findings and conclusions in this report have not been formally disseminated by EPA and should not be construed to represent any Agency determination or policy.
13
In the 2002 database, there was only one site (Lowry Air Force Base) with subslab measurements. Figure 11(a) shows that the attenuation factor distributions for the 2008 and 2002 Data Sets 1 are very similar. In the 2002 draft guidance, the data set screened against background indoor air concentrations (Data Set 2 [2002]) was used to define an upper bound attenuation factor of 0.1, which corresponded approximately to the 85th percentile of that data set. This upper bound attenuation factor corresponds approximately to the 95th percentile of the 2008 subset of data that has indoor air concentrations above background (Data Set 2 [2008]).
The range of the subslab-to-indoor-air attenuation factors is less than that observed for groundwater or soil gas attenuation factors, which is to be expected because subslab vapor migration to indoor air is not influenced by several factors that affect migration of vapors from groundwater to indoor air (e.g., soil heterogeneity, varying depths to groundwater, height of the capillary fringe, infiltration of rainfall, geologic barriers, and water table fluctuations).
6.4 Crawlspace-to-Indoor-Air Attenuation Factors
Crawlspace-to-indoor-air attenuation factors are calculated by dividing measured indoor air concentrations by measured crawlspace concentrations. The 2008 vapor intrusion database contains a total of 110 crawlspace-to-indoor-air attenuation factors from 4 sites. Data Set 1 contains the same number of crawlspace-to-indoor-air attenuation factors and sites. Data Set 2 contains 45 crawlspace-to-indoor-air attenuation factors from 3 sites.
Scatter-plots in Figure 13, cumulative percentile plots in Figure 14, and box plots in Figure 15 illustrate the distribution of crawlspace attenuation factors for the two subsets of data described above. The crawlspace attenuation factors in these data sets range about two orders of magnitude centered around a median value slightly less than 1.0 (0.7 in Data Set 1 and 0.5 in Data Set 2). These results suggest that on average, little attenuation occurs between the crawlspace and indoor air space. Alternatively, these results could be taken to indicate that air exchange between the two areas leads to equilibration in the concentrations. The variability in these attenuation factors may be due in part to temporal variability in indoor air samples, which, as described earlier in the discussion of spatial and temporal variability, is observed to span about an order of magnitude when using samples collected over 24 hour periods.
7.0 Summary and Conclusions
The data contained in EPA’s vapor intrusion database was compiled to help environmental professionals understand the vapor intrusion pathway and particularly the attenuation that may be observed when vapors migrate from subsurface sources into indoor spaces. After removing data that did not meet certain criteria and data likely to be influenced by background indoor sources, the distributions of attenuation factors that remain were analyzed graphically and statistically using tools included in a spreadsheet version of the database. The observations summarized here are provided as examples of the distribution of observed attenuation factors contained in EPA’s vapor intrusion database. It is important to consider that the database, while relatively large, reflects only 41 sites, and the number of buildings and paired samples within each site are unevenly distributed in the database. Therefore, the statistical distributions may change as data are added to the database, and the attenuation factors in this report may not apply to new sites with significantly different site conditions.

March 4, 2008 U.S. EPA’s Vapor Intrusion Database
The findings and conclusions in this report have not been formally disseminated by EPA and should not be construed to represent any Agency determination or policy.
14
In the 2002 draft guidance, the database contained primarily groundwater and subslab data from 15 sites with a total of 73 buildings. As of 2008, the database contains information from 41 sites with a total of 913 buildings. The groundwater data has been expanded from 15 sites with a total of 266 paired indoor air and groundwater measurements to 36 sites with a total of 1,058 paired measurements. The subslab data has been expanded from 1 site with 86 paired measurements to 15 sites with 1,584 paired measurements. In addition, the database currently includes considerably more soil gas and crawlspace data than was available in 2002. The groundwater data added to the database since 2002 did not significantly alter the statistical measures of the groundwater attenuation factor distributions. The additional subslab data allow more reliable statistics to be calculated than could be done with the very limited subslab data set in 2002, but the upper bound statistical measures obtained from both data sets are generally the same.
The analyses presented in this report show that the influence of background sources of indoor air contaminants on the calculated attenuation factors to distinguish the impacts due to vapor intrusion should be considered. In this report, background influence was assessed by comparing the distributions of attenuation factors for the subset of data where the indoor air concentrations are higher than background indoor air concentrations to the subset of data screened for data consistency and subsurface concentrations greater than reporting limits. However, even after removing low-concentration indoor air data, the remaining attenuation factors still exhibit considerable variability.
The ranges of attenuation factors calculated for each medium (groundwater, soil gas, subslab, and crawlspace) in the 2008 database span several orders of magnitude. Some of this variability is unquestionably due to the inherent natural variability in media concentrations and vapor intrusion processes. However, some variability may also be introduced by non-representative subsurface samples—samples that because of sampling errors or other sampling issues may under-represent the vapor source concentrations. These samples would tend to bias attenuation factors upwards (i.e., towards higher-valued, more conservative attenuation factors). A focus on high subsurface concentrations may be needed to understand those biases. For future investigations, variability may be reduced by using alternative sampling methods that provide spatially and temporally integrated concentrations or by improving sampling protocols.
The attenuation factor distributions obtained for each of the media evaluated are generally consistent with the conceptual model for vapor intrusion. The groundwater attenuation factors tend to be lower than soil gas attenuation factors, which in turn tend to be lower than subslab attenuation factors (Figure 16). Crawlspace attenuation factors are higher still. Greater attenuation is expected for groundwater sources, where vapors must migrate through both the capillary fringe and soils in the unsaturated zone. Less attenuation is expected for vapors migrating from directly beneath a building’s foundation when compared to soil gas vapors, which must migrate through soil to reach the building. Nevertheless, there is a range of at least two orders of magnitude in each attenuation factor distribution and considerable overlap among the ranges for different media. The range generally diminishes from groundwater to shallower media, except for soil gas, which suggests that soil gas sampling methods may need to be further improved and standardized.

March 4, 2008 U.S. EPA’s Vapor Intrusion Database
The findings and conclusions in this report have not been formally disseminated by EPA and should not be construed to represent any Agency determination or policy.
15
Regardless of the source of variability, there will be unavoidable differences in building characteristics and geologic conditions, so a large range of attenuation factors is to be expected at any site. The overall variability in attenuation factors described in this report has important implications and should be considered in assessing the vapor intrusion pathway.
8.0 Future Research
Currently, EPA’s vapor intrusion database consists primarily of chlorinated hydrocarbon data obtained in residential settings. To expand the types of sites, settings, and chemicals included in the database, EPA expects to periodically update the vapor intrusion database as additional data become available.
9.0 References
Helsel, D.R. 2005a. Nondetects and Data Analysis, Statistics for Censored Environmental Data. John Wiley and Sons, New York.
Helsel, D.R. 2005b. More than obvious: Better methods for interpreting nondetect data. Environmental Science & Technology 39(20):419A-423A.
Helsel, D. R. 2006. Fabricating data: how substituting values for non-detects can ruin results, and what can be done about it. Chemosphere 65:2434-2439.
Johnson, P.C., and R.A. Ettinger. 1991. Heuristic Model for Predicting the Intrusion Rate of Contaminant Vapors into Buildings. Environmental Science & Technology, 25:1445–1452.
Johnson, P.C. 2002. Sensitivity Analysis and Identification of Critical and Non-Critical Parameters for the Johnson and Ettinger (1991) Vapor Intrusion Model. API Soil and Groundwater Research Bulletin No. 17. API. May.
Singh, A., R. Maichle, and S.E. Lee. 2006. On the Computation of a 95% Upper Confidence Limit of the Unknown Population Mean Based Upon Data Sets with Below Detection Limit Observations. Available at http://www.epa.gov/esd/tsc/issue.htm.
U.S. EPA (Environmental Protection Agency). 1998. Guidance for Data Quality Assessment. Practical Methods for Data Analysis. EPA QA/G-9 QA97 Version. EPA/600/R-96/084. January.
U.S. EPA (Environmental Protection Agency). 2002. Draft Guidance for Evaluating the Vapor Intrusion to Indoor Air Pathway from Groundwater and Soils. Washington, D.C.: Office of Solid Waste and Emergency Response. Available at www.epa.gov/correctiveaction/ eis/vapor/complete.pdf.
U.S. EPA (Environmental Protection Agency). 2008. Background Indoor Air Concentrations of Volatile Organic Compounds in North American Residences – A Review. In press.

March 4, 2008 U.S. EPA’s Vapor Intrusion Database
The findings and conclusions in this report have not been formally disseminated by EPA and should not be construe to represent any Agency determination or policy.
16
Table 1. Summary of Changes in EPA’s Vapor Intrusion Database Between 2002 and 2008
Sites Buildings Attenuation Factors
Attenuation Factor Type 2002 2008 2002 2008 2002 2008
Groundwater to indoor air 15 36 73 658 266 1,058
Soil gas to indoor air 4 17 8 130 16 237
Subslab to indoor air 1 15 9 424 86 1,584
Crawlspace to indoor air 1 4 4 11 40 110
Totala 15 41 73 913 408 2,989
a Total numbers of sites and buildings in the database are less than the totals of individual attenuation factor types because some sites and buildings have more than one type of attenuation factor.

March 4, 2008 U.S. EPA’s Vapor Intrusion Database
The findings and conclusions in this report have not been formally disseminated by EPA and should not be construe to represent any Agency determination or policy. 17
Table 2. Summary of Information in EPA’s Vapor Intrusion Database
Building Use
Foundation Type
Media Sampled Chemicals
Site Name City ST
Vapor Source Typea Soil Type
No. of Bldgs R
esid
entia
l
Com
mer
cial
/ In
stitu
tiona
l
Bas
emen
t
Slab
on
grad
e
Cra
wls
pace
Gro
undw
ater
Soil
Gas
Subs
lab
Cra
wls
pace
TCE
PCE
11D
CE
111T
CA
Oth
er C
HC
PHC
Alameda Air Station
Alameda CA LNAPL Coarse 1 o o o o o
Alleppo Mountain View
CA GW Fine 4 o o o o o o
Alliant* Littleton CO GW Fine 6 (1 in '02) o o o o o o
Billings PCE Billings MT GW Fine/V.Coarse 32 o o o o o
BP Site Paulsboro NJ GW Coarse 1 o o o o o
CDOT* Denver CO GW Fine 6 o o o o o o o
Davis Troy MI DNAPL Coarse 1 o o o o o
DenverPCEBB Denver CO GW Fine 7 o o o o o o o o o
Eau Claire* Eau Claire WI GW Coarse 3 o o o o o
Endicott Endicott NY GW Coarse 232 o o o o o o o o o o o o
Fresh Water Lens
NA MA VZ, GW Coarse 2 o o o o o
Georgetown Seattle WA GW 2 o o o o o o
Grants Grants NM GW Fine 8 o o o o o o o
Hamilton-Sundstrand*
Denver CO GW Coarse 32 (13 in '02)
o o o
Harcros/Tri State
Witchita KS GW Coarse 7 o o o o o o o
(continued)

March 4, 2008 U.S. EPA’s Vapor Intrusion Database
The findings and conclusions in this report have not been formally disseminated by EPA and should not be construe to represent any Agency determination or policy. 18
Table 2. (continued)
Building Use
Foundation Type
Media Sampled Chemicals
Site Name City ST
Vapor Source Typea Soil Type
No. of Bldgs R
esid
entia
l
Com
mer
cial
/ In
stitu
tiona
l
Bas
emen
t
Slab
on
grad
e
Cra
wls
pace
Gro
undw
ater
Soil
Gas
Subs
lab
Cra
wls
pace
TC
E
PCE
11D
CE
111T
CA
Oth
er C
HC
PHC
Hopewell Precision
Hopewell Junction
NY GW Coarse 19 o o o o o o
Jackson Jackson WY GW Coarse 2 o o o o o o o o
LAFB* Aurora CO GW Coarse 13 o o o o o o o o o o o o
Lakeside Village
Houston TX VZ, GW Fine 1 o o o o
Lockwood Lockwood MT GW Fine 13 o o o o o o o o o o
MADEP1* NA MA GW Coarse 2 o o o o o
MADEP2* NA MA GW Coarse 1 o o o o
MADEP3* NA MA GW Coarse 3 o o o o o
MADEP4* NA MA GW Coarse 1 o o o o
MADEP5* NA MA GW Coarse 1 o o o o
MADEP6* NA MA GW Coarse 2 o o o o o
MADEP7* NA MA GW Coarse 1 o o o o
Moffett MCH Mountain View
CA GW Fine 3 o o o o
Mount Holly Mt. Holly NJ GW Coarse 1 o o o o
Mountain View* Mountain View
CA GW Coarse 5 (7 in '02) o o o o o
(continued)

March 4, 2008 U.S. EPA’s Vapor Intrusion Database
The findings and conclusions in this report have not been formally disseminated by EPA and should not be construe to represent any Agency determination or policy. 19
Table 2. (continued)
Building Use
Foundation Type
Media Sampled Chemicals
Site Name City ST
Vapor Source Typea Soil Type
No. of Bldgs R
esid
entia
l
Com
mer
cial
/ In
stitu
tiona
l
Bas
emen
t
Slab
on
grad
e
Cra
wls
pace
Gro
undw
ater
Soil
Gas
Subs
lab
Cra
wls
pace
TC
E
PCE
11D
CE
111T
CA
Oth
er C
HC
PHC
Orion Park Mountain View
CA GW Fine 8 o o o o o
Rapid City Rapid City SD GW Fine 3 o o o o o
Raymark Raymark CN GW Coarse 14 o o o o o o o
Redfield* Denver CO GW Coarse 330 (14 in '02)
o o o o o o
SCM - Cortlandville
Cortlandville NY GW V. Coarse 40 o o o o o o
Stafford Stafford NJ LNAPL Coarse 3 o o o o o o o o
Twins Inn Arvada CO GW Fine 2 o o o o o o o
Uncasville* Uncasville CN GW Coarse 4 o o o o o o
Wall Wall Township
NJ GW Coarse 43 o o o o
West Side Corporation
Brooklyn NY GW V. Coarse 53 o o o o o o
Wz CA Bay Mountain View
CA GW Fine 1 o o o o
* Site in 2002 database a GW = groundwater, VZ = vadose zone, LNAPL = light non-aqueous phase liquid

March 4, 2008 U.S. EPA’s Vapor Intrusion Database
The findings and conclusions in this report have not been formally disseminated by EPA and should not be construe to represent any Agency determination or policy.
20
Table 3. Summary of Attenuation Factors Remaining After Each Successive Data Screening Step
Attenuation Factor Type Data Quality
Screena
Subsurface Concentration
Screenb
Data Set 1 Data
Consistency Screenc
Data Set 2 95th Percentile
Background Screend
Groundwater to indoor air 1,058 1,026 910 596 Soil gas to indoor air 237 226 218 86 Subslab to indoor air 1,584 1,553 991 311 Crawlspace to indoor air 110 110 110 45 Total 2,989 2,915 2,229 1,038 a Data set after poor quality data were removed from the database. This data set comprises the baseline 2008 vapor intrusion database. b Data set after Data Quality Screen and screening out subsurface concentrations less than reporting limits. c Data set after Data Quality Screen, Subsurface Concentration Screen, and screening out samples for which field notes indicate the presence of background sources, indoor air concentrations greater than the corresponding subsurface concentration, or attenuation factors for an individual chemical that are inconsistent with the attenuation factors for other chemicals reported for the same sample. This data set also is referred to as Data Set 1. d Data set after Data Quality Screen, Subsurface Concentration Screen, Data Consistency Screen, and screening out indoor air concentrations less than the 95th percentile of the background indoor air concentrations or the reporting limits (if higher than the 95th percentile). This data set also is referred to as Data Set 2.
March 4, 2008 U.S. EPA’s Vapor Intrusion Database
The findings and conclusions in this report have not been formally disseminated by EPA and should not be construe to represent any Agency determination or policy. 21
Table 4a. Background Indoor Air Concentrations Measured in North American Residences Since 1990 and Indoor Air Concentrations in Residences Included in EPA’s Vapor Intrusion Database
Background Residential Indoor Air Concentrations
Compound N Studies N Samples Avg. % Detect RL Range 25th % 50th % 75th % 90th % 95th % Max
Benzene 16 2672 87 0.05 - 1.6 1.5 2.4 4.7 10 16 36
Carbon Tetrachloride 5 873 88 0.15 - 0.25 0.4 0.5 0.7 0.9 1.1 3
Chloroform 11 2210 73 0.02 - 2.4 0.6 1.0 2.4 4.1 6.8 11
Dichloroethane,1,1- 5 1309 0.3 0.08 - 2.0 <RL <RL <RL <RL <RL 1
Dichloroethene, 1,1- 5 957 10 0.01 - 2.0 <RL <RL 0.4 0.8 1.4 4
Dichloroethene, cis 1,2- 4 975 3 0.25 - 2.0 <RL <RL <RL <RL 1.2 7
Dichloroethene, trans 1,2-
3 575 0 0.8 - 2.0 <RL <RL <RL <RL <RL <RL
Ethylbenzene 12 1541 81 0.01 - 2.0 1.2 2.2 2.8 8.9 13 35
Methyl tert-butyl ether (MTBE)
4 502 47 0.05 - 1.8 <RL 0.8 6.2 32 72 248
Tetrachloroethene 15 2369 65 0.03 - 3.4 <RL 0.7 1.4 3.8 7.5 42
Toluene 14 2122 96 0.03 - 2.0 7 13 25 54 90 139
Trichloro-1,2,2-trifluoroethane, 1,1,2-
1 400 56 0.25 <RL 0.5 1.1 1.8 3.4 7
Trichloroethane, 1,1,1- 9 1877 60 0.12 - 2.7 1.1 1.8 2.6 3.1 6.9 102
Trichloroethene 14 2435 44 0.02 - 2.7 0.06 0.1 0.1 0.5 0.8 19
Vinyl chloride 6 1684 7 0.01 - 1.3 <RL <RL 0.02 0.03 0.05 0.4
Xylene, m/p- 10 1920 90 0.4 - 2.2 2.5 4.0 7.6 21 38 279
Xylene, o- 14 2061 85 0.11 - 2.2 1.4 2.2 3.3 11 13 44
Xylene, total

March 4, 2008 U.S. EPA’s Vapor Intrusion Database
The findings and conclusions in this report have not been formally disseminated by EPA and should not be construe to represent any Agency determination or policy. 22
Table 4b. Background Indoor Air Concentrations Measured in North American Residences Since 1990 and Indoor Air Concentrations in Residences Included in EPA’s Vapor Intrusion Database
EPA Vapor Intrusion Database Residential Indoor Air Concentrations
Compound N Sites N Samples %
Detect RL Range 25th % 50th % 75th % 95th % Max
Benzene 7 15 100 1.6 2.0 8.1 26 26
Carbon Tetrachloride 1 1 100 1
Chloroform 2 4 100 1.3 1
Dichloroethane,1,1- 5 51 65 0.01 - 0.16 0.02 0.05 0.3 2.1 17
Dichloroethene, 1,1- 8 467 92 0.01 - 0.11 1.4 4.1 14 49 131
Dichloroethene, cis 1,2- 7 111 76 0.01 - 0.97 0.03 0.3 1.5 16 31
Dichloroethene, trans 1,2- 2 7 100 0.12 8.7
Ethylbenzene 7 10 100 1.9 3.0 8.8 15
Methyl tert-butyl ether (MTBE) 1 2 100 66 130
Tetrachloroethene 14 412 88 0.2 - 2.7 0.6 1.5 5.6 52 1896
Toluene 9 16 100 5.9 9.6 17 87
Trichloro-1,2,2-trifluoroethane, 1,1,2-
1 128 95 0.22 - 2.6 0.5 0.6 0.7 0.9 28
Trichloroethane, 1,1,1- 8 250 95 0.17 - 1.8 0.3 1.0 2.4 20 140
Trichloroethene 21 624 84 0.01 - 1.8 0.3 1.5 8.2 48 850
Vinyl chloride 4 19 47 0.04 - 0.55 0.03 0.031 0.1 1.1
Xylene, m/p-
Xylene, o-
Xylene, total 9 16 100 0.14 - 0.27 2.1 7.5 16 100

March 4, 2008 U.S. EPA’s Vapor Intrusion Database
The findings and conclusions in this report have not been formally disseminated by EPA and should not be construe to represent any Agency determination or policy.
23
1.E+00
1.E+01
1.E+02
1.E+03
1.E+04
1.E+05
1.E+00 1.E+01 1.E+02 1.E+03 1.E+04 1.E+05 1.E+06 1.E+07 1.E+08
Soil Gas Concentration (ug/m3)
Subs
lab
Con
cent
ratio
n (u
g/m
3)Subslab > Soil Gas
Figure 1. Soil gas vs. subslab concentrations for buildings with both types of data in EPA’s 2008 vapor intrusion database.
0.0
0.1
1.0
10.0
100.0
1000.0
10000.0
Bac
kgro
und
Dat
abas
e
Bac
kgro
und
Dat
abas
e
Bac
kgro
und
Dat
abas
e
Bac
kgro
und
Dat
abas
e
Con
cent
ratio
n (u
g/m
3)
Max
95th %
50th %
PCE = Perchloroethylene; 111TCA = 1,1,1-trichloroethane; TCE = trichloroethene; 11DCE = 1,1-dichloroethene. Top and bottom of the “box” indicate the 75th and 25th percentiles, respectively.
Figure 2. Box-and-whisker plot of selected background indoor air concentrations in North American residences sampled since 1990 and indoor air concentrations in residences included in EPA’s vapor intrusion database.
TCE 11DCE PCE 111TCA

March 4, 2008 U.S. EPA’s Vapor Intrusion Database
The findings and conclusions in this report have not been formally disseminated by EPA and should not be construe to represent any Agency determination or policy.
24
1.E-04
1.E-03
1.E-02
1.E-01
1.E+00
1.E+00 1.E+01 1.E+02 1.E+03 1.E+04 1.E+05
Sub-Slab Concentration (ug/m3)
Sub-
Slab
Atte
nuat
ion
Fact
or
1.E-05
1.E-04
1.E-03
1.E-02
1.E-01
1.E+00
1.E+01
1.E+02
1.E-01 1.E+00 1.E+01 1.E+02 1.E+03 1.E+04
Sub-Slab Concentration (ug/m3)
Sub-
Slab
Atte
nuat
ion
Fact
or
(a) Residence 002 (b) Residence 005
11DCA = 1,1-dichloroethane; 11DCE = 1,1-dichloroethene; 11DCE = 1,1-dichloroethene; cis12DCE = cis-1,2-dichloroethene; FREON = 1,1,2-Trichloro-1,2,2-trifluoroethane; PCE = perchloroethylene; 111TCA = 1,1,1-trichloroethane; TCE = trichloroethene.
Figure 3. Empirical attenuation factors for individual chemicals in two buildings at the Endicott Site, NY. (a) Residence 002 suggests little or no background influence; (b) Residence 005 suggests there is background influence on PCE and Freon, but not 111TCA or TCE.
TCE
111TCA
PCE cis12DCE
11DCA
11DCE
PCE
111TCA
TCE
FREON

March 4, 2008 U.S. EPA’s Vapor Intrusion Database
The findings and conclusions in this report have not been formally disseminated by EPA and should not be construe to represent any Agency determination or policy.
25
1.E-03
1.E-02
1.E-01
1.E+00
1.E+01
1.E+02
1.E+03
1.E+04
1.E-02 1.E-01 1.E+00 1.E+01 1.E+02 1.E+03 1.E+04 1.E+05 1.E+06 1.E+07 1.E+08
Indo
or A
ir C
once
ntra
tion
(ug/
m3) EPA Data (IA > RL)
EPA Data (IA < RL)
Alpha = 1.0
Alpha = 1E-1
Alpha = 1E-2
Alpha = 1E-3
Alpha = 1E-4
Alpha = 1E-5
Groundwater Vapor (ug/m3)
(a) Data Set 1 (2008)
1.E-03
1.E-02
1.E-01
1.E+00
1.E+01
1.E+02
1.E+03
1.E+04
1.E-02 1.E-01 1.E+00 1.E+01 1.E+02 1.E+03 1.E+04 1.E+05 1.E+06 1.E+07 1.E+08
Indo
or A
ir C
once
ntra
tion
(ug/
m3) EPA Data (IA > RL)
Alpha = 1.0
Alpha = 1E-1
Alpha = 1E-2
Alpha = 1E-3
Alpha = 1E-4
Alpha = 1E-5
Groundwater Vapor (ug/m3)
(b) Data Set 2 (2008) Data Set 1 (2008): Subset of 2008 database remaining after screening out data with subsurface concentrations less than reporting limits, field notes indicating the presence of background sources, indoor air concentrations greater than subsurface concentrations, or inconsistent attenuation factors.
Data Set 2 (2008): Subset of Data Set 1 (2008) with indoor air concentrations greater than the 95th percentile background indoor air concentrations (Table 4) or the reporting limits (if higher than the 95th percentile).
Figure 4. Indoor air versus groundwater concentrations.

March 4, 2008 U.S. EPA’s Vapor Intrusion Database
The findings and conclusions in this report have not been formally disseminated by EPA and should not be construe to represent any Agency determination or policy.
26
1.0E-07
1.0E-06
1.0E-05
1.0E-04
1.0E-03
1.0E-02
1.0E-01
1.0E+00
0% 20% 40% 60% 80% 100%
Cumulative Percentile
Gro
udw
ater
Atte
nuat
ion
Fact
or
Data Set 1 (2002)
Data Set 1 (2008)
(a) Data Set 1 (2002 & 2008)
1.0E-07
1.0E-06
1.0E-05
1.0E-04
1.0E-03
1.0E-02
1.0E-01
1.0E+00
0% 20% 40% 60% 80% 100%
Cumulative Percentile
Gro
udw
ater
Atte
nuat
ion
Fact
or
Data Set 2 (2002)
Data Set 2 (2008)
(b) Data Set 2 (2002 & 2008)
Data Set 1 (2008): Subset of 2008 database remaining after screening out data with subsurface concentrations less than reporting limits, field notes indicating the presence of background sources, indoor air concentrations greater than subsurface concentrations, or inconsistent attenuation factors.
Data Set 1 (2002): Subset of 2002 database with subsurface and indoor air concentrations higher than the reporting limits.
Data Set 2 (2008): Subset of Data Set 1 (2008) with indoor air concentrations greater than the 95th percentile background indoor air concentrations (Table 4) or the reporting limits (if higher than the 95th percentile).
Data Set 2 (2002): Subset of Data Set 1 (2002) with indoor air concentration above the geometric mean of the background indoor air concentrations included in Appendix F of EPA’s draft vapor intrusion guidance (U.S. EPA, 2002).
Figure 5. Cumulative percentile plots of groundwater-to-indoor-air attenuation factors.
March 4, 2008 U.S. EPA’s Vapor Intrusion Database
The findings and conclusions in this report have not been formally disseminated by EPA and should not be construe to represent any Agency determination or policy.
27
Data Set 1 Data Set 1 Data Set 2 Data Set 2Statistic 2002 2008 2002 2008
Min 2.3E-07 1.0E-07 1.1E-06 9.5E-075% 2.0E-06 2.1E-06 5.9E-06 9.9E-06
25% 1.7E-05 1.9E-05 1.8E-05 3.7E-0550% 8.8E-05 6.7E-05 7.1E-05 1.1E-0475% 7.5E-04 2.0E-04 3.2E-04 2.7E-0495% 9.4E-03 1.2E-03 1.6E-03 1.5E-03Max 4.2E-01 7.4E-02 4.5E-02 7.4E-02
Count All 212 910 86 596Count IA > RL 212 877 86 596Count IA < RL 0 33 0 0
No. of Sites 15 36 11 27
1.0E-07
1.0E-06
1.0E-05
1.0E-04
1.0E-03
1.0E-02
1.0E-01
1.0E+00
Dat
a Se
t 1 (2
002)
Dat
a Se
t 1 (2
008)
Dat
a Se
t 2 (2
002)
Dat
a Se
t 2 (2
008)
Gro
undw
ater
AF Max
95th%
50th%
5th%
Min
Top and bottom of the “box” indicate the 75th and 25th percentiles, respectively. Data Set 1 (2008): Subset of 2008 database remaining after screening out data with subsurface concentrations less than reporting limits, field notes indicating the presence of background sources, indoor air concentrations greater than subsurface concentrations, or inconsistent attenuation factors.
Data Set 1 (2002): Subset of 2002 database with subsurface and indoor air concentrations higher than the reporting limits.
Data Set 2 (2008): Subset of Data Set 1 (2008) with indoor air concentrations greater than the 95th percentile background indoor air concentrations (Table 4) or the reporting limits (if higher than the 95th percentile).
Data Set 2 (2002): Subset of Data Set 1 (2002) with indoor air concentration above the geometric mean of the background indoor air concentrations included in Appendix F of EPA’s draft vapor intrusion guidance (U.S. EPA, 2002).
Figure 6. Summary statistics for groundwater-to-indoor-air attenuation factors.

March 4, 2008 U.S. EPA’s Vapor Intrusion Database
The findings and conclusions in this report have not been formally disseminated by EPA and should not be construe to represent any Agency determination or policy.
28
1.E-03
1.E-02
1.E-01
1.E+00
1.E+01
1.E+02
1.E+03
1.E+04
1.E-02 1.E-01 1.E+00 1.E+01 1.E+02 1.E+03 1.E+04 1.E+05 1.E+06 1.E+07 1.E+08
Indo
or A
ir C
once
ntra
tion
(ug/
m3) EPA Data (IA > RL)
EPA Data (IA < RL)
Alpha = 1.0
Alpha = 1E-1
Alpha = 1E-2
Alpha = 1E-3
Alpha = 1E-4
Alpha = 1E-5
Soil Gas (ug/m3)
(a) Data Set 1 (2008)
1.E-03
1.E-02
1.E-01
1.E+00
1.E+01
1.E+02
1.E+03
1.E+04
1.E-02 1.E-01 1.E+00 1.E+01 1.E+02 1.E+03 1.E+04 1.E+05 1.E+06 1.E+07 1.E+08
Indo
or A
ir C
once
ntra
tion
(ug/
m3) EPA Data (IA > RL)
Alpha = 1.0
Alpha = 1E-1
Alpha = 1E-2
Alpha = 1E-3
Alpha = 1E-4
Alpha = 1E-5
Soil Gas (ug/m3)
(b) Data Set 2 (2008) Data Set 1 (2008): Subset of 2008 database remaining after screening out data with subsurface concentrations less than reporting limits, field notes indicating the presence of background sources, indoor air concentrations greater than subsurface concentrations, or inconsistent attenuation factors.
Data Set 2 (2008): Subset of Data Set 1 (2008) with indoor air concentrations greater than the 95th percentile background indoor air concentrations (Table 4) or the reporting limits (if higher than the 95th percentile).
Figure 7. Indoor air versus soil gas concentrations.

March 4, 2008 U.S. EPA’s Vapor Intrusion Database
The findings and conclusions in this report have not been formally disseminated by EPA and should not be construe to represent any Agency determination or policy.
29
1.0E-06
1.0E-05
1.0E-04
1.0E-03
1.0E-02
1.0E-01
1.0E+00
1.0E+01
0% 20% 40% 60% 80% 100%
Cumulative Percentile
Soil
Gas
Atte
nuat
ion
Fact
or
Data Set 1 (2008)
Data Set 2 (2008)
Data Set 1 (2008): Subset of 2008 database remaining after screening out data with subsurface concentrations less than reporting limits, field notes indicating the presence of background sources, indoor air concentrations greater than subsurface concentrations, or inconsistent attenuation factors.
Data Set 2 (2008): Subset of Data Set 1 (2008) with indoor air concentrations greater than the 95th percentile background indoor air concentrations (Table 4) or the reporting limits (if higher than the 95th percentile).
Figure 8. Cumulative percentile plots of soil-gas-to-indoor-air attenuation factors.

March 4, 2008 U.S. EPA’s Vapor Intrusion Database
The findings and conclusions in this report have not been formally disseminated by EPA and should not be construe to represent any Agency determination or policy.
30
Statistic Data Set 1 (2008) Data Set 2 (2008)Min 1.3E-06 1.3E-065% 5.9E-06 2.7E-04
25% 4.2E-04 1.8E-0350% 6.3E-03 8.3E-0375% 4.9E-02 8.9E-0295% 3.5E-01 3.3E-01Max 3.5E+00 3.5E+00
Count All 218 86Count IA > RL 169 86Count IA < RL 49 0
No. of Sites 17 12
1.0E-06
1.0E-05
1.0E-04
1.0E-03
1.0E-02
1.0E-01
1.0E+00
1.0E+01
Dat
a Se
t 1 (2
008)
Dat
a Se
t 2 (2
008)
Soil
Gas
AF
Max
95th%
50th%
5th%
Min
Top and bottom of the “box” indicate the 75th and 25th percentiles, respectively. Data Set 1 (2008): Subset of 2008 database remaining after screening out data with subsurface concentrations less than reporting limits, field notes indicating the presence of background sources, indoor air concentrations greater than subsurface concentrations, or inconsistent attenuation factors.
Data Set 2 (2008): Subset of Data Set 1 (2008) with indoor air concentrations greater than the 95th percentile background indoor air concentrations (Table 4) or the reporting limits (if higher than the 95th percentile).
Figure 9. Summary statistics for soil-gas-to-indoor-air attenuation factors.

March 4, 2008 U.S. EPA’s Vapor Intrusion Database
The findings and conclusions in this report have not been formally disseminated by EPA and should not be construe to represent any Agency determination or policy.
31
1.E-03
1.E-02
1.E-01
1.E+00
1.E+01
1.E+02
1.E+03
1.E+04
1.E-02 1.E-01 1.E+00 1.E+01 1.E+02 1.E+03 1.E+04 1.E+05 1.E+06 1.E+07 1.E+08
Indo
or A
ir C
once
ntra
tion
(ug/
m3) EPA Data (IA > RL)
EPA Data (IA < RL)
Alpha = 1.0
Alpha = 1E-1
Alpha = 1E-2
Alpha = 1E-3
Alpha = 1E-4
Alpha = 1E-5
Subslab (ug/m3)
(a) Data Set 1 (2008)
1.E-03
1.E-02
1.E-01
1.E+00
1.E+01
1.E+02
1.E+03
1.E+04
1.E-02 1.E-01 1.E+00 1.E+01 1.E+02 1.E+03 1.E+04 1.E+05 1.E+06 1.E+07 1.E+08
Indo
or A
ir C
once
ntra
tion
(ug/
m3) EPA Data (IA > RL)
Alpha = 1.0
Alpha = 1E-1
Alpha = 1E-2
Alpha = 1E-3
Alpha = 1E-4
Alpha = 1E-5
Subslab (ug/m3)
(b) Data Set 2 (2008) Data Set 1 (2008): Subset of 2008 database remaining after screening out data with subsurface concentrations less than reporting limits, field notes indicating the presence of background sources, indoor air concentrations greater than subsurface concentrations, or inconsistent attenuation factors.
Data Set 2 (2008): Subset of Data Set 1 (2008) with indoor air concentrations greater than the 95th percentile background indoor air concentrations (Table 4) or the reporting limits (if higher than the 95th percentile).
Figure 10. Indoor air versus subslab concentrations.

March 4, 2008 U.S. EPA’s Vapor Intrusion Database
The findings and conclusions in this report have not been formally disseminated by EPA and should not be construe to represent any Agency determination or policy.
32
1.0E-05
1.0E-04
1.0E-03
1.0E-02
1.0E-01
1.0E+00
0% 20% 40% 60% 80% 100%
Cumulative Percentile
Subs
lab
Att
enua
tion
Fact
or
Data Set 1 (2002)
Data Set 1 (2008)
(a) Data Set 1 (2002 & 2008)
1.0E-05
1.0E-04
1.0E-03
1.0E-02
1.0E-01
1.0E+00
0% 20% 40% 60% 80% 100%
Cumulative Percentile
Subs
lab
Atte
nuat
ion
Fact
or
Data Set 2 (2002)
Data Set 2 (2008)
(b) Data Set 2 (2002 & 2008)
Data Set 1 (2008): Subset of 2008 database remaining after screening out data with subsurface concentrations less than reporting limits, field notes indicating the presence of background sources, indoor air concentrations greater than subsurface concentrations, or inconsistent attenuation factors.
Data Set 1 (2002): Subset of 2002 database with subsurface and indoor air concentrations higher than the reporting limits.
Data Set 2 (2008): Subset of Data Set 1 (2008) with indoor air concentrations greater than the 95th percentile background indoor air concentrations (Table 4) or the reporting limits (if higher than the 95th percentile).
Data Set 2 (2002): Subset of Data Set 1 (2002) with indoor air concentration above the geometric mean of the background indoor air concentrations included in Appendix F of EPA’s draft vapor intrusion guidance (U.S. EPA, 2002).
Figure 11. Cumulative percentile plots of subslab-to-indoor-air attenuation factors.

March 4, 2008 U.S. EPA’s Vapor Intrusion Database
The findings and conclusions in this report have not been formally disseminated by EPA and should not be construe to represent any Agency determination or policy.
33
Data Set 1 Data Set 1 Data Set 2 Data Set 2Statistic 2002 2008 2002 2008
Min 1.7E-04 2.5E-05 1.5E-04 7.2E-055% 3.4E-04 4.5E-04 2.5E-04 5.0E-04
25% 2.7E-03 1.9E-03 9.0E-04 1.8E-0350% 8.9E-03 5.5E-03 5.0E-03 5.0E-0375% 9.4E-02 2.8E-02 3.5E-02 9.8E-0395% 5.1E-01 4.8E-01 5.0E-01 1.5E-01Max 6.9E-01 9.6E-01 7.5E-01 8.8E-01
Count All 45 991 16 311Count IA > RL 45 876 16 311Count IA < RL 0 115 0 0
No. of Sites 1 15 1 13
1.0E-05
1.0E-04
1.0E-03
1.0E-02
1.0E-01
1.0E+00
Dat
a Se
t 1 (2
002)
Dat
a Se
t 1 (2
008)
Dat
a Se
t 2 (2
002)
Dat
a Se
t 2 (2
008)
Subs
lab
AF
Max
95th%
50th%
5th%
Min
Top and bottom of the “box” indicate the 75th and 25th percentiles, respectively. Data Set 1 (2008): Subset of 2008 database remaining after screening out data with subsurface concentrations less than reporting limits, field notes indicating the presence of background sources, indoor air concentrations greater than subsurface concentrations, or inconsistent attenuation factors.
Data Set 1 (2002): Subset of 2002 database with subsurface and indoor air concentrations higher than the reporting limits.
Data Set 2 (2008): Subset of Data Set 1 (2008) with indoor air concentrations greater than the 95th percentile background indoor air concentrations (Table 4) or the reporting limits (if higher than the 95th percentile).
Data Set 2 (2002): Subset of Data Set 1 (2002) with indoor air concentration above the geometric mean of the background indoor air concentrations included in Appendix F of EPA’s draft vapor intrusion guidance (U.S. EPA, 2002).
Figure 12. Summary statistics for subslab-to-indoor-air attenuation factors.

March 4, 2008 U.S. EPA’s Vapor Intrusion Database
The findings and conclusions in this report have not been formally disseminated by EPA and should not be construe to represent any Agency determination or policy.
34
1.E-03
1.E-02
1.E-01
1.E+00
1.E+01
1.E+02
1.E+03
1.E+04
1.E-02 1.E-01 1.E+00 1.E+01 1.E+02 1.E+03 1.E+04 1.E+05 1.E+06 1.E+07 1.E+08
Indo
or A
ir C
once
ntra
tion
(ug/
m3) EPA Data (IA > RL)
Alpha = 1.0
Alpha = 1E-1
Alpha = 1E-2
Alpha = 1E-3
Alpha = 1E-4
Alpha = 1E-5
Crawlspace (ug/m3)
(a) Data Set 1 (2008)
1.E-03
1.E-02
1.E-01
1.E+00
1.E+01
1.E+02
1.E+03
1.E+04
1.E-02 1.E-01 1.E+00 1.E+01 1.E+02 1.E+03 1.E+04 1.E+05 1.E+06 1.E+07 1.E+08
Indo
or A
ir C
once
ntra
tion
(ug/
m3) EPA Data (IA > RL)
Alpha = 1.0
Alpha = 1E-1
Alpha = 1E-2
Alpha = 1E-3
Alpha = 1E-4
Alpha = 1E-5
Crawlspace (ug/m3)
(b) Data Set 2 (2008) Data Set 1 (2008): Subset of 2008 database remaining after screening out data with subsurface concentrations less than reporting limits, field notes indicating the presence of background sources, indoor air concentrations greater than subsurface concentrations, or inconsistent attenuation factors.
Data Set 2 (2008): Subset of Data Set 1 (2008) with indoor air concentrations greater than the 95th percentile background indoor air concentrations (Table 4) or the reporting limits (if higher than the 95th percentile).
Figure 13. Indoor air versus crawlspace concentrations.

March 4, 2008 U.S. EPA’s Vapor Intrusion Database
The findings and conclusions in this report have not been formally disseminated by EPA and should not be construe to represent any Agency determination or policy.
35
1.0E-02
1.0E-01
1.0E+00
1.0E+01
0% 20% 40% 60% 80% 100%
Cumulative Percentile
Cra
wls
pace
Atte
nuat
ion
Fact
or
Data Set 2 (2008)
Data Set 1 (2008)
Data Set 1 (2008): Subset of 2008 database remaining after screening out data with subsurface concentrations less than reporting limits, field notes indicating the presence of background sources, indoor air concentrations greater than subsurface concentrations, or inconsistent attenuation factors.
Data Set 2 (2008): Subset of Data Set 1 (2008) with indoor air concentrations greater than the 95th percentile background indoor air concentrations (Table 4) or the reporting limits (if higher than the 95th percentile).
Figure 14. Cumulative percentile plots of crawlspace-to-indoor-air attenuation factors.

March 4, 2008 U.S. EPA’s Vapor Intrusion Database
The findings and conclusions in this report have not been formally disseminated by EPA and should not be construe to represent any Agency determination or policy.
36
Statistic Data Set 1 (2008) Data Set 2 (2008)Min 3.2E-02 6.5E-025% 1.0E-01 1.2E-01
25% 2.8E-01 1.8E-0150% 6.5E-01 4.8E-0175% 9.6E-01 9.2E-0195% 4.0E+00 6.1E+00Max 1.0E+01 8.5E+00
Count All 110 45Count IA > RL 110 45Count IA < RL 0 0
No. of Sites 4 3
1.0E-02
1.0E-01
1.0E+00
1.0E+01
Dat
a Se
t 1 (2
008)
Dat
a Se
t 2 (2
008)
Cra
wls
pace
AF
Max
95th%
50th%
5th%
Min
Top and bottom of the “box” indicate the 75th and 25th percentiles, respectively. Data Set 1 (2008): Subset of 2008 database remaining after screening out data with subsurface concentrations less than reporting limits, field notes indicating the presence of background sources, indoor air concentrations greater than subsurface concentrations, or inconsistent attenuation factors.
Data Set 2 (2008): Subset of Data Set 1 (2008) with indoor air concentrations greater than the 95th percentile background indoor air concentrations (Table 4) or the reporting limits (if higher than the 95th percentile).
Figure 15. Summary statistics for crawlspace-to-indoor-air attenuation factors.

March 4, 2008 U.S. EPA’s Vapor Intrusion Database
The findings and conclusions in this report have not been formally disseminated by EPA and should not be construe to represent any Agency determination or policy.
37
Statistic Groundwater Soil Gas Subslab Crawlspace0% 1.0E-07 1.3E-06 2.5E-05 3.2E-025% 2.1E-06 5.9E-06 4.5E-04 1.0E-01
25% 1.9E-05 4.2E-04 1.9E-03 2.8E-0150% 6.7E-05 6.3E-03 5.5E-03 6.5E-0175% 2.0E-04 4.9E-02 2.8E-02 9.6E-0195% 1.2E-03 3.5E-01 4.8E-01 4.0E+00
100% 7.4E-02 3.5E+00 9.6E-01 1.0E+01Count All 910 218 991 110
Count IA > RL 877 169 876 110Count IA < RL 33 49 115 0
No. of Sites 36 17 15 4
1.0E-07
1.0E-06
1.0E-05
1.0E-04
1.0E-03
1.0E-02
1.0E-01
1.0E+00
1.0E+01
Gro
undw
ater
Soil
Gas
Subs
lab
Cra
wls
pace
Atte
nuat
ion
Fact
orMax
95th%
50th%
5th%
Min
Top and bottom of the “box” indicate the 75th and 25th percentiles, respectively. Data Set 1 (2008): Subset of 2008 database remaining after screening out data with subsurface concentrations less than reporting limits, field notes indicating the presence of background sources, indoor air concentrations greater than subsurface concentrations, or inconsistent attenuation factors.
Figure 16. Attenuation factor distributions for groundwater, soil gas, subslab, and crawlspace data in Data Set 1 (2008).


U.S. EPA’s Vapor Intrusion Database Attachment A
The findings and conclusions in this report have not been formally disseminated by EPA and should not be construed to represent any Agency determination or policy.
A-1
Attachment A
Vapor Intrusion Access Database Design Documents This attachment contains the data diagram and data dictionary for the Access version of the vapor intrusion database.

U.S. EPA’s Vapor Intrusion Database Attachment A
The findings and conclusions in this report have not been formally disseminated by EPA and should not be construed to represent any Agency determination or policy.
A-2
[This page intentionally left blank.]

U.S. EPA’s Vapor Intrusion Database Attachment A
The findings and conclusions in this report have not been formally disseminated by EPA and should not be construed to represent any Agency determination or policy.
A-3
Vapor Intrusion Access Database Data Diagram, part 1.

U.S. EPA’s Vapor Intrusion Database Attachment A
The findings and conclusions in this report have not been formally disseminated by EPA and should not be construed to represent any Agency determination or policy.
A-4
Locations
location_id
import_loc_id site_id (FK,IE3,IE11)building_id (FK,IE4,IE1)well_id (FK,IE2,IE12)loc_type loc_name loc_int/ext loc_desc latitude longitude loc_county_fips loc_state_fips source_scale floor_num (FK,IE7)ceiling_ht ceiling_ht_unit horz_dist_to_source horz_dist_to_source_unit horz_accuracy_value horz_accuracy_unit horz_datum_code (IE10)horz_collect_method_code (IE9)coord_sys_desc x_coord y_coord coord_units coord_datum coord_zone surf_elev elev_units elev_datum_code (IE6)elev_accuracy_value elev_accuracy_unit elev_collect_method_code (IE5)geometric_type_code (IE8)data_point_sequence surveyor_name survey_number lat_long_coord_date within_site_yn major_basin minor_basin loc_comment time_stamp
Samples
sample_id
original_sample_id (IE4)location_id (FK,IE3,IE2)data_provider_id (FK,IE1,IE6)sample_medium sample_type single_sample_yn sample_start_date sample_start_time sample_duration sample_duration_unit vertical_distance vertical_distance_unit bldg_open_closed (IE5)bp bp_unit outdoor_temp indoor_temp temp_unit windspeed windspeed_unit wind_direction weather_condition sample_method sample_equipment calibration_date chain_of_custody sent_to_lab_date sample_receipt_date sampler_name post_mitigation_yn sample_comment time_stamp
Results
test_result_id
import_result_ID sample_id (FK,IE6,IE1)parameter_id (FK,IE5)parameter_name fraction result_value result_unit result_error_delta result_comment lab_name lab_certification lab_anl_method_code (IE3)lab_sample_id (IE4)lab_analysis_id (IE2)analysis_date dilution_factor MDL PQL reportable_result_yn detect_flag_yn lab_qualifier validation_qualifier (FK)validation_protocol value_type stat_type stat_observations stat_obs_exceed_MDL stat_obs_date_first stat_obs_date_last test_result_comment time_stamp
lt_Floors
floor_num (IE2)
floor_code (IE1)
Sample_Collection_Air
air_sample_id (IE2)
sample_id (FK,IE3,IE1)dedicated_canister_yn sample_height sample_height_unit sample_height_ref sample_elev sample_elev_unit air_sample_comment time_stamp
Sample_Collection_Groundwater
gw_sample_id (IE2)
sample_id (FK,IE1,IE3)sample_toc_yn purge_method sample_profile depth_to_water depth_to_water_unit saturated_thickness saturated_thickness_unit gw_sample_comment time_stamp
Sample_Collection_Soil_Gas
soilgas_sample_id (IE2)
sample_id (FK,IE3,IE1)sample_profile sample_depth sample_depth_unit probe_type probe_seal sample_volume sample_volume_unit vacuum_applied vacuum_applied_unit ground_cover soilgas_sample_comment time_stamp
Sample_Collection_Subslab
subslab_sample_id (IE2)
sample_id (FK,IE1,IE3)probe_type hole_desc sample_volume sample_volume_unit subslab_material subslab_permeability subslab_permeability_unit subslab_moisture subslab_moisture_unit subslab_gap subslab_gap_unit liner_type subslab_sample_comment time_stamp
lt_Parameters
parameter_id (IE2)
parameter_abbrev (IE1)parameter_name cas_number parameter_class organic_yn comment sort_name (IE3)
lt_Data_Qualifiers
qualifier_code
qualifier_description qualifier_sort_order qualifier_rollup_code (IE1)
lt_Sample_Media
media (FK)
lt_Bldg_Open_Choices
bldg_open_closed (FK,IE1)
lt_Sample_Collection_Method
media_code method_name (FK)
method_description
Vapor Intrusion Access Database Data Diagram, part 2.

U.S. EPA’s Vapor Intrusion Database Attachment A
The findings and conclusions in this report have not been formally disseminated by EPA and should not be construed to represent any Agency determination or policy.
A-5
Vapor Intrusion Access Database Data Dictionary Database: \\rtifile02\EHS\Projects\8860-EMRAD_(Opt4)\0208860.004.005-VI_Guidance\Technical_Record\
Database_06\IAVI_Data.mdb Data Structure as of Feb 26,2008 13:37 Table: Alpha_Selections Field Name Type Size Description alpha_select_id Long Integer 4 alpha_type Text 255 IA_id Double 8 SS_id Double 8 SG_id Double 8 GW_id Double 8 CS_id Double 8 alpha_value Double 8 alpha_comment Text 255 alpha_select Boolean 1 alpha_final Boolean 1 Table: Alphas Field Name Type Size Description alpha_id Long Integer 4 Unique ID for each alpha record orig_alpha_id Text 50 Original ID for each alpha value building_id Long Integer 4 Links to Buildings table parameter_id Long Integer 4 Measurement parameter (links to lt_Parameters) alpha_type Text 50 Types of attenuation factors (links to lt_Alpha_Types) alpha_value Double 8 Observed alpha (i.e., attenuation factor) calculated_alpha Double 8 Alpha value calculated using associated results alpha_stat_type Text 20 Statistic type reflected in the alpha_value (link to
lt_Stat_Types) alpha_stat_obs Long Integer 4 Number of observations associated with alpha value ia_result_id Long Integer 4 Test result used for indoor air value in calculating alpha dn_result_id Long Integer 4 Test result used for denominator value (groundwater,
subslab,...) in calculating alpha 2002_guidance_yn Text 1 Was this attenuation factor used in development of EPA’s 2002
IAVI Guidance? (Y=yes, N=no) confounding_factors_yn Text 1 Is there any confounding factors associated with this alpha?
(Y=yes, N=no) confounding_factors Memo 0 Background confounding factors from survey or other source
(e.g., smoking, hobbies, remodeling) alpha_comment Text 255 Comment field time_stamp Date 8 Date/time record was created Use_Alpha Boolean 1 Set true to use in report, false otherwise Table: Aquifers Field Name Type Size Description aquifer_id Long Integer 4 Unique ID for each aquifer record site_id Long Integer 4 Link to Sites table building_id Long Integer 4 Link to Buildings table well_id Long Integer 4 Link to Wells table loc_type Text 50 Distinguishes whether geology applies to entire site, building,
or well gw_region_code Long Integer 4 Numerical code for groundwater region (links to
lt_GW_Region) (Source: Heath, 1984) hydro_setting_code Text 50 Textual code for hydrogeologic setting (links to
lt_Hydrogeologic_Settings) (Source: Aller, et al., 1987)

U.S. EPA’s Vapor Intrusion Database Attachment A
The findings and conclusions in this report have not been formally disseminated by EPA and should not be construed to represent any Agency determination or policy.
A-6
depth_to_water_avg_high Double 8 Long-term average high depth to water table at the site depth_to_water_avg_low Double 8 Long-term average low depth to water table at the site depth_to_water_max Double 8 Historical maximum depth to water measured at the site depth_to_water_min Double 8 Historical minimum depth to water measured at the site depth_to_water_unit Text 20 Unit of measurement for depth to water (applies to avg, min,
max) depth_to_water_ref Text 50 Describes source and/or time period of historical depth to water
measurements. aq_type_code Text 20 Textual code for aquifer type (Links to lt_Aquifer_Types) aq_Kh Double 8 Aquifer horizontal hydraulic conductivity aq_Kh_unit Text 20 Unit of measurement for aquifer horizontal hydraulic
conductivity aq_Kv Double 8 Aquifer vertical hydraulic conductivity aq_Kv_unit Text 20 Unit of measurement for aquifer vertical hydraulic conductivity aq_porosity Double 8 Aquifer porosity aq_porosity_unit Text 20 Unit of measurement for aquifer porosity aq_specific_storage Double 8 Aquifer specific storage aq_specific_storage_unit Text 50 Unit of measurement for aquifer specific storage aq_specific_yield Double 8 Aquifer specific yield aq_specific_yield_unit Text 20 Unit of measurement for aquifer specific yield aq_storage_coefficient Double 8 Aquifer storage coefficient (unitless) aq_organic_carbon Double 8 Aquifer organic carbon content aq_organic_carbon_unit Text 20 Unit of measurement for aquifer organic carbon content aq_avg_transmissivity Double 8 Aquifer average transmissivity aq_avg_transmissivity_unit Text 20 Unit of measurement for aquifer average transmissivity aq_pref_flow_paths Text 255 Aquifer preferential flow paths (e.g., horizontal utility conduits,
sumps, fractures, solution channels) aq_comment Memo 0 Comment field time_stamp Date 8 Date/time record was created Table: Building_Distances Field Name Type Size Description building_id Long Integer 4 Link to Buildings table location_id Long Integer 4 Link to Locations table horz_dist_to_bldg Double 8 Closest horizontal distance from sampling location to building
(not applicable for indoor samples) horz_dist_to_bldg_unit Text 20 Unit of measurement for horizontal distance from sampling
location to building horz_dist_comment Text 255 Comment about building-to-location link time_stamp Date 8 Date/time record was created Table: Buildings Field Name Type Size Description building_id Long Integer 4 Building identifier (aka, subsite) orig_bldg_id Text 50 Original ID number for building data_provider_id Long Integer 4 Company, agency, or individual responsible for completion &
submittal of the VI data. Acts as a link to the Data_Provider table.
site_id Long Integer 4 Link to Sites bldg_name Text 60 Name of building bldg_address1 Text 40 Building address, part one. Street address. bldg_address2 Text 40 Building address, part two. Box number or other info. bldg_city Text 20 City of building or site bldg_state Text 2 Postal abbreviation for State of building or site (links to
lt_States) bldg_zipcode Text 10 Zip code of building or site bldg_county Text 50 Building county (links to lt_Counties) bldg_type Text 50 Physical description of building (links to lt_Building_Types) bldg_use Text 50 Use of building (residential, commercial, industrial, school, etc.)

U.S. EPA’s Vapor Intrusion Database Attachment A
The findings and conclusions in this report have not been formally disseminated by EPA and should not be construed to represent any Agency determination or policy.
A-7
bldg_inhabited_yn Text 1 Indicates whether building is currently inhabited (Y=yes, N=no) structure_height Double 8 Total height of building structure structure_height_unit Text 20 Unit of measurement for building structure height footprint_area Double 8 Footprint area of the building footprint_area_unit Text 20 Unit of measurement for footprint_area perimeter Double 8 Floor-wall seam perimeter perimeter_unit Text 20 Unit of measurement for perimeter seam_gap Double 8 Floor-wall seam gap measurement seam_gap_unit Text 20 Unit of measurement for the floor-wall seam gap num_floor Integer 2 Number of floors in the building (not counting basement or
crawlspace, but including attic if considered part of living space)
construct_year Integer 2 Year building was originally constructed (preceding any renovations or additions)
foundation_type Text 50 Type of foundation for the building (lookup values in lt_Foundation_Types)
fnd_thickness Double 8 Foundation thickness fnd_thickness_unit Text 20 Unit of measurement for foundation thickness fnd_depth_to_base Double 8 Depth to base of foundation (below ground surface) fnd_depth_to_base_unit Text 20 Unit of measurement for depth to base of foundation fnd_integrity Text 100 Foundation integrity (condition, cracks, holes) fnd_material Text 20 Foundation material (poured concrete, concrete block, etc.) hvac_type Text 20 HVAC system type attached_garage_yn Text 1 Indicates if there is an attached garage bldg_dist_to_src Double 8 Shortest distance from building to source bldg_dist_to_src_unit Text 20 Unit of measurement for distance from building to source bldg_depth_to_src_avg Double 8 Average depth to vapor source (below foundation) bldg_depth_to_src_min Double 8 Minimum depth to vapor source (below foundation) bldg_depth_to_src_max Double 8 Maximum depth to vapor source (below foundation) bldg_depth_to_src_unit Text 20 Unit of measurement for depth to vapor source (applies to
average, minimum, and maximum) bldg_vapor_src_media Text 20 Media of vapor source (i.e., groundwater, soil, etc.) bldg_vapor_src_type Text 50 Vapor source type (link to lt_Vapor_Source_Types) bldg_vapor_src_origin Text 150 Origin of the vapor source (UST, spill, landfill, etc.) bldg_pref_flow_paths Text 255 Preferential flow paths into the building er Double 8 JEM variable: ER, air exchange rate (1/hr) er_unit Text 20 Unit of measurement for air exchange rate q_b Double 8 JEM variable: Qb, volumetric flow rate from building (building
ventilation rate) q_b_unit Text 20 Unit of measurement for Qb q_soil Double 8 JEM variable: Qsoil, volumetric flow rate of soil gas into the
enclosed space (soil gas convection rate) q_soil_unit Text 20 Unit of measurement for Qsoil delta_p Double 8 JEM variable: Delta P, pressure differential between the soil
surface and the enclosed space delta_p_unit Text 20 Unit of measurement for Delta P household_survey_yn Text 1 Indicates whether a survey has been conducted to ID vapor
sources household_survey_date Date 8 Date of most recent household survey (in MM/DD/YYYY
format) mitigation_yn Text 1 Indicates whether a vapor intrusion mitigation system is
operating radon_mitigation_yn Text 1 Indicates whether the mitigation system was installed for radon mitigation_type Text 100 Type of vapor mitigation system (e.g., crawlspace ventilation,
subslab ventilation, none) mitigation_date Text 50 Date of mitigation installation confounding_factors Memo 0 Background confounding factors from survey or other source
(e.g., smoking, hobbies, remodeling) response_action Text 50 Action decision based on review of sampling and confounding
factors (lookup values in lt_Response_Actions) bldg_comment Memo 0 Comment field time_stamp Date 8 Date/time record was created

U.S. EPA’s Vapor Intrusion Database Attachment A
The findings and conclusions in this report have not been formally disseminated by EPA and should not be construed to represent any Agency determination or policy.
A-8
Table: Data_Provider Field Name Type Size Description data_provider_id Long Integer 4 Unique ID for data provider data_provider Text 60 Name of company or agency responsible for completion &
submittal of any part of electronic data deliverables data_contact_name Text 30 Name of contact associated with data_provider data_contact_address1 Text 40 Contact street address and/or box number data_contact_address2 Text 40 Site address, part two. Box number or other info. data_contact_city Text 20 City data_contact_state Text 2 Postal abbreviation for State data_contact_zipcode Text 10 Zip code data_contact_email Text 60 Contact e-mail address data_contact_phone Text 60 Contact phone number time_stamp Date 8 Date/time record was created Table: Documents Field Name Type Size Description doc_id Long Integer 4 Unique ID for document data_provider_id Long Integer 4 Link to Data_Providers table site_id Long Integer 4 Link to Sites table building_id Long Integer 4 Link to Buildings table well_id Long Integer 4 Link to Wells table loc_type Text 50 Distinguishes whether document applies to the entire site, a
building, or a well doc_name Text 255 Document descriptive name doc_year Text 4 Document year (for bibliography) doc_desc Text 255 Description for the document doc_date Date 8 Document creation date doc_source Text 255 Document source author_org Text 100 Document author's organization author_name Text 50 Document author's name author_phone Text 20 Document author's phone number doc_url Memo 0 If the document is available on the Internet, what is the website
address (i.e., URL) doc_comments Memo 0 Other comments about the document (e.g., regarding its use or
applicability) public_yn Text 1 Can this information be made available to the public? (Y=yes,
N=no) post_on_site_yn Text 1 Can this document be posted on the website? (Y=yes, N=no) doc_original_format Text 100 Original format of document doc_page_num Integer 2 Number of pages in document doc_file_name_orig Text 50 Electronic file name of original document doc_file_location_orig Text 200 Electronic file location of original document pdf_convert_date Date 8 Date document was converted to pdf ocr_completed_yn Text 1 Is the OCR completed? (Y=yes, N=no) date_to_copycenter Date 8 Date document was sent to the copy center copycenter_tracking_num Text 50 Tracking number of document for copy center copycenter_requestby_date Date 8 Requested return date from copy center date_from_copycenter Date 8 Date that document was received back from the copy center doc_file_name_final Text 50 Electronic file name of final document doc_file_location_final Text 200 Electronic file location of final document doc_hardcopy_location Text 100 Physical location of document (room, file cabinet ...) date_QC_completed Date 8 Date that QC was completed time_stamp Date 8 Date/time record was created

U.S. EPA’s Vapor Intrusion Database Attachment A
The findings and conclusions in this report have not been formally disseminated by EPA and should not be construed to represent any Agency determination or policy.
A-9
Table: HLC_FROM_SCDM97 Field Name Type Size Description CHEMNAME Text 65 CASNUM Text 11 CASNUM2 Text 15 HLC Double 8 R_HLC Text 8 MOLECWT Double 8 Table: Locations Field Name Type Size Description location_id Long Integer 4 Unique ID for each location import_loc_id Text 25 ID assigned by RTI for import site_id Long Integer 4 Link to Sites table building_id Long Integer 4 Link to Buildings table well_id Long Integer 4 Link to Wells table loc_type Text 50 Location type (site, building, or well) loc_name Text 100 Location name loc_int/ext Text 20 Interior or exterior location loc_desc Text 255 Additional description of location (e.g., which floor?, designated
use of room) latitude Double 8 Latitude of location in decimal degrees (dd.xxxxxx) longitude Double 8 Longitude of location in decimal degrees. Must be negative for
western hemisphere (-ddd.xxxxxx). loc_county_fips Text 5 5-digit county FIPS code (links to lt_Counties) loc_state_fips Text 2 2-digit state FIPS code (links to lt_States) source_scale Text 10 Scale of the information source (map, air photo, etc.) used to
determine the lat/long coordinates floor_num Text 50 If location type is building, which floor (links to lt_Floors) ceiling_ht Double 8 Distance from floor to ceiling; default=8 ft ceiling_ht_unit Text 50 Unit of measurement for ceiling height horz_dist_to_source Double 8 Closest horizontal distance from sampling location to source horz_dist_to_source_unit Text 20 Unit of measurement for horizontal distance from sampling
location to source horz_accuracy_value Double 8 Accuracy range (+/-) of the lat/long coordinates. Record only
the least accurate measurement, whether it is for longitude or latitude.
horz_accuracy_unit Text 10 Unit of the horizontal accuracy value horz_datum_code Text 3 Reference datum used to determine the latitude and longitude
measurements horz_collect_method_code Text 2 Method used to determine the latitude and longitude
measurements coord_sys_desc Text 3 Cartographic location coordinate system description for
x_coord & y_coord. Valid Values = UTM, and SP (for State Plane).
x_coord Double 8 x coordinate in system specified by Agency requiring submittal. System identified by coord_sys_desc. Coordinates must be ready for plotting without shifts or off-sets.
y_coord Double 8 y coordinate in system specified by Agency requiring submittal. System identified by coord_sys_desc. Coordinates must be ready for plotting without shifts or off-sets.
coord_units Text 10 Units for cartographic coordinate system identified by coord_sys_desc
coord_datum Text 3 Datum for cartographic xy coordinate system. May be different datum from horz_datum_code. Defaults to horz_datum_code if Null.
coord_zone Text 15 Cartographic coordinate system zone. Indicate the UTM Zone or State Plane Zone.

U.S. EPA’s Vapor Intrusion Database Attachment A
The findings and conclusions in this report have not been formally disseminated by EPA and should not be construed to represent any Agency determination or policy.
A-10
surf_elev Double 8 Land surface elevation at location. For surface water samples, use elevation of water surface. For sediment samples, use elevation of top of sediment.
elev_units Text 50 Units for surface elevation elev_datum_code Text 3 Datum for elevation measurements elev_accuracy_value Double 8 Accuracy range (+/-) of the elevation measurement elev_accuracy_unit Text 10 Units for elevation accuracy elev_collect_method_code Text 2 Method used to determine the land surface elevation of the
location geometric_type_code Text 10 Usually Point for sample location data. Use Line or Area for
GPS data describing site, building, road, railroad, pond edge, landfill perimeter, etc. Valid values: P = point, L = Line & A = area.
data_point_sequence Double 8 Number indicating the sequence in which points on a line or area are connected. Null if geometric_type_code = "P", required if geometric_type_code = "A" or "L". For an area, the maximum point is connected to the first.
surveyor_name Text 255 Name of surveyor company performing survey. Name of individual that collected the sample. FORMAT: COMPANY NAME, ADDRESS, CITY, STATE, ZIP CODE, SURVEYOR LASTNAME_SURVEYOR FIRSTNAME. NOTE use of "_" as a separator!
survey_number Text 20 Unique identification of location survey history. Usually = 1 if location has been determined only once. May be 2 or more if location has been re-surveyed or re-determined.
lat_long_coord_date Date 8 Date location coordinates were determined. within_site_yn Text 1 Indicates whether this location is within site boundaries. Enter
"Y" for yes or "N" for no. major_basin Text 8 Major basin; controlled vocabulary using HUC (Hydrologic Unit
Codes). The first 8 digits of the HUC code should be entered here.
minor_basin Text 6 Minor basin; controlled vocabulary using HUC codes. Any digits after the 8th (first 8 are reported in major_basin) should be reported here.
loc_comment Memo 0 Comment about latitude, longitude and vertical elevation. Store information about the collection method, post processing of the data (if GPS were involved), or description of feature of the facility represented by the coordinates.
time_stamp Date 8 Date/time record was created Table: lt_Alpha_Types Field Name Type Size Description alpha_type Text 50 types of attenuation factors Table: lt_Aquifer_Types Field Name Type Size Description aq_type_code Text 20 Aquifer type code (abbreviated description) aq_type_desc Text 100 Aquifer type description Table: lt_Bldg_Open_Choices Field Name Type Size Description bldg_open_closed Text 20 Building open or closed 24 hours prior to sampling (e.g., open,
closed, "somewhat"????)

U.S. EPA’s Vapor Intrusion Database Attachment A
The findings and conclusions in this report have not been formally disseminated by EPA and should not be construed to represent any Agency determination or policy.
A-11
Table: lt_Building_Types Field Name Type Size Description bldg_type Text 50 Physical description of building Table: lt_Counties Field Name Type Size Description county_fips Text 5 County fips code county_name Text 25 County name county_state Text 2 County state Table: lt_Data_Qualifiers Field Name Type Size Description qualifier_code Text 10 Data qualifier code for result value qualifier_description Text 255 Data qualifier description qualifier_sort_order Integer 2 Preferred sort order for data qualifiers qualifier_rollup_code Integer 2 Qualifier code applied when analytical results with data
qualifiers are combined Table: lt_Floors Field Name Type Size Description floor_num Text 50 floor_code Long Integer 4 Table: lt_Foundation_Types Field Name Type Size Description foundation_type Text 50 Building foundation types (lookup values for Buildings table) Table: lt_GW_Regions Field Name Type Size Description gw_region_code Long Integer 4 Number code for groundwater region gw_region_desc Text 100 Groundwater regions textual description (Heath, 1984) Table: lt_Hydrogeologic_Settings Field Name Type Size Description hydro_setting_code Text 10 Hydrogeologic setting code (from DRASTIC settings by Aller et
al., 1987) hydro_setting_desc Text 255 Hydrogeologic setting description gw_region_code Long Integer 4 Code for related groundwater region (Heath, 1984) Table: lt_Parameters Field Name Type Size Description parameter_id Long Integer 4 Unique ID for each measurement parameter parameter_abbrev Text 10 Short abbreviation for measurement parameter (e.g., MEK, BP) parameter_name Text 50 Measurement parameter name (e.g., 2-butanone, barometric
pressure) cas_number Text 15 Chemical Abstract System number (where applicable) parameter_class Text 50 Parameter class or grouping

U.S. EPA’s Vapor Intrusion Database Attachment A
The findings and conclusions in this report have not been formally disseminated by EPA and should not be construed to represent any Agency determination or policy.
A-12
organic_yn Text 1 Must be either "Y" for organic constituents or "N" for inorganic constituents
HLC25 Double 8 Henry's Law Constant at 25 degrees C (unitless) DeltaH Double 8 Enthalpy of vaporization at the normal boiling point (cal/mol) Tc Double 8 Critical temperature (degrees Kelvin) Tb Double 8 Normal boiling point (degrees Kelvin) comment Text 255 sort_name Text 50 parameter name used for sorting Table: lt_Response_Actions Field Name Type Size Description response_action Text 50 Action decisions based on review of sampling and confounding
factors Table: lt_Sample_Collection_Method Field Name Type Size Description media_code Text 50 Code for type of media sampled (Air, GW, SG, SS) method_name Text 50 Name of each sampling method method_description Text 50 Short description of each sampling method Table: lt_Sample_Media Field Name Type Size Description media Text 50 Media sample type Table: lt_Soil_Textures Field Name Type Size Description soil_txt_code Text 10 soil texture code (links to Soils table) soil_txt_name Text 50 soil texture name soil_txt_desc Text 255 Description of soil texture from IAVI guidance document Table
4, p. 35 Table: lt_Stat_Types Field Name Type Size Description stat_type Text 20 Statistic type Table: lt_States Field Name Type Size Description state_fips Text 2 State fips code state_name Text 50 State name state_abbrev Text 2 State abbreviation Table: lt_Units Field Name Type Size Description unit_type Text 20 Type or category for which the units are applicable (used to
limit list in forms) unit_code Text 20 Reported unit (abbreviation) unit_desc Text 100 Description of unit (unabbreviated) unit_pref Boolean 1 Indicates which is the preferred unit for the unit_type (used for
setting default value)

U.S. EPA’s Vapor Intrusion Database Attachment A
The findings and conclusions in this report have not been formally disseminated by EPA and should not be construed to represent any Agency determination or policy.
A-13
Table: lt_Vapor_Source_Types Field Name Type Size Description vapor_src_type Text 50 Vapor source types Table: Results Field Name Type Size Description test_result_id Long Integer 4 Unique ID for test result import_result_id Text 25 Result ID assigned by RTI for data imports sample_id Long Integer 4 Sample ID that this test result is for - linked to Samples parameter_id Long Integer 4 Link to lt_Parameters. Identifies the measurement parameter
that the results measure. parameter_name Text 50 Measurement Parameter name (e.g., 2-butanone, Barometric
Pressure) fraction Text 10 Portion of the sample or substance being analyzed. Eg. T
=total, D=dissolved, etc result_value Double 8 Analytical result, field measurement, or statistical calculation result_unit Text 15 Units of measurement for the result (and result_error_delta) result_error_delta Text 20 Error range applicable to the result value; typically used only
for radiochemistry results result_comment Text 255 Result-specific comments lab_name Text 50 Name of laboratory lab_certification Text 50 Laboratory certification (State, NELAC, etc.) lab_anl_method_code Text 35 Laboratory analytical method code lab_sample_id Text 20 Sample ID used internally by laboratory lab_analysis_id Text 20 Analysis ID used internally by laboratory analysis_date Date 8 Date of sample analysis (in MM/DD/YYYY format) dilution_factor Double 8 Dilution factor at which the analyte was measured effectively.
Enter "1" if not diluted. MDL Text 20 Method detection limit PQL Text 20 Practical quantitation limit reportable_result_yn Text 3 Must be "Y" for results considered to be reportable, or "N" for
other results detect_flag_yn Text 1 Must be either "Y" for detected analytes or "N" for non_detects lab_qualifier Text 7 Data qualifier specified by the laboratory performing the
analyses validation_qualifier Text 7 Data qualifier specified by the validation officer (lookup codes
in lt_Data_Qualifiers) validation_protocol Text 255 Validation protocol (AFCEE, unknown, etc.) value_type Text 12 Value type reflected in result_value. Valid values: "actual",
"estimated", "interpolated" or "calculated". stat_type Text 20 Statistic type reflected in the result_value (links to
lt_Stat_Types) stat_observations Integer 2 Number of observations used to determine result_value (can
be 1 for single measurement) stat_obs_exceed_MDL Integer 2 Number of observations used to determine result_value which
exceeded the MDL stat_obs_date_first Date 8 Earliest date of sample used to determine result_value stat_obs_date_last Date 8 Latest date of sample used to determine result_value test_result_comment Memo 0 Comment field time_stamp Date 8 Date/time record was created

U.S. EPA’s Vapor Intrusion Database Attachment A
The findings and conclusions in this report have not been formally disseminated by EPA and should not be construed to represent any Agency determination or policy.
A-14
Table: Sample_Collection_Air Field Name Type Size Description air_sample_id Long Integer 4 Unique ID for air samples (indoor or outdoor) sample_id Long Integer 4 Link to Samples table dedicated_canister_yn Text 1 Indicates whether dedicated canisters were used for sampling
(Y=yes, N=no) sample_height Double 8 Height of sample location sample_height_unit Text 20 Unit of measurement for sample height sample_height_ref Text 20 Reference point for sample height (e.g., indoor - floor, outdoor -
ground surface) sample_elev Double 8 Elevation of sample location, mean sea level sample_elev_unit Text 20 Unit of measurement for sample elevation air_sample_comment Memo 0 Comment field time_stamp Date 8 Date/time record was created Table: Sample_Collection_Groundwater Field Name Type Size Description gw_sample_id Long Integer 4 Unique ID for groundwater samples sample_id Long Integer 4 Link to Samples table sample_toc_yn Text 1 Sampled at top of water column (Y=yes, N=no) purge_method Text 50 Purge method (minimum drawdown, standard, etc.) sample_profile Text 50 Vertical profile or single sample depth_to_water Double 8 Depth to water (below land surface) at time of sampling depth_to_water_unit Text 20 Unit of measurement for depth to water saturated_thickness Double 8 Saturated thickness at time of sampling saturated_thickness_unit Text 20 Unit of measurement for saturated thickness gw_sample_comment Memo 0 Comment field time_stamp Date 8 Date/time record was created Table: Sample_Collection_Soil_Gas Field Name Type Size Description soilgas_sample_id Long Integer 4 Unique ID for soil gas samples sample_id Long Integer 4 Link to Samples table sample_profile Text 50 Vertical profile or single sample sample_depth Double 8 Sample depth, below land surface sample_depth_unit Text 20 Unit of measurement for sample depth probe_type Text 20 Probe type (permanent or temporary) probe_seal Text 100 Probe seal description sample_volume Double 8 Purge/sample volume; Radius of influence sample_volume_unit Text 20 Unit of measurement for sample volume vacuum_applied Double 8 Vacuum applied vacuum_applied_unit Text 20 Unit of measurement for vacuum applied ground_cover Text 50 Ground cover (paved, grassy, etc.) soilgas_sample_comment Memo 0 Comment field time_stamp Date 8 Date/time record was created Table: Sample_Collection_Subslab Field Name Type Size Description subslab_sample_id Long Integer 4 Unique ID for subslab samples sample_id Long Integer 4 Link to Samples table probe_type Text 20 Probe type (permanent or temporary) hole_desc Text 150 Describes how the hole in the subslab was made sample_volume Double 8 Purge/sample volume; radius of influence sample_volume_unit Text 50 Unit of measurement for sample volume subslab_material Text 20 Subslab material (gravel, consolidated soil, etc.) subslab_permeability Double 8 Subslab measured permeability

U.S. EPA’s Vapor Intrusion Database Attachment A
The findings and conclusions in this report have not been formally disseminated by EPA and should not be construed to represent any Agency determination or policy.
A-15
subslab_permeability_unit Text 20 Unit of measurement for subslab measured permeability subslab_moisture Double 8 Subslab moisture content subslab_moisture_unit Text 20 Unit of measurement for subslab moisture content subslab_gap Double 8 Subslab gap measurement; distance between the bottom of the
slab and the ground surface subslab_gap_unit Text 20 Unit of measurement for subslab gap liner_type Text 20 Vapor barrier; Moisture barrier; None subslab_sample_comment Memo 0 Comment field time_stamp Date 8 Date/time record was created Table: Samples Field Name Type Size Description sample_id Long Integer 4 Unique ID for each sample original_sample_id Text 40 Sample ID in original source location_id Long Integer 4 Location ID where sample was taken - linked to Locations table data_provider_id Long Integer 4 Data Provider's ID - Linked to Data_Provider table sample_medium Text 20 Medium within which this measurement was taken. (Links to
lt_Sample_Media) sample_type Text 30 sample type (e.g., routine, duplicate-lab, duplicate-field, QC,
field measurement) single_sample_yn Text 1 Indicates whether reported value is for a single sample (Y=yes)
or multiple samples (N=no). For multiple samples, much of the data in this table will not be applicable. Additional statistics should be recorded in the Test_Results table.
sample_start_date Date 8 Date sample collection began in (MM/DD/YYYY) format sample_start_time Date 8 Time sample collection began in 24 hour (military) format sample_duration Double 8 Sample duration sample_duration_unit Text 20 Unit of measurement for sample duration vertical_distance Double 8 Sample depth or height relative to land surface vertical_distance_unit Text 20 Unit of measurement for vertical distance bldg_open_closed Text 10 Indicates whether building was open or closed during sampling
(links to lt_Bldg_Open_Choices) bp Double 8 Barometric pressure bp_unit Text 20 Unit of measurement for barometric pressure outdoor_temp Double 8 Outdoor temperature at time of sample collection indoor_temp Double 8 Indoor temperature at time of sample collection temp_unit Text 20 Unit of measurement for temperature windspeed Double 8 Windspeed windspeed_unit Text 20 Unit of measurement for windspeed wind_direction Double 8 Wind direction in degrees (e.g., from 90 degrees = wind from
the east) weather_condition Text 50 Description of weather condition at time of sampling sample_method Text 50 Method of sample collection (link to
lt_Sample_Collection_Method) sample_equipment Text 50 Sample equipment (e.g., Summa, Tedlar, syringe, etc.) calibration_date Date 8 Date that the sampling equipment was last calibrated (in
MM/DD/YYYY format) chain_of_custody Text 15 Chain of custody identifier. A single sample may be assigned to
only one chain of custody. sent_to_lab_date Date 8 Date sample was sent to lab in (MM/DD/YYYY) format sample_receipt_date Date 8 Date that sample was received at laboratory in (MM/DD/YYYY)
format sampler_name Text 50 Name of individual that collected the sample. post_mitigation_yn Text 1 Was this sample taken post-mitigation? (Y=yes, N=no) sample_comment Memo 0 Comments related to the sample time_stamp Date 8 Date/time record was created

U.S. EPA’s Vapor Intrusion Database Attachment A
The findings and conclusions in this report have not been formally disseminated by EPA and should not be construed to represent any Agency determination or policy.
A-16
Table: Sites Field Name Type Size Description site_id Long Integer 4 Unique ID for site data_provider_id Long Integer 4 Company, agency, or individual responsible for submittal of VI
data. Acts as a link to the Data_Provider table. original_site_id Text 20 Site identifier in original source site_name Text 60 Name of site or facility site_address1 Text 40 Site address, part one. Street address. site_address2 Text 40 Site address, part two. Box number or other info. site_city Text 20 City of site site_state Text 2 Postal abbreviation for State of site (links to lt_States) site_zipcode Text 10 Zip code of site site_county Text 50 County name (links to lt_Counties) program Text 20 Identifies the program under which the operable unit or area is
investigated. (RCRA, CERCLA, etc.) prp_agency Text 60 Name of potential responsible party (prp) or equivalent - not
necessarily the data provider prp_contact_name Text 30 Contact name for prp_agency prp_phone_number1 Text 60 Phone number for prp_contact_name prp_fax_number Text 60 Fax number for prp_contact_name prp_phone_number2 Text 60 Alternative phone number for prp_contact_name prp_email Text 60 E-mail address for prp_contact_name site_depth_to_src_avg Double 8 Average depth to source at the site site_depth_to_src_min Double 8 Minimum depth to source at the site site_depth_to_src_max Double 8 Maximum depth to source at the site site_depth_to_src_unit Text 20 Unit of measurement for depth to source (applies to avg, min,
max) site_vapor_src_media Text 20 Vapor source media (e.g., groundwater, vadose zone) site_vapor_src_type Text 50 Vapor source type (link to lt_Vapor_Source_Types) site_vapor_src_origin Text 255 Origin of the vapor source (UST, spill, landfill, etc.) gw_temp Double 8 Groundwater temperature for the site (used in calculating
temperature specific Henry's law constant for groundwater alphas)
topographic_relief Double 8 Grade at the site climate_temp_regime Text 50 Climate temperature regime description (e.g., subtropical,
temperate) climate_wind_regime Text 20 Climate wind regime description (e.g., calm, windy, seasonal) climate_precipitation Text 50 Climate precipitation regime description (e.g., humid, arid,
semi-arid) petroleum_site_yn Text 1 Y = petroleum site, N = nonpetroleum site public_yn Text 1 Can this information be made available to the public? (Y=yes,
N=no) site_comment Memo 0 Comment field time_stamp Date 8 Date/time record was created Table: Soils Field Name Type Size Description soil_id Long Integer 4 Unique ID for each soil record site_id Long Integer 4 Link to Sites table building_id Long Integer 4 Link to Buildings table well_id Long Integer 4 Link to Wells table loc_type Text 50 Distinguishes whether geology applies to entire site, building,
or well surface_elev Double 8 Ground surface elevation, mean sea level surface_elev_unit Text 50 Unit of measurement for surface elevation vz_layer Text 50 Name or description of vadose zone layer vz_depth_to_top Double 8 Depth to top of vadose zone, below land surface vz_depth_to_top_unit Text 20 Unit of measurement for depth to top of vadose zone vz_thickness Double 8 Vadose zone thickness vz_thickness_unit Text 20 Unit of measurement for vadose zone thickness

U.S. EPA’s Vapor Intrusion Database Attachment A
The findings and conclusions in this report have not been formally disseminated by EPA and should not be construed to represent any Agency determination or policy.
A-17
vz_fracture_status Text 50 Vadose zone fracture status (vertical or horizontal) vz_fracture_density Text 4 Vadose zone fracture status density (high or low) vz_soil_txt_code Text 10 Vadose zone soil texture (Links to lt_Soil_Textures) vz_alt_soil_desc Text 255 Alternate soil description (may be more specific then
vz_soil_txt_code) vz_permeability Double 8 Vadose zone permeability (measured value) vz_permeability_unit Text 20 Unit of measurement for vadose zone permeability vz_moisture_content Double 8 Vadose zone moisture content (measured value) vz_moisture_content_unit Text 20 Unit of measurement for vadose zone moisture content vz_bulk_density Long Integer 4 Vadose zone bulk density vz_bulk_density_unit Text 20 Unit of measurement for vadose zone bulk density vz_porosity Double 8 Vadose zone porosity vz_porosity_unit Text 20 Unit of measurement for vadose zone porosity vz_organic_carbon Double 8 Vadose zone organic carbon content vz_organic_carbon_unit Text 20 Unit of measurement for vadose zone organic carbon content vz_pref_flow_paths Text 255 Vadose zone preferential flow paths (e.g., horizontal utility
conduits, sumps, fractures) soil_comment Memo 0 Comment field time_stamp Date 8 Date/time record was created Table: Unit_Conversions Field Name Type Size Description sample_media Text 50 result_unit Text 15 convert from converted_unit Text 50 convert to conversion_factor Double 8 converts to ug/m3 (multiplication factor) notes Text 50 Table: Versions Field Name Type Size Description ver_num Single 4 Version number of current database Table: Wells Field Name Type Size Description well_id Long Integer 4 Unique ID for each well site_id Long Integer 4 Link to Sites orig_well_id Text 20 Well identifier in original source total_depth Double 8 Total depth of well, boring, direct push, etc. below land surface depth_to_bedrock Double 8 Depth to bedrock below land surface depth_to_top_of_screen Double 8 Depth below land surface to the top of the well screen. This
information is required to obtain the vertical location from which the groundwater sample was taken.
depth_to_bottom_of_screen Double 8 Depth below land surface to bottom of well screen. This information is required to obtain the vertical location from which the groundwater sample was taken.
depth_unit Text 20 Unit of measurement for depths (applies to total depth, depth to bedrock, depth to top of screen, and depth to bottom of screen)
top_casing_elev Double 8 Elevation of the top of protective casing reference_point_elev Double 8 Elevation of reference point for depth to groundwater
measurements. Use high point on inner well casing (riser) as the measuring point for depths to water. May be different from surf_elev and top_casing_elev.
elev_unit Text 20 Unit of measurement for elevations (applies to top of casing and reference point)
step_or_linear Text 6 Use only for re-surveys of well elevations. If a section of the well casing was removed or added use "step" as the value. If

U.S. EPA’s Vapor Intrusion Database Attachment A
The findings and conclusions in this report have not been formally disseminated by EPA and should not be construed to represent any Agency determination or policy.
A-18
nothing was added or removed from the last survey use "linear" as the value.
reference_point_datum_code Text 3 Datum used to determine the reference_point_elev. May be different from horz_datum_code and elev_datum_code.
reference_point_desc Text 255 Description of the reference_point, such as "top of well casing" used for measurement of depth or depth to water."
reference_point_start_date Date 8 Date current datum was first used. Leave null if sample is not from well.
water_level_avg_high Double 8 Long-term average high water level (m, depth below land surface)
water_level_avg_low Double 8 Long-term average low water level (m, depth below land surface)
well_comment Memo 0 Comment field time_stamp Date 8 Date/time record was created

U.S. EPA’s Vapor Intrusion Database Attachment B
The findings and conclusions in this report have not been formally disseminated by EPA and should not be construed to represent any Agency determination or policy.
B-1
Attachment B
Vapor Intrusion Spreadsheet Documentation
This attachment contains the user’s guide and the data dictionary for the spreadsheet version of the vapor intrusion database.

U.S. EPA’s Vapor Intrusion Database Attachment B
The findings and conclusions in this report have not been formally disseminated by EPA and should not be construed to represent any Agency determination or policy.
B-2
[This page intentionally left blank.]

U.S. EPA’s Vapor Intrusion Database Attachment B
The findings and conclusions in this report have not been formally disseminated by EPA and should not be construed to represent any Agency determination or policy.
B-3
EPA OSWER Vapor Intrusion Database Spreadsheet User’s Guide
To Use the Spreadsheet Filters (Database Folder) 1. Reset the spreadsheet by clicking on the “Reset Spreadsheet” button.
2. Select the media you want to work with and display in the graphs by clicking on the
“Select Subsurface Media” button.
3. Enter the desired filters in the Site, Chemical, Soil, and Building Filters areas (colored cells). Alternatively, you can use Excel’s autofilter function to select subsets of data.
4. To calculate statistics for the selected media and filter criteria:
If you entered the filter criteria in the colored cells, click the “Apply Filters and Calculate Statistics” button.
If you entered the filter criteria using Excel’s Autofilter feature, click the “Autofilter and Calculate Statistics” button.
Note: All the macros in the spreadsheet require that the spreadsheet be in “Ready” mode to work (see bottom left corner of the spreadsheet). If the spreadsheet is in “Enter” or “Edit” mode, simply press the <Enter> key.
To Add New Data (Database Folder)
1. Please read the background information (below) explaining how the spreadsheet is
constructed to ensure successful data entry.
2. Append new site data to the end of the spreadsheet directly after the last record, starting
in column BA. 3. Copy the formulas in Columns A through AZ to the left of the newly entered data.
4. Append the site name and any relevant site information to the lists in the FilterLists
folder. Background Information About How The Spreadsheet Is Constructed
Understanding this information is critical to maintaining a functioning spreadsheet when adding data.
The spreadsheet relies on Excel’s built-in Advanced Filter feature. The filter criteria used to filter the data are contained in cells A36 to AA37 (colored cells). The headings in these cells MUST be the same as the headings for the data. If you change any of the headings in these cells, you also must change them in the underlying database.
The X-Y plots show only the data remaining after the filters are applied. This is possible through a built in feature of Excel: Tools>Options>Chart>Plot Visible Cells Only. This feature requires that blank cells actually be blank (i.e., no formulas which return a blank label). A cell with a formula in it that returns a blank within the plotted range of cells will cause the plot to be scaled incorrectly.

U.S. EPA’s Vapor Intrusion Database Attachment B
The findings and conclusions in this report have not been formally disseminated by EPA and should not be construed to represent any Agency determination or policy.
B-4
The box plots and statistics are calculated by running a macro that extracts the filtered data from the Database folder, writes the data to the KMStats and Excel Stats folders, calculates the statistics, and then carries the results back to the Database folder. This means that to ensure the macro operates properly, nothing should be changed in the statistics folders.
The graphs use records 42 through 2402 to plot the existing data in the database. To view newly entered data, it is necessary to select each chart and use Excel’s Add Data feature.
For help, contact:
Helen Dawson [email protected] 303-312-7841

U.S. EPA’s Vapor Intrusion Database Attachment B
The findings and conclusions in this report have not been formally disseminated by EPA and should not be construed to represent any Agency determination or policy.
B-5
Spreadsheet Data Dictionary
Calculated or Copied Fields Calculated or Copied Field Description
Site Name Copy of site or facility name ChemName Copy of chemical name Chem Type CHC = chlorinated hydrocarbon; PHC = petroleum hydrocarbon Soil Texture Code Copy of vadose zone soil texture codes (comma separated);
dominant soil type Soil Type (VC, C or F) VC = very coarse, C = coarse, F = fine Building Name Copy of name of building, local address, local identifier, etc. Bldg Use Copy of use of building (residential, commercial, industrial, school,
etc.) Foundation Type Copy of type of foundation for the building (basement, crawlspace,
slab-on-grade, earthen, basement-partial, etc.) [GW] > RL? (Y,N) Is groundwater concentration [GW] > reporting limit (RL)? Use [GW] Source Strength Filter? (Y,N)
Apply groundwater source strength filter (Y if yes, N if no)?
USE [GW] Alpha? (Y,N) Use groundwater-to-indoor air attenuation factor (Y if yes, N if no)? [GW] Comment Comment on groundwater-to-indoor air attenuation factor [SS] > DL? (Y,N) Is subslab concentration [SS] > reporting limit (RL)? Use [SS] Source Strength Filter?? (Y,N)
Apply subslab source strength filter (Y if yes, N if no)?
USE [SS] Alpha? (Y,N) Use subslab-to-indoor air attenuation factor (Y if yes, N if no)? [SS] Comment Comment on subslab-to-indoor air attenuation factor [SG] > DL? (Y,N) Is soil gas concentration [SG] > reporting limit (RL)? Use [SG] Source Strength Filter?? (Y,N)
Apply soil gas source strength filter (Y if yes, N if no)?
USE [SG] Alpha? (Y,N) Use soil gas-to-indoor air attenuation factor (Y if yes, N if no)? [SG] Comment Comment on subslab-to-indoor air attenuation factor [CS] > DL? (Y,N) Is crawlspace concentration [CS] > reporting limit (RL)? Use [CS] Source Strength Filter?? (Y,N)
Apply crawlspace source strength filter (Y if yes, N if no)?
USE [CS] Alpha? (Y,N) Use crawlspace-to-indoor air attenuation factor (Y if yes, N if no)? [CS] Comment Comment on crawlspace-to-indoor air attenuation factor [IA] > DL? (Y,N) Is indoor air concentration [IA] > reporting limit (RL)? [IA] > Backgrnd Filter? (Y,N) Apply indoor air source strength filter (Y if yes, N if no)? USE [IA] Data? (Y,N) Use indoor air data (Y if yes, N if no)? [IA] Comment Comment on indoor air data

U.S. EPA’s Vapor Intrusion Database Attachment B
The findings and conclusions in this report have not been formally disseminated by EPA and should not be construed to represent any Agency determination or policy.
B-6
Calculated or Copied Fields Calculated or Copied Field Description
Subsurface Concentration Subsurface concentrations (groundwater, soil gas, subslab, crawlspace) used in charts
Subsurface Alpha Attenuation factor (groundwater, soil gas, subslab, crawlspace) used in charts
Alpha Detect Flag (Y=1,N=0) Field used for calculating Kaplan-Meier statistics Alpha Nondetect Flag (Y=1,n+0)
Field used for calculating Kaplan-Meier statistics
copy of [gw] in ug/L Copy of groundwater [gw] concentrations GW Temp (C); Default=15C Groundwater temperature Predicted [gw_vapor] in ug/m3 Calculated vapor concentration in equilibrium with groundwater
concentration copy of [ss] in ug/m3 Copy of subslab concentration (all data converted to units of ug/m3) copy of [sg] in ug/m3 Copy of soil gas concentration (all data converted to units of ug/m3) copy of [cs] in ug/m3 Copy of crawslpace concentration (all data converted to units of
ug/m3) copy of [ia] in ug/m3 Copy of indoor air concentration (all data converted to units of
ug/m3) 95th % IA_Background 95th percentile value of background indoor air concentrations ia/gw alpha Groundwater-to-indoor air attenuation factor ia/ss alpha Subslab-to-indoor air attenuation factor ia/sg alpha Soil gas-to-indoor air attenuation factor ia/cs alpha crawlspace-to-indoor air attenuation factor IA/GW Detect Flag (Y=1,N=0) Field used for calculating Kaplan-Meier statistics IA/GW Non-Detect Flag (Y=1,N=0)
Field used for calculating Kaplan-Meier statistics
IA/SS Detect Flag (Y=1,N=0) Field used for calculating Kaplan-Meier statistics IA/SS Non-Detect Flag (Y=1,N=0)
Field used for calculating Kaplan-Meier statistics
IA/SG Detect Flag (Y=1,N=0) Field used for calculating Kaplan-Meier statistics IA/SG Non-Detect Flag (Y=1,N=0)
Field used for calculating Kaplan-Meier statistics
IA/CS Detect Flag (Y=1,N=0) Field used for calculating Kaplan-Meier statistics IA/CS Non-Detect Flag (Y=1,N=0)
Field used for calculating Kaplan-Meier statistics
Data Fields Data Field Descriptions
site_id Unique numeric ID for site site_name Name of site or facility texture_Codes Vadose zone soil texture codes (comma separated); dominant soil
type

U.S. EPA’s Vapor Intrusion Database Attachment B
The findings and conclusions in this report have not been formally disseminated by EPA and should not be construed to represent any Agency determination or policy.
B-7
Data Fields Data Field Descriptions
alt_desc Alternate soil description hydrogeologic Setting Hydrogeologic setting of site source Type Type of source (dissolved groundwater, LNAPL, DNAPL, vadose
zone) building_id Unique numeric building ID (aka, subsite) bldg_name Name of building, local address, local identifier, etc. bldg_type Physical description of building: e.g., single family residence, one-
story residence, etc. bldg_use Use of building (residential, commercial, industrial, school, etc.) foundation_type Type of foundation for the building (basement, crawlspace, slab-on-
grade, earthen, basement-partial, etc.) depth_to_foundation Depth to base of foundation (below ground surface) depth_to_foundation_unit Unit for foundation depth bldg_depth_to_src_avg Average depth to vapor source (below foundation) bldg_depth_to_src_unit Units of depth to source bldg_vapor_src_type Vapor source type (aqueous, NAPL, etc..) confounding_factors Background confounding factors from survey or other source (e.g.,
smoking, hobbies, remodeling) bldg_comment Building-specific comments parameter_name Measurement Parameter name (e.g., trichloroethene, 1,1,1-
trichloroethane) ia_location Building name and floor (e.g., building id (basement), building
name (lowest living), etc.) ia_sample_type Sampling method (Summa 24 hr, Tedlar grab, etc) ia_lab_method Analytical method (TO-15, TO-17, etc.) ia_date_first First (or only) date of indoor air sampling ia_date_last Last date of indoor air sampling ia_value_type Indoor air value type (actual, mean, max) ia_result Indoor air result ia_result_unit Units of indoor air result ia_comment Indoor air result comment ia_MDL_PQL_RL Indoor air method detection limit, practical quantitation limit, or
reporting limit ia_detect_flag_yn Must be either “Y” for detected analytes or “N” for non_detects
(indoor air) ia_result_id unique Id for indoor air result ss_location Subslab sampling location ss_date_first First (or only) date of subslab samping

U.S. EPA’s Vapor Intrusion Database Attachment B
The findings and conclusions in this report have not been formally disseminated by EPA and should not be construed to represent any Agency determination or policy.
B-8
Data Fields Data Field Descriptions
ss_date_last Last date of subslab sampling ss_vert_dist Depth of sampling probe beneath slab base ss_vert_dist_unit Units for subslab sampling point depth ss_value_type Subslab value type (actual, estimated, interpolated, mean, max) ss_result Subslab result ss_result_unit Units of subslab result ss_comment Subslab result comment ss_MDL_PQL_RL Subslab method detection limit, practical quantitation limit, or
reporting limit ss_detect_flag_yn Must be either “Y” for detected analytes or “N” for non_detects
(subslab) ss_alpha_id Unique Id for paired indoor air and subslab results gw_location Groundwater sampling location gw_date_first First (or only) date of groundwater samping gw_date_last Last date of groundwater sampling gw_horiz_dist Horizontal distance of groundwater sampling point (well) from
building it is assigned to gw_horiz_dist_unit Units for horizontal distance of groundwater sampling point gw_vert_dist Depth of groundwater sampling point (well) below ground surface
(bgs) gw_vert_dist_unit Units for groundwater sampling point depth gw_value_type Groundwater value type (actual, estimated, interpolated) gw_result Groundwater result gw_result_unit Units of groundwater result gw_comment Groundwater result comment gw_MDL_PQL_RL Groundwater method detection limit, practical quantitation limit, or
reporting limit gw_detect_flag_yn Must be either “Y” for detected analytes or “N” for non_detects
(groundwater) gw_alpha_id Unique Id for paired indoor air and groundwater results sg_location Soil gas sampling location sg_date_first First (or only) date of soil gas samping sg_date_last Last date of soil gas sampling sg_horiz_dist Horizontal distance of soil gas sampling point (probe) from building
it is assigned to sg_horiz_dist_unit Units for horizontal distance of soil gas sampling point sg_vert_dist Depth of soil gas sampling point (probe) below ground surface (bgs) sg_vert_dist_unit Units for soil gas sampling point depth

U.S. EPA’s Vapor Intrusion Database Attachment B
The findings and conclusions in this report have not been formally disseminated by EPA and should not be construed to represent any Agency determination or policy.
B-9
Data Fields Data Field Descriptions
sg_value_type Soil gas value type (actual, estimated, interpolated, mean, max) sg_result Soil gas result sg_result_unit Units of soil gas result sg_comment Soil gas result comment sg_MDL_PQL_RL Soil gas method detection limit, practical quantitation limit, or
reporting limit sg_detect_flag_yn Must be either “Y” for detected analytes or “N” for non_detects (soil
gas) sg_alpha_id Unique Id for paired indoor air and soil gas results cs_date_first First (or only) date of crawlspace samping cs_date_last Last date of crawlspace sampling cs_value_type Crawlspace value type (actual, mean, max) cs_result Crawlspace result cs_result_unit Units of crawlspace result cs_comment Crawlspace result comment cs_MDL_PQL_RL Crawlspace method detection limit, practical quantitation limit, or
reporting limit cs_detect_flag_yn Must be either “Y” for detected analytes or “N” for non_detects
(crawlspace) cs_alpha_id Unique Id for paired indoor air and crawlspace results oa_date Date of outdoor air sample oa_result Outdoor air result oa_result_unit Units of outdoor air result oa_detect_flag_yn Must be either “Y” for detected analytes or “N” for non_detects
(outdoor air)

U.S. EPA’s Vapor Intrusion Database Attachment C
The findings and conclusions in this report have not been formally disseminated by EPA and should not be construed to represent any Agency determination or policy.
C-1
Attachment C
Vapor Intrusion Database Site Information

U.S. EPA’s Vapor Intrusion Database Attachment C
The findings and conclusions in this report have not been formally disseminated by EPA and should not be construed to represent any Agency determination or policy.
C-2
[This page intentionally left blank.]

U.S. EPA’s Vapor Intrusion Database Attachment C
The findings and conclusions in this report have not been formally disseminated by EPA and should not be construed to represent any Agency determination or policy.
C-3
LIST OF SITES Alameda Naval Air Station (Alameda, CA) ................................................................................... 5 Allepo (Mountain View, CA) ......................................................................................................... 6 Alliant Techsystems (ATK) (Littleton, CO)................................................................................... 7 BP Site (Paulsboro, NJ) .................................................................................................................. 8 CDOT-MTL (Denver, CO)............................................................................................................. 9 Davis Manufacturing Facility (Troy, MI)..................................................................................... 10 Denver PCE BB (Denver, CO) ..................................................................................................... 11 Eau Claire (Eau Claire, MI) .......................................................................................................... 12 Endicott (Endicott, NY) ................................................................................................................ 13 Fresh Water Lens (Massachusetts) ............................................................................................... 14 Georgetown (Seattle, WA)............................................................................................................ 15 Grants Site (Grants, NM).............................................................................................................. 16 Hamilton-Sundstrand Denver, Co............................................................................................ 17 Harcros/Tri State (Wichita, KS) ................................................................................................... 18 Hopewell Precision Site (Hopewell Junction, NY) ...................................................................... 19 Jackson (Jackson, WY)................................................................................................................. 20 Lowry Air Force Base (LAFB) (Aurora, CO) .............................................................................. 21 Lakeside Village Shopping Center (Houston, TX)....................................................................... 22 Lockwood Solvent (Billings, MT)................................................................................................ 23 MADEP1 (Massachusetts)............................................................................................................ 24 MADEP2 (Massachusetts)............................................................................................................ 25 MADEP3 (Massachusetts)............................................................................................................ 26 MADEP4 (Massachusetts)............................................................................................................ 27 MADEP5 (Massachusetts)............................................................................................................ 28 MADEP6 (Massachusetts)............................................................................................................ 29 MADEP7 (Massachusetts)............................................................................................................ 30 Moffett MCH (Mountain View, CA)............................................................................................ 31 Mount Holly (Mt. Holly, NJ)........................................................................................................ 32 Mountain View (Mountain View, CA)......................................................................................... 33 Orion Park (Mountain View, CA) ................................................................................................ 34 Rapid City (Rapid City, SD)......................................................................................................... 35 Raymark (Stratford, CT)............................................................................................................... 36 Redfield (Denver, CO).................................................................................................................. 37 SCM Cortlandville (Cortlandville, NY) ....................................................................................... 38 Stafford (Stafford, NJ) .................................................................................................................. 39 Twins Inn (Arvada, CO) ............................................................................................................... 40 Uncasville (Uncasville, CT).......................................................................................................... 41 Wall (Wall Township, NJ)............................................................................................................ 42 West Side Corporation (Queens, NY) .......................................................................................... 43 Wz CA BAY (Mountain View, CA)............................................................................................. 44
U.S. EPA’s Vapor Intrusion Database Attachment C
The findings and conclusions in this report have not been formally disseminated by EPA and should not be construed to represent any Agency determination or policy.
C-4
ACRONYM LIST
AEHS Association for Environmental Health and Sciences
bgs below ground surface
BTEX benzene, toluene, ethylbenzene, and xylenes
CDOT-MTL Colorado Department of Transportation Materials Testing Laboratory
DCA dichloroethane
DCE dichloroethene
DNAPL dense non-aqueous phase liquid
DoD U.S. Department of Defense
EPA U.S. Environmental Protection Agency
HVAC heating, ventilation, and air conditioning
KDHE Kansas Department of Health and Environment
LAFB Lowry Air Force Base
LNAPL light non-aqueous phase liquid
MADEP Massachusetts Department of Environmental Protection
MI DEQ Michigan Department of Environmental Quality
MTBE methyl tert-butyl ether
NAPL non-aqueous phase liquid
NJDEP New Jersey Department of Environmental Protection
NPL Superfund National Priorities List
NYSDEC New York State Department of Environmental Conservation
ORD Office of Research and Development (U.S. EPA)
PCE perchloroethylene
QA/QC quality assurance/quality control
RP responsible party
TAGA trace atmospheric gas analyzer
TCA trichloroethane
TCE trichloroethene
TNRCC Texas Natural Resource Conservation Commission
TPH total petroleum hydrocarbons
VC vinyl chloride
VOC volatile organic compound
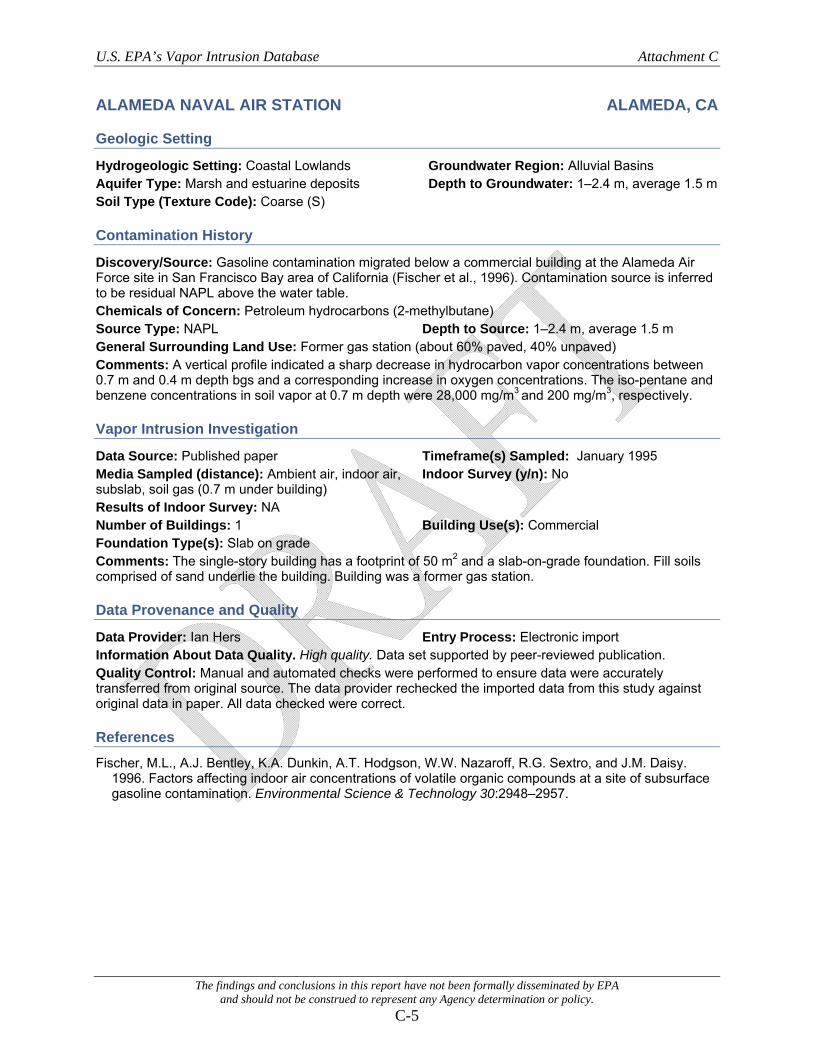
U.S. EPA’s Vapor Intrusion Database Attachment C
The findings and conclusions in this report have not been formally disseminated by EPA and should not be construed to represent any Agency determination or policy.
C-5
ALAMEDA NAVAL AIR STATION ALAMEDA, CA
Geologic Setting
Hydrogeologic Setting: Coastal Lowlands Groundwater Region: Alluvial Basins Aquifer Type: Marsh and estuarine deposits Depth to Groundwater: 1–2.4 m, average 1.5 m Soil Type (Texture Code): Coarse (S)
Contamination History
Discovery/Source: Gasoline contamination migrated below a commercial building at the Alameda Air Force site in San Francisco Bay area of California (Fischer et al., 1996). Contamination source is inferred to be residual NAPL above the water table. Chemicals of Concern: Petroleum hydrocarbons (2-methylbutane) Source Type: NAPL Depth to Source: 1–2.4 m, average 1.5 m General Surrounding Land Use: Former gas station (about 60% paved, 40% unpaved) Comments: A vertical profile indicated a sharp decrease in hydrocarbon vapor concentrations between 0.7 m and 0.4 m depth bgs and a corresponding increase in oxygen concentrations. The iso-pentane and benzene concentrations in soil vapor at 0.7 m depth were 28,000 mg/m3 and 200 mg/m3, respectively.
Vapor Intrusion Investigation
Data Source: Published paper Timeframe(s) Sampled: January 1995 Media Sampled (distance): Ambient air, indoor air, subslab, soil gas (0.7 m under building)
Indoor Survey (y/n): No
Results of Indoor Survey: NA Number of Buildings: 1 Building Use(s): Commercial Foundation Type(s): Slab on grade Comments: The single-story building has a footprint of 50 m2 and a slab-on-grade foundation. Fill soils comprised of sand underlie the building. Building was a former gas station.
Data Provenance and Quality
Data Provider: Ian Hers Entry Process: Electronic import Information About Data Quality. High quality. Data set supported by peer-reviewed publication. Quality Control: Manual and automated checks were performed to ensure data were accurately transferred from original source. The data provider rechecked the imported data from this study against original data in paper. All data checked were correct.
References
Fischer, M.L., A.J. Bentley, K.A. Dunkin, A.T. Hodgson, W.W. Nazaroff, R.G. Sextro, and J.M. Daisy. 1996. Factors affecting indoor air concentrations of volatile organic compounds at a site of subsurface gasoline contamination. Environmental Science & Technology 30:2948–2957.

U.S. EPA’s Vapor Intrusion Database Attachment C
The findings and conclusions in this report have not been formally disseminated by EPA and should not be construed to represent any Agency determination or policy.
C-6
ALLEPO MOUNTAIN VIEW, CA
Geologic Setting
Hydrogeologic Setting: Coastal Lowlands Groundwater Region: Alluvial Basins Aquifer Type: Alluvial basins, valleys, and fans Depth to Groundwater: 4.5–10 ft bgs Soil Type (Texture Code): Fine (L)
Contamination History
Discovery/Source: The dissolved groundwater plume originated from a former chemical storage and solvent recovery facility Chemicals of Concern: Chlorinated hydrocarbons (TCE) Source Type: Groundwater Depth to Source: 4.5–10 ft below slab General Surrounding Land Use: Mixed industrial/residential
Vapor Intrusion Investigation
Data Source: Vapor intrusion workshop Timeframe(s) Sampled: 2004 Media Sampled (distance): Indoor air, subslab, soil gas, and groundwater (along property boundary)
Indoor Survey (y/n): Yes
Results of Indoor Survey: Indoor air levels are generally consistent with background outdoor air Number of Buildings: 4 Building Use(s): Residential Foundation Type(s): Slab on grade Comments: Buildings are single-family homes built in 2000 with attached garages and forced-air heating and cooling.
Data Provenance and Quality
Data Provider: Loren Lund/Ian Hers Entry Process: Hand entry Information About Data Quality: High quality. Investigation overseen by EPA (as lead agency), with QA/QC protocols conforming to EPA's requirements. Quality Control: Manual and automated checks were performed to ensure data were accurately transferred from original source.
References
Lund, L., T. Feng, J. Su, and B. DeHghi. 2004. Observed Versus U.S. EPA “Limited Site-Specific” Soil Gas-to-Indoor Air Attenuation Factors for a Site in a Semi-arid Climate. Presentation at the U.S. EPA Modeling Vapor Intrusion Workshop held at the AEHS Amherst Conference on Contaminated Soils. Amherst, MA. October. Available at http://iavi.rti.org/WorkshopsAndConferences.cfm (accessed October 2007).
U.S. EPA (Environmental Protection Agency). 2003. Mountain View Sites Update. Region 9. San Francisco, CA. January. Available at http://yosemite.epa.gov/r9/sfund/r9sfdocw.nsf/ 91f8ceee903fc0f088256f0000092934/67184eb252df98f7882570070063c355/$FILE/mew_jan03.pdf (accessed October 2007).

U.S. EPA’s Vapor Intrusion Database Attachment C
The findings and conclusions in this report have not been formally disseminated by EPA and should not be construed to represent any Agency determination or policy.
C-7
ALLIANT TECHSYSTEMS (ATK) LITTLETON, CO
Geologic Setting
Hydrogeologic Setting: Alternating sandstone, limestone, and shale – thin soil
Groundwater Region: Nonglaciated Central
Aquifer Type: Bedded sedimentary rock Depth to Groundwater: 3 m bgs Soil Type (Texture Code): Fine (C) Comments: Groundwater beneath the site is shallow. Site is underlain by claystone and sandstone.
Contamination History
Discovery/Source: Dissolved solvent plume originated from disposal activities at an electronic component manufacturing facility in the 1950s and 1960s (U.S. EPA, 2007). Chemicals of Concern: Chlorinated hydrocarbons (PCE; TCE; 1,1-DCE; cis-DCE; VC; 1,1,1-TCA; 1,2-DCA; chloroform) Source Type: Groundwater Depth to Source: 3 m bgs General Surrounding Land Use: Residential
Vapor Intrusion Investigation
Data Source: Vapor intrusion workshop, EPA (Region 8) [2002 database]
Timeframe(s) Sampled: 08/2001, 01/2002
Media Sampled (distance): Indoor air; soil gas, and groundwater (30 m from building)
Indoor Survey (y/n): Yes
Results of Indoor Survey: Not available Number of Buildings: 6 Building Use(s): Residential homes Foundation Type(s): NA Comments: Buildings are single-family.
Data Provenance and Quality
Data Provider: L. Breyer, Helen Dawson Entry Process: Electronic import Information About Data Quality: High quality. Responsible party, EPA oversight indicate adequate QA/QC by EPA standards. Paired samples, information on the methodology, and good agreement between measurements and model predictions also suggest a high-quality data set. Quality Control: Manual and automated checks were performed to ensure data were accurately transferred from original source. All data were sent to submitter for confirmation.
References
ATK (Alliant Techsystems) Inc. 2007. Information for the community. Alliant Techsystems Inc. Web site: http://www.atk.com/littleton/default.htm (accessed September 2007).
Breyer, L. 2004. Measured Versus Model Predicted Attenuation at ATK Dry Creek Road Site, Littleton, Colorado. Presentation at the U.S. EPA Vapor Intrusion Workshop held at the AEHS 14th Annual West Coast Conference on Soils, Sediment and Water, San Diego, March 15–18. Available at http://iavi.rti.org/WorkshopsAndConferences.cfm (accessed October 2007).
U.S. EPA (Environmental Protection Agency). 2007. Alliant Techsystems (ATK) RCRA Factsheet. U.S. EPA online information. Region 8, Denver, CO. Available at http://www.epa.gov/unix0008/land_waste/ rcra/fact/alliant/alliant.html (accessed September 2007).

U.S. EPA’s Vapor Intrusion Database Attachment C
The findings and conclusions in this report have not been formally disseminated by EPA and should not be construed to represent any Agency determination or policy.
C-8
BP SITE PAULSBORO, NJ
Geologic Setting
Hydrogeologic Setting: River Alluvium without Overbank Deposits
Groundwater Region: Atlantic and Gulf Coastal Plain
Aquifer Type: River valleys and floodplains without overbank deposits
Depth to Groundwater: 19 ft bgs
Soil Type (Texture Code): Coarse (LS) Comments: The site is underlain with relatively uniform medium sands with occasional lenses of silty or clayey sand and some gravel.
Contamination History
Discovery/Source: Groundwater contamination beneath the site originated from a line leak in the 1980s at a petroleum distribution terminal with a dissolved gasoline plume migrating off site and underneath a residential neighborhood. Chemicals of Concern: Petroleum hydrocarbons (BTEX, TPH, methane, MTBE) Source Type: Groundwater Depth to Source: 3.2 m below foundation General Surrounding Land Use: Residential
Vapor Intrusion Investigation
Data Source: Responsible party (BP) Timeframe(s) Sampled: 1996, 1997 Media Sampled (distance): Indoor air, subslab (0.7 m deep), soil gas (average of probes on 4 sides and within a few meters of building), groundwater (average of 2 nearby wells.)
Indoor Survey (y/n): NA
Results of Indoor Survey: NA Number of Buildings: 1 Building Use(s): Residential Foundation Type(s): Basement Comments: The concrete foundation of this single-family residence built in the late 1950s or early 1960s is located 1.68 m bgs, has a good integrity with little cracking, and was poured directly over natural sediments.
Data Provenance and Quality
Data Provider: Victor Kremesec (BP)/Ian Hers Entry Process: Hand entry Information About Data Quality: Low quality. Documentation is very limited and no more documentation is available. No QA/QC documentation. One of the few hydrocarbon sites in the database. Quality Control: All data were double checked and sent to submitter for confirmation.
References
None

U.S. EPA’s Vapor Intrusion Database Attachment C
The findings and conclusions in this report have not been formally disseminated by EPA and should not be construed to represent any Agency determination or policy.
C-9
CDOT-MTL DENVER, CO
Geologic Setting
Hydrogeologic Setting: Alternating sandstone, limestone, and shale – thin soil
Groundwater Region: Nonglaciated Central
Aquifer Type: Bedded sedimentary rocks Depth to Groundwater: 10 ft bgs Soil Type (Texture Code): Fine (SL) Comments: Site is underlain by fractured Denver Formation siltstone.
Contamination History
Discovery/Source: Dissolved solvent plume resulted from releases of waste solvents from storage tanks installed in the 1970’s at the CO Department of Transportation Materials Testing Laboratory. Chemicals of Concern: Chlorinated hydrocarbons (TCE, 1,1-DCE; VC; 1,1,1-TCA) Source Type: Groundwater Depth to Source: 3.7 m bgs General Surrounding Land Use: Residential Comments: Plume intermingles with plume from nearby Redfields site
Vapor Intrusion Investigation
Data Source: State, EPA (CDOT, Region 8) [2002 database]
Timeframe(s) Sampled: 1993–1999
Media Sampled (distance): Indoor air, groundwater (interpolated)
Indoor Survey (y/n): Yes
Results of Indoor Survey: No background sources of DCE, which is the risk driver; background varied widely for other VOCs Number of Buildings: 6 Building Use(s): Residential apartments/
townhomes Foundation Type(s): Slab on grade Comments: Air concentrations are average of indoor air concentrations from multiple first floor apartments.
Data Provenance and Quality
Data Provider: Helen Dawson Entry Process: Electronic import Information About Data Quality: High quality. Publications and studies document data quality steps and validate data against vapor intrusion processes and across lines of evidence. Quality Control: Manual and automated checks were performed to ensure data were accurately transferred from original source. All data were sent to submitter for confirmation.
References Kurz, J. 2000. In-Depth Review of Colorado (CDOT Facility) Data. Presentation in August 15 Corrective
Action EI Forum on Vapor Intrusion. Available at http://clu-in.org/eiforum2000/prez/28/28.pdf (accessed September 2007).
Foster, S. J., Kurtz, J.P. And Woodland, A. K. 2004. Volatilization of Bromodichloromethane from Chlorinated Drinking Water as a Contributor to Residential Indoor Air Risk. Available at http://www.envirogroup.com/publications/brdiclme-chloroform_paper_v2_8_23_04_ publication_eleven.pdf (accessed September 2007).
Johnson, P.C., R.A. Ettinger, J. Kurtz, R. Bryan, and J.E. Kester. 2002. Migration of Soil Gas Vapors to Indoor Air: Determining Vapor Attenuation Factors Using a Screening-Level Model and Field Data from the CDOT-MTL Denver, Colorado Site. American Petroleum Institute Technical Bulletin Number 16:10. Available at http://www.api.org/ehs/groundwater/codot.cfm (accessed October 2007).
U.S. EPA (Environmental Protection Agency). 2002. U.S. EPA Technical Support Project Technical Session Summary, June 3–6, 2002, Denver, CO. Technology Innovation Office. Washington, DC. Available at http://www.epa.gov/tio/tsp/download/2002_meet/denver_2002.pdf

U.S. EPA’s Vapor Intrusion Database Attachment C
The findings and conclusions in this report have not been formally disseminated by EPA and should not be construed to represent any Agency determination or policy.
C-10
DAVIS MANUFACTURING FACILITY TROY, MI
Geologic Setting
Hydrogeologic Setting: Glacial till over bedded sedimentary rock
Groundwater Region: Glaciated Central Region
Aquifer Type: Till and till over outwash Depth to Groundwater: 4–7 ft bgs Soil Type (Texture Code): Coarse (S)
Contamination History
Discovery/Source: TCE and petroleum cutting fluids released to the subsurface from the former Davis Manufacturing Facility. In 1994, investigators discovered DNAPL plume extending off-site beneath neighboring residential property. Chemicals of Concern: Chlorinated hydrocarbons (TCE; cis-DCE; trans-DCE; VC) Source Type: DNAPL Depth to Source: 1.7 m bgs General Surrounding Land Use: Residential and industrial
Vapor Intrusion Investigation
Data Source: State (MI DEQ) Timeframe(s) Sampled: 1999–2002 Media Sampled (distance): Indoor air, soil gas, groundwater (7.5 ft from building)
Indoor Survey (y/n): Yes
Results of Indoor Survey: TCE and DCE not impacted by indoor sources; background similar to ambient air Number of Buildings: 1 Building Use(s): Residential, industrial Foundation Type(s): Basement Comments: The residential building has very shallow groundwater conditions, with the water sometimes rising into the basement. A carbon filtration unit is operating in the home. The industrial building is the source of the contamination.
Data Provenance and Quality
Data Provider: Jeff Crum, MI DEQ Entry Process: Electronic import from database Information About Data Quality. Medium quality. Information was originally limited to sampling method for each media sample. Although additional information was not provided during the last review, the site investigation was conducted in a regulatory context under the auspices of MI DEQ and probably includes the appropriate QA/QC protocols and validation protocols. Quality Control: Manual and automated checks were performed to ensure data were accurately transferred from original source. Data were them rechecked by data submitter and original site project manager.
References
None

U.S. EPA’s Vapor Intrusion Database Attachment C
The findings and conclusions in this report have not been formally disseminated by EPA and should not be construed to represent any Agency determination or policy.
C-11
DENVER PCE BB DENVER, CO
Geologic Setting
Hydrogeologic Setting: River alluvium with overbank deposits
Groundwater Region: Nonglaciated Central
Aquifer Type: River valleys and floodplains with overbank deposits
Depth to Groundwater: 12–14 ft bgs
Soil Type (Texture Code): Fine (SL)
Contamination History
Discovery/Source: Solvent plume Chemicals of Concern: Chlorinated hydrocarbons (PCE; TCE; chloroform; 1,1,1-TCA); petroleum hydrocarbons (BTEX) were measured indoors but were not present in the subsurface. Source Type: Groundwater Depth to Source: 12–14 ft bgs General Surrounding Land Use: Residential
Vapor Intrusion Investigation
Data Source: EPA (Region 8) Timeframe(s) Sampled: 2004, 2005 Media Sampled: Indoor air, subslab Indoor Survey (y/n): Yes Results of Indoor Survey: No significant indoor sources noted Number of Buildings: 7 Building Use(s): Residential, commercial Foundation Type(s): Basement
Data Provenance and Quality
Data Provider: Region 8 / Helen Dawson Entry Process: Electronic import Information About Data Quality: High quality. Data were collected according to EPA QA/QC protocols, and are internally consistent. Quality Control: Manual and automated checks were performed to ensure data were accurately transferred from original source. All data were sent to submitter for confirmation.
References
None

U.S. EPA’s Vapor Intrusion Database Attachment C
The findings and conclusions in this report have not been formally disseminated by EPA and should not be construed to represent any Agency determination or policy.
C-12
EAU CLAIRE EAU CLAIRE, MI
Geologic Setting
Hydrogeologic Setting: Outwash over bedded sedimentary rock
Groundwater Region: Glaciated Central Region
Aquifer Type: Sand and gravel Depth to Groundwater: 0.6–1.2 m below foundation
Soil Type (Texture Code): Coarse (S)
Contamination History
Discovery/Source: Solvent plume Chemicals of Concern: Chlorinated hydrocarbons (TCE, cis-DCE, VC) Source Type: Groundwater Depth to Source: 0.6–1.2 m below foundation General Surrounding Land Use: Mixed industrial/residential (data collected from three residences adjacent to Berrien Tool and Die Building).
Vapor Intrusion Investigation
Data Source: EPA (Region 8) (2002 database) Timeframe(s) Sampled: Fall 2000 Media Sampled (distance): Indoor air, groundwater (6–10 m from building)
Indoor Survey (y/n): NA
Results of Indoor Survey: NA Number of Buildings: 3 Building Use(s): Residential Foundation Type(s): Basement Comments: Indoor air samples were collected in the basements and first floors of these single-family residences. Indoor source of TCE was suspected in one house and sources of TCE and cis-DCE in another.
Data Provenance and Quality
Data Provider: Helen Dawson/Ian Hers Entry Process: Electronic import Information About Data Quality: Medium quality. Indoor survey and sampling plan not available Quality Control: Manual and automated checks were performed to ensure data were accurately transferred from original source. All data were sent to submitter for confirmation.
References None

U.S. EPA’s Vapor Intrusion Database Attachment C
The findings and conclusions in this report have not been formally disseminated by EPA and should not be construed to represent any Agency determination or policy.
C-13
ENDICOTT ENDICOTT, NY
Geologic Setting
Hydrogeologic Setting: River alluvium with overbank deposits
Groundwater Region: Glaciated Central
Aquifer Type: River valleys and floodplains with overbank deposits
Depth to Groundwater: 20–40 ft bgs
Soil Type (Texture Code): Fine (L) Comment: Site underlain by shale bedrock covered with unconsolidated glacial, alluvial, and fill deposits of varying thicknesses and ranging in texture from clay to gravel. Sand and gravel layers in the alluvial deposits form the surficial (water table) aquifer.
Contamination History
Discovery/Source: Groundwater contamination discovered in 1980 after a 1,1,1-TCA spill at a former manufacturing facility. Solvent plume has extended beneath adjacent and nearby residential and commercial neighborhood. Chemicals of Concern: Chlorinated hydrocarbons (PCE; TCE; 1,1-DCE; cis-DCE; VC; 1,1,1-TCA; 1,1-DCA; chloroethane; methylene chloride; Freon 113) Source Type: Groundwater Depth to Source: About 25 feet below foundation General Surrounding Land Use: Mixed residential with some commercial
Vapor Intrusion Investigation
Data Source: State (NYSDEC) Timeframe(s) Sampled: Spring/Summer 2003; Fall 2004
Media Sampled (Distance): Ambient air, indoor air, subslab, soil gas (4–16.7 m from building), groundwater (5–13.3 m from building)
Indoor Survey (y/n): Yes
Results of Indoor Survey: Potential indoor sources noted in many buildings. Number of Buildings: 232 Building Use(s): Residential, institutional,
commercial, multiuse Foundation Type(s): Basement (full, partial, unspecified), slab on grade Comment: Most buildings were constructed before World War II.
Data Provenance and Quality
Data Provider: William E. Wertz (NYSDEC) Entry Process: Hand entry, electronic import Information About Data Quality: High quality. Analytical and sampling QA/QC was adequately conducted and documented, including data validation information, results of laboratory and field duplicate samples, a formal and independent data validation and usability assessment reports. Data were assessed against data quality objectives for accuracy, precision, sensitivity, consistency, and technical usability. Quality Control: All manual entry was double checked for accuracy. Data provider rechecked and confirmed entry of first set of data for 27 buildings. Subsequent data sets were imported from electronic sources, with manual and automated checks performed to ensure accurate data transfers from original sources.
References
New York State Department of Health. n.d. Endicott Soil Vapor Project. Available at http://www.health.state .ny.us/environmental/investigations/soil_gas/index.htm (accessed October 2007).
NY State Department of Environmental Quality. n.d. Vapor and Groundwater Sampling Results, Endicott, New York, Environmental Investigations. Available at http://www.dec.ny.gov/chemical/24890.html (accessed October 2007).

U.S. EPA’s Vapor Intrusion Database Attachment C
The findings and conclusions in this report have not been formally disseminated by EPA and should not be construed to represent any Agency determination or policy.
C-14
FRESH WATER LENS MASSACHUSETTS
Geologic Setting
Aquifer Type: Surficial beach sands transitioning to deeper marine clays
Depth to Groundwater: 8–10 ft bgs
Soil Type (Texture Code): Coarse (S) Comment: Freshwater lens present beneath site.
Contamination History
Discovery/Source: A release of TCE apparently occurred near a former underground storage tank and impacted soil and groundwater at a former industrial manufacturing site. Chemicals of Concern: Chlorinated hydrocarbons (TCE) Source Type: Soil, groundwater Depth to Source: 20 ft bgs General Surrounding Land Use: NA
Vapor Intrusion Investigation
Data Source: Vapor intrusion workshop Timeframe(s) Sampled: NA Media Sampled (Distance): Indoor air, groundwater (NA), soil gas (NA)
Indoor Survey (y/n): Yes
Results of Indoor Survey: NA Number of Buildings: 2 Building Use(s): Commercial Foundation Type(s): NA Comment: Freshwater lens appears to be impeding upward migration of contaminants.
Data Provenance and Quality
Data Provider: T.M. McAlary Entry Process: Hand entry Information About Data Quality: High quality. QA/QC conducted and documented. Consistency in multiple lines of evidence. Quality Control: Manual and automated checks were performed to ensure data were accurately transferred from original source.
References
McAlary, T.A ., K. Berry-Spark, T.A. Krug and J.M. Uruskyj. 2004. The Fresh Water Lens and its Effects on Groundwater to Indoor Air Attenuation Coefficients. Presentation at the U.S. EPA Vapor Intrusion Workshop held at the AEHS 14th Annual West Coast Conference on Soils, Sediment and Water, San Diego, March 15–18. Available at http://iavi.rti.org/WorkshopsAndConferences.cfm (accessed October 2007).

U.S. EPA’s Vapor Intrusion Database Attachment C
The findings and conclusions in this report have not been formally disseminated by EPA and should not be construed to represent any Agency determination or policy.
C-15
GEORGETOWN SEATTLE, WA
Geologic Setting
Hydrogeologic Setting: Coastal lowlands Groundwater Region: Alluvial Basins Aquifer Type: Alluvial basins, valleys, and fans Depth to Groundwater: NA Soil Type (Texture Code): (SM)
Contamination History
Discovery/Source: Dissolved groundwater plume resulting from leaking solvent tanks at former manufacturing and waste disposal facilities Chemicals of Concern: Chlorinated hydrocarbons (PCE; 1,1,1-TCA; 1,1-DCA; chloroform; carbon tetrachloride) and xylenes Source Type: Groundwater Depth to Source: NA General Surrounding Land Use: Mixed residential and industrial
Vapor Intrusion Investigation
Data Source: Vapor intrusion workshop, EPA Region 10
Timeframe(s) Sampled: August 2000
Media Sampled (Distance): Indoor air, subslab, soil gas (NA)
Indoor Survey (y/n): NA
Results of Indoor Survey: NA Number of Buildings: 2 Building Use(s): Residential Foundation Type(s):
Data Provenance and Quality
Data Provider: Helen Dawson Entry Process: Electronic import Information About Data Quality: Medium quality. Indoor air and subslab sampling conformed to EPA protocols but QA/QC documentation was not supplied. Quality Control: Manual and automated checks were performed to ensure data were accurately transferred from original source. All data were sent to submitter for confirmation.
References
Georgetown community page: http://www.georgetownneighborhood.com/site.html.
Mayer, C., A. Sidel, C. Waldron, and K. Prestbo. 2004. Calculation of Site Specific Groundwater to Indoor Air Volatilization Factors. Presentation at the U.S. EPA Vapor Intrusion Workshop held at the AEHS 14th Annual West Coast Conference on Soils, Sediment and Water, San Diego, March 15–18. Available at http://iavi.rti.org/WorkshopsAndConferences.cfm (accessed October 2007).

U.S. EPA’s Vapor Intrusion Database Attachment C
The findings and conclusions in this report have not been formally disseminated by EPA and should not be construed to represent any Agency determination or policy.
C-16
GRANTS SITE GRANTS, NM
Geologic Setting
Hydrogeologic Setting: River alluvium Groundwater Region: Colorado Plateau and Wyoming Basin
Aquifer Type: Alluvial basins, valleys, and fans Depth to Groundwater: 4–6 ft bgs Soil Type (Texture Code): Comments: Groundwater flows to the east and southeast.
Contamination History
Discovery/Source: Site was discovered by New Mexico Environment Department in 1993 during underground storage tank investigations, and groundwater investigations were conducted in 1999 and 2000. Site is underlain by multiple dissolved solvent plumes. Chemicals of Concern: Chlorinated hydrocarbons (PCE, TCE, cis-DCE, VC) Source Type: Groundwater Depth to Source: 4–6 ft bgs General Surrounding Land Use: Mixed residential/commercial Comments: PCE was detected in shallow groundwater at concentrations up to 26,000 μg/L.
Vapor Intrusion Investigation
Data Source: Vapor intrusion workshop Timeframe(s) Sampled: NA Media Sampled (Distance): Ambient air, indoor air, background, crawlspace air, soil gas (within a few meters), groundwater (10–110 ft from building)
Indoor Survey (y/n): Yes
Results of Indoor Survey: NA Number of Buildings: 8 Building Use(s): Residential Foundation Type(s): 2 slab on grade, 3 crawlspace, 2 basement Comments: Soil gas probes installed relatively close (within a few meters)
Data Provenance and Quality
Data Provider: J. Lowe/Ian Hers Entry Process: Electronic import Information About Data Quality: Low quality. Preliminary data, widely varying soil gas concentrations. Quality Control: Manual and automated checks were performed to ensure data were accurately transferred from original source. Data were checked for accuracy by the data provider. Comment: Soil gas is average of concentrations for 4 probes installed on 4 sides of the building,
References
Halloran, A., J. Minchak, J. Lowe, B. Thompson, S. Appaji, C. Meehan. 2004. Attenuation Factors and Multiple Lines of Evidence for Evaluation of Potential Vapor Intrusion Pathways–Experience with the Grants Chlorinated Solvents Plume Site, Cibola County, New Mexico. Presentation at the U.S. EPA Vapor Intrusion Workshop held at the AEHS 14th Annual West Coast Conference on Soils, Sediment and Water, San Diego, March 15–18. Available at http://iavi.rti.org/WorkshopsAndConferences.cfm (accessed October 2007).

U.S. EPA’s Vapor Intrusion Database Attachment C
The findings and conclusions in this report have not been formally disseminated by EPA and should not be construed to represent any Agency determination or policy.
C-17
HAMILTON-SUNDSTRAND DENVER, CO
Geologic Setting
Hydrogeologic Setting: River alluvium without overbank deposits
Groundwater Region: Nonglaciated Central
Aquifer Type: River valleys and floodplains without overbank deposits
Depth to Groundwater: 9.7 m bgs
Soil Type (Texture Code): Coarse (S)
Contamination History
Discovery/Source: Dissolved solvent plume in groundwater from past industrial solvent use. Chemicals of Concern: Chlorinated hydrocarbons (TCE; 1,1-DCE) Source Type: Groundwater Depth to Source: 9.7 m bgs General Surrounding Land Use: Residential
Vapor Intrusion Investigation
Data Source: EPA Region 8 (2002 database) Timeframe(s) Sampled: 1999–2006 Media Sampled (Distance): Indoor air, groundwater (interpolated)
Indoor Survey (y/n): NA
Results of Indoor Survey: NA Number of Buildings: 35 Building Use(s): Residential homes Foundation Type(s): NA
Data Provenance and Quality
Data Provider: Helen Dawson Entry Process: Electronic import Information About Data Quality: High quality. Indoor air and subslab sampling conformed to EPA protocols but QA/QC documentation was not supplied. Quality Control: Manual and automated checks were performed to ensure data were accurately transferred from original source. Data were checked for accuracy by the data provider. Comments: Some groundwater concentrations are estimated based on concentration contours.
References
U.S. EPA (Environmental Protection Agency). n.d. Hamilton Sundstrand fact sheets. U.S. EPA Region 8. Available at http://epa.gov/Region8/land_waste/rcra/fact/hamsun/hamsun.html (accessed October 2007).

U.S. EPA’s Vapor Intrusion Database Attachment C
The findings and conclusions in this report have not been formally disseminated by EPA and should not be construed to represent any Agency determination or policy.
C-18
HARCROS/TRI STATE WICHITA, KS
Geologic Setting
Hydrogeologic Setting: River alluvium with overbank deposits
Groundwater Region: Nonglaciated Central
Aquifer Type: River valleys and floodplains with overbank deposits
Depth to Groundwater: 16–18 ft bgs
Soil Type (Texture Code): Coarse (S) Comments: Subsurface consists of clay to 6 feet underlain by coarse sand and gravel.
Contamination History
Discovery/Source: The Tri-State Laundry and Dry-Cleaner Supply Company (Tri-State) and the Harcros Chemical Supply Company (Harcros) were identified as potential sources of groundwater contamination during an adjacent site investigation. Contamination from the adjacent site consists primarily of chlorinated solvents, mostly TCE and PCE. In May 1998, Harcros entered into an Interim Agreement with KDHE to conduct an investigation to determine if chemicals found in the groundwater were originating from their property. This investigation identified solvents, such as PCE, TCE, and 1,1,1- trichloroethane in the soil and groundwater. The City filed a lawsuit in 1998 against parties believed to be responsible for the groundwater contamination, including Tri-State and Harcros. Additional investigation conducted in association with the lawsuit confirmed these two facilities as sources of volatile organic contamination. Harcros ultimately settled the lawsuit with the City and Tri-State declared bankruptcy, leaving the City responsible for investigating and remediating the contamination associated with these facilities. Chemicals of Concern: Chlorinated hydrocarbons (PCE; TCE; trans-DCE; 1,1-DCE; cis-DCE; VC) Source Type: Groundwater Depth to Source: 3.4–4.3 m below foundation General Surrounding Land Use: Primarily residential, limited commercial
Vapor Intrusion Investigation
Data Source: State (KDHE) Timeframe(s) Sampled: April 2005 Media Sampled (distance): Ambient air, indoor air, crawlspace, subslab, soil gas (NA), groundwater (NA)
Indoor Survey (y/n): Yes
Results of Indoor Survey: No potential indoor air sources for constituents of concern found within structures Number of Buildings: 7 Building Use(s): Primarily residential, limited
commercial Foundation Type(s): Basement/crawlspace, crawlspace
Data Provenance and Quality
Data Provider: William Morris (KDHE)/Ian Hers Entry Process: Electronic import Information About Data Quality: High quality. All soil gas and subslab samples were analyzed in the field using a gas chromatograph in a mobile lab equipped with an electron capture device, and replicate samples were sent to a fixed laboratory for consequent TO-15 analysis. Indoor air and ambient air samples were analyzed only by TO-15 methodology. All samples were collected using a site specific QAPP, and data validation was done by staff at KDHE to ensure data quality met sampling objectives. Quality Control: Manual and automated checks were performed to ensure data were accurately transferred from original source. Data provider confirmed data using manual spot checks.
References
None.

U.S. EPA’s Vapor Intrusion Database Attachment C
The findings and conclusions in this report have not been formally disseminated by EPA and should not be construed to represent any Agency determination or policy.
C-19
HOPEWELL PRECISION SITE HOPEWELL JUNCTION, NY
Geologic Setting
Hydrogeologic Setting: Outwash over bedded sedimentary rock
Groundwater Region: Glaciated Central Region
Aquifer Type: Sand and gravel Depth to Groundwater: 0.8–1.3 m below foundation
Soil Type (Texture Code): Coarse (S)
Contamination History
Discovery/Source: Solvent plume from paint thinners and degreasers disposed on the ground. Chemicals of Concern: Chlorinated hydrocarbons (TCE; 1,1,1-TCA) Source Type: Groundwater Depth to Source: 0.8–1.3 m below foundation General Surrounding Land Use: Residential
Vapor Intrusion Investigation
Data Source: U.S. EPA Environmental Response Team
Timeframe(s) Sampled: January/February 2004
Media Sampled (Distance): Ambient air, indoor air, subslab, groundwater (NA)
Indoor Survey (y/n): Yes (TAGA) allowed direct detection of indoor sources
Results of Indoor Survey: TAGA used to identify and remove indoor VOC sources prior to sampling. Number of Buildings: 19 Building Use(s): Residential single family homes Foundation Type(s): Basement (full and partial) Comments: Foundation depth varies from 1.3–2.8 m bgs.
Data Provenance and Quality
Data Provider: D. Mickunas/Ian Hers Entry Process: Electronic import Information About Data Quality: High quality. TAGA provided real-time measurements that agreed well with laboratory (TO-15) measurements and allowed identification and removal of indoor sources. Quality Control: Manual and automated checks were performed to ensure data were accurately transferred from original source. Data provider confirmed data using manual spot checks.
References
U.S. EPA (Environmental Protection Agency). nd. NPL Narrative for Hopewell Precision Site. Available at http://www.epa.gov/superfund/sites/npl/nar1720.htm (accessed October 2007).
Community group site: http://hopewell-junction-citizens-for-clean-water.org/index.html (accessed October 2007).
NY State Department of Environmental Health. n.d. Hopewell Precision area Contamination. Available at http://www.health.state.ny.us/environmental/investigations/hopewell/ (accessed October 2007).

U.S. EPA’s Vapor Intrusion Database Attachment C
The findings and conclusions in this report have not been formally disseminated by EPA and should not be construed to represent any Agency determination or policy.
C-20
JACKSON JACKSON, WY
Geologic Setting
Hydrogeologic Setting: Glacial mountain valleys Groundwater Region: Western Mountain Ranges
Aquifer Type: Sand and gravel Depth to Groundwater: NA Soil Type (Texture Code): Coarse (LS) Comment: Site in underlain by alluvium consisting of cobbles and silty sand.
Contamination History
Discovery/Source: Dissolved groundwater plume Chemicals of Concern: Chlorinated hydrocarbons (PCE) Source Type: Groundwater Depth to Source: NA General Surrounding Land Use: Residential
Vapor Intrusion Investigation
Data Source: EPA Region 8 Timeframe(s) Sampled: August 2002, March 2003
Media Sampled (Distance): Indoor air, crawlspace, subslab, soil gas (33 and 107 m from building) , groundwater (40 m from building)
Indoor Survey (y/n): No
Results of Indoor Survey: NA Number of Buildings: 2 Building Use(s): Residential homes and
apartments Foundation Type(s): Crawlspace, slab on grade Comment: Two of the buildings are apartments, and the other two are single-family residences.
Data Provenance and Quality
Data Provider: Helen Dawson Entry Process: Electronic import Information About Data Quality: High quality. Sampling was overseen by EPA and conducted following EPA protocols and QA/QC criteria. Quality Control: Manual and automated checks were performed to ensure data were accurately transferred from original source. Data were checked for accuracy by the data provider.
References None

U.S. EPA’s Vapor Intrusion Database Attachment C
The findings and conclusions in this report have not been formally disseminated by EPA and should not be construed to represent any Agency determination or policy.
C-21
LOWRY AIR FORCE BASE (LAFB) AURORA, CO
Geologic Setting
Hydrogeologic Setting: River alluvium with overbank deposits
Groundwater Region: Nonglaciated Central
Aquifer Type: River valleys and floodplains with overbank deposits
Depth to Groundwater: 6.1 m bgs (average)
Soil Type (Texture Code): Coarse (LS) Comment: Vadose zone beneath the site is sandy loam or loamy sand and fines upwards. Sand and gravel aquifer is located beneath the site.
Contamination History
Discovery/Source: Dissolved solvent plume in groundwater Chemicals of Concern: Chlorinated hydrocarbons (PCE; TCE; cis-DCE; trans-DCE; 1,1-DCE; VC; 1,1,2-TCA; 1,1,1-TCA; 1,2-DCA; 1,1-DCA) Source Type: Groundwater Depth to Source: 0.8–9.7 m below foundation General Surrounding Land Use:
Vapor Intrusion Investigation
Data Source: EPA Region 8 (2002 database) Timeframe(s) Sampled: 2000–2001 Media Sampled (Distance): Ambient air, indoor air, crawlspace, subslab (NA), groundwater (23–69 m from building)
Indoor Survey (y/n): Yes
Results of Indoor Survey: Some indoor vapor sources suspected. Number of Buildings: 13 Building Use(s): Residential Foundation Type(s): Basement (full and partial), basement/crawlspace, crawlspace, slab on grade
Data Provenance and Quality
Data Provider: Helen Dawson Entry Process: Electronic import Information About Data Quality: High quality. Part of 2002 VI database, LAFB data were prepared under DoD QA/QC and have been extensively reviewed for consistency and accuracy by EPA Region 8. Quality Control: Manual and automated checks were performed to ensure data were accurately transferred from original source. Data were checked for accuracy by the data provider.
References
Dawson, H.E. 2004. Statistical evaluation of attenuation factors at Lowry Air Force Base, CO. Presentation at the U.S. EPA Modeling Vapor Intrusion Workshop held at the AEHS Amherst Conference on Contaminated Soils. Amherst, MA. October. Available at http://iavi.rti.org/ WorkshopsAndConferences.cfm (accessed October 2007).
Dawson, H.E. 2002. Evaluating Vapor Intrusion from Groundwater and Soil to Indoor Air. Presented at EPA Brownfields Conference, Charlotte, NC. November.

U.S. EPA’s Vapor Intrusion Database Attachment C
The findings and conclusions in this report have not been formally disseminated by EPA and should not be construed to represent any Agency determination or policy.
C-22
LAKESIDE VILLAGE SHOPPING CENTER HOUSTON, TX
Geologic Setting
Hydrogeologic Setting: Unconsolidated and semi-consolidated shallow surficial aquifer
Groundwater Region: Atlantic and Gulf Coastal Plain
Aquifer Type: Shallow unconsolidated/semi-consolidated aquifers
Depth to Groundwater: NA
Soil Type (Texture Code): Fine (L) Comment: Subsurface consists of clay to silty clay with calcareous nodules.
Contamination History
Discovery/Source: Former dry cleaning activities at the site contaminated the underlying soil and groundwater with PCE, with presence of DNAPL and vapor clouds likely. Chemicals of Concern: Chlorinated hydrocarbons (PCE; TCE; trans-DCE; cis-DCE; chlorobenzene; chloroform; 1,1,1-TCA; 1,1-DCE; 1,2-DCA; methyl chloride; 1,2-dichlorobenzene; chlorobenzene); toluene; carbon disulfide; 1,2,4-trimethylbenzene; acetone; ethanol; styrene; ethylbenzene; and xylenes Source Type: Soil, groundwater Depth to Source: NA General Surrounding Land Use: Commercial
Vapor Intrusion Investigation
Data Source: State (TX Voluntary Cleanup Program)
Timeframe(s) Sampled: 1995, 1997, 2000
Media Sampled (Distance): Indoor air, subslab, groundwater (NA)
Indoor Survey (y/n): NA
Results of Indoor Survey: Former dry cleaner Number of Buildings: 1 Building Use(s): Commercial Foundation Type(s): Slab on grade Comment: Building is a strip mall that hosts a dry cleaning facility currently used as a pickup/drop-off location. Off-gases from the clean clothes may contribute to indoor air contaminant concentrations.
Data Provenance and Quality
Data Provider: N. Pechacek Entry Process: Hand entry Information About Data Quality: Medium quality. Limited data validation information was included in the data package along with sampling methods. The site investigation for one site was conducted under Texas’ Voluntary Cleanup Program, and the groundwater remediation plan received a Conditional Certificate of Completion by TNRCC in February 1998. Quality Control: Manual checks were performed for 100% of hand-entered data. Data were rechecked by submitter.
References
None

U.S. EPA’s Vapor Intrusion Database Attachment C
The findings and conclusions in this report have not been formally disseminated by EPA and should not be construed to represent any Agency determination or policy.
C-23
LOCKWOOD SOLVENT BILLINGS, MT
Geologic Setting
Hydrogeologic Setting: River alluvium with overbank deposits
Groundwater Region: Nonglaciated Central
Aquifer Type: River valleys and floodplains with overbank deposits
Depth to Groundwater: 2.4 m
Soil Type (Texture Code): Fine (L) Comment: Subsurface consists of silty sand to silty clay.
Contamination History
Discovery/Source: The chlorinated solvent plume originated from a trailer washing areas at a former tractor trailer manufacturer. Contaminants in this chlorinated solvent plume underlying residential area may exist in either dissolved or pure product form from individual or combined sources or in the environment. Chemicals of Concern: Chlorinated hydrocarbons (PCE; TCE; cis-DCE; trans-DCE; 1,1-DCE; VC; 1,1-DCA; 1,2-DCA; carbon tetrachloride) Source Type: Soil, groundwater, NAPL Depth to Source: 2.4 m bgs General Surrounding Land Use: Residential and light industrial commercial Comment: Based on current data, the contaminated groundwater plume is approximately 580 acres in area.
Vapor Intrusion Investigation
Data Source: EPA Region 8 Timeframe(s) Sampled: 2001–2002 Media Sampled (Distance): Indoor air, crawlspace, groundwater (10–450 ft from building)
Indoor Survey (y/n): Yes
Results of Indoor Survey: Possible indoor vapor sources noted in two buildings. Number of Buildings: 13 Building Use(s): Residential single family homes Foundation Type(s): Crawlspace/basement, crawlspace, slab on grade Comment: Residences are single-family homes, mobile homes, and modular homes.
Data Provenance and Quality
Data Provider: Helen Dawson Entry Process: Electronic import Information About Data Quality: High quality. Data were validated according to EPA Method TO-15 and the EPA Contract Laboratory Program for National Functional Guidelines for Organic Data Review. Quality Control: Manual and automated checks were performed to ensure data were accurately transferred from original source. Data were checked for accuracy by the data provider.
References U.S. EPA (Environmental Protection Agency). nd. Lockwood Solvent Groundwater Site fact sheet. U.S.
EPA Region 8. Available at http://www.epa.gov/region8/superfund/mt/lockwood_solvents/index.html (accessed October 2007).

U.S. EPA’s Vapor Intrusion Database Attachment C
The findings and conclusions in this report have not been formally disseminated by EPA and should not be construed to represent any Agency determination or policy.
C-24
MADEP1 MASSACHUSETTS
Geologic Setting
Hydrogeologic Setting: NA Groundwater Region: Northeast and Superior Uplands
Aquifer Type: NA Depth to Groundwater: 2.1 m bgs Soil Type (Texture Code): Coarse (S)
Contamination History
Discovery/Source: Not available by site Chemicals of Concern: Chlorinated hydrocarbons (TCE) Source Type: Groundwater Depth to Source: 2.1 m bgs General Surrounding Land Use: Residential
Vapor Intrusion Investigation
Data Source: State (MADEP) (2002 database) Timeframe(s) Sampled: 1993–1994 Media Sampled (Distance): Indoor air, soil gas, groundwater (3 m from building)
Indoor Survey (y/n): Yes
Results of Indoor Survey: Not available by site Number of Buildings: 2 Building Use(s): Residential Foundation Type(s): Basement
Data Provenance and Quality
Data Provider: Helen Dawson Entry Process: Electronic import Information About Data Quality: Medium quality. Data reviewed and analyzed by MADEP. Limited information available about individual sites. Quality Control: Manual and automated checks were performed to ensure data were accurately transferred from original source. Data were checked for accuracy by the data provider.
References
Fitzpatrick, N.A., and J.J. Fitzgerald. 1996. An evaluation of vapor intrusion into buildings through a study of field data. Presented at the 11th Annual Conference on Contaminated Soils, University of Massachusetts. October. Available at http://www.mass.gov/dep/cleanup/gw2proj.pdf (accessed October 2007).

U.S. EPA’s Vapor Intrusion Database Attachment C
The findings and conclusions in this report have not been formally disseminated by EPA and should not be construed to represent any Agency determination or policy.
C-25
MADEP2 MASSACHUSETTS
Geologic Setting
Hydrogeologic Setting: NA Groundwater Region: Northeast and Superior Uplands
Aquifer Type: NA Depth to Groundwater: 2.7 m bgs Soil Type (Texture Code): Coarse (S)
Contamination History
Discovery/Source: Not available by site Chemicals of Concern: Chlorinated hydrocarbons (TCE) Source Type: Groundwater Depth to Source: 2.7 m bgs General Surrounding Land Use: Residential
Vapor Intrusion Investigation
Data Source: State (MADEP) (2002 database) Timeframe(s) Sampled: September 1991, January 1993
Media Sampled (Distance): Indoor air, groundwater (9.1 m from building)
Indoor Survey (y/n): Yes
Results of Indoor Survey: Not available by site Number of Buildings: 1 Building Use(s): Residential Foundation Type(s): Basement
Data Provenance and Quality
Data Provider: Helen Dawson Entry Process: Electronic import Information About Data Quality: Medium quality. Data reviewed and analyzed by MADEP. Limited information available about individual sites. Quality Control: Manual and automated checks were performed to ensure data were accurately transferred from original source. Data were checked for accuracy by the data provider.
References
Fitzpatrick, N.A., and J.J. Fitzgerald. 1996. An evaluation of vapor intrusion into buildings through a study of field data. Presented at the 11th Annual Conference on Contaminated Soils, University of Massachusetts. October. Available at http://www.mass.gov/dep/cleanup/gw2proj.pdf (accessed October 2007).

U.S. EPA’s Vapor Intrusion Database Attachment C
The findings and conclusions in this report have not been formally disseminated by EPA and should not be construed to represent any Agency determination or policy.
C-26
MADEP3 MASSACHUSETTS
Geologic Setting
Hydrogeologic Setting: NA Groundwater Region: Northeast and Superior Uplands
Aquifer Type: NA Depth to Groundwater: 2.4 m bgs Soil Type (Texture Code): Coarse (S)
Contamination History
Discovery/Source: Not available by site Chemicals of Concern: Petroleum hydrocarbons (BTEX) Source Type: Groundwater Depth to Source: 2.4 m bgs General Surrounding Land Use: Residential
Vapor Intrusion Investigation
Data Source: State (MADEP) (2002 database) Timeframe(s) Sampled: 1995–1996 Media Sampled (Distance): Indoor air, groundwater (9 m from building)
Indoor Survey (y/n): Yes
Results of Indoor Survey: Not available by site Number of Buildings: 3 Building Use(s): Residential Foundation Type(s): Basement, slab on grade
Data Provenance and Quality
Data Provider: Helen Dawson Entry Process: Electronic import Information About Data Quality: Medium quality. Data reviewed and analyzed by MADEP. Limited information available about individual sites. Quality Control: Manual and automated checks were performed to ensure data were accurately transferred from original source. Data were checked for accuracy by the data provider.
References
Fitzpatrick, N.A., and J.J. Fitzgerald. 1996. An evaluation of vapor intrusion into buildings through a study of field data. Presented at the 11th Annual Conference on Contaminated Soils, University of Massachusetts. October. Available at http://www.mass.gov/dep/cleanup/gw2proj.pdf (accessed October 2007).

U.S. EPA’s Vapor Intrusion Database Attachment C
The findings and conclusions in this report have not been formally disseminated by EPA and should not be construed to represent any Agency determination or policy.
C-27
MADEP4 MASSACHUSETTS
Geologic Setting
Hydrogeologic Setting: NA Groundwater Region: Northeast and Superior Uplands
Aquifer Type: NA Depth to Groundwater: 3.4 m bgs Soil Type (Texture Code): Coarse (S) Comment: Subsurface consists of sand and gravel
Contamination History
Discovery/Source: Not available by site Chemicals of Concern: Petroleum hydrocarbons (BTEX) Source Type: Groundwater Depth to Source: 3.4 m bgs General Surrounding Land Use: Residential
Vapor Intrusion Investigation
Data Source: State (MADEP) (2002 database) Timeframe(s) Sampled: July 1994, Feb. 1995 Media Sampled (Distance): Indoor air, groundwater (4.5 m from building)
Indoor Survey (y/n): Yes
Results of Indoor Survey: Not available by site Number of Buildings: 1 Building Use(s): Residential Foundation Type(s): Basement
Data Provenance and Quality
Data Provider: Helen Dawson Entry Process: Electronic import Information About Data Quality: Medium quality. Data reviewed and analyzed by MADEP. Limited information available about individual sites. Quality Control: Manual and automated checks were performed to ensure data were accurately transferred from original source. Data were checked for accuracy by the data provider.
References
Fitzpatrick, N.A., and J.J. Fitzgerald. 1996. An evaluation of vapor intrusion into buildings through a study of field data. Presented at the 11th Annual Conference on Contaminated Soils, University of Massachusetts. October. Available at http://www.mass.gov/dep/cleanup/gw2proj.pdf. (accessed October 2007).

U.S. EPA’s Vapor Intrusion Database Attachment C
The findings and conclusions in this report have not been formally disseminated by EPA and should not be construed to represent any Agency determination or policy.
C-28
MADEP5 MASSACHUSETTS
Geologic Setting
Hydrogeologic Setting: NA Groundwater Region: Northeast and Superior Uplands
Aquifer Type: NA Depth to Groundwater: 2.4 m bgs Soil Type (Texture Code): Coarse (S) Comment: Subsurface consists of sand.
Contamination History
Discovery/Source: Not available by site Chemicals of Concern: Petroleum hydrocarbons (BTEX) Source Type: Groundwater Depth to Source: 2.4 m bgs General Surrounding Land Use: Residential
Vapor Intrusion Investigation
Data Source: State (MADEP) (2002 database) Timeframe(s) Sampled: 1993–1994 Media Sampled (Distance): Indoor air, groundwater (7.6 m from building)
Indoor Survey (y/n): Yes
Results of Indoor Survey: Not available by site Number of Buildings: 1 Building Use(s): Residential Foundation Type(s): Basement
Data Provenance and Quality
Data Provider: Helen Dawson Entry Process: Electronic import Information About Data Quality: Medium quality. Data reviewed and analyzed by MADEP. Limited information available about individual sites. Quality Control: Manual and automated checks were performed to ensure data were accurately transferred from original source. Data were checked for accuracy by the data provider.
References
Fitzpatrick, N.A., and J.J. Fitzgerald. 1996. An evaluation of vapor intrusion into buildings through a study of field data. Presented at the 11th Annual Conference on Contaminated Soils, University of Massachusetts. October. Available at http://www.mass.gov/dep/cleanup/gw2proj.pdf (accessed October 2007).

U.S. EPA’s Vapor Intrusion Database Attachment C
The findings and conclusions in this report have not been formally disseminated by EPA and should not be construed to represent any Agency determination or policy.
C-29
MADEP6 MASSACHUSETTS
Geologic Setting
Hydrogeologic Setting: NA Groundwater Region: Northeast and Superior Uplands
Aquifer Type: NA Depth to Groundwater: 0.8 m bgs Soil Type (Texture Code): Coarse (S) Comment: Subsurface consists of sand and gravel.
Contamination History
Discovery/Source: Not available by site Chemicals of Concern: Petroleum hydrocarbons (BTEX) Source Type: Groundwater Depth to Source: 0.8 m bgs General Surrounding Land Use: Residential
Vapor Intrusion Investigation
Data Source: State (MADEP) (2002 database) Timeframe(s) Sampled: 1990, 1991, 1994 Media Sampled (Depth): Indoor air, groundwater (4.5 m from building)
Indoor Survey (y/n): Yes
Results of Indoor Survey: Not available by site Number of Buildings: 2 Building Use(s): Residential Foundation Type(s): Basement, crawlspace
Data Provenance and Quality
Data Provider: Helen Dawson Entry Process: Electronic import Information About Data Quality: Medium quality. Data reviewed and analyzed by MADEP. Little information available about individual sites. Quality Control: Manual and automated checks were performed to ensure data were accurately transferred from original source. Data were checked for accuracy by the data provider.
References
Fitzpatrick, N.A., and J.J. Fitzgerald. 1996. An evaluation of vapor intrusion into buildings through a study of field data. Presented at the 11th Annual Conference on Contaminated Soils, University of Massachusetts. October. Available at http://www.mass.gov/dep/cleanup/gw2proj.pdf (accessed October 2007).

U.S. EPA’s Vapor Intrusion Database Attachment C
The findings and conclusions in this report have not been formally disseminated by EPA and should not be construed to represent any Agency determination or policy.
C-30
MADEP7 MASSACHUSETTS
Geologic Setting
Hydrogeologic Setting: NA Groundwater Region: Northeast and Superior Uplands
Aquifer Type: NA Depth to Groundwater: 2.7 m bgs Soil Type (Texture Code): Coarse (S)
Contamination History
Discovery/Source: Not available by site Chemicals of Concern: Petroleum hydrocarbons (BTEX) Source Type: Groundwater Depth to Source: 2.7 m bgs General Surrounding Land Use: Residential
Vapor Intrusion Investigation
Data Source: State (MADEP) (2002 database) Timeframe(s) Sampled: February 1995 Media Sampled (Distance): Indoor air, groundwater (6 m from building)
Indoor Survey (y/n): Yes
Results of Indoor Survey: Not available by site Number of Buildings: 1 Building Use(s): Residential Foundation Type(s): Basement
Data Provenance and Quality
Data Provider: [2002] Helen Dawson Entry Process: Electronic import Information About Data Quality: Medium quality. Data reviewed and analyzed by MADEP. Little information available about individual sites. Quality Control: Manual and automated checks were performed to ensure data were accurately transferred from original source. Data were checked for accuracy by the data provider.
References
Fitzpatrick, N.A., and J.J. Fitzgerald. 1996. An evaluation of vapor intrusion into buildings through a study of field data. Presented at the 11th Annual Conference on Contaminated Soils, University of Massachusetts. October. Available at http://www.mass.gov/dep/cleanup/gw2proj.pdf (accessed October 2007).

U.S. EPA’s Vapor Intrusion Database Attachment C
The findings and conclusions in this report have not been formally disseminated by EPA and should not be construed to represent any Agency determination or policy.
C-31
MOFFETT MCH MOUNTAIN VIEW, CA
Geologic Setting
Hydrogeologic Setting: Coastal lowlands Groundwater Region: Alluvial Basins Aquifer Type: Alluvial basins, valleys, and fans Depth to Groundwater: 15 ft bgs Soil Type (Texture Code): Fine (L) Comments: Fluvial plain and tidal deposits in the area include coarse sand and gravel channels surrounded by finer grained sediments. Vadose zone is composed of silts and clays. Groundwater is under artesian conditions.
Contamination History
Discovery/Source: Chlorinated solvent plume from Moffett Naval Air Station underlies residential areas. Chemicals of Concern: Chlorinated hydrocarbons (TCE) Source Type: Groundwater Depth to Source: 3.66 m bgs General Surrounding Land Use: Residential Comments: TCE detected in shallow groundwater in 1999/2000 at ~300 μg/L.
Vapor Intrusion Investigation
Data Source: Vapor intrusion workshop Timeframe(s) Sampled: 8/2002–5/2004 Media Sampled (Distance): Indoor air, groundwater (NA)
Indoor Survey (y/n): Yes
Results of Indoor Survey: All buildings have "ubiquitous site TCE.” They are located in an urban society, with regional TCE groundwater plumes and home products containing TCE and/or construction materials. Number of Buildings: 3 Building Use(s): Residential single family homes Foundation Type(s): Slab on grade. Comments: Buildings are part of community housing and were constructed in 1933 in Westcoat housing area. These vacant housing units have a 4-inch concrete slab foundation.
Data Provenance and Quality
Data Provider: D. Goldman/Ian Hers Entry Process: Hand entry Information About Data Quality: High quality. Investigation overseen by EPA (as lead agency), with QA/QC protocols conforming to EPA's requirements. Quality Control: Manual and automated checks were performed to ensure data were accurately transferred from original source. Data were checked for accuracy by the data provider.
References Doctor, W., R.J. Maricio, and D. Goldman. 2004. Comparing Air Measurements and Modeling Results at
a Residential Site Overlying a TCE Plume. Presentation at the U.S. EPA Modeling Vapor Intrusion Workshop held at the AEHS Amherst Conference on Contaminated Soils. Amherst, MA. October. Available at http://iavi.rti.org/WorkshopsAndConferences.cfm (accessed October 2007).
U.S. EPA (Environmental Protection Agency). 2003. Mountain View Sites Update. Region 9. San Francisco, CA. January. Available at http://yosemite.epa.gov/r9/sfund/r9sfdocw.nsf /91f8ceee903fc0f088256f0000092934/67184eb252df98f7882570070063c355/$FILE/mew_jan03.pdf (accessed October 2007).

U.S. EPA’s Vapor Intrusion Database Attachment C
The findings and conclusions in this report have not been formally disseminated by EPA and should not be construed to represent any Agency determination or policy.
C-32
MOUNT HOLLY MT. HOLLY, NJ
Geologic Setting
Hydrogeologic Setting: Unconsolidated and semi-consolidated shallow surficial aquifer
Groundwater Region: Atlantic and Gulf Coastal Plain
Aquifer Type: Shallow unconsolidated/semi-consolidated aquifers
Depth to Groundwater: 6.7–7.6 ft bgs
Soil Type (Texture Code): Coarse (LS) Comments: Site lies in Inner Plain Province within Coastal Plain Province where complex sequences of Inner Plain deposits overlie Cretaceous formations. Shallow geologic units include the Wenonah-Mount Laurel Formation (dark gray, silty sand and sand beds intercolated with dark-colored clay; up to 130 feet thick) and the underlying the Marshalltown Formation (silty, glauconitic sand; 10 to 40 feet thick). Soil deposits on a part of the site are primarily fine sand with trace clay and silt below a depth of 7 feet.
Contamination History
Discovery/Source: Petroleum hydrocarbons (gasoline) released at a former industrial site. Contamination has migrated off-site below a residential area with single-family dwellings. Chemicals of Concern: Petroleum hydrocarbons (BTEX) Source Type: Groundwater Depth to Source: 0.8 m below building
foundation General Surrounding Land Use: Residential Comments: The soil testing results suggested the presence of residual NAPL in soil; however, the NAPL was submerged below the water table during the time site monitoring was completed.
Vapor Intrusion Investigation
Data Source: State (NJDEP) Timeframe(s) Sampled: December 2005 Media Sampled (Distance): Indoor air, groundwater (within 1 to 2 m from building)
Indoor Survey (y/n): Yes
Results of Indoor Survey: Varies; buildings are generally old with poorly ventilated basements. Original surveys provided in NJDEP (2006). Number of Buildings: 1 Building Use(s): Residential (single family
homes) Foundation Type(s): Basement, some with dirt floors. Comments: The residences investigated are over 50 years old, are 3-story buildings with basements, and have foundations of variable construction ranging from concrete to partial dirt floors.
Data Provenance and Quality
Data Provider: NJDEP/Ian Hers Entry Process: Electronic import Information About Data Quality: High quality. Well-documented study (sampling methods, boring logs, indoor air surveys, analytical results) with consistent lines of evidence. Quality Control: Manual and automated checks were performed to ensure data were accurately transferred from original source. Data were spot checked for accuracy by data provider.
References
NJDEP (New Jersey Department of Environmental Protection). 2006. Investigation of Indoor Air Quality in Structures Located above VOC-Contaminated Groundwater, Year Two, Part 1: Evaluation of Soil Vapor Intrusion at Mount Holly Site, New Jersey. Prepared by Golder Associates, Inc., Cherry Hill, NJ, for the New Jersey Department of Environmental Protection (NJDEP), Trenton, NJ. July. Available at http://www.state.nj.us/dep/dsr/air/yr2-part1-vapor-intrusion.pdf (accessed October 2007).

U.S. EPA’s Vapor Intrusion Database Attachment C
The findings and conclusions in this report have not been formally disseminated by EPA and should not be construed to represent any Agency determination or policy.
C-33
MOUNTAIN VIEW MOUNTAIN VIEW, CA
Geologic Setting
Hydrogeologic Setting: Coastal lowlands Groundwater Region: Alluvial Basins Aquifer Type: Alluvian basins, valleys, and fans Depth to Groundwater: 10.3 m bgs Soil Type (Texture Code): Coarse (LS) Comments: The soils at the site consist of mostly silty/clayey sand and gravel with some sand or silt layers.
Contamination History
Discovery/Source: The subsurface contamination is believed to be associated with a leaching field where wastes were dumped. Chemicals of Concern: Chlorinated solvent (primarily TCE) Source Type: Groundwater Depth to Source: 10.3 m bgs General Surrounding Land Use: Residential
Vapor Intrusion Investigation
Data Source: Consultant (2002 database) Timeframe(s) Sampled: 2000–2001 Media Sampled (Distance): Indoor air, soil gas (NA), groundwater (NA)
Indoor Survey (y/n): Not available
Results of Indoor Survey: NA Number of Buildings: 5 Building Use(s): Residential single family Foundation Type(s): Slab on grade Comments: Buildings are single family dwellings built in 1998 with at-grade construction and a moisture vapor barrier.
Data Provenance and Quality
Data Provider: Helen Dawson/Ian Hers Entry Process: Electronic import Information About Data Quality: Low quality. Obtained from slide presentation; no reports available Quality Control: Manual and automated checks were performed to ensure data were accurately transferred from original source. Data were spot checked for accuracy by data provider.
References
U.S. EPA (Environmental Protection Agency). 2003. Mountain View Sites Update. Region 9. San Francisco, CA. January. Available at http://yosemite.epa.gov/r9/sfund/r9sfdocw.nsf/ 91f8ceee903fc0f088256f0000092934/67184eb252df98f7882570070063c355/$FILE/mew_jan03.pdf (accessed October 2007).
U.S. EPA (Environmental Protection Agency). 2007. Intel Corp. (Mountain View Plant). Region 9 Superfund Fact Sheet. San Francisco, CA. October. Available at http://yosemite.epa.gov/r9/sfund/ r9sfdocw.nsf/2e3c0ceec080b048882573290078b56a/10c6e6123e05fdb788257007005e9470 !OpenDocument (accessed October 2007).

U.S. EPA’s Vapor Intrusion Database Attachment C
The findings and conclusions in this report have not been formally disseminated by EPA and should not be construed to represent any Agency determination or policy.
C-34
ORION PARK MOUNTAIN VIEW, CA
Geologic Setting
Hydrogeologic Setting: Coastal lowlands Groundwater Region: Alluvial Basins Aquifer Type: Alluvial basins, valleys, and fans Depth to Groundwater: 3 m below foundation Soil Type (Texture Code): Fine (L) Comments: Fluvial plain and tidal deposits in the area include coarse sand and gravel channels surrounded by finer grained sediments. Vadose zone is composed of silts and clays. Groundwater is under artesian conditions.
Contamination History
Discovery/Source: Chlorinated solvent plume from Moffett Naval Air Station underlies residential areas. Chemicals of Concern: Chlorinated hydrocarbons (PCE, TCE) Source Type: Groundwater Depth to Source: 3 m below foundation General Surrounding Land Use: Residential
Vapor Intrusion Investigation
Data Source: EPA Region 9 Timeframe(s) Sampled: April/May 2005 Media Sampled: Indoor air, subslab Indoor Survey (y/n): NA Results of Indoor Survey: NA Number of Buildings: 8 Building Use(s): Residential single family homes Foundation Type(s): Slab on grade Comments: Buildings are apartments/townhomes.
Data Provenance and Quality
Data Provider: Alana Lee/Helen Dawson Entry Process: Electronic import Information About Data Quality: High quality. Data collected according to EPA protocols Quality Control: Manual and automated checks were performed to ensure data were accurately transferred from original source. Data were spot checked for accuracy by data provider.
References
U.S. EPA (Environmental Protection Agency). 2003. Mountain View Sites Update. Region 9. San Francisco, CA. January. Available at http://yosemite.epa.gov/r9/sfund/r9sfdocw.nsf/ 91f8ceee903fc0f088256f0000092934/67184eb252df98f7882570070063c355/$FILE/mew_jan03.pdf (accessed October 2007).

U.S. EPA’s Vapor Intrusion Database Attachment C
The findings and conclusions in this report have not been formally disseminated by EPA and should not be construed to represent any Agency determination or policy.
C-35
RAPID CITY RAPID CITY, SD
Geologic Setting
Hydrogeologic Setting: River alluvium with overbank deposits
Groundwater Region: Nonglaciated Central
Aquifer Type: River valleys and floodplains with overbank deposits
Depth to Groundwater: 22.5–27 ft bgs
Soil Type (Texture Code): Fine (SC) Comments: Site is underlain by clay, silt, and sandy clay.
Contamination History
Discovery/Source: TCE groundwater plume. Chemicals of Concern: Chlorinated hydrocarbons (TCE) Source Type: Groundwater Depth to Source: 3.3–4.6 m below foundation General Surrounding Land Use: Residential
Vapor Intrusion Investigation
Data Source: Responsible Party (U.S. Air Force) Timeframe(s) Sampled: February/March 2004 Media Sampled (Distance): Indoor air, soil gas (NA), groundwater (NA)
Indoor Survey (y/n): NA
Results of Indoor Survey: NA Number of Buildings: 3 Building Use(s): Residential Foundation Type(s): Basement
Data Provenance and Quality
Data Provider: Helen Dawson Entry Process: Electronic import Information About Data Quality: High quality. Data collected according to EPA protocols QC: Manual and automated checks were performed to ensure data were accurately transferred from original source. Data were checked for accuracy by data provider.
References
None

U.S. EPA’s Vapor Intrusion Database Attachment C
The findings and conclusions in this report have not been formally disseminated by EPA and should not be construed to represent any Agency determination or policy.
C-36
RAYMARK STRATFORD, CT
Geologic Setting
Hydrogeologic Setting: Outwash over crystalline bedrock
Groundwater Region: Northeast and Superior Uplands
Aquifer Type: Sand and gravel Depth to Groundwater: Soil Type (Texture Code): Coarse (S) Comments: Groundwater flow heavily influenced by location and orientation of bedrock valleys
Contamination History
Discovery/Source: Chlorinated solvent plume underlying older homes originated from a former manufacturing facility. Site is now on the NPL. Chemicals of Concern: Chlorinated hydrocarbons (TCE; cis-DCE; 1,1-DCE; 1,1,1-TCA; 1,1-DCA) Source Type: Groundwater Depth to Source: General Surrounding Land Use: Residential
Vapor Intrusion Investigation
Data Source: U.S. EPA ORD Timeframe(s) Sampled: See reports below Media Sampled: Indoor air, subslab Indoor Survey (y/n): Yes Results of Indoor Survey: See reports below Number of Buildings: 14 Building Use(s): Residential single family homes Foundation Type(s): Basement Comments: Some homes are over 100 years old.
Data Provenance and Quality
Data Provider: D. DiGuilio/Helen Dawson Entry Process: Electronic import Information About Data Quality: High quality. Extensively studied site for method development and testing research conducted by EPA ORD, including extensive QA/QC and peer review of report and results. Quality Control: Manual and automated checks were performed to ensure data were accurately transferred from original source. Data were checked for accuracy by data provider.
References
DiGiulio, D. 2006. Evaluation of the “Constrained Version” of the J&E Model and Comparison of Soil-Gas and Sub-Slab Air Concentrations at the Raymark Superfund Site. Presentation at the U.S. EPA Summary Workshop in the Context of EPA's VI Guidance Revisions held at the AEHS 16th Annual West Coast Conference on Soils, Sediment and Water, San Diego, March 16. Available at http://iavi.rti.org/WorkshopsAndConferences.cfm (accessed October 2007).
DiGiulio, D. 2004. Sub-Slab Air Sampling Protocol and Analysis to Support Assessment of Vapor Intrusion. Presentation at the U.S. EPA Vapor Intrusion Workshop held at the AEHS 14th Annual West Coast Conference on Soils, Sediment and Water, San Diego, March 15–18. Available at http://iavi.rti.org/WorkshopsAndConferences.cfm (accessed October 2007).
U.S. EPA (Environmental Protection Agency). 2006. Assessment of Vapor Intrusion in Homes Near the Raymark Superfund Site Using Basement and Sub-Slab Air Samples. EPA/600/R-05/147. Office of Research and Development. Ada, OK. March. Available at http://www.epa.gov/ada/download/ reports/600R05147/600R05147.pdf (accessed October 2007).
U.S. EPA (Environmental Protection Agency). 2006. Comparison of Geoprobe® PRT and AMS GVP Soil-Gas Sampling Systems with Dedicated Vapor Probes in Sandy Soils at the Raymark Superfund Site. EPA/600/R-06/111. Office of Research and Development. Ada, OK. November. Available at http://www.epa.gov/ada/download/reports/600R06111/600R06111.pdf (accessed October 2007).

U.S. EPA’s Vapor Intrusion Database Attachment C
The findings and conclusions in this report have not been formally disseminated by EPA and should not be construed to represent any Agency determination or policy.
C-37
REDFIELD DENVER, CO
Geologic Setting
Hydrogeologic Setting: River alluvium with overbank deposits
Groundwater Region: Nonglaciated Central
Aquifer Type: River valleys and floodplains with overbank deposits
Depth to Groundwater: 0.2–40 ft bgs
Soil Type (Texture Code): (S to SI) Comments: Subsurface consists of silty clay loess with sand lenses. Coarse-grained buried river channel acts as preferential pathway.
Contamination History
Discovery/Source: A solvent plume associated with a former rifle manufacturing operation was discovered in 1994 (Brown Group Retail, 2007). Chemicals of Concern: Chlorinated hydrocarbons (1,1-DCE) Source Type: Groundwater Depth to Source: 0.2–40 ft bgs General Surrounding Land Use: Residential and commercial
Vapor Intrusion Investigation
Data Source: Consultant for RP (2002 database) Timeframe(s) Sampled: 1998–2003 Media Sampled (Distance): Indoor air, groundwater (interpolated)
Indoor Survey (y/n): Yes
Results of Indoor Survey: 1,1-DCE in soil gas and indoor air provides a positive indication of vapor intrusion (no indoor sources). Number of Buildings: 330 Building Use(s): Residential single family homes Foundation Type(s): Basement (full and partial), crawlspace, slab on grade Comments: Extensive plume follows preferential pathway along river channel deposits to underlie many homes. Extensive work with temporal aspects of indoor air concentrations.
Data Provenance and Quality
Data Provider: D. Folkes/J. Kurtz (Helen Dawson) Entry Process: Electronic import Information About Data Quality: High quality. Extensively studied site, with many measurements that show internal consistency between lines of evidence. Good QA/QC, sampling, and documentation. QC: Manual and automated checks were performed to ensure data were accurately transferred from original source. Data were checked for accuracy by data provider.
References
Brown Group Retail. 2007. Redfield Site. Brown Group Retail online information. Available at: http://www.redfieldsite.org/index.php (accessed September 2007).
Folkes, D., E. Wannamaker, and T. Kuehster. 2004. Evaluation of Observed Groundwater to Indoor Air Attenuation Factors Redfield Site, CO. Presentation at the U.S. EPA Vapor Intrusion Workshop held at the AEHS 14th Annual West Coast Conference on Soils, Sediment and Water, San Diego, March 15–18. Available at http://iavi.rti.org/WorkshopsAndConferences.cfm (accessed October 2007).
Kurtz, J.P., D.J. Folkes, and T.E. Kuehster. 2004. A COC Ratio Approach for Defining Extent of Vapor Intrusion and Background. Presentation at the U.S. EPA Vapor Intrusion Workshop held at the AEHS 14th Annual West Coast Conference on Soils, Sediment and Water, San Diego, March 15–18. Available at http://iavi.rti.org/WorkshopsAndConferences.cfm (accessed October 2007).
U.S. EPA (Environmental Protection Agency). 2002. U.S. EPA Technical Support Project Technical Session Summary, June 3–6, 2002, Denver, CO. Technology Innovation Office. Washington, DC. Available at http://www.epa.gov/tio/tsp/download/2002_meet/denver_2002.pdf

U.S. EPA’s Vapor Intrusion Database Attachment C
The findings and conclusions in this report have not been formally disseminated by EPA and should not be construed to represent any Agency determination or policy.
C-38
SCM CORTLANDVILLE CORTLANDVILLE, NY
Geologic Setting
Hydrogeologic Setting: Outwash over bedded sedimentary rock
Groundwater Region: Glaciated Central
Aquifer Type: Sand and gravel Depth to Groundwater: 0.46–4.9 m below foundation
Soil Type (Texture Code): Varies across site from fine to very coarse (ML, SM, GP, GM)
Contamination History
Discovery/Source: Former Smith Corona Manufacturing facility released trichloroethene and other volatile chemicals into the soil and groundwater during its operation in Cortlandville. The resulting groundwater plume extends beneath homes to the north of the facility property line. Chemicals of Concern: Chlorinated hydrocarbons (TCE) Source Type: Groundwater Depth to Source: 0.46–4.9 m below foundation General Surrounding Land Use: Residential
Vapor Intrusion Investigation
Data Source: State (NYSDEC) Timeframe(s) Sampled: March 2006–2007 Media Sampled (Distance): Indoor air, subslab, soil gas (15–72 m from building), groundwater (interpolated)
Indoor Survey (y/n): Yes
Results of Indoor Survey: Not available at this time Number of Buildings: 40 Building Use(s): Residential Foundation Type(s): Basement
Comment: Average depth to foundation is 1.5 m bgs.
Data Provenance and Quality
Data Provider: William Wertz/Helen Dawson Entry Process: Electronic import Information About Data Quality: High quality. Extensively studied site, with many measurements that show internal consistency between lines of evidence. Good QA/QC, sampling, and documentation. Quality Control: Manual and automated checks were performed to ensure data were accurately transferred from original source. Data were checked for accuracy by data provider.
References
NYSDEC (NY State Department of Environmental Conservation). 2007. Cortlandville Fact Sheet. NY State Department of Environmental Conservation. Albany, NY. Available at http://www.dec.ny.gov/ docs/remediation_hudson_pdf/712006fs.pdf (accessed October 2007).
NYSDEC (NY State Department of Environmental Conservation). 2007. Former Smith Corona Manufacturing Facility. Site Number 712006. NY State Department of Environmental Conservation. Albany, NY. Available at http://www.dec.ny.gov/chemical/8670.html (accessed October 2007).

U.S. EPA’s Vapor Intrusion Database Attachment C
The findings and conclusions in this report have not been formally disseminated by EPA and should not be construed to represent any Agency determination or policy.
C-39
STAFFORD STAFFORD, NJ
Geologic Setting
Hydrogeologic Setting: Unconsolidated and semi-consolidated shallow surficial aquifer
Groundwater Region: Atlantic and Gulf Coastal Plain
Aquifer Type: Shallow unconsolidated/semi-consolidated aquifers
Depth to Groundwater: 10–11 ft bgs
Soil Type (Texture Code): Coarse (S) Comments: Site underlain by fine to medium sand.
Contamination History
Discovery/Source: An LNAPL petroleum plume from leaking underground storage tank extends beneath the site. Chemicals of Concern: Petroleum hydrocarbons (BTEX; MTBE; cyclohexane; 2,2,4-trimethylpentane) Source Type: LNAPL Depth to Source: 5–10.5 ft below foundation General Surrounding Land Use: Mixed residential and commercial
Vapor Intrusion Investigation
Data Source: State (NJDEP) Timeframe(s) Sampled: 2002 Media Sampled (Distance): Indoor air, subslab, soil gas (1–2 m from building), groundwater (1–2 m from building)
Indoor Survey (y/n): Yes
Results of Indoor Survey: Identified background sources included paints, thinners, glues, and cleaning solvents (see Boyer [2002] below) Number of Buildings: 3 Building Use(s): Mixed residential and
commercial Foundation Type(s): Basement, crawlspace/basement, slab on grade
Data Provenance and Quality
Data Provider: NJDEP/Ian Hers Entry Process: Electronic import Information About Data Quality: High quality. Good sampling plan. Adequate QA/QC of the sampling and analysis data. Peer-reviewed publication. Quality Control: Manual and automated checks were performed to ensure data were accurately transferred from original source. Data were rechecked by the submitter.
References
Boyer, J.E. 2002. Background Contamination and its Impact on the Assessment of Vapor Intrusion. In Proceedings from the U.S. EPA Seminars on Air Indoor Vapor Intrusion. San Francisco, Dallas, and Atlanta. Dec 2002, Jan and Feb, 2003. Available at http://www.epa.gov/ttbnrmrl/625R03004/session2/ Boyer_Background_files/frame.htm#slide (accessed October 2007).
Golder Associates. 2006. Influence of Bioattenuation on Vapor Intrusion into Buildings – Model Simulations Using Semi-analytical One-Dimensional Model. Report to New Jersey Department of Environmental Protection, Trenton, NJ. Available at http://www.state.nj.us/dep/dsr/air/yr2-part3-biomodeling.pdf (accessed October 2007).
Sanders, P.F., and I. Hers. 2006. Vapor intrusion in homes over gasoline-contaminated ground water in Stafford, New Jersey. Ground Water Monitoring & Remediation 26(1): 63–72.

U.S. EPA’s Vapor Intrusion Database Attachment C
The findings and conclusions in this report have not been formally disseminated by EPA and should not be construed to represent any Agency determination or policy.
C-40
TWINS INN ARVADA, CO
Geologic Setting
Hydrogeologic Setting: River alluvium with overbank deposits
Groundwater Region: Nonglaciated Central
Aquifer Type: River valleys and floodplains with overbank deposits
Depth to Groundwater: 11–15 ft bgs
Soil Type (Texture Code): Fine (CL, LS, SI, SL) Comment: Site is underlain by fluvial sediments composed of sand fining up to silty clay.
Contamination History
Discovery/Source: Solvent plume migrating from chemical processing facility Chemicals of Concern: Chlorinated hydrocarbons (PCE; TCE; cis-DCE; 1,1-DCE; 1,1,1-TCA; 1,1-DCA) Source Type: Groundwater Depth to Source: 1.4–4.5 m below foundation General Surrounding Land Use: Mixed residential/commercial
Vapor Intrusion Investigation
Data Source: EPA Region 8 Timeframe(s) Sampled: March, July 2002 Media Sampled (Distance): Indoor air, groundwater (48–114 m)
Indoor Survey (y/n): Yes
Results of Indoor Survey: Background sources removed Number of Buildings: 2 Building Use(s): Residential, institutional Foundation Type(s): Basement, slab on grade
Data Provenance and Quality
Data Provider: Helen Dawson Entry Process: Electronic import Information About Data Quality: High quality. Good sampling plan, data collected according to EPA QA/QC protocol. Quality Control: Manual and automated checks were performed to ensure data were accurately transferred from original source. Data were rechecked by the submitter.
References
U.S. EPA (Environmental Protection Agency). n.d. U.S. EPA Region 8 fact sheet. Available at http://www.epa.gov/Region8/sf/co/twinsinn/index.html.

U.S. EPA’s Vapor Intrusion Database Attachment C
The findings and conclusions in this report have not been formally disseminated by EPA and should not be construed to represent any Agency determination or policy.
C-41
UNCASVILLE UNCASVILLE, CT
Geologic Setting
Hydrogeologic Setting: Outwash over crystalline bedrock
Groundwater Region: Northeast and Superior Uplands
Aquifer Type: Sand and gravel Depth to Groundwater: 2.9 m bgs Soil Type (Texture Code): Coarse (S)
Contamination History
Discovery/Source: NA Chemicals of Concern: Chlorinated hydrocarbons (PCE; 1,1,1-TCA) Source Type: Groundwater Depth to Source: 0.9 m below foundation General Surrounding Land Use: NA
Vapor Intrusion Investigation
Data Source: EPA Region 1 (2002 database) Timeframe(s) Sampled: 2000–2001 Media Sampled (Distance): Indoor air, soil gas (NA), groundwater (NA)
Indoor Survey (y/n): NA
Results of Indoor Survey: NA Number of Buildings Sampled: 4 Building Use(s): Residential Foundation Type(s): Basement
Data Provenance and Quality
Data Provider: Helen Dawson Entry Process: Electronic import Information About Data Quality: Medium quality. Data collected according to EPA QA/QC protocol but little information besides sample results is available. Quality Control: Manual and automated checks were performed to ensure data were accurately transferred from original source. Data were rechecked by the submitter.
References
None

U.S. EPA’s Vapor Intrusion Database Attachment C
The findings and conclusions in this report have not been formally disseminated by EPA and should not be construed to represent any Agency determination or policy.
C-42
WALL WALL TOWNSHIP, NJ
Geologic Setting
Hydrogeologic Setting: Unconsolidated/semi-consolidated shallow surficial aquifer
Groundwater Region: Atlantic and Gulf Coastal Plain
Aquifer Type: Shallow unconsolidated/semi-consolidated aquifers
Depth to Groundwater: 17–22 ft bgs
Soil Type (Texture Code): Coarse (S) Comments: The study area is situated in an essentially flat region of the New Jersey Coastal Physiographic province, with the topography ranging from about 50 feet above sea level at the western edge to sea level at the Atlantic Ocean. In some areas, the natural topography has been altered by human development. For example, the roads near Sun Cleaners were constructed on slightly raised embankments and existing streams were relocated. The soils at the site consist of coastal plain sand deposits.
Contamination History
Discovery/Source: Releases from 2 former dry cleaners have generated 2 large chlorinated solvent plumes. Chemicals of Concern: Chlorinated hydrocarbons (PCE) Source Type: Groundwater Depth to Source: 5.2 m below foundation General Surrounding Land Use: Residential Comments: The dissolved plumes emanating from the source area are over a mile long and have migrated below a mostly residential site with primarily single-family houses. While separate source areas exist to some extent, the plumes are co-mingled.
Vapor Intrusion Investigation
Data Source: State (NJDEP); EPA Region 1 Timeframe(s) Sampled: October 2001–February 2002
Media Sampled (Distance): Indoor air, groundwater (interpolated)
Indoor Survey (y/n): Yes
Results of Indoor Survey: See Appendix III in Golder Associates (2006) Number of Buildings: 43 Building Use(s): Residential single family homes Foundation Type(s): Basement Comments: Foundation depth averages 3.2 m bgs.
Data Provenance and Quality
Data Provider: NJDEP/Ian Hers Entry Process: Electronic import Information About Data Quality: High Quality: Well documented, good sampling plan, adequate QA/QC.Quality Control: Manual and automated checks were performed to ensure data were accurately transferred from original source. Data provider confirmed data using spot checks.
References
Golder Associates. 2006. Investigation of Indoor Air Quality in Structures Located above VOC-Contaminated Groundwater, Year Two, Part 2: Evaluation of Soil Vapor Intrusion at Wall Township Site, New Jersey. Prepared for New Jersey Department of Environmental Protection. Trenton, NJ. Available at http://www.state.nj.us/dep/dsr/air/yr2-part2-vapor-%20intrusion.pdf (accessed October 2007).
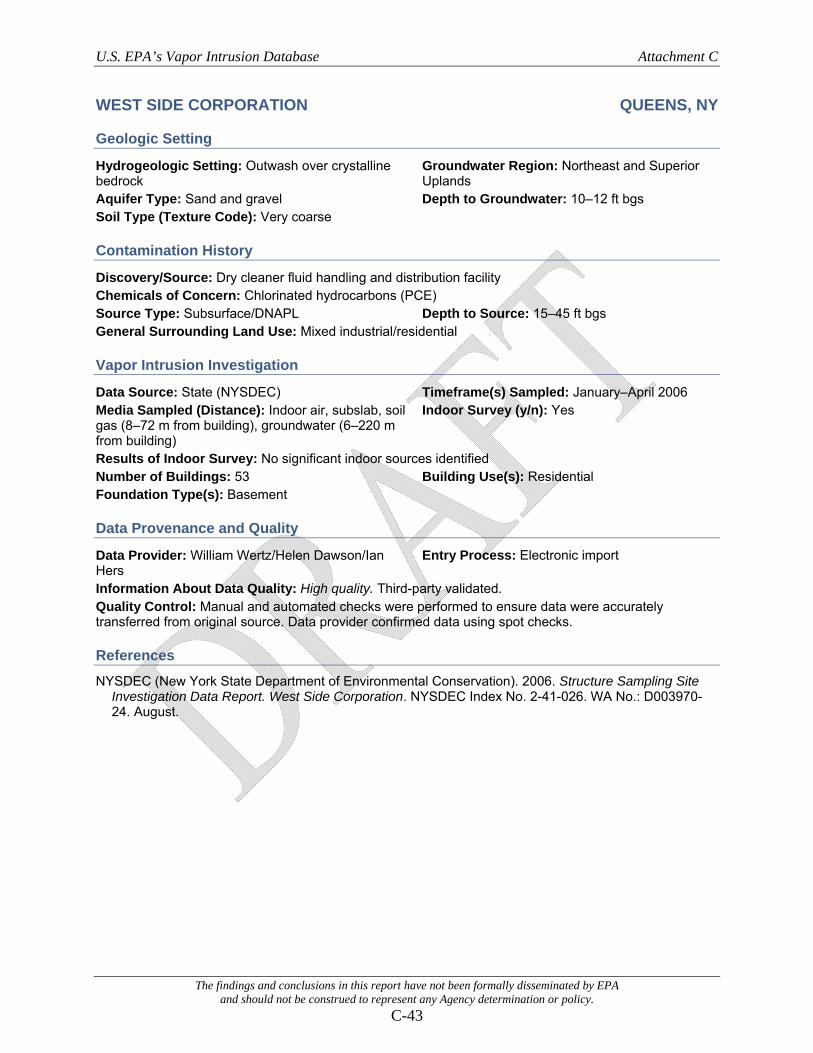
U.S. EPA’s Vapor Intrusion Database Attachment C
The findings and conclusions in this report have not been formally disseminated by EPA and should not be construed to represent any Agency determination or policy.
C-43
WEST SIDE CORPORATION QUEENS, NY
Geologic Setting
Hydrogeologic Setting: Outwash over crystalline bedrock
Groundwater Region: Northeast and Superior Uplands
Aquifer Type: Sand and gravel Depth to Groundwater: 10–12 ft bgs Soil Type (Texture Code): Very coarse
Contamination History
Discovery/Source: Dry cleaner fluid handling and distribution facility Chemicals of Concern: Chlorinated hydrocarbons (PCE) Source Type: Subsurface/DNAPL Depth to Source: 15–45 ft bgs General Surrounding Land Use: Mixed industrial/residential
Vapor Intrusion Investigation
Data Source: State (NYSDEC) Timeframe(s) Sampled: January–April 2006 Media Sampled (Distance): Indoor air, subslab, soil gas (8–72 m from building), groundwater (6–220 m from building)
Indoor Survey (y/n): Yes
Results of Indoor Survey: No significant indoor sources identified Number of Buildings: 53 Building Use(s): Residential Foundation Type(s): Basement
Data Provenance and Quality
Data Provider: William Wertz/Helen Dawson/Ian Hers
Entry Process: Electronic import
Information About Data Quality: High quality. Third-party validated. Quality Control: Manual and automated checks were performed to ensure data were accurately transferred from original source. Data provider confirmed data using spot checks.
References
NYSDEC (New York State Department of Environmental Conservation). 2006. Structure Sampling Site Investigation Data Report. West Side Corporation. NYSDEC Index No. 2-41-026. WA No.: D003970-24. August.

U.S. EPA’s Vapor Intrusion Database Attachment C
The findings and conclusions in this report have not been formally disseminated by EPA and should not be construed to represent any Agency determination or policy.
C-44
WZ CA BAY MOUNTAIN VIEW, CA
Geologic Setting
Hydrogeologic Setting: Coastal lowlands Groundwater Region: Alluvial Basins Aquifer Type: Alluvial basins, valleys, and fans Depth to Groundwater: 14 ft bgs Soil Type (Texture Code): Fine (C) Comments: Site is underlain by clay to 6 ft below ground surface. Below 6 ft, subsurface consists of clayey sand and gravel.
Contamination History
Discovery/Source: Manufacturing processes at the site released solvents to the subsurface. Chemicals of Concern: Chlorinated hydrocarbons (TCE) Source Type: Groundwater Depth to Source: 14 ft bgs General Surrounding Land Use: Commercial Comments: Soil cleanup was completed in 1985, and groundwater cleanup has been under way since 1986 using extraction and treatment techniques.
Vapor Intrusion Investigation
Data Spurce: Vapor intrusion workshop Timeframe(s) Sampled: May-December 2003 Media Sampled (Distance): Indoor air, groundwater (interpolated)
Indoor Survey (y/n): Yes
Results of Indoor Survey: No indoor sources of VOCs were identified; however, battery manufacturing occurs in one section of building. Number of Buildings: 1 Building Use(s): Commercial Foundation Type(s): Slab on grade Comments: Single-story building was constructed in 1965 and has 2 HVAC systems for 2 separate use areas. Cracks in floor slab serve as entry points for vapor. The building is currently part vacant office space and part occupied. The occupied space is used to manufacture batteries
Data Provenance and Quality
Data Provider: A. Wozniak/Ian Hers Entry Process: Hand entry Information About Data Quality: High quality. Investigation overseen by EPA (as lead agency), with QA/QC protocols conforming to EPA's requirements. Study well documented in presentation. Building pressurization used to verify vapor intrusion. Quality Control: Manual and automated checks were performed to ensure data were accurately transferred from original source. Data were checked for accuracy by the data provider.
References
Wozniak, A.A. 2004. Case Study of TCE Attenuation from Groundwater to Indoor Air and the Effects of Ventilation on Entry Routes. Presentation at the U.S. EPA Vapor Intrusion Workshop held at the AEHS 14th Annual West Coast Conference on Soils, Sediment and Water, San Diego, March 15–18. http://iavi.rti.org/WorkshopsAndConferences.cfm (accessed October 2007).