Embed Size (px)
Citation preview

U.S. Equity Market Chart Book
February 2019
Nick Reece, CFA Senior Financial Analyst, Merk Investments LLC

Chart - 2/8/2019.SPXFOR U Index (fred equ alloc) .SPX10Y U Index (2018-01-08 CIXI)
This report may not be modified or altered in any way. The BLOOMBERG PROFESSIONAL service and BLOOMBERG Data are owned and distributed locally by Bloomberg Finance LP (“BFLP”) and its subsidiaries in all jurisdictions other than Argentina, Bermuda, China, India, Japan and Korea (the (“BFLPCountries”). BFLP is a wholly-owned subsidiary of Bloomberg LP (“BLP”). BLP provides BFLP with all the global marketing and operational support and service for the Services and distributes the Services either directly or through a non-BFLP subsidiary in the BLP Countries. BFLP, BLP and their affiliatesdo not provide investment advice, and nothing herein shall constitute an offer of financial instruments by BFLP, BLP or their affiliates.
Bloomberg ® 02/08/2019 17:11:17 1
U.S. EQUITY MARKET CHART BOOK - FEB 2019
Analysis: If history is any guide, this chart suggests annualized S&P 500 returns (w/o dividends) might be close to 0% over the coming 10 year period. The grey dotted line is the market value of US equity divided by the total market value of US equity and debt, which is used as a proxy for aggregate equity allocation. The data comes from the quarterly Federal Reserve Z.1 report, the series will be updated next in late March. At 45.5% the equity allocation is relatively high
currently. Chart Framework: I’d likely get positive on the longer term outlook for the S&P at an allocation below 30%, which would likely only be after a substantial bear market in the S&P 500.
S&P 500 Valuation IndicatorAggregate Equity Allocation Proxy (From Fed Z.1 Report) and S&P 500 Subsequent 10 year annualized Returns
Source: Bloomberg, © Merk Investments LLC
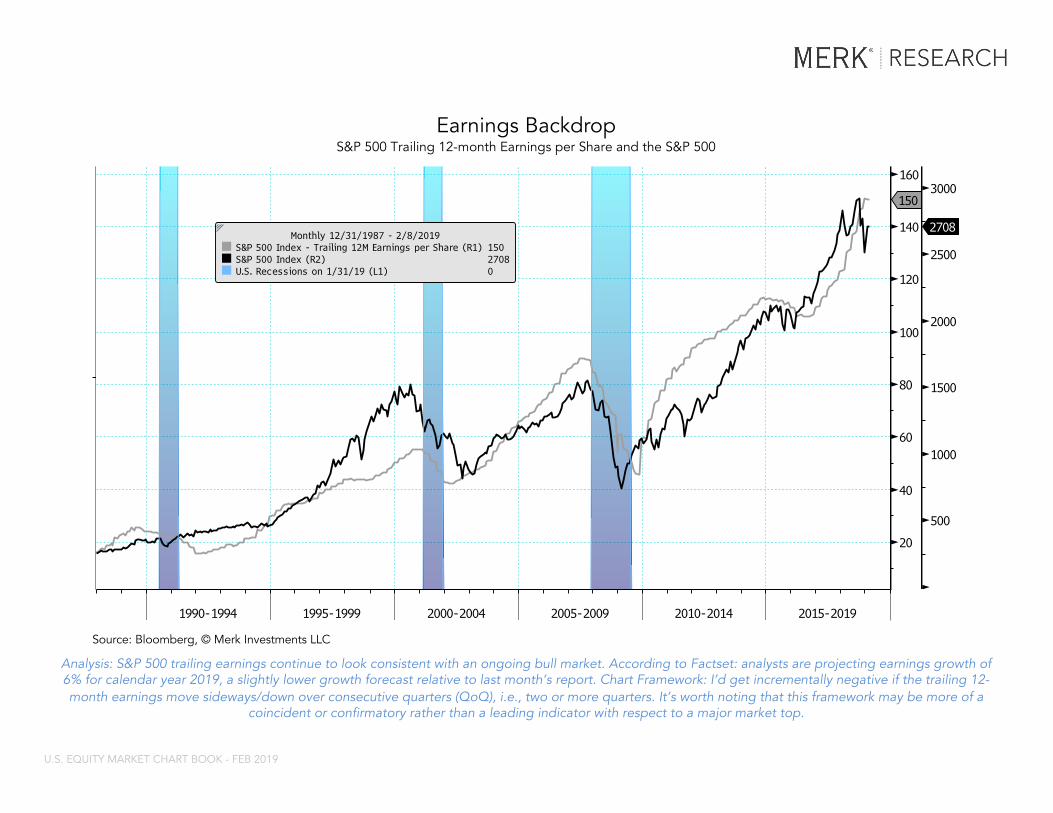
Chart - 2/8/2019SPX Index (S&P 500 Index) SPX Index (S&P 500 Index) USRINDEX Index (U.S. Recession Indicator...
This report may not be modified or altered in any way. The BLOOMBERG PROFESSIONAL service and BLOOMBERG Data are owned and distributed locally by Bloomberg Finance LP (“BFLP”) and its subsidiaries in all jurisdictions other than Argentina, Bermuda, China, India, Japan and Korea (the (“BFLPCountries”). BFLP is a wholly-owned subsidiary of Bloomberg LP (“BLP”). BLP provides BFLP with all the global marketing and operational support and service for the Services and distributes the Services either directly or through a non-BFLP subsidiary in the BLP Countries. BFLP, BLP and their affiliatesdo not provide investment advice, and nothing herein shall constitute an offer of financial instruments by BFLP, BLP or their affiliates.
Bloomberg ® 02/08/2019 17:11:17 2
Source: Bloomberg, © Merk Investments LLC
Analysis: S&P 500 trailing earnings continue to look consistent with an ongoing bull market. According to Factset: analysts are projecting earnings growth of 6% for calendar year 2019, a slightly lower growth forecast relative to last month’s report. Chart Framework: I’d get incrementally negative if the trailing 12-month earnings move sideways/down over consecutive quarters (QoQ), i.e., two or more quarters. It’s worth noting that this framework may be more of a
coincident or confirmatory rather than a leading indicator with respect to a major market top.
Earnings BackdropS&P 500 Trailing 12-month Earnings per Share and the S&P 500
U.S. EQUITY MARKET CHART BOOK - FEB 2019

Chart - 2/8/2019SPX Index (S&P 500 Index) LEI TOTL Index (Conference Board US Lead... USRINDEX Index (U.S. Recession Indicator...
This report may not be modified or altered in any way. The BLOOMBERG PROFESSIONAL service and BLOOMBERG Data are owned and distributed locally by Bloomberg Finance LP (“BFLP”) and its subsidiaries in all jurisdictions other than Argentina, Bermuda, China, India, Japan and Korea (the (“BFLPCountries”). BFLP is a wholly-owned subsidiary of Bloomberg LP (“BLP”). BLP provides BFLP with all the global marketing and operational support and service for the Services and distributes the Services either directly or through a non-BFLP subsidiary in the BLP Countries. BFLP, BLP and their affiliatesdo not provide investment advice, and nothing herein shall constitute an offer of financial instruments by BFLP, BLP or their affiliates.
Bloomberg ® 02/08/2019 17:11:17 3
Source: Bloomberg, © Merk Investments LLC
Analysis: The LEI Index is just below its highs for the cycle- it’s too early to say whether this is a negative sign. Chart Framework: I’d get incrementally negative on the outlook for the S&P if the LEI Index began trending sideways to down (on a YoY basis) while the S&P was at or
near bull market highs.
Business Cycle BackdropLeading Economic Indicators (LEI) Index and the S&P 500
U.S. EQUITY MARKET CHART BOOK - FEB 2019

Chart - 2/8/2019CPMINDX Index (China Manufacturing PMI S... SPX Index (S&P 500 Index)MPMIJPMA Index (Nikkei Japan Manufacturi... NAPMPMI Index (ISM Manufacturing PMI SA) MPMIDEMA Index (Markit/BME Germany Manuf...
This report may not be modified or altered in any way. The BLOOMBERG PROFESSIONAL service and BLOOMBERG Data are owned and distributed locally by Bloomberg Finance LP (“BFLP”) and its subsidiaries in all jurisdictions other than Argentina, Bermuda, China, India, Japan and Korea (the (“BFLPCountries”). BFLP is a wholly-owned subsidiary of Bloomberg LP (“BLP”). BLP provides BFLP with all the global marketing and operational support and service for the Services and distributes the Services either directly or through a non-BFLP subsidiary in the BLP Countries. BFLP, BLP and their affiliatesdo not provide investment advice, and nothing herein shall constitute an offer of financial instruments by BFLP, BLP or their affiliates.
Bloomberg ® 02/08/2019 17:11:17 4 Analysis: The Chinese and German Manufacturing PMIs are now below the 50 level, which divides expansion from contraction. I’m currently
neutral/negative on this picture given my framework. Chart Framework: I’d get incrementally negative on the S&P outlook if any of these PMIs fell below 50. Would get positive if all readings are above 50.
Global Growth BackdropLarge Economy Manufacturing PMIs (Purchasing Managers Index) and the S&P 500
Source: Bloomberg, © Merk Investments LLC
U.S. EQUITY MARKET CHART BOOK - FEB 2019

Chart - 2/8/2019NFCIINDX Index (Chicago Fed National Fin... SPX Index (S&P 500 Index)
This report may not be modified or altered in any way. The BLOOMBERG PROFESSIONAL service and BLOOMBERG Data are owned and distributed locally by Bloomberg Finance LP (“BFLP”) and its subsidiaries in all jurisdictions other than Argentina, Bermuda, China, India, Japan and Korea (the (“BFLPCountries”). BFLP is a wholly-owned subsidiary of Bloomberg LP (“BLP”). BLP provides BFLP with all the global marketing and operational support and service for the Services and distributes the Services either directly or through a non-BFLP subsidiary in the BLP Countries. BFLP, BLP and their affiliatesdo not provide investment advice, and nothing herein shall constitute an offer of financial instruments by BFLP, BLP or their affiliates.
Bloomberg ® 02/08/2019 17:11:17 5 Analysis: Financial conditions have eased slightly since last month’s report, from -0.71 to -0.78, as of the week ending 2/8/2019. Financial
conditions are generally still at an accommodative level, and generally still supportive of the stock market. Chart Framework: I’d get incrementally negative on the outlook for the S&P if financial conditions moved through the -0.50 level.
U.S. Financial ConditionsChicago Fed National Financial Conditions Index and the S&P 500
Source: Bloomberg, © Merk Investments LLC
U.S. EQUITY MARKET CHART BOOK - FEB 2019

Chart - 2/8/2019SPX Index (S&P 500 Index) TRADCADS Index (Bloomberg Cumulative Adv...
This report may not be modified or altered in any way. The BLOOMBERG PROFESSIONAL service and BLOOMBERG Data are owned and distributed locally by Bloomberg Finance LP (“BFLP”) and its subsidiaries in all jurisdictions other than Argentina, Bermuda, China, India, Japan and Korea (the (“BFLPCountries”). BFLP is a wholly-owned subsidiary of Bloomberg LP (“BLP”). BLP provides BFLP with all the global marketing and operational support and service for the Services and distributes the Services either directly or through a non-BFLP subsidiary in the BLP Countries. BFLP, BLP and their affiliatesdo not provide investment advice, and nothing herein shall constitute an offer of financial instruments by BFLP, BLP or their affiliates.
Bloomberg ® 02/08/2019 17:11:17 17
Analysis: The cumulative advance-decline line for the S&P 500 recently made another new all time high, which suggests continued broad participation in the bull market. I’d get cautious on this picture if there was a divergence in which the S&P 500 was making new all time highs but the cumulative a/d line was not.*The cumulative a/d line is a daily series that takes the previous cumulative a/d line value and adds the number of daily advancers (i.e., the number of S&P 500 member stocks that gained in price on the day) and subtracts the daily decliners (i.e., the number of S&P 500 member stocks the declined in price on the day).
For example, if 276 member stocks were up for the day, and 224 member stocks were down for the day, the cumulative a/d line would move up by 52.
S&P 500 Market BreadthS&P 500 Index and the S&P 500 Cumulative Advance-Decline Line*
Source: Bloomberg, © Merk Investments LLC
U.S. EQUITY MARKET CHART BOOK - FEB 2019

Chart - 2/8/2019.BULVBEAR U Index (aaii bulls / (bulls +... SPX Index (S&P 500 Index)
This report may not be modified or altered in any way. The BLOOMBERG PROFESSIONAL service and BLOOMBERG Data are owned and distributed locally by Bloomberg Finance LP (“BFLP”) and its subsidiaries in all jurisdictions other than Argentina, Bermuda, China, India, Japan and Korea (the (“BFLPCountries”). BFLP is a wholly-owned subsidiary of Bloomberg LP (“BLP”). BLP provides BFLP with all the global marketing and operational support and service for the Services and distributes the Services either directly or through a non-BFLP subsidiary in the BLP Countries. BFLP, BLP and their affiliatesdo not provide investment advice, and nothing herein shall constitute an offer of financial instruments by BFLP, BLP or their affiliates.
Bloomberg ® 02/08/2019 17:11:17 7 Analysis: Bullishness is currently slightly above the long term average. In my view this chart should be looked at from a contrarian perspective. Given that
sentiment is not far from the average, my current interpretation of this chart is neutral. Chart Framework: I’d get incrementally negative on this picture with sentiment at or above 70 and incrementally positive with sentiment at or below 30.
Market SentimentPercent that are Bullish (bulls / bulls+bears) and S&P 500
Source: Bloomberg, © Merk Investments LLC
U.S. EQUITY MARKET CHART BOOK - FEB 2019

Chart - 2/8/2019.MARGDEBT U Index (from 2018-02-01 margi... SPX Index (S&P 500 Index) (Margin Debt / S&P 500 Index) YoY RoC
This report may not be modified or altered in any way. The BLOOMBERG PROFESSIONAL service and BLOOMBERG Data are owned and distributed locally by Bloomberg Finance LP (“BFLP”) and its subsidiaries in all jurisdictions other than Argentina, Bermuda, China, India, Japan and Korea (the (“BFLPCountries”). BFLP is a wholly-owned subsidiary of Bloomberg LP (“BLP”). BLP provides BFLP with all the global marketing and operational support and service for the Services and distributes the Services either directly or through a non-BFLP subsidiary in the BLP Countries. BFLP, BLP and their affiliatesdo not provide investment advice, and nothing herein shall constitute an offer of financial instruments by BFLP, BLP or their affiliates.
Bloomberg ® 02/08/2019 17:11:17 8
Analysis: In the previous two major market tops for the S&P 500 (2000 and 2007), margin debt rose significantly relative to the equity market, possibly reflecting the euphoric phase of the bull market, or long positions switching from strong hands (unlevered) to weak hands (levered). Currently margin debt is not rising relative to the stock market (bottom panel), perhaps supportive of the idea that the bull market isn’t over.
Chart Framework: I’d get incrementally negative on the outlook for the S&P if YoY rate of change of the ratio (bottom panel) moved above 40.
Margin DebtMargin Debt and S&P 500 (top panel), 12 month change in Ratio of Margin Debt / S&P 500 (bottom panel)
Source: Bloomberg, © Merk Investments LLC
U.S. EQUITY MARKET CHART BOOK - FEB 2019

Analysis: This is a very simple diagram to help visualize how volatility and correlation relate to the conventional concept of portfolio risk. Volatility measures how much movement an individual asset has relative to itself, and correlation measures how much movement an individual asset has relative to other assets in
a portfolio. For a given portfolio, the lower the volatility of each individual asset and the lower the correlation between the assets, the “lower risk” the portfolio will be, as measured by portfolio standard deviation—and vice versa for high volatility and high correlation. Counter-intuitively I would argue that
longer-term investors might actually want to think the opposite way—that is to become cautious when asset portfolios appear low risk and consider opportunities when asset portfolios appear high risk. To paraphrase Warren Buffett: it’s better to be fearful when others are greedy and greedy when others
are fearful.
Correlation and Volatility FrameworkOn the below diagram Correlation rises along the vertical axis from bottom to top, and Volatility rises on the horizontal axis from left to right
Source: © Merk Investments LLC
U.S. EQUITY MARKET CHART BOOK - FEB 2019

Chart - 2/8/2019.SPXCORR5 U Index (rolling correlation (... .SPXVOL5 U Index (rolling correlation (2...
This report may not be modified or altered in any way. The BLOOMBERG PROFESSIONAL service and BLOOMBERG Data are owned and distributed locally by Bloomberg Finance LP (“BFLP”) and its subsidiaries in all jurisdictions other than Argentina, Bermuda, China, India, Japan and Korea (the (“BFLPCountries”). BFLP is a wholly-owned subsidiary of Bloomberg LP (“BLP”). BLP provides BFLP with all the global marketing and operational support and service for the Services and distributes the Services either directly or through a non-BFLP subsidiary in the BLP Countries. BFLP, BLP and their affiliatesdo not provide investment advice, and nothing herein shall constitute an offer of financial instruments by BFLP, BLP or their affiliates.
Bloomberg ® 02/08/2019 17:11:17 9
Analysis: Correlation and volatility are now near the middle of the long term range, after having moved higher over the past year. In my view this chart should be looked at from a contrarian perspective, and currently suggests a neutral outlook medium-term. Framework: S&P 500 subsequent medium-term returns are likely to be most attractive when both correlation and volatility are high and have lots of room to decline, for example in 2009. *GICS = Global Industry Classification Standards. The 10 sectors used for this analysis are: Consumer Discretionary, Consumer Staples, Energy, Financials, Health Care, Industrials, Information Technology, Materials, Telecommunication Services, and Utilities. In 2016 Real Estate was added as an 11th GICS Sector, which had been
part of the Financials sectors. The S&P 500 stocks are each assigned to a sector. The correlation reading (black line) represents the average of all sector correlations to the S&P 500 (i.e., Correlation between Financials and S&P 500 + Correlation between Energy and S&P 500 etc., divided by 10). The volatility reading (grey line) represents the average the sector volatilities (i.e., Volatility of
Financials + Volatility of Energy etc…., divided by 10)
S&P 500 Correlation and VolatilityAvg. 2-yr Correlation of GICS* Sector Indexes to the S&P 500 Index and Avg. GICS Sector Index 1-yr realized volatility
Source: Bloomberg, © Merk Investments LLC
U.S. EQUITY MARKET CHART BOOK - FEB 2019

Chart - 2/8/2019EPUCNUSD Index (US Economic Policy Uncer... SPX Index (S&P 500 Index)
This report may not be modified or altered in any way. The BLOOMBERG PROFESSIONAL service and BLOOMBERG Data are owned and distributed locally by Bloomberg Finance LP (“BFLP”) and its subsidiaries in all jurisdictions other than Argentina, Bermuda, China, India, Japan and Korea (the (“BFLPCountries”). BFLP is a wholly-owned subsidiary of Bloomberg LP (“BLP”). BLP provides BFLP with all the global marketing and operational support and service for the Services and distributes the Services either directly or through a non-BFLP subsidiary in the BLP Countries. BFLP, BLP and their affiliatesdo not provide investment advice, and nothing herein shall constitute an offer of financial instruments by BFLP, BLP or their affiliates.
Bloomberg ® 02/08/2019 17:11:17 10
Analysis: There may still be some “wall-of-worry” left to climb before the bull market ends. Uncertainty has decreased since last month’s report, but remains somewhat elevated (inverse axis). Counter-intuitively I would argue that uncertainty is generally a positive for the market on a forward looking basis as it gives uncertainty more room to decline going forward. Chart Framework: I’d get incrementally negative on the
outlook for the S&P around the 50 level on policy uncertainty.
UncertaintyU.S. Economic Policy Uncertainty Index and S&P 500
Source: Bloomberg, © Merk Investments LLC
Lower Uncertainty
Higher Uncertainty
U.S. EQUITY MARKET CHART BOOK - FEB 2019

Chart - 2/8/2019VIX Curve Steepeness
This report may not be modified or altered in any way. The BLOOMBERG PROFESSIONAL service and BLOOMBERG Data are owned and distributed locally by Bloomberg Finance LP (“BFLP”) and its subsidiaries in all jurisdictions other than Argentina, Bermuda, China, India, Japan and Korea (the (“BFLPCountries”). BFLP is a wholly-owned subsidiary of Bloomberg LP (“BLP”). BLP provides BFLP with all the global marketing and operational support and service for the Services and distributes the Services either directly or through a non-BFLP subsidiary in the BLP Countries. BFLP, BLP and their affiliatesdo not provide investment advice, and nothing herein shall constitute an offer of financial instruments by BFLP, BLP or their affiliates.
Bloomberg ® 02/08/2019 17:11:17 11
Analysis: The VIX curve is currently positively sloped, meaning future expected VIX is higher than the current VIX (VIX represents an estimate of the 30 day implied volatility of the S&P 500). In my view when the VIX curve is negative the drawdown phase is still ongoing, when positive it may suggest the correction is over for the time being. Chart Framework: this chart is best used for judging when drawdown periods might be
over. If a negatively sloped VIX curve (i.e., grey area below zero) persisted that could be a sign of stress remaining in the market.
VIX Curve(3-month futures implied VIX minus spot VIX) and S&P 500
Source: Bloomberg, © Merk Investments LLC
U.S. EQUITY MARKET CHART BOOK - FEB 2019

Chart - 2/8/2019SPX Index (S&P 500 Index)
This report may not be modified or altered in any way. The BLOOMBERG PROFESSIONAL service and BLOOMBERG Data are owned and distributed locally by Bloomberg Finance LP (“BFLP”) and its subsidiaries in all jurisdictions other than Argentina, Bermuda, China, India, Japan and Korea (the (“BFLPCountries”). BFLP is a wholly-owned subsidiary of Bloomberg LP (“BLP”). BLP provides BFLP with all the global marketing and operational support and service for the Services and distributes the Services either directly or through a non-BFLP subsidiary in the BLP Countries. BFLP, BLP and their affiliatesdo not provide investment advice, and nothing herein shall constitute an offer of financial instruments by BFLP, BLP or their affiliates.
Bloomberg ® 02/08/2019 17:11:17 12
Analysis: The 50-day moving average (grey line) remains below the 200-day moving average (black line), but is now trending higher. The market has rebounded sharply since the Christmas Eve lows, but seems to have hit some resistance at the 200-day moving average (black line). My current interpretation of this picture is neutral/negative. Chart Framework: I’d get positive if the S&P 500 appeared to be making higher highs and higher lows and if the 50d MA
crossed above the 200d MA.
S&P 500 TechnicalsS&P 500 daily open-high-low-close chart with 50-day and 200-day Moving Averages (MA)
Source: Bloomberg, © Merk Investments LLC
U.S. EQUITY MARKET CHART BOOK - FEB 2019

Chart - 2/8/2019SPX Index (S&P 500 Index)
This report may not be modified or altered in any way. The BLOOMBERG PROFESSIONAL service and BLOOMBERG Data are owned and distributed locally by Bloomberg Finance LP (“BFLP”) and its subsidiaries in all jurisdictions other than Argentina, Bermuda, China, India, Japan and Korea (the (“BFLPCountries”). BFLP is a wholly-owned subsidiary of Bloomberg LP (“BLP”). BLP provides BFLP with all the global marketing and operational support and service for the Services and distributes the Services either directly or through a non-BFLP subsidiary in the BLP Countries. BFLP, BLP and their affiliatesdo not provide investment advice, and nothing herein shall constitute an offer of financial instruments by BFLP, BLP or their affiliates.
Bloomberg ® 02/08/2019 17:11:17 15 Analysis: For 2018 the S&P 500 was down 6.2%. As of 2/8/2019 the S&P 500 is about +8% year-to-date. Coming into 2019 sell-side forecasts were for a 10%
to 20% return this year. From 1928 to 2017 the S&P 500 average annual return was 5.7%, but the S&P 500 returned between 0-10% in only 15 of those 90 years (17% of the time); in other words average years are actually rare. 51% of years had returns above 10%, and 32% of years had negative returns. It may be
worth noting that the S&P 500 is up over 10% in the majority of years.
Calendar Year S&P 500 Returns1928-to-Present Calendar Year Returns (dividends not included)
Source: Bloomberg, © Merk Investments LLC
U.S. EQUITY MARKET CHART BOOK - FEB 2019

Page Chart Time Horizon Per Framework Characterization
2 Valuation Long Term Negative
3 Earnings Short/Medium Term Neutral/Positive
4 Business Cycle Short/Medium Term Positive
5 Global growth Short/Medium Term Negative
6 Financial Conditions Short/Medium Term Positive
7 Market Breadth Medium/Longer Term Positive
8 Market Sentiment Short/Medium Term Neutral
9 Margin Debt Medium/Longer Term Neutral/Positive
11 Correlations/Volatility Medium/Longer Term Negative
12 Uncertainty Medium/Longer Term Positive
13 VIX Curve Short Term Positive
14 S&P 500 50d v 200d MA Medium Term Neutral/Negative
Time Horizon Overall Characterization
Short Term (<6 months) Neutral/Positive with high uncertainty
Medium/Longer Term (6m-5years) Neutral/Negative with high uncertainty
Checklist (February 2019)
© Merk Investments LLC
U.S. EQUITY MARKET CHART BOOK - FEB 2019

The S&P 500 is currently still in a drawdown, as of 2/8/2019 the S&P 500 is about 8% below the previous all time high close on 9/20/2018. Themarket has recently rebounded substantially from being down 19.8% from the the September high, which was at the close on Christmas Eve.My base case scenario remains that we are in the midst of normal correction in an ongoing bull market and that the S&P 500 will recover tomake new all time highs before the next bear market.
My biggest concern remains weakness in the global economy, specifically China and Germany, where the manufacturing PMIs are below 50.The most likely catalyst for an economic rebound globally would be a resolution (and tariff reduction) on the US/China trade dispute, and anyfurther announcements on meaningful Chinese fiscal stimulus.
The business cycle backdrop and continued earnings growth still generally look positive for the U.S. equity market, although there has beensoftening on both indicators recently. Also, market breadth looks very positive, with the cumulative advance-decline line making new all timehighs, presenting a bullish divergence, and suggesting that the S&P 500 Index might follow on to make new all time highs as well.
What keeps me cautious on the medium to longer-term (roughly 1-5 year) outlook is the high overall equity allocation, which suggests highvaluation and low expected returns on average over the next ten years.
-Nick Reece, CFA
Conclusion/Thoughts
U.S. EQUITY MARKET CHART BOOK - FEB 2019

DisclosureThis report was prepared by Merk Investments LLC, and reflects the current opinion of the authors. It is based upon sources and data believed to be accurate and reliable. Merk Investments LLC makes no representation regarding the advisability of investing in the products herein. Opinions and forward-looking statements expressed are subject to change without notice. This information does not constitute investment advice and is not intended as an endorsement of any specific investment. The information contained herein is general in nature and is provided solely for educational and informational purposes. The information provided does not constitute legal, financial or tax advice. You should obtain advice specific to your circumstances from your own legal, financial and tax advisors. Past performance is no guarantee of future results.
* * *
Explicit permission must be obtained from Merk Investments LLC in order to replicate, copy, distribute or quote from this document or any portion thereof.
Published by Merk Investments LLC
© 2019 Merk Investments LLC