Embed Size (px)
Citation preview
16 February 2017
US ETF Compass
North America Synthetic Equity & Index Strategy
US ETF CompassDate16 February 2017
Deutsche BankMarkets Research
Markets and flows fuel strongest yearstart for ETPs adding $91bn in JanuaryJanuary shows a kind hand for most asset class returnsMost asset classes were off to a strong start in January. Global Equities were upby 2.91% during last month, with EM equities posting gains of 6.66%, and IntlDM and US equities advancing by 3.29% and 1.86%, respectively. Similarly, FixedIncome registered mostly gains; while Commodities recorded losses of 0.57%,dragged mainly by Energy (-4.85%). On the currency side, the USD weakenedagainst most major currencies, retreating by 2.76% (UUP).
Best January inflows of $42bn fueled best January asset gain of $91bnETPs registered their highest monthly inflows, attracting $41.8bn. The inflowsand strong markets sent assets $91bn (+3.6%) higher from one month earlier,ending with a total of $2.62 trillion last month. Equity and Fixed Income productsregistered inflows of $29.0bn and $13.8bn, respectively; while, Commodity ETPsexperienced outflows of $0.9bn.
2017 poised for another record year on the back of strong JanuaryHistorically, January has been the weakest month for ETP flows. Therefore thealmost $42bn inflows going into ETPs last month are anything but the norm. Webelieve that based on our historical forecast model a flow of this size projectsan annual flow of about $382bn, which puts a $400bn inflow milestone withintotal reach.
An alternative look at ETF growth and Google TrendsETFs win the popular vote in a landslide in the last 13 years combined. Based onGoogle Trends search-term popularity, ETFs won 40 of the 50 states and DC overthe last 13 years, outpacing Mutual Funds, Hedge Funds, and Index Funds.
In focus: American Industrial Renaissance, Cybersecurity, Nuclear & RoboticsThe American Industrial Renaissance theme has seen strong investment demandsupport following the last US presidential election, and the new fiscal policyrhetoric should continue to be a tailwind for the theme. Cybersecurity, whichwas going through a cool down period from a flow perspective, has made aremarkable comeback. Similarly, the Nuclear theme has also begun to gain someflow traction again, following a dormant period. And last but not least, Roboticshas also begun to experience a significant pick up in investor interest.
Sebastian Mercado, CFA
Strategist
+1-212-250-8690
Hallie Martin
Strategist
+1-212-250-7994
Srineel Jalagani, CFA
Strategist
+1-212-250-2060
Deutsche Bank Securities Inc.
Deutsche Bank does and seeks to do business with companies covered in its research reports. Thus, investors should beaware that the firm may have a conflict of interest that could affect the objectivity of this report. Investors should considerthis report as only a single factor in making their investment decision. DISCLOSURES AND ANALYST CERTIFICATIONSARE LOCATED IN APPENDIX 1.MCI (P) 057/04/2016.
Distributed on: 16/02/2017 06:27:09 GMT
16 February 2017
US ETF Compass
Table Of Contents
ETF Monthly Insights ....................................................... 3January shows a kind hand for most asset class returns ............................... 3Best January inflows of $42bn fueled best January asset gain of $ ............... 42017 poised for another record year on the back of strong January .............. 5An alternative look at ETF growth and Google Trends ................................... 7In focus: American Industrial Renaissance, Cybersecurity, Nuclear ............... 8
Asset Allocation Heatmaps ............................................ 13Global Multi Asset Allocator heatmaps ........................................................ 13US Equity Allocator heatmaps ..................................................................... 15International Equity Allocator heatmaps ...................................................... 17Cross Asset Correlations .............................................................................. 1912-Month Relative Performance Monitor ..................................................... 20House View Portfolio: Monthly Brief ............................................................ 21
Business Intelligence ...................................................... 22New Listing .................................................................................................. 22Delistings ...................................................................................................... 24Trends in products launched in the last 12 months ..................................... 25Popular Products Segment: Smart Beta & Currency Hedged ....................... 26Average Performance by Products Type and Size (Equity) ........................... 27Total Expense Ratio X-Ray ............................................................................ 29
ETF Statistics .................................................................. 30Global ETF Assets and Provider Ranking ..................................................... 30US Historical ETF Trends .............................................................................. 31ETF Issuer and Index Provider league tables ................................................ 32Monthly Snapshot ........................................................................................ 34Top 15 ETFs (includes ETNs) ........................................................................ 40
Appendix A: ETN Snapshot ............................................ 41
Appendix B: ETF List ...................................................... 42
Appendix C: Definitions ................................................. 45ETP Universe Definitions .............................................................................. 45Management Style or Product Strategy Definitions ..................................... 45Product Type Definitions .............................................................................. 46
Page 2 Deutsche Bank Securities Inc.
16 February 2017
US ETF Compass
ETF Monthly InsightsJanuary shows a kind hand for most asset class returns
The year start was quite benevolent for both risky and safe haven assets,most of which registered positive returns; however, Energy commodity assetsexperienced a pullback. Global Equities were up by 2.91% during last month,mainly boosted by EM equities with a performance of 6.66%; similarly, Intl DMand US equities recorded positive returns of 3.29% and 1.86%, respectively. FixedIncome registered mostly gains, led by Convertible bonds (+2.87%), followed byIntl Inflation and Preferred debt with returns of 2.42% and 2.39%, respectively.Commodities recorded losses of 0.57%, dragged by Energy commodity losses of4.85%; meanwhile, Industrial Metals and Precious Metals posted positive returnsof 9.38% and 6.28%, respectively. On the currency side, the USD weakenedagainst most major currencies, as suggested by the 2.76% drop in UUP.
Performance and flows were mostly consistent during January, except withinPrecious Metals. Flows and performance were positive for EM markets,particularly for Latin America and Frontier Market which registered gains of11.11% and 9.79%, accompanied by inflows of 3.5% and 1.7% of assets,respectively. In the meantime, Intl DM ETFs received 2.7% of assets in inflows,with Europe and Japan registering 2.96% and 3.5% in positive returns, and 2.7%and 3.9% of assets in inflows, respectively. In the fixed income space mostof the sectors received inflows, particularly those with low duration risk. Theinflows were led by very short-term US Treasuries (16.9% of assets), followedby Corporate Floater (10.3%) and Senior Loans (10.8%). On the other hand,Palladium, Platinum, and Silver registered outflows of 4.1%, 1.0%, and 1.3% ofassets; despite all of them posting positive returns of about 10%.
Within US equities, performance was mostly positive with moderate inflowsacross most sector and industries last month. The following sectors experiencedthe most significant inflows: Telecom (10.7% of assets) and Materials (5.2%);while, Utilities and Consumer Staples experienced the largest outflows losing7.8% and 2.0% of their assets during January, respectively. On the other hand atthe industry level, Retail and Healthcare Eq. & Supplies experienced the largestinflows amounting to 48.9% and 15.7% of their assets, respectively; meanwhile,Energy E&P and Large Pharma registered outflows of 6.9% and 3.1% of theirassets, respectively.
In international equity markets, we saw consistent inflows and positiveperformance across most exposures. The most negative performance was Greece(-2.82%), followed by Italy with a loss of 1.94%. While on the other hand, Polandand Argentina posted the top gains, registering positive performance of 11.43%and 11.36%, respectively. On the flow side, UK experienced the largest inflowswith 21.3% of assets; meanwhile, Hong Kong saw the largest outflows (12.7%of assets).
In terms of correlation trends, we have seen most asset classes (with theexception of Real Estate) move towards zero decoupling from Global Equitiesreturns.
Deutsche Bank Securities Inc. Page 3
16 February 2017
US ETF Compass
Best January inflows of $42bn fueled best January assetgain of $91bn
January was favorable for Equity and Fixed Income ETPs; while, Commodity ETPsexperienced negative numbers. ETPs registered positive flows attracting $41.8bnin new cash; helping assets to rise 3.6% from one month earlier, ending with atotal of $2.62 trillion at the end of January. Equity and Fixed Income productsregistered inflows of $29.0bn and $13.8bn, respectively; while, Commodity ETPsexperienced outflows of $0.9bn.
Among the most relevant inflow trends, we saw US Equities with $16.4bn (68.6%of DM Equity total flows) and Japanese Equities with $1.1bn; while, on the fixedincome space, Corporate and Broad debt recorded $2.3bn and $1.8bn in positiveflows, respectively. On the outflow side, Hong Kong and Eurozone equitiesregistered another month with outflows of $0.21bn and $0.16bn, respectively.Beta, Smart Beta, and Active products experienced inflows of $34.9bn, $6.3bn,and $0.9bn, respectively; while, Beta+ (leveraged and inverse) registered outflowsby $0.3bn.
Within Equity Smart Beta products, Style and Fundamental ETFs were the mostpopular categories in January, adding $2.3bn and $1.5bn in fresh new cash,respectively. Currency Hedged ETFs experienced a positive month followinga tough 2016, registering $0.7bn in inflows. The largest negative flows wereexperienced by ETFs offering FX hedged exposure to EUR (-$0.3bn); while, FXhedged exposure to Multiple Currencies experienced inflows of $0.6bn duringJanuary. In term of products types, Asset Allocation and Cash Managementregistered inflows of $24.8bn and $19.8bn, respectively; meanwhile, PseudoFutures and Leveraged & Inverse recorded outflows of $2.4bn and $0.3bn,respectively.
Total ETP turnover was $1.40 trillion last month, down 10% from the previousmonth. Furthermore, ETF turnover represented 25.2% of all cash equity traded inthe US during January, below its 12-month average of 25.9%.
Page 4 Deutsche Bank Securities Inc.

16 February 2017
US ETF Compass
2017 poised for another record year on the back of strongJanuary
January is usually the weakest month for flows...not this timeHistorically, January has been the weakest month for ETP flows. In fact, ananalysis of monthly ETP flows seasonality of the previous 10 years showed that inaverage January monthly flows only accounted for 1.5% of the total annual ETPflows. Moreover, the first quarter has also been the weakest period for ETP flowsaccounting for only 14% in average over the last 10 years. Therefore the almost$42bn inflows going into ETPs last month are anything but the norm. In fact, the$42bn inflows are the largest absolute dollar amount gathered in a January monthever; and from a relative (to assets) perspective, they are the third largest inflowreading for the first month of the year in the last 11 years.
Figure 1: 10-Year Average Monthly ETP Flow Seasonality(2007-2016)
0%
10%
20%
30%
40%
50%
60%
70%
80%
90%
100%
0%
5%
10%
15%
20%
25% C
um
ula
tive D
istr
ibu
tio
n
10
Y A
vg
. (J
an
CF /
Fu
ll Y
ear
CF) %
Avg. (Jan CF / FY CF) %
Cum Dist.
Source: Deutsche Bank, Bloomberg Finance LP
Figure 2: 10Y Avg. Quarterly market share of annualflows
Q1, 14%
Q2, 18%
Q3, 28%
Q4, 40%
10Y Avg. (Quarterly CF / FY CF) %
Q1
Q2
Q3
Q4
Source: Deutsche Bank, Bloomberg Finance LP
Figure 3: January ETP cash flows 2007-2017
-40,000
-30,000
-20,000
-10,000
0
10,000
20,000
30,000
40,000
50,000
-2.4%
-1.8%
-1.2%
-0.6%
0.0%
0.6%
1.2%
1.8%
2.4%
3.0%
20
07
20
08
20
09
20
10
20
11
20
12
20
13
20
14
20
15
20
16
20
17
Jan
uary
Cash
Flo
w $
MM
Jan
uary
Cash
Flo
w / A
UM
pre
v Y
ear
En
d %
CF Jan/AUM Prev Y CF Jan $MM
Source: Deutsche Bank, Bloomberg Finance LP
January flows put $400bn annual inflows within total reachWith such a start for the year we wonder what should we expect for a totalETP flow annual figure for 2017. For this purpose we looked at the historicalcontribution of January ETP flows to the total annual figure as a function of therelative strength of the flow. The contribution of the January flow to the total
Deutsche Bank Securities Inc. Page 5
16 February 2017
US ETF Compass
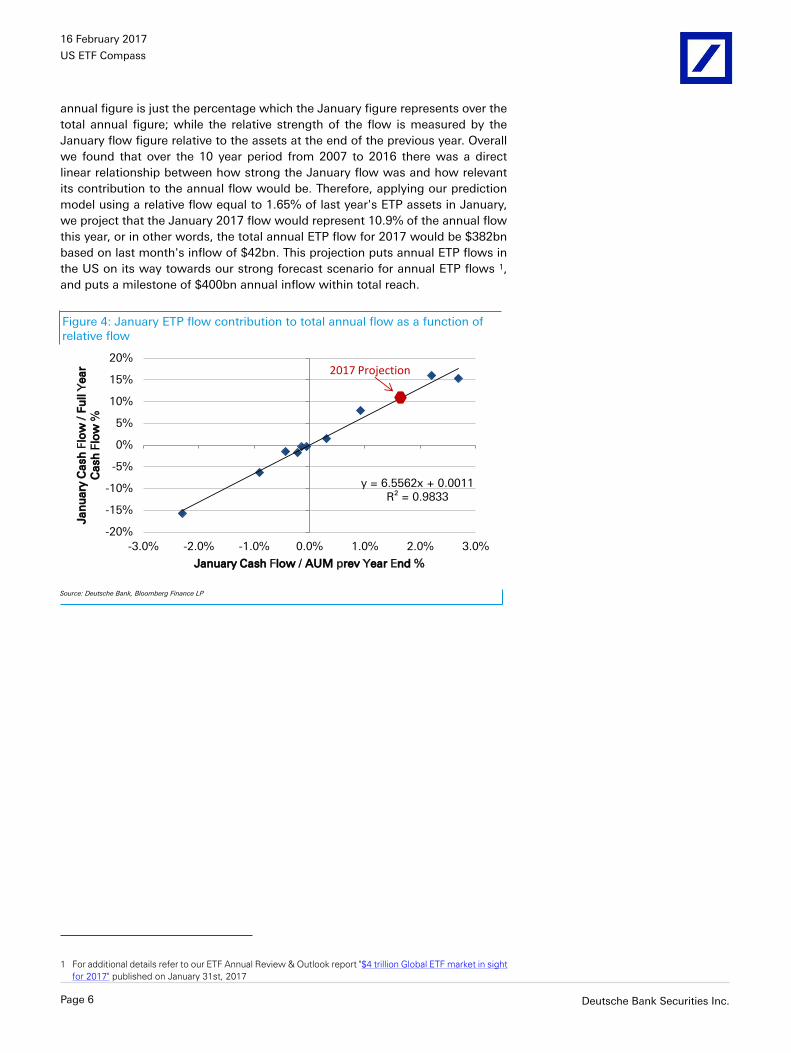
annual figure is just the percentage which the January figure represents over thetotal annual figure; while the relative strength of the flow is measured by theJanuary flow figure relative to the assets at the end of the previous year. Overallwe found that over the 10 year period from 2007 to 2016 there was a directlinear relationship between how strong the January flow was and how relevantits contribution to the annual flow would be. Therefore, applying our predictionmodel using a relative flow equal to 1.65% of last year's ETP assets in January,we project that the January 2017 flow would represent 10.9% of the annual flowthis year, or in other words, the total annual ETP flow for 2017 would be $382bnbased on last month's inflow of $42bn. This projection puts annual ETP flows inthe US on its way towards our strong forecast scenario for annual ETP flows 1,and puts a milestone of $400bn annual inflow within total reach.
Figure 4: January ETP flow contribution to total annual flow as a function ofrelative flow
y = 6.5562x + 0.0011 R² = 0.9833
-20%
-15%
-10%
-5%
0%
5%
10%
15%
20%
-3.0% -2.0% -1.0% 0.0% 1.0% 2.0% 3.0%
Jan
uary
Cash
Flo
w / F
ull
Year
Cash
Flo
w %
January Cash Flow / AUM prev Year End %
2017 Projection
Source: Deutsche Bank, Bloomberg Finance LP
1 For additional details refer to our ETF Annual Review & Outlook report "$4 trillion Global ETF market in sightfor 2017" published on January 31st, 2017
Page 6 Deutsche Bank Securities Inc.

16 February 2017
US ETF Compass
An alternative look at ETF growth and Google Trends
As US ETFs turn 24 years old, growth continues to impressAt the end of 2016, there were 1,715 ETFs listed in US exchanges, with $2.5 trillionin assets, and over $18 trillion exchanging hands in ETF trading and $273bn in newassets during last year. In addition, US ETFs have experienced the fastest relativegrowth with stronger inflows compared to US Mutual Funds and Index Funds.Moreover, Global ETF assets at $3.5 trillion have by far surpassed Global HedgeFund assets at $3.0 trillion. And there are almost as many millions of internetusers as there are billions of Global ETF assets.
ETFs win the popular vote in a landslide in the last 13 years combinedBased on Google Trends search-term popularity, ETFs won 40 of the 50 statesand DC over the last 13 years, outpacing Mutual Funds, Hedge Funds, and IndexFunds. The win was fueled by broad interest across the country, particularly frommajor financial centers. In addition, product awareness for ETFs rose the mostin the last 13 years, in particular following the Financial Crisis which marked aclear turning point in popularity for Mutual Funds, which yielded the top spotto ETFs. This suggests that internet users are more likely to search informationonline about ETFs than about other major fund vehicles. It also suggests that ETFinvestors are more likely to be better informed about their investments relative toother fund products.
Figure 5: Most popular fund product by state - 2004 to 2016
Source: Google Trends (www.google.com/trends)
For additional details refer to the full report published on Feb 13 th 2017.
Deutsche Bank Securities Inc. Page 7
16 February 2017
US ETF Compass
In focus: American Industrial Renaissance, Cybersecurity,Nuclear & Robotics
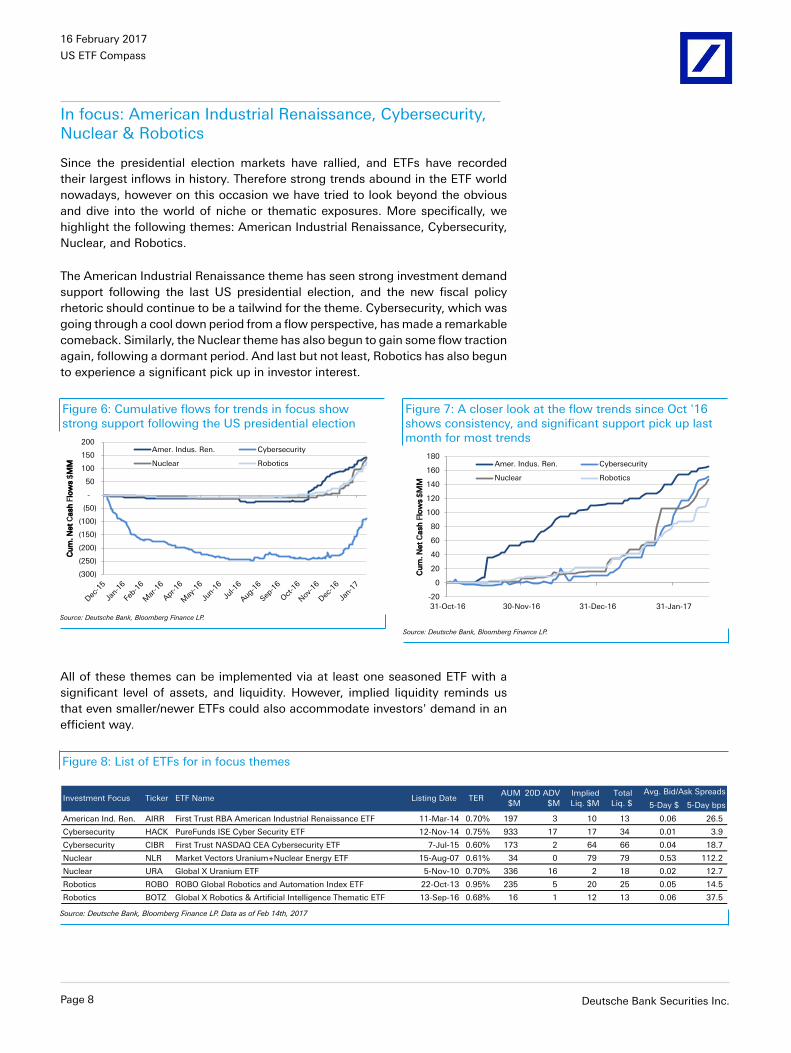
Since the presidential election markets have rallied, and ETFs have recordedtheir largest inflows in history. Therefore strong trends abound in the ETF worldnowadays, however on this occasion we have tried to look beyond the obviousand dive into the world of niche or thematic exposures. More specifically, wehighlight the following themes: American Industrial Renaissance, Cybersecurity,Nuclear, and Robotics.
The American Industrial Renaissance theme has seen strong investment demandsupport following the last US presidential election, and the new fiscal policyrhetoric should continue to be a tailwind for the theme. Cybersecurity, which wasgoing through a cool down period from a flow perspective, has made a remarkablecomeback. Similarly, the Nuclear theme has also begun to gain some flow tractionagain, following a dormant period. And last but not least, Robotics has also begunto experience a significant pick up in investor interest.
Figure 6: Cumulative flows for trends in focus showstrong support following the US presidential election
(300)
(250)
(200)
(150)
(100)
(50)
-
50
100
150
200
Cu
m. N
et
Cash
Flo
ws $
MM
Amer. Indus. Ren. Cybersecurity
Nuclear Robotics
Source: Deutsche Bank, Bloomberg Finance LP.
Figure 7: A closer look at the flow trends since Oct '16shows consistency, and significant support pick up lastmonth for most trends
-20
0
20
40
60
80
100
120
140
160
180
31-Oct-16 30-Nov-16 31-Dec-16 31-Jan-17
Cu
m. N
et
Cash
Flo
ws $
MM
Amer. Indus. Ren. Cybersecurity
Nuclear Robotics
Source: Deutsche Bank, Bloomberg Finance LP.
All of these themes can be implemented via at least one seasoned ETF with asignificant level of assets, and liquidity. However, implied liquidity reminds usthat even smaller/newer ETFs could also accommodate investors' demand in anefficient way.
Figure 8: List of ETFs for in focus themes
5-Day $ 5-Day bps
American Ind. Ren. AIRR First Trust RBA American Industrial Renaissance ETF 11-Mar-14 0.70% 197 3 10 13 0.06 26.5
Cybersecurity HACK PureFunds ISE Cyber Security ETF 12-Nov-14 0.75% 933 17 17 34 0.01 3.9
Cybersecurity CIBR First Trust NASDAQ CEA Cybersecurity ETF 7-Jul-15 0.60% 173 2 64 66 0.04 18.7
Nuclear NLR Market Vectors Uranium+Nuclear Energy ETF 15-Aug-07 0.61% 34 0 79 79 0.53 112.2
Nuclear URA Global X Uranium ETF 5-Nov-10 0.70% 336 16 2 18 0.02 12.7
Robotics ROBO ROBO Global Robotics and Automation Index ETF 22-Oct-13 0.95% 235 5 20 25 0.05 14.5
Robotics BOTZ Global X Robotics & Artificial Intelligence Thematic ETF 13-Sep-16 0.68% 16 1 12 13 0.06 37.5
AUM
$M
20D ADV
$M
Implied
Liq. $M
Total
Liq. $
Avg. Bid/Ask SpreadsInvestment Focus Ticker ETF Name Listing Date TER
Source: Deutsche Bank, Bloomberg Finance LP. Data as of Feb 14th, 2017
Page 8 Deutsche Bank Securities Inc.

16 February 2017
US ETF Compass
American Industrial Renaissance: not your usual Industrials ETFThe First Trust RBA American Industrial Renaissance (AIRR) offers exposureto small and mid cap companies in the industrial and banking sectors. Morespecifically, the ETF offers a clear bias towards the domestic manufacturing sectorby eliminating companies not related to manufacturing or with non-US salesgreater than 25%. Furthermore, banking exposure is limited to 10%, and to banksfrom states considered to be traditional manufacturing hubs. Overall, AIRR shouldbenefit from a boost to small businesses in the domestic manufacturing sector.
AIRR is certainly not your usual Industrials ETF. Let's compare it with the IndustrialSelect Sector SPDR Fund (XLI). From an industry perspective, AIRR focuses onMachinery, and Construction and Engineering; while XLI focuses on Aerospace& Defense, and Industrial Conglomerates. In addition, AIRR is mostly a SMIDvehicle, compared to XLI which is practically a pure large cap one. In fact thereis almost no stock overlap between the two.
Figure 9: Performance since Oct 2016 - AIRR vs. XLI
80
85
90
95
100
105
110
115
120
125
130
31-Oct-16 30-Nov-16 31-Dec-16 31-Jan-17
Reb
ased
To
tal R
etu
rn P
rices
XLI AIRR
Source: Deutsche Bank, Bloomberg Finance LP. Data as of Feb 14th, 2017
Figure 10: Industry exposure - AIRR vs. XLI
0% 10% 20% 30% 40%
Trading Companies & Distributors
Professional Services
Building Products
Airlines
Air Freight & Logistics
Road & Rail
Industrial Conglomerates
Aerospace & Defense
Banks
Commercial Services & Supplies
Electrical Equipment
Construction & Engineering
Machinery
Industry exposure
XLI
AIRR
Source: Deutsche Bank, Bloomberg Finance LP. Data as of Feb 14th, 2017
Figure 11: Market Cap exposure - AIRR. vs. XLI
0%
10%
20%
30%
40%
50%
60%
70%
80%
90%
100%
AIRR XLI
Mark
et
Cap
Exp
osu
re
Small Cap
Mid Cap
Large Cap
Source: Deutsche Bank, Bloomberg Finance LP. Data as of Feb 14th, 2017
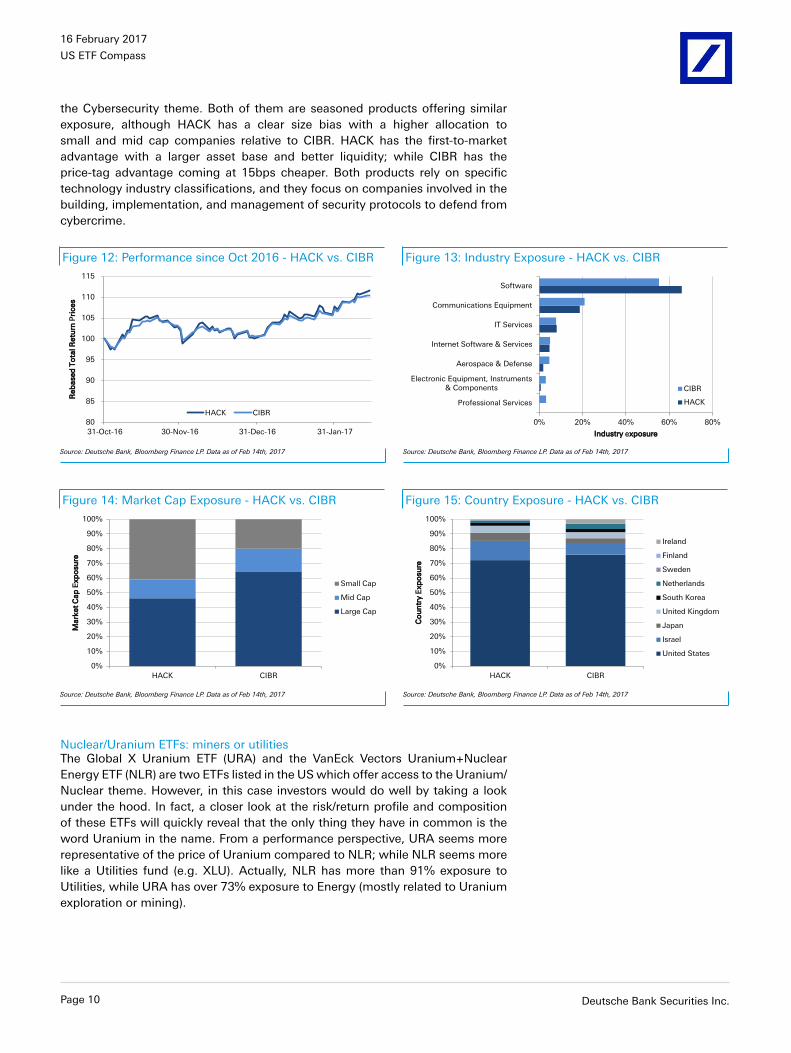
Cybersecurity: similar exposures, different productsThe PureFunds ISE Cyber Security ETF (HACK), and the First Trust NasdaqCybersecurity ETF (CIBR) are the two ETFs listed in the US that offer access to
Deutsche Bank Securities Inc. Page 9
16 February 2017
US ETF Compass
the Cybersecurity theme. Both of them are seasoned products offering similarexposure, although HACK has a clear size bias with a higher allocation tosmall and mid cap companies relative to CIBR. HACK has the first-to-marketadvantage with a larger asset base and better liquidity; while CIBR has theprice-tag advantage coming at 15bps cheaper. Both products rely on specifictechnology industry classifications, and they focus on companies involved in thebuilding, implementation, and management of security protocols to defend fromcybercrime.
Figure 12: Performance since Oct 2016 - HACK vs. CIBR
80
85
90
95
100
105
110
115
31-Oct-16 30-Nov-16 31-Dec-16 31-Jan-17
Reb
ased
To
tal R
etu
rn P
rices
HACK CIBR
Source: Deutsche Bank, Bloomberg Finance LP. Data as of Feb 14th, 2017
Figure 13: Industry Exposure - HACK vs. CIBR
0% 20% 40% 60% 80%
Professional Services
Electronic Equipment, Instruments
& Components
Aerospace & Defense
Internet Software & Services
IT Services
Communications Equipment
Software
Industry exposure
CIBR
HACK
Source: Deutsche Bank, Bloomberg Finance LP. Data as of Feb 14th, 2017
Figure 14: Market Cap Exposure - HACK vs. CIBR
0%
10%
20%
30%
40%
50%
60%
70%
80%
90%
100%
HACK CIBR
Mark
et
Cap
Exp
osu
re
Small Cap
Mid Cap
Large Cap
Source: Deutsche Bank, Bloomberg Finance LP. Data as of Feb 14th, 2017
Figure 15: Country Exposure - HACK vs. CIBR
0%
10%
20%
30%
40%
50%
60%
70%
80%
90%
100%
HACK CIBR
Co
un
try E
xp
osu
re
Ireland
Finland
Sweden
Netherlands
South Korea
United Kingdom
Japan
Israel
United States
Source: Deutsche Bank, Bloomberg Finance LP. Data as of Feb 14th, 2017
Nuclear/Uranium ETFs: miners or utilitiesThe Global X Uranium ETF (URA) and the VanEck Vectors Uranium+NuclearEnergy ETF (NLR) are two ETFs listed in the US which offer access to the Uranium/Nuclear theme. However, in this case investors would do well by taking a lookunder the hood. In fact, a closer look at the risk/return profile and compositionof these ETFs will quickly reveal that the only thing they have in common is theword Uranium in the name. From a performance perspective, URA seems morerepresentative of the price of Uranium compared to NLR; while NLR seems morelike a Utilities fund (e.g. XLU). Actually, NLR has more than 91% exposure toUtilities, while URA has over 73% exposure to Energy (mostly related to Uraniumexploration or mining).
Page 10 Deutsche Bank Securities Inc.

16 February 2017
US ETF Compass
Figure 16: Performance since Oct 2016 - NLR, URA, XLU,Uranium Futures
80
90
100
110
120
130
140
150
160
170
180
31-Oct-16 30-Nov-16 31-Dec-16 31-Jan-17
Reb
ased
To
tal R
etu
rn P
rices
NLR
URA
XLU
Uranium Fut
Source: Deutsche Bank, Bloomberg Finance LP. Data as of Feb 14th, 2017
Figure 17: Sector Exposure - URA vs. NLR
0%
10%
20%
30%
40%
50%
60%
70%
80%
90%
100%
URA NLR
Secto
r E
xp
osu
re Technology
Utilities
Materials
Financials
Industrials
Energy
Source: Deutsche Bank, Bloomberg Finance LP. Data as of Feb 14th, 2017
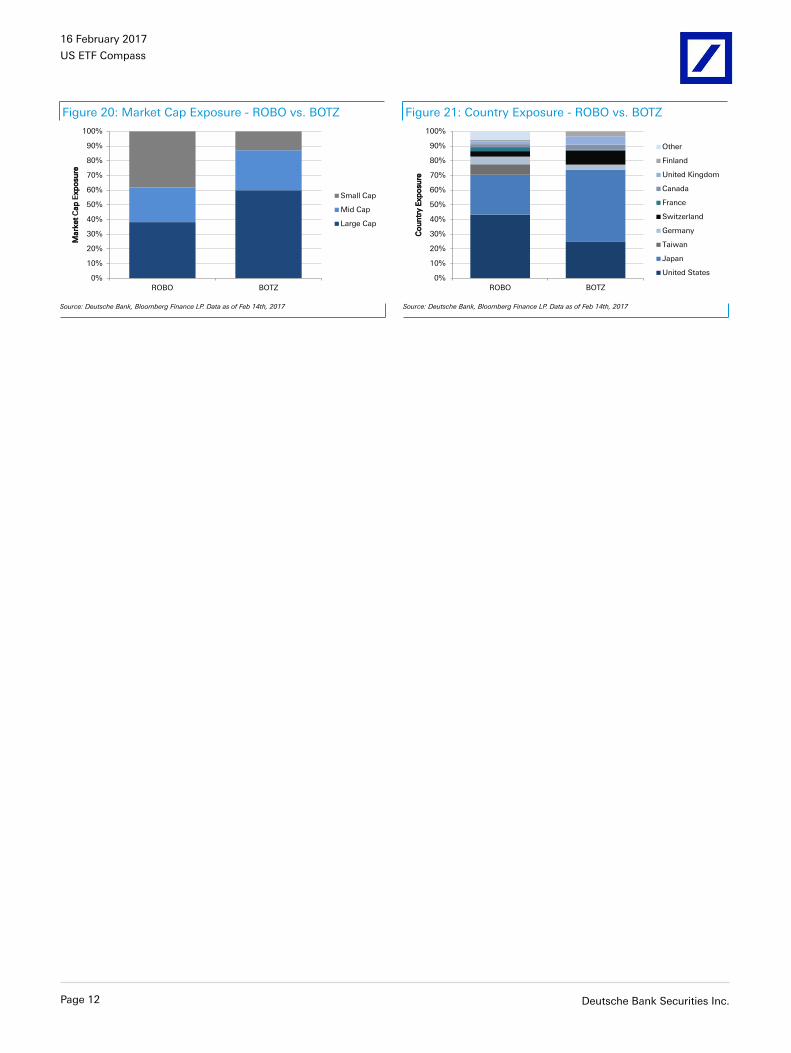
Robotics: the US or Japan, Small or LargeDespite being available to US ETF investors for over 3 years and receiving a highlevel of attention right out of the gate, ETF flow activity within the robotics spacehad remained mostly dormant until the last couple of months when investmentdemand support for the theme began to pick up. Since then, most of the attention(i.e. measured by inflows) has gone to the Robo Global Robotics & AutomationIndex ETF (ROBO) which was the first to market. However the newer roboticsETF, the Global X Robotics & Artificial Intelligence Thematic ETF (BOTZ), hasalso begun to receive some traction. Nevertheless, ROBO remains the moreestablished alternative given that it has benefited from first mover advantage andis already a seasoned product with a sufficient level of assets and liquidity; while ,on the other hand, BOTZ can claim the price-tag advantage with its 68bps feewhich comes 27bps lower than ROBO.
From an exposure perspective, ROBO offers a more diversified alternative relativeto BOTZ. For example, ROBO has just under 10% allocated to its top 5 positions,while BOTZ has close to 40% allocated to its top 5 positions. As a result, ROBO hasa more significant size bias with higher allocations to small and mid caps, whileBOTZ has a higher large cap bias relatively speaking. Furthermore, sector wiseROBO has a tilt towards Technology relative to BOTZ, and BOTZ has a tilt towardsIndustrials relative to ROBO. In addition, ROBO's major geographical exposure isthe US (43%), while BOTZ top country allocation is Japan (49%).
Figure 18: Performance since Oct 2016 - ROBO vs. BOTZ
80
85
90
95
100
105
110
115
120
31-Oct-16 30-Nov-16 31-Dec-16 31-Jan-17
Reb
ased
To
tal R
etu
rn P
rices
ROBO BOTZ
Source: Deutsche Bank, Bloomberg Finance LP. Data as of Feb 14th, 2017
Figure 19: Sector Exposure - ROBO vs. BOTZ
0%
10%
20%
30%
40%
50%
60%
70%
80%
90%
100%
ROBO BOTZ
Secto
r E
xp
osu
re
Cons. Disc.
Energy
Health Care
Technology
Industrials
Source: Deutsche Bank, Bloomberg Finance LP. Data as of Feb 14th, 2017
Deutsche Bank Securities Inc. Page 11
16 February 2017
US ETF Compass
Figure 20: Market Cap Exposure - ROBO vs. BOTZ
0%
10%
20%
30%
40%
50%
60%
70%
80%
90%
100%
ROBO BOTZ
Mark
et
Cap
Exp
osu
re
Small Cap
Mid Cap
Large Cap
Source: Deutsche Bank, Bloomberg Finance LP. Data as of Feb 14th, 2017
Figure 21: Country Exposure - ROBO vs. BOTZ
0%
10%
20%
30%
40%
50%
60%
70%
80%
90%
100%
ROBO BOTZ
Co
un
try E
xp
osu
re
Other
Finland
United Kingdom
Canada
France
Switzerland
Germany
Taiwan
Japan
United States
Source: Deutsche Bank, Bloomberg Finance LP. Data as of Feb 14th, 2017
Page 12 Deutsche Bank Securities Inc.
16 February 2017
US ETF Compass
Asset Allocation HeatmapsGlobal Multi Asset Allocator heatmaps
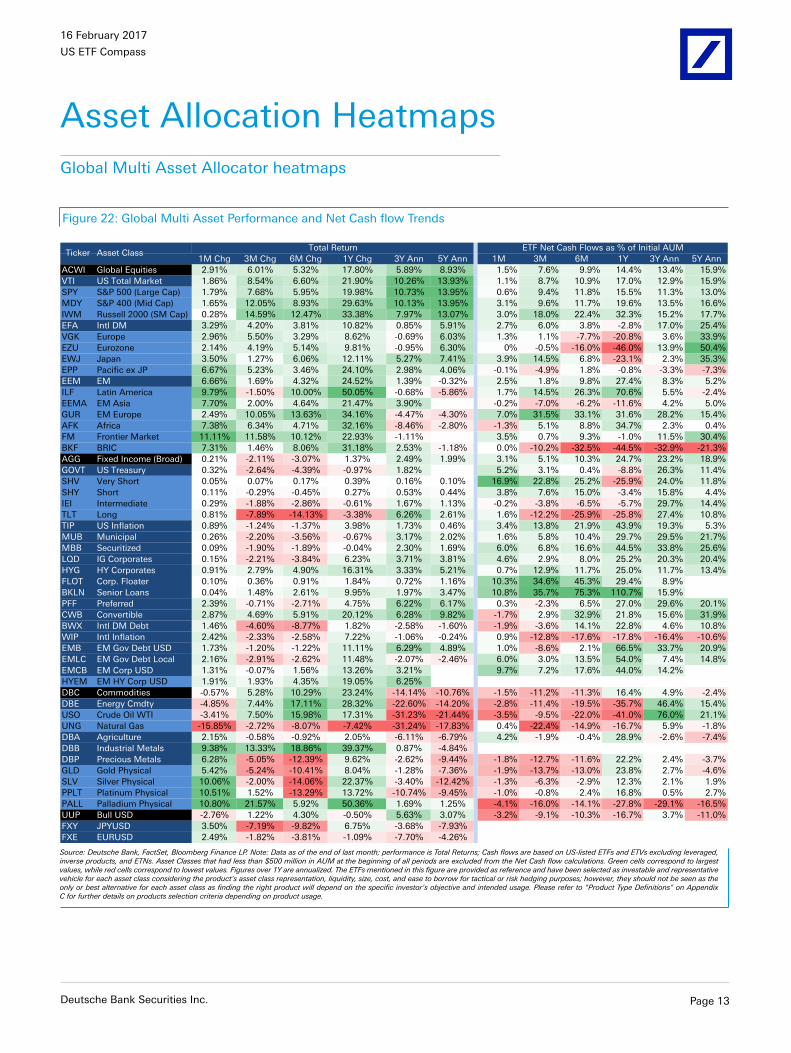
Figure 22: Global Multi Asset Performance and Net Cash flow Trends
1M Chg 3M Chg 6M Chg 1Y Chg 3Y Ann 5Y Ann 1M 3M 6M 1Y 3Y Ann 5Y Ann
ACWI Global Equities 2.91% 6.01% 5.32% 17.80% 5.89% 8.93% 1.5% 7.6% 9.9% 14.4% 13.4% 15.9%
VTI US Total Market 1.86% 8.54% 6.60% 21.90% 10.26% 13.93% 1.1% 8.7% 10.9% 17.0% 12.9% 15.9%
SPY S&P 500 (Large Cap) 1.79% 7.68% 5.95% 19.98% 10.73% 13.95% 0.6% 9.4% 11.8% 15.5% 11.3% 13.0%
MDY S&P 400 (Mid Cap) 1.65% 12.05% 8.93% 29.63% 10.13% 13.95% 3.1% 9.6% 11.7% 19.6% 13.5% 16.6%
IWM Russell 2000 (SM Cap) 0.28% 14.59% 12.47% 33.38% 7.97% 13.07% 3.0% 18.0% 22.4% 32.3% 15.2% 17.7%
EFA Intl DM 3.29% 4.20% 3.81% 10.82% 0.85% 5.91% 2.7% 6.0% 3.8% -2.8% 17.0% 25.4%
VGK Europe 2.96% 5.50% 3.29% 8.62% -0.69% 6.03% 1.3% 1.1% -7.7% -20.8% 3.6% 33.9%
EZU Eurozone 2.14% 4.19% 5.14% 9.81% -0.95% 6.30% 0% -0.5% -16.0% -46.0% 13.9% 50.4%
EWJ Japan 3.50% 1.27% 6.06% 12.11% 5.27% 7.41% 3.9% 14.5% 6.8% -23.1% 2.3% 35.3%
EPP Pacific ex JP 6.67% 5.23% 3.46% 24.10% 2.98% 4.06% -0.1% -4.9% 1.8% -0.8% -3.3% -7.3%
EEM EM 6.66% 1.69% 4.32% 24.52% 1.39% -0.32% 2.5% 1.8% 9.8% 27.4% 8.3% 5.2%
ILF Latin America 9.79% -1.50% 10.00% 50.05% -0.68% -5.86% 1.7% 14.5% 26.3% 70.6% 5.5% -2.4%
EEMA EM Asia 7.70% 2.00% 4.64% 21.47% 3.90% -0.2% -7.0% -6.2% -11.6% 4.2% 5.0%
GUR EM Europe 2.49% 10.05% 13.63% 34.16% -4.47% -4.30% 7.0% 31.5% 33.1% 31.6% 28.2% 15.4%
AFK Africa 7.38% 6.34% 4.71% 32.16% -8.46% -2.80% -1.3% 5.1% 8.8% 34.7% 2.3% 0.4%
FM Frontier Market 11.11% 11.58% 10.12% 22.93% -1.11% 3.5% 0.7% 9.3% -1.0% 11.5% 30.4%
BKF BRIC 7.31% 1.46% 8.06% 31.18% 2.53% -1.18% 0.0% -10.2% -32.5% -44.5% -32.9% -21.3%
AGG Fixed Income (Broad) 0.21% -2.11% -3.07% 1.37% 2.49% 1.99% 3.1% 5.1% 10.3% 24.7% 23.2% 18.9%
GOVT US Treasury 0.32% -2.64% -4.39% -0.97% 1.82% 5.2% 3.1% 0.4% -8.8% 26.3% 11.4%
SHV Very Short 0.05% 0.07% 0.17% 0.39% 0.16% 0.10% 16.9% 22.8% 25.2% -25.9% 24.0% 11.8%
SHY Short 0.11% -0.29% -0.45% 0.27% 0.53% 0.44% 3.8% 7.6% 15.0% -3.4% 15.8% 4.4%
IEI Intermediate 0.29% -1.88% -2.86% -0.61% 1.67% 1.13% -0.2% -3.8% -6.5% -5.7% 29.7% 14.4%
TLT Long 0.81% -7.89% -14.13% -3.38% 6.26% 2.61% 1.6% -12.2% -25.9% -25.8% 27.4% 10.8%
TIP US Inflation 0.89% -1.24% -1.37% 3.98% 1.73% 0.46% 3.4% 13.8% 21.9% 43.9% 19.3% 5.3%
MUB Municipal 0.26% -2.20% -3.56% -0.67% 3.17% 2.02% 1.6% 5.8% 10.4% 29.7% 29.5% 21.7%
MBB Securitized 0.09% -1.90% -1.89% -0.04% 2.30% 1.69% 6.0% 6.8% 16.6% 44.5% 33.8% 25.6%
LQD IG Corporates 0.15% -2.21% -3.84% 6.23% 3.71% 3.81% 4.6% 2.9% 8.0% 25.2% 20.3% 20.4%
HYG HY Corporates 0.91% 2.79% 4.90% 16.31% 3.33% 5.21% 0.7% 12.9% 11.7% 25.0% 11.7% 13.4%
FLOT Corp. Floater 0.10% 0.36% 0.91% 1.84% 0.72% 1.16% 10.3% 34.6% 45.3% 29.4% 8.9%
BKLN Senior Loans 0.04% 1.48% 2.61% 9.95% 1.97% 3.47% 10.8% 35.7% 75.3% 110.7% 15.9%
PFF Preferred 2.39% -0.71% -2.71% 4.75% 6.22% 6.17% 0.3% -2.3% 6.5% 27.0% 29.6% 20.1%
CWB Convertible 2.87% 4.69% 5.91% 20.12% 6.28% 9.82% -1.7% 2.9% 32.9% 21.8% 15.6% 31.9%
BWX Intl DM Debt 1.46% -4.60% -8.77% 1.82% -2.58% -1.60% -1.9% -3.6% 14.1% 22.8% 4.6% 10.8%
WIP Intl Inflation 2.42% -2.33% -2.58% 7.22% -1.06% -0.24% 0.9% -12.8% -17.6% -17.8% -16.4% -10.6%
EMB EM Gov Debt USD 1.73% -1.20% -1.22% 11.11% 6.29% 4.89% 1.0% -8.6% 2.1% 66.5% 33.7% 20.9%
EMLC EM Gov Debt Local 2.16% -2.91% -2.62% 11.48% -2.07% -2.46% 6.0% 3.0% 13.5% 54.0% 7.4% 14.8%
EMCB EM Corp USD 1.31% -0.07% 1.56% 13.26% 3.21% 9.7% 7.2% 17.6% 44.0% 14.2%
HYEM EM HY Corp USD 1.91% 1.93% 4.35% 19.05% 6.25%
DBC Commodities -0.57% 5.28% 10.29% 23.24% -14.14% -10.76% -1.5% -11.2% -11.3% 16.4% 4.9% -2.4%
DBE Energy Cmdty -4.85% 7.44% 17.11% 28.32% -22.60% -14.20% -2.8% -11.4% -19.5% -35.7% 46.4% 15.4%
USO Crude Oil WTI -3.41% 7.50% 15.98% 17.31% -31.23% -21.44% -3.5% -9.5% -22.0% -41.0% 76.0% 21.1%
UNG Natural Gas -15.85% -2.72% -8.07% -7.42% -31.24% -17.83% 0.4% -22.4% -14.9% -16.7% 5.9% -1.8%
DBA Agriculture 2.15% -0.58% -0.92% 2.05% -6.11% -6.79% 4.2% -1.9% -0.4% 28.9% -2.6% -7.4%
DBB Industrial Metals 9.38% 13.33% 18.86% 39.37% 0.87% -4.84%
DBP Precious Metals 6.28% -5.05% -12.39% 9.62% -2.62% -9.44% -1.8% -12.7% -11.6% 22.2% 2.4% -3.7%
GLD Gold Physical 5.42% -5.24% -10.41% 8.04% -1.28% -7.36% -1.9% -13.7% -13.0% 23.8% 2.7% -4.6%
SLV Silver Physical 10.06% -2.00% -14.06% 22.37% -3.40% -12.42% -1.3% -6.3% -2.9% 12.3% 2.1% 1.9%
PPLT Platinum Physical 10.51% 1.52% -13.29% 13.72% -10.74% -9.45% -1.0% -0.8% 2.4% 16.8% 0.5% 2.7%
PALL Palladium Physical 10.80% 21.57% 5.92% 50.36% 1.69% 1.25% -4.1% -16.0% -14.1% -27.8% -29.1% -16.5%
UUP Bull USD -2.76% 1.22% 4.30% -0.50% 5.63% 3.07% -3.2% -9.1% -10.3% -16.7% 3.7% -11.0%
FXY JPYUSD 3.50% -7.19% -9.82% 6.75% -3.68% -7.93%
FXE EURUSD 2.49% -1.82% -3.81% -1.09% -7.70% -4.26%
Ticker Asset ClassTotal Return ETF Net Cash Flows as % of Initial AUM
Source: Deutsche Bank, FactSet, Bloomberg Finance LP. Note: Data as of the end of last month; performance is Total Returns; Cash flows are based on US-listed ETFs and ETVs excluding leveraged,inverse products, and ETNs. Asset Classes that had less than $500 million in AUM at the beginning of all periods are excluded from the Net Cash flow calculations. Green cells correspond to largestvalues, while red cells correspond to lowest values. Figures over 1Y are annualized. The ETFs mentioned in this figure are provided as reference and have been selected as investable and representativevehicle for each asset class considering the product's asset class representation, liquidity, size, cost, and ease to borrow for tactical or risk hedging purposes; however, they should not be seen as theonly or best alternative for each asset class as finding the right product will depend on the specific investor's objective and intended usage. Please refer to "Product Type Definitions" on AppendixC for further details on products selection criteria depending on product usage.
Deutsche Bank Securities Inc. Page 13
16 February 2017
US ETF Compass
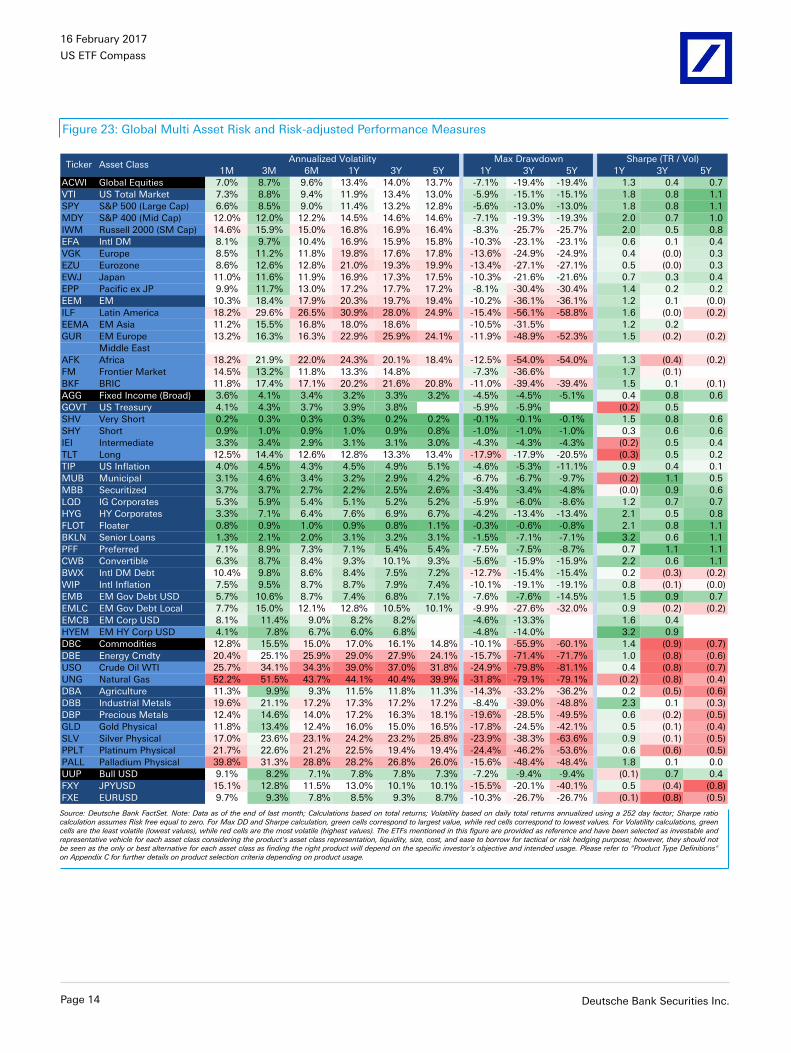
Figure 23: Global Multi Asset Risk and Risk-adjusted Performance Measures
1M 3M 6M 1Y 3Y 5Y 1Y 3Y 5Y 1Y 3Y 5Y
ACWI Global Equities 7.0% 8.7% 9.6% 13.4% 14.0% 13.7% -7.1% -19.4% -19.4% 1.3 0.4 0.7
VTI US Total Market 7.3% 8.8% 9.4% 11.9% 13.4% 13.0% -5.9% -15.1% -15.1% 1.8 0.8 1.1
SPY S&P 500 (Large Cap) 6.6% 8.5% 9.0% 11.4% 13.2% 12.8% -5.6% -13.0% -13.0% 1.8 0.8 1.1
MDY S&P 400 (Mid Cap) 12.0% 12.0% 12.2% 14.5% 14.6% 14.6% -7.1% -19.3% -19.3% 2.0 0.7 1.0
IWM Russell 2000 (SM Cap) 14.6% 15.9% 15.0% 16.8% 16.9% 16.4% -8.3% -25.7% -25.7% 2.0 0.5 0.8
EFA Intl DM 8.1% 9.7% 10.4% 16.9% 15.9% 15.8% -10.3% -23.1% -23.1% 0.6 0.1 0.4
VGK Europe 8.5% 11.2% 11.8% 19.8% 17.6% 17.8% -13.6% -24.9% -24.9% 0.4 (0.0) 0.3
EZU Eurozone 8.6% 12.6% 12.8% 21.0% 19.3% 19.9% -13.4% -27.1% -27.1% 0.5 (0.0) 0.3
EWJ Japan 11.0% 11.6% 11.9% 16.9% 17.3% 17.5% -10.3% -21.6% -21.6% 0.7 0.3 0.4
EPP Pacific ex JP 9.9% 11.7% 13.0% 17.2% 17.7% 17.2% -8.1% -30.4% -30.4% 1.4 0.2 0.2
EEM EM 10.3% 18.4% 17.9% 20.3% 19.7% 19.4% -10.2% -36.1% -36.1% 1.2 0.1 (0.0)
ILF Latin America 18.2% 29.6% 26.5% 30.9% 28.0% 24.9% -15.4% -56.1% -58.8% 1.6 (0.0) (0.2)
EEMA EM Asia 11.2% 15.5% 16.8% 18.0% 18.6% -10.5% -31.5% 1.2 0.2
GUR EM Europe 13.2% 16.3% 16.3% 22.9% 25.9% 24.1% -11.9% -48.9% -52.3% 1.5 (0.2) (0.2)
Middle East
AFK Africa 18.2% 21.9% 22.0% 24.3% 20.1% 18.4% -12.5% -54.0% -54.0% 1.3 (0.4) (0.2)
FM Frontier Market 14.5% 13.2% 11.8% 13.3% 14.8% -7.3% -36.6% 1.7 (0.1)
BKF BRIC 11.8% 17.4% 17.1% 20.2% 21.6% 20.8% -11.0% -39.4% -39.4% 1.5 0.1 (0.1)
AGG Fixed Income (Broad) 3.6% 4.1% 3.4% 3.2% 3.3% 3.2% -4.5% -4.5% -5.1% 0.4 0.8 0.6
GOVT US Treasury 4.1% 4.3% 3.7% 3.9% 3.8% -5.9% -5.9% (0.2) 0.5
SHV Very Short 0.2% 0.3% 0.3% 0.3% 0.2% 0.2% -0.1% -0.1% -0.1% 1.5 0.8 0.6
SHY Short 0.9% 1.0% 0.9% 1.0% 0.9% 0.8% -1.0% -1.0% -1.0% 0.3 0.6 0.6
IEI Intermediate 3.3% 3.4% 2.9% 3.1% 3.1% 3.0% -4.3% -4.3% -4.3% (0.2) 0.5 0.4
TLT Long 12.5% 14.4% 12.6% 12.8% 13.3% 13.4% -17.9% -17.9% -20.5% (0.3) 0.5 0.2
TIP US Inflation 4.0% 4.5% 4.3% 4.5% 4.9% 5.1% -4.6% -5.3% -11.1% 0.9 0.4 0.1
MUB Municipal 3.1% 4.6% 3.4% 3.2% 2.9% 4.2% -6.7% -6.7% -9.7% (0.2) 1.1 0.5
MBB Securitized 3.7% 3.7% 2.7% 2.2% 2.5% 2.6% -3.4% -3.4% -4.8% (0.0) 0.9 0.6
LQD IG Corporates 5.3% 5.9% 5.4% 5.1% 5.2% 5.2% -5.9% -6.0% -8.6% 1.2 0.7 0.7
HYG HY Corporates 3.3% 7.1% 6.4% 7.6% 6.9% 6.7% -4.2% -13.4% -13.4% 2.1 0.5 0.8
FLOT Floater 0.8% 0.9% 1.0% 0.9% 0.8% 1.1% -0.3% -0.6% -0.8% 2.1 0.8 1.1
BKLN Senior Loans 1.3% 2.1% 2.0% 3.1% 3.2% 3.1% -1.5% -7.1% -7.1% 3.2 0.6 1.1
PFF Preferred 7.1% 8.9% 7.3% 7.1% 5.4% 5.4% -7.5% -7.5% -8.7% 0.7 1.1 1.1
CWB Convertible 6.3% 8.7% 8.4% 9.3% 10.1% 9.3% -5.6% -15.9% -15.9% 2.2 0.6 1.1
BWX Intl DM Debt 10.4% 9.8% 8.6% 8.4% 7.5% 7.2% -12.7% -15.4% -15.4% 0.2 (0.3) (0.2)
WIP Intl Inflation 7.5% 9.5% 8.7% 8.7% 7.9% 7.4% -10.1% -19.1% -19.1% 0.8 (0.1) (0.0)
EMB EM Gov Debt USD 5.7% 10.6% 8.7% 7.4% 6.8% 7.1% -7.6% -7.6% -14.5% 1.5 0.9 0.7
EMLC EM Gov Debt Local 7.7% 15.0% 12.1% 12.8% 10.5% 10.1% -9.9% -27.6% -32.0% 0.9 (0.2) (0.2)
EMCB EM Corp USD 8.1% 11.4% 9.0% 8.2% 8.2% -4.6% -13.3% 1.6 0.4
HYEM EM HY Corp USD 4.1% 7.8% 6.7% 6.0% 6.8% -4.8% -14.0% 3.2 0.9
DBC Commodities 12.8% 15.5% 15.0% 17.0% 16.1% 14.8% -10.1% -55.9% -60.1% 1.4 (0.9) (0.7)
DBE Energy Cmdty 20.4% 25.1% 25.9% 29.0% 27.9% 24.1% -15.7% -71.4% -71.7% 1.0 (0.8) (0.6)
USO Crude Oil WTI 25.7% 34.1% 34.3% 39.0% 37.0% 31.8% -24.9% -79.8% -81.1% 0.4 (0.8) (0.7)
UNG Natural Gas 52.2% 51.5% 43.7% 44.1% 40.4% 39.9% -31.8% -79.1% -79.1% (0.2) (0.8) (0.4)
DBA Agriculture 11.3% 9.9% 9.3% 11.5% 11.8% 11.3% -14.3% -33.2% -36.2% 0.2 (0.5) (0.6)
DBB Industrial Metals 19.6% 21.1% 17.2% 17.3% 17.2% 17.2% -8.4% -39.0% -48.8% 2.3 0.1 (0.3)
DBP Precious Metals 12.4% 14.6% 14.0% 17.2% 16.3% 18.1% -19.6% -28.5% -49.5% 0.6 (0.2) (0.5)
GLD Gold Physical 11.8% 13.4% 12.4% 16.0% 15.0% 16.5% -17.8% -24.5% -42.1% 0.5 (0.1) (0.4)
SLV Silver Physical 17.0% 23.6% 23.1% 24.2% 23.2% 25.8% -23.9% -38.3% -63.6% 0.9 (0.1) (0.5)
PPLT Platinum Physical 21.7% 22.6% 21.2% 22.5% 19.4% 19.4% -24.4% -46.2% -53.6% 0.6 (0.6) (0.5)
PALL Palladium Physical 39.8% 31.3% 28.8% 28.2% 26.8% 26.0% -15.6% -48.4% -48.4% 1.8 0.1 0.0
UUP Bull USD 9.1% 8.2% 7.1% 7.8% 7.8% 7.3% -7.2% -9.4% -9.4% (0.1) 0.7 0.4
FXY JPYUSD 15.1% 12.8% 11.5% 13.0% 10.1% 10.1% -15.5% -20.1% -40.1% 0.5 (0.4) (0.8)
FXE EURUSD 9.7% 9.3% 7.8% 8.5% 9.3% 8.7% -10.3% -26.7% -26.7% (0.1) (0.8) (0.5)
Sharpe (TR / Vol)Ticker Asset Class
Annualized Volatility Max Drawdown
Source: Deutsche Bank FactSet. Note: Data as of the end of last month; Calculations based on total returns; Volatility based on daily total returns annualized using a 252 day factor; Sharpe ratiocalculation assumes Risk free equal to zero. For Max DD and Sharpe calculation, green cells correspond to largest value, while red cells correspond to lowest values. For Volatility calculations, greencells are the least volatile (lowest values), while red cells are the most volatile (highest values). The ETFs mentioned in this figure are provided as reference and have been selected as investable andrepresentative vehicle for each asset class considering the product's asset class representation, liquidity, size, cost, and ease to borrow for tactical or risk hedging purpose; however, they should notbe seen as the only or best alternative for each asset class as finding the right product will depend on the specific investor's objective and intended usage. Please refer to "Product Type Definitions"on Appendix C for further details on product selection criteria depending on product usage.
Page 14 Deutsche Bank Securities Inc.

16 February 2017
US ETF Compass
US Equity Allocator heatmaps
Figure 24: US Equity Performance and Net Cash Flow Trends
1M Chg 3M Chg 6M Chg 1Y Chg 3Y Ann 5Y Ann 1M 3M 6M 1Y 3Y Ann 5Y Ann
VTI US Total Market 1.86% 8.54% 6.60% 21.90% 10.26% 13.93% 1.1% 8.7% 10.9% 17.0% 12.9% 15.9%
SPY S&P 500 (Large Cap) 1.79% 7.68% 5.95% 19.98% 10.73% 13.95% 0.6% 9.4% 11.8% 15.5% 11.3% 13.0%
DIA DJI 0.53% 10.14% 9.08% 23.77% 10.70% 12.09% 0.6% 9.4% 11.8% 15.5% 11.3% 13.0%
QQQ NASDAQ-100 5.14% 6.80% 8.70% 20.97% 14.41% 16.94% 0.6% 9.4% 11.8% 15.5% 11.3% 13.0%
IWF Russell 1000 Growth 3.29% 6.92% 4.20% 17.18% 10.64% 13.73% -1.3% 3.1% 5.6% 3.0% 9.9% 11.7%
IWD Russell 1000 Value 0.61% 9.08% 8.02% 24.56% 9.97% 13.89% 2.4% 11.6% 16.4% 30.7% 19.3% 21.2%
MDY S&P 400 (Mid Cap) 1.65% 12.05% 8.93% 29.63% 10.13% 13.95% 3.1% 9.6% 11.7% 19.6% 13.5% 16.6%
IWM Russell 2000 (SM Cap) 0.28% 14.59% 12.47% 33.38% 7.97% 13.07% 3.0% 18.0% 22.4% 32.3% 15.2% 17.7%
VIG Div. Growth 1.76% 6.02% 2.97% 16.61% 8.99% 11.52% 1.0% 4.3% 7.6% 29.6% 14.7% 18.0%
DVY Div. Yield 1.34% 7.63% 4.83% 24.43% 12.52% 14.57% 1.0% 4.3% 7.6% 29.6% 14.7% 18.0%
VYM Div. Yield -0.04% 7.28% 5.17% 20.39% 11.53% 13.92% 1.0% 4.3% 7.6% 29.6% 14.7% 18.0%
SDY Div. Yield & Growth 0.72% 7.53% 2.07% 23.51% 12.16% 14.32% 1.0% 4.3% 7.6% 29.6% 14.7% 18.0%
XLY Cons. Discretionary 4.21% 9.26% 4.95% 16.47% 12.23% 17.23% 2.7% 3.5% -2.7% -15.4% 3.1% 11.6%
PEJ Hotels, Rest & Leisure 1.10% 11.23% 15.41% 22.41% 8.30% 16.25%
XHB Home Builders 1.92% 9.34% -4.03% 13.80% 3.60% 13.79% -0.6% 5.7% -7.3% -28.6% -14.3% -11.1%
ITB Household Durables 5.24% 12.30% 0.10% 19.39% 5.63% 17.70% -0.6% 5.7% -7.3% -28.6% -14.3% -11.1%
PBS Media 5.15% 11.92% 8.73% 16.68% 3.83% 15.23%
XRT Retail -1.97% 2.63% -3.56% 6.70% 3.81% 10.64% 48.9% -12.4% -8.9% -23.2% -21.6% -23.6%
XLP Cons. Staples 1.70% 0.34% -2.54% 6.20% 11.67% 13.38% -2.0% -10.4% -18.1% -19.7% 3.5% 6.2%
PBJ Food Products -2.03% 1.33% -3.44% 5.52% 10.88% 12.76%
XLE Energy -3.21% 6.80% 9.42% 28.40% -1.94% 2.90% 1.8% 10.1% 15.1% 21.9% 26.5% 22.9%
OIH Energy Eq. & Serv. 0.03% 20.49% 19.98% 39.30% -7.95% -2.60% 5.3% 30.9% 24.1% 6.3% 9.6% 8.1%
XES Energy Eq. & Serv. 0.49% 27.31% 27.37% 46.13% -16.84% -7.91% 5.3% 30.9% 24.1% 6.3% 9.6% 8.1%
IEZ Energy Eq. & Serv. 0.51% 21.06% 22.11% 40.35% -7.98% -2.52% 5.3% 30.9% 24.1% 6.3% 9.6% 8.1%
XOP Energy E&P -3.24% 13.58% 17.49% 41.94% -14.17% -4.90% -6.9% 6.2% 9.1% -23.5% 35.8% 16.0%
IEO Energy E&P -2.49% 9.96% 14.37% 31.45% -5.59% 0.91% -6.9% 6.2% 9.1% -23.5% 35.8% 16.0%
AMLP MLPs 3.25% 8.49% 5.40% 37.40% -2.62% 1.97% 3.6% 11.5% 19.9% 35.1% 21.0% 42.4%
XLF Financials 0.26% 18.62% 22.52% 34.85% 12.98% 17.47% 1.8% 38.5% 41.6% 28.1% 11.9% 24.6%
KBWB Large Banks -0.42% 23.24% 35.61% 46.18% 12.74% 18.50% 1.3% 32.3% 42.8% 18.4% 7.7% 17.1%
KRE Regional Banks -0.31% 27.00% 39.33% 53.87% 15.13% 18.57% 1.3% 32.3% 42.8% 18.4% 7.7% 17.1%
KCE Capital Markets 2.37% 17.74% 18.55% 28.46% 1.19% 11.14% -0.9% 42.9% 27.6% -12.7% -18.0% 18.5%
KIE Insurance 0.47% 12.79% 17.02% 29.21% 14.29% 18.59% 8.5% 31.4% 33.9% 47.3% 24.5% 29.5%
XLV Healthcare 2.29% 5.15% -5.45% 7.79% 9.63% 16.42% -0.7% 5.8% 3.9% -6.1% 9.1% 20.1%
IBB Biotech & Pharma 4.78% 8.37% -3.87% 4.32% 4.32% 19.32% 0.1% 4.9% 11.2% 6.7% 13.8% 27.0%
BBH Large Biotech 5.95% 11.18% -0.90% 12.46% 5.77% 22.32% 0.1% 4.9% 11.2% 6.7% 13.8% 27.0%
IHI HC Eq. & Supplies 6.77% 5.70% -0.82% 24.30% 15.85% 18.22% 15.7% -13.3% -6.6% 26.4% 13.5% 15.9%
IHF HC Providers & Serv 3.43% 10.62% 0.97% 12.30% 11.97% 16.45% -1.6% -11.4% -34.6% -33.4% 1.1% 5.1%
PPH Large Pharma -0.36% 1.27% -14.88% -11.18% 0.82% 9.99% -3.1% 6.6% -3.2% -19.3% -7.1% 4.5%
XLI Industrials 1.86% 11.47% 10.48% 29.63% 10.48% 14.21% 2.7% 45.6% 56.6% 74.3% 6.5% 23.4%
ITA Aerospace & Def 1.33% 9.70% 10.65% 31.66% 11.88% 18.84% 6.5% 96.7% 110.0% 138.4% 76.8% 70.3%
IYT Transportation 1.57% 14.44% 18.06% 35.07% 9.34% 12.92% 0.9% 46.8% 66.1% 57.3% 10.0% 15.4%
XLB Materials 4.55% 11.88% 7.98% 36.76% 7.85% 9.25% 5.2% 33.8% 30.3% 88.6% -0.1% 10.0%
XME Metals & Mining 9.80% 31.39% 15.66% 143.13% -4.10% -7.76% 10.2% 28.5% 15.7% 133.4% 9.4% 4.3%
VNQ Real Estate -0.19% 2.86% -8.38% 12.25% 11.54% 10.36% 2.3% 1.2% 5.7% 19.7% 16.0% 17.8%
VGT Technology 4.31% 6.24% 10.78% 26.08% 14.63% 15.26% 2.4% 7.9% 15.3% 9.0% 3.8% 11.6%
IGN Comm. Equipment 1.33% 10.10% 19.33% 35.76% 10.56% 9.51%
FDN Int. Software & Serv. 6.90% 4.90% 10.09% 29.17% 12.45% 20.41% 3.3% -1.9% 6.3% -14.2% 11.8% 36.2%
SMH Semiconductors 3.91% 9.91% 18.16% 50.91% 23.48% 19.13% 11.1% 27.7% 35.8% 66.0% 20.1% 9.4%
IGV Software 7.64% 4.24% 6.32% 24.57% 13.14% 15.11% -3.0% -13.1% -3.6% -31.2% -26.7% -15.7%
VOX Telecom 0.38% 11.37% 1.16% 21.76% 10.63% 14.00% 10.7% 11.5% -7.6% 36.0% 24.3% 15.3%
XLU Utilities 1.26% 0.45% -3.93% 11.98% 11.79% 11.26% -7.8% -10.6% -20.1% 2.2% 8.0% -1.6%
Ticker Asset ClassTotal Return ETF Net Cash Flows as % of Initial AUM
Source: Deutsche Bank, FactSet, Bloomberg Finance LP. Note: Data as of the end of last month; performance is Total Returns; Cash flows are based on US-listed ETFs and ETVs excluding leveraged,inverse products, and ETNs. Asset Classes that had less than $500 million in AUM at the beginning of all periods are excluded from the Net Cash flow calculations. Green cells correspond to largestvalues, while red cells correspond to lowest values. Figures over 1Y are annualized. The ETFs mentioned in this figure are provided as reference and have been selected as investable and representativevehicle for each asset class considering the product's asset class representation, liquidity, size, cost, and ease to borrow for tactical or risk hedging purposes; however, they should not be seen as theonly or best alternative for each asset class as finding the right product will depend on the specific investor's objective and intended usage. Please refer to "Product Type Definitions" on AppendixC for further details on products selection criteria depending on product usage.
Deutsche Bank Securities Inc. Page 15
16 February 2017
US ETF Compass
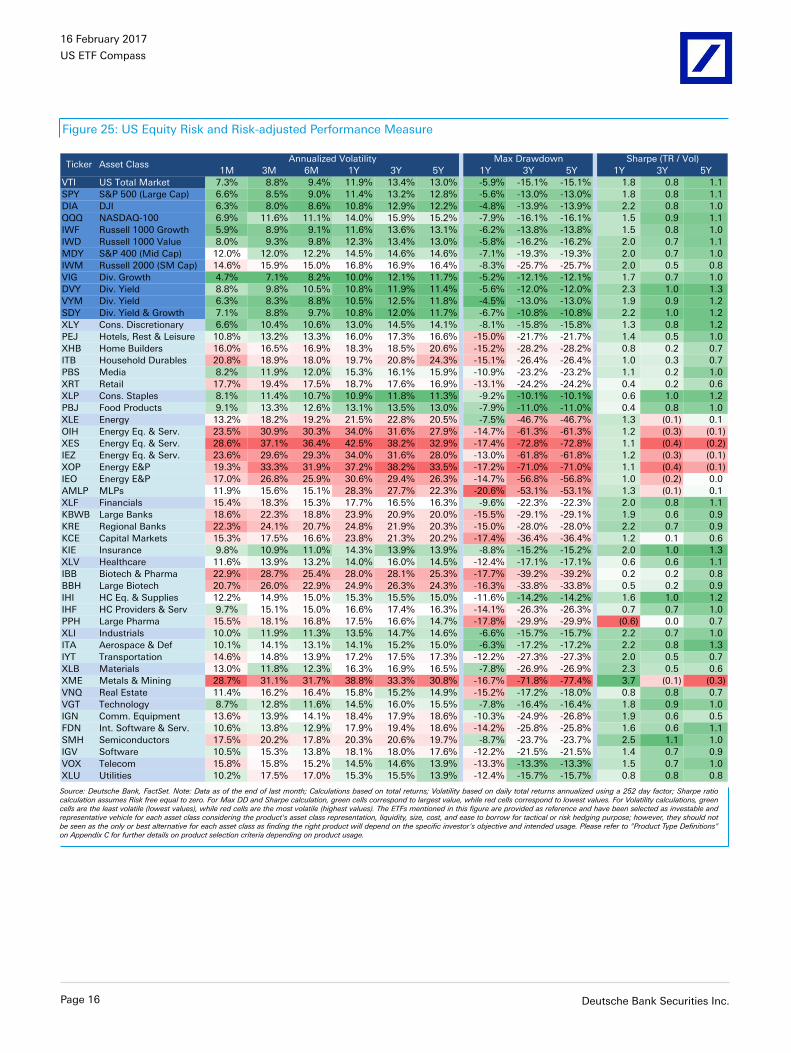
Figure 25: US Equity Risk and Risk-adjusted Performance Measure
1M 3M 6M 1Y 3Y 5Y 1Y 3Y 5Y 1Y 3Y 5Y
VTI US Total Market 7.3% 8.8% 9.4% 11.9% 13.4% 13.0% -5.9% -15.1% -15.1% 1.8 0.8 1.1
SPY S&P 500 (Large Cap) 6.6% 8.5% 9.0% 11.4% 13.2% 12.8% -5.6% -13.0% -13.0% 1.8 0.8 1.1
DIA DJI 6.3% 8.0% 8.6% 10.8% 12.9% 12.2% -4.8% -13.9% -13.9% 2.2 0.8 1.0
QQQ NASDAQ-100 6.9% 11.6% 11.1% 14.0% 15.9% 15.2% -7.9% -16.1% -16.1% 1.5 0.9 1.1
IWF Russell 1000 Growth 5.9% 8.9% 9.1% 11.6% 13.6% 13.1% -6.2% -13.8% -13.8% 1.5 0.8 1.0
IWD Russell 1000 Value 8.0% 9.3% 9.8% 12.3% 13.4% 13.0% -5.8% -16.2% -16.2% 2.0 0.7 1.1
MDY S&P 400 (Mid Cap) 12.0% 12.0% 12.2% 14.5% 14.6% 14.6% -7.1% -19.3% -19.3% 2.0 0.7 1.0
IWM Russell 2000 (SM Cap) 14.6% 15.9% 15.0% 16.8% 16.9% 16.4% -8.3% -25.7% -25.7% 2.0 0.5 0.8
VIG Div. Growth 4.7% 7.1% 8.2% 10.0% 12.1% 11.7% -5.2% -12.1% -12.1% 1.7 0.7 1.0
DVY Div. Yield 8.8% 9.8% 10.5% 10.8% 11.9% 11.4% -5.6% -12.0% -12.0% 2.3 1.0 1.3
VYM Div. Yield 6.3% 8.3% 8.8% 10.5% 12.5% 11.8% -4.5% -13.0% -13.0% 1.9 0.9 1.2
SDY Div. Yield & Growth 7.1% 8.8% 9.7% 10.8% 12.0% 11.7% -6.7% -10.8% -10.8% 2.2 1.0 1.2
XLY Cons. Discretionary 6.6% 10.4% 10.6% 13.0% 14.5% 14.1% -8.1% -15.8% -15.8% 1.3 0.8 1.2
PEJ Hotels, Rest & Leisure 10.8% 13.2% 13.3% 16.0% 17.3% 16.6% -15.0% -21.7% -21.7% 1.4 0.5 1.0
XHB Home Builders 16.0% 16.5% 16.9% 18.3% 18.5% 20.6% -15.2% -28.2% -28.2% 0.8 0.2 0.7
ITB Household Durables 20.8% 18.9% 18.0% 19.7% 20.8% 24.3% -15.1% -26.4% -26.4% 1.0 0.3 0.7
PBS Media 8.2% 11.9% 12.0% 15.3% 16.1% 15.9% -10.9% -23.2% -23.2% 1.1 0.2 1.0
XRT Retail 17.7% 19.4% 17.5% 18.7% 17.6% 16.9% -13.1% -24.2% -24.2% 0.4 0.2 0.6
XLP Cons. Staples 8.1% 11.4% 10.7% 10.9% 11.8% 11.3% -9.2% -10.1% -10.1% 0.6 1.0 1.2
PBJ Food Products 9.1% 13.3% 12.6% 13.1% 13.5% 13.0% -7.9% -11.0% -11.0% 0.4 0.8 1.0
XLE Energy 13.2% 18.2% 19.2% 21.5% 22.8% 20.5% -7.5% -46.7% -46.7% 1.3 (0.1) 0.1
OIH Energy Eq. & Serv. 23.5% 30.9% 30.3% 34.0% 31.6% 27.9% -14.7% -61.3% -61.3% 1.2 (0.3) (0.1)
XES Energy Eq. & Serv. 28.6% 37.1% 36.4% 42.5% 38.2% 32.9% -17.4% -72.8% -72.8% 1.1 (0.4) (0.2)
IEZ Energy Eq. & Serv. 23.6% 29.6% 29.3% 34.0% 31.6% 28.0% -13.0% -61.8% -61.8% 1.2 (0.3) (0.1)
XOP Energy E&P 19.3% 33.3% 31.9% 37.2% 38.2% 33.5% -17.2% -71.0% -71.0% 1.1 (0.4) (0.1)
IEO Energy E&P 17.0% 26.8% 25.9% 30.6% 29.4% 26.3% -14.7% -56.8% -56.8% 1.0 (0.2) 0.0
AMLP MLPs 11.9% 15.6% 15.1% 28.3% 27.7% 22.3% -20.6% -53.1% -53.1% 1.3 (0.1) 0.1
XLF Financials 15.4% 18.3% 15.3% 17.7% 16.5% 16.3% -9.6% -22.3% -22.3% 2.0 0.8 1.1
KBWB Large Banks 18.6% 22.3% 18.8% 23.9% 20.9% 20.0% -15.5% -29.1% -29.1% 1.9 0.6 0.9
KRE Regional Banks 22.3% 24.1% 20.7% 24.8% 21.9% 20.3% -15.0% -28.0% -28.0% 2.2 0.7 0.9
KCE Capital Markets 15.3% 17.5% 16.6% 23.8% 21.3% 20.2% -17.4% -36.4% -36.4% 1.2 0.1 0.6
KIE Insurance 9.8% 10.9% 11.0% 14.3% 13.9% 13.9% -8.8% -15.2% -15.2% 2.0 1.0 1.3
XLV Healthcare 11.6% 13.9% 13.2% 14.0% 16.0% 14.5% -12.4% -17.1% -17.1% 0.6 0.6 1.1
IBB Biotech & Pharma 22.9% 28.7% 25.4% 28.0% 28.1% 25.3% -17.7% -39.2% -39.2% 0.2 0.2 0.8
BBH Large Biotech 20.7% 26.0% 22.9% 24.9% 26.3% 24.3% -16.3% -33.8% -33.8% 0.5 0.2 0.9
IHI HC Eq. & Supplies 12.2% 14.9% 15.0% 15.3% 15.5% 15.0% -11.6% -14.2% -14.2% 1.6 1.0 1.2
IHF HC Providers & Serv 9.7% 15.1% 15.0% 16.6% 17.4% 16.3% -14.1% -26.3% -26.3% 0.7 0.7 1.0
PPH Large Pharma 15.5% 18.1% 16.8% 17.5% 16.6% 14.7% -17.8% -29.9% -29.9% (0.6) 0.0 0.7
XLI Industrials 10.0% 11.9% 11.3% 13.5% 14.7% 14.6% -6.6% -15.7% -15.7% 2.2 0.7 1.0
ITA Aerospace & Def 10.1% 14.1% 13.1% 14.1% 15.2% 15.0% -6.3% -17.2% -17.2% 2.2 0.8 1.3
IYT Transportation 14.6% 14.8% 13.9% 17.2% 17.5% 17.3% -12.2% -27.3% -27.3% 2.0 0.5 0.7
XLB Materials 13.0% 11.8% 12.3% 16.3% 16.9% 16.5% -7.8% -26.9% -26.9% 2.3 0.5 0.6
XME Metals & Mining 28.7% 31.1% 31.7% 38.8% 33.3% 30.8% -16.7% -71.8% -77.4% 3.7 (0.1) (0.3)
VNQ Real Estate 11.4% 16.2% 16.4% 15.8% 15.2% 14.9% -15.2% -17.2% -18.0% 0.8 0.8 0.7
VGT Technology 8.7% 12.8% 11.6% 14.5% 16.0% 15.5% -7.8% -16.4% -16.4% 1.8 0.9 1.0
IGN Comm. Equipment 13.6% 13.9% 14.1% 18.4% 17.9% 18.6% -10.3% -24.9% -26.8% 1.9 0.6 0.5
FDN Int. Software & Serv. 10.6% 13.8% 12.9% 17.9% 19.4% 18.6% -14.2% -25.8% -25.8% 1.6 0.6 1.1
SMH Semiconductors 17.5% 20.2% 17.8% 20.3% 20.6% 19.7% -8.7% -23.7% -23.7% 2.5 1.1 1.0
IGV Software 10.5% 15.3% 13.8% 18.1% 18.0% 17.6% -12.2% -21.5% -21.5% 1.4 0.7 0.9
VOX Telecom 15.8% 15.8% 15.2% 14.5% 14.6% 13.9% -13.3% -13.3% -13.3% 1.5 0.7 1.0
XLU Utilities 10.2% 17.5% 17.0% 15.3% 15.5% 13.9% -12.4% -15.7% -15.7% 0.8 0.8 0.8
Ticker Asset ClassMax DrawdownAnnualized Volatility Sharpe (TR / Vol)
Source: Deutsche Bank, FactSet. Note: Data as of the end of last month; Calculations based on total returns; Volatility based on daily total returns annualized using a 252 day factor; Sharpe ratiocalculation assumes Risk free equal to zero. For Max DD and Sharpe calculation, green cells correspond to largest value, while red cells correspond to lowest values. For Volatility calculations, greencells are the least volatile (lowest values), while red cells are the most volatile (highest values). The ETFs mentioned in this figure are provided as reference and have been selected as investable andrepresentative vehicle for each asset class considering the product's asset class representation, liquidity, size, cost, and ease to borrow for tactical or risk hedging purpose; however, they should notbe seen as the only or best alternative for each asset class as finding the right product will depend on the specific investor's objective and intended usage. Please refer to "Product Type Definitions"on Appendix C for further details on product selection criteria depending on product usage.
Page 16 Deutsche Bank Securities Inc.
16 February 2017
US ETF Compass
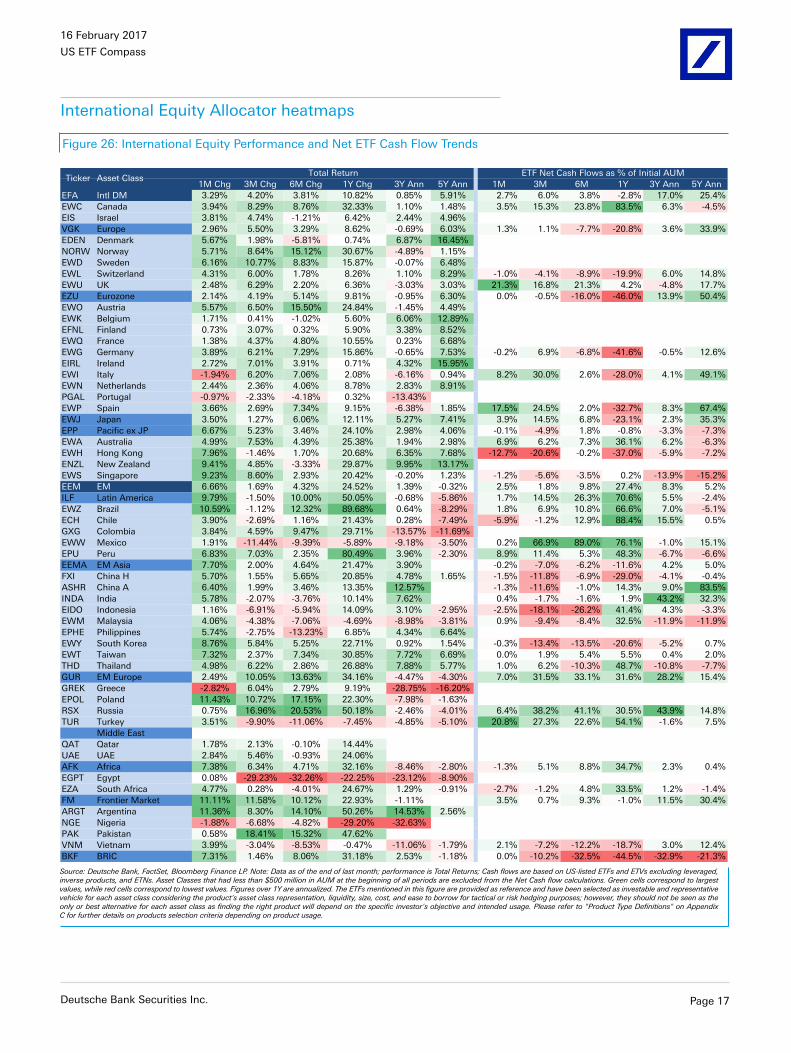
International Equity Allocator heatmaps
Figure 26: International Equity Performance and Net ETF Cash Flow Trends
1M Chg 3M Chg 6M Chg 1Y Chg 3Y Ann 5Y Ann 1M 3M 6M 1Y 3Y Ann 5Y Ann
EFA Intl DM 3.29% 4.20% 3.81% 10.82% 0.85% 5.91% 2.7% 6.0% 3.8% -2.8% 17.0% 25.4%
EWC Canada 3.94% 8.29% 8.76% 32.33% 1.10% 1.48% 3.5% 15.3% 23.8% 83.5% 6.3% -4.5%
EIS Israel 3.81% 4.74% -1.21% 6.42% 2.44% 4.96%
VGK Europe 2.96% 5.50% 3.29% 8.62% -0.69% 6.03% 1.3% 1.1% -7.7% -20.8% 3.6% 33.9%
EDEN Denmark 5.67% 1.98% -5.81% 0.74% 6.87% 16.45%
NORW Norway 5.71% 8.64% 15.12% 30.67% -4.89% 1.15%
EWD Sweden 6.16% 10.77% 8.83% 15.87% -0.07% 6.48%
EWL Switzerland 4.31% 6.00% 1.78% 8.26% 1.10% 8.29% -1.0% -4.1% -8.9% -19.9% 6.0% 14.8%
EWU UK 2.48% 6.29% 2.20% 6.36% -3.03% 3.03% 21.3% 16.8% 21.3% 4.2% -4.8% 17.7%
EZU Eurozone 2.14% 4.19% 5.14% 9.81% -0.95% 6.30% 0.0% -0.5% -16.0% -46.0% 13.9% 50.4%
EWO Austria 5.57% 6.50% 15.50% 24.84% -1.45% 4.49%
EWK Belgium 1.71% 0.41% -1.02% 5.60% 6.06% 12.89%
EFNL Finland 0.73% 3.07% 0.32% 5.90% 3.38% 8.52%
EWQ France 1.38% 4.37% 4.80% 10.55% 0.23% 6.68%
EWG Germany 3.89% 6.21% 7.29% 15.86% -0.65% 7.53% -0.2% 6.9% -6.8% -41.6% -0.5% 12.6%
EIRL Ireland 2.72% 7.01% 3.91% 0.71% 4.32% 15.95%
EWI Italy -1.94% 6.20% 7.06% 2.08% -6.16% 0.94% 8.2% 30.0% 2.6% -28.0% 4.1% 49.1%
EWN Netherlands 2.44% 2.36% 4.06% 8.78% 2.83% 8.91%
PGAL Portugal -0.97% -2.33% -4.18% 0.32% -13.43%
EWP Spain 3.66% 2.69% 7.34% 9.15% -6.38% 1.85% 17.5% 24.5% 2.0% -32.7% 8.3% 67.4%
EWJ Japan 3.50% 1.27% 6.06% 12.11% 5.27% 7.41% 3.9% 14.5% 6.8% -23.1% 2.3% 35.3%
EPP Pacific ex JP 6.67% 5.23% 3.46% 24.10% 2.98% 4.06% -0.1% -4.9% 1.8% -0.8% -3.3% -7.3%
EWA Australia 4.99% 7.53% 4.39% 25.38% 1.94% 2.98% 6.9% 6.2% 7.3% 36.1% 6.2% -6.3%
EWH Hong Kong 7.96% -1.46% 1.70% 20.68% 6.35% 7.68% -12.7% -20.6% -0.2% -37.0% -5.9% -7.2%
ENZL New Zealand 9.41% 4.85% -3.33% 29.87% 9.95% 13.17%
EWS Singapore 9.23% 8.60% 2.93% 20.42% -0.20% 1.23% -1.2% -5.6% -3.5% 0.2% -13.9% -15.2%
EEM EM 6.66% 1.69% 4.32% 24.52% 1.39% -0.32% 2.5% 1.8% 9.8% 27.4% 8.3% 5.2%
ILF Latin America 9.79% -1.50% 10.00% 50.05% -0.68% -5.86% 1.7% 14.5% 26.3% 70.6% 5.5% -2.4%
EWZ Brazil 10.59% -1.12% 12.32% 89.68% 0.64% -8.29% 1.8% 6.9% 10.8% 66.6% 7.0% -5.1%
ECH Chile 3.90% -2.69% 1.16% 21.43% 0.28% -7.49% -5.9% -1.2% 12.9% 88.4% 15.5% 0.5%
GXG Colombia 3.84% 4.59% 9.47% 29.71% -13.57% -11.69%
EWW Mexico 1.91% -11.44% -9.39% -5.89% -9.18% -3.50% 0.2% 66.9% 89.0% 76.1% -1.0% 15.1%
EPU Peru 6.83% 7.03% 2.35% 80.49% 3.96% -2.30% 8.9% 11.4% 5.3% 48.3% -6.7% -6.6%
EEMA EM Asia 7.70% 2.00% 4.64% 21.47% 3.90% -0.2% -7.0% -6.2% -11.6% 4.2% 5.0%
FXI China H 5.70% 1.55% 5.65% 20.85% 4.78% 1.65% -1.5% -11.8% -6.9% -29.0% -4.1% -0.4%
ASHR China A 6.40% 1.99% 3.46% 13.35% 12.57% -1.3% -11.6% -1.0% 14.3% 9.0% 83.5%
INDA India 5.78% -2.07% -3.76% 10.14% 7.62% 0.4% -1.7% -1.6% 1.9% 43.2% 32.3%
EIDO Indonesia 1.16% -6.91% -5.94% 14.09% 3.10% -2.95% -2.5% -18.1% -26.2% 41.4% 4.3% -3.3%
EWM Malaysia 4.06% -4.38% -7.06% -4.69% -8.98% -3.81% 0.9% -9.4% -8.4% 32.5% -11.9% -11.9%
EPHE Philippines 5.74% -2.75% -13.23% 6.85% 4.34% 6.64%
EWY South Korea 8.76% 5.84% 5.25% 22.71% 0.92% 1.54% -0.3% -13.4% -13.5% -20.6% -5.2% 0.7%
EWT Taiwan 7.32% 2.37% 7.34% 30.85% 7.72% 6.69% 0.0% 1.9% 5.4% 5.5% 0.4% 2.0%
THD Thailand 4.98% 6.22% 2.86% 26.88% 7.88% 5.77% 1.0% 6.2% -10.3% 48.7% -10.8% -7.7%
GUR EM Europe 2.49% 10.05% 13.63% 34.16% -4.47% -4.30% 7.0% 31.5% 33.1% 31.6% 28.2% 15.4%
GREK Greece -2.82% 6.04% 2.79% 9.19% -28.75% -16.20%
EPOL Poland 11.43% 10.72% 17.15% 22.30% -7.98% -1.63%
RSX Russia 0.75% 16.96% 20.53% 50.18% -2.46% -4.01% 6.4% 38.2% 41.1% 30.5% 43.9% 14.8%
TUR Turkey 3.51% -9.90% -11.06% -7.45% -4.85% -5.10% 20.8% 27.3% 22.6% 54.1% -1.6% 7.5%
Middle East
QAT Qatar 1.78% 2.13% -0.10% 14.44%
UAE UAE 2.84% 5.46% -0.93% 24.06%
AFK Africa 7.38% 6.34% 4.71% 32.16% -8.46% -2.80% -1.3% 5.1% 8.8% 34.7% 2.3% 0.4%
EGPT Egypt 0.08% -29.23% -32.26% -22.25% -23.12% -8.90%
EZA South Africa 4.77% 0.28% -4.01% 24.67% 1.29% -0.91% -2.7% -1.2% 4.8% 33.5% 1.2% -1.4%
FM Frontier Market 11.11% 11.58% 10.12% 22.93% -1.11% 3.5% 0.7% 9.3% -1.0% 11.5% 30.4%
ARGT Argentina 11.36% 8.30% 14.10% 50.26% 14.53% 2.56%
NGE Nigeria -1.88% -6.68% -4.82% -29.20% -32.63%
PAK Pakistan 0.58% 18.41% 15.32% 47.62%
VNM Vietnam 3.99% -3.04% -8.53% -0.47% -11.06% -1.79% 2.1% -7.2% -12.2% -18.7% 3.0% 12.4%
BKF BRIC 7.31% 1.46% 8.06% 31.18% 2.53% -1.18% 0.0% -10.2% -32.5% -44.5% -32.9% -21.3%
Ticker Asset ClassTotal Return ETF Net Cash Flows as % of Initial AUM
Source: Deutsche Bank, FactSet, Bloomberg Finance LP. Note: Data as of the end of last month; performance is Total Returns; Cash flows are based on US-listed ETFs and ETVs excluding leveraged,inverse products, and ETNs. Asset Classes that had less than $500 million in AUM at the beginning of all periods are excluded from the Net Cash flow calculations. Green cells correspond to largestvalues, while red cells correspond to lowest values. Figures over 1Y are annualized. The ETFs mentioned in this figure are provided as reference and have been selected as investable and representativevehicle for each asset class considering the product's asset class representation, liquidity, size, cost, and ease to borrow for tactical or risk hedging purposes; however, they should not be seen as theonly or best alternative for each asset class as finding the right product will depend on the specific investor's objective and intended usage. Please refer to "Product Type Definitions" on AppendixC for further details on products selection criteria depending on product usage.
Deutsche Bank Securities Inc. Page 17
16 February 2017
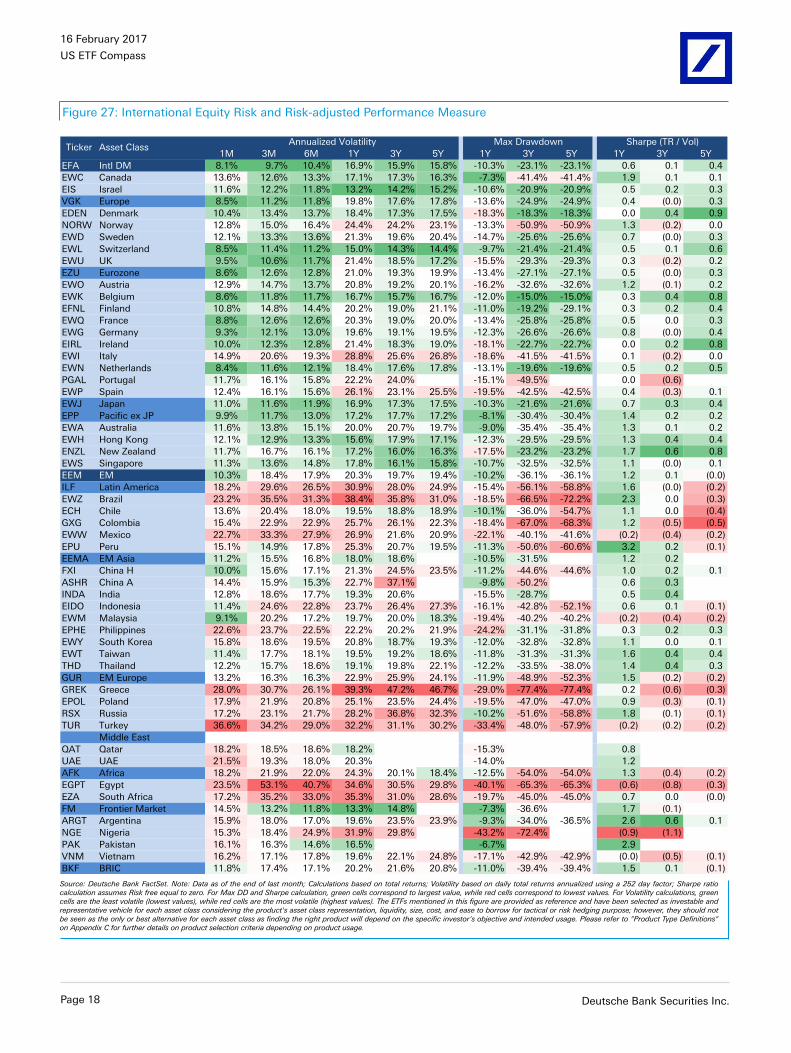
US ETF Compass
Figure 27: International Equity Risk and Risk-adjusted Performance Measure
1M 3M 6M 1Y 3Y 5Y 1Y 3Y 5Y 1Y 3Y 5Y
EFA Intl DM 8.1% 9.7% 10.4% 16.9% 15.9% 15.8% -10.3% -23.1% -23.1% 0.6 0.1 0.4
EWC Canada 13.6% 12.6% 13.3% 17.1% 17.3% 16.3% -7.3% -41.4% -41.4% 1.9 0.1 0.1
EIS Israel 11.6% 12.2% 11.8% 13.2% 14.2% 15.2% -10.6% -20.9% -20.9% 0.5 0.2 0.3
VGK Europe 8.5% 11.2% 11.8% 19.8% 17.6% 17.8% -13.6% -24.9% -24.9% 0.4 (0.0) 0.3
EDEN Denmark 10.4% 13.4% 13.7% 18.4% 17.3% 17.5% -18.3% -18.3% -18.3% 0.0 0.4 0.9
NORW Norway 12.8% 15.0% 16.4% 24.4% 24.2% 23.1% -13.3% -50.9% -50.9% 1.3 (0.2) 0.0
EWD Sweden 12.1% 13.3% 13.6% 21.3% 19.6% 20.4% -14.7% -25.6% -25.6% 0.7 (0.0) 0.3
EWL Switzerland 8.5% 11.4% 11.2% 15.0% 14.3% 14.4% -9.7% -21.4% -21.4% 0.5 0.1 0.6
EWU UK 9.5% 10.6% 11.7% 21.4% 18.5% 17.2% -15.5% -29.3% -29.3% 0.3 (0.2) 0.2
EZU Eurozone 8.6% 12.6% 12.8% 21.0% 19.3% 19.9% -13.4% -27.1% -27.1% 0.5 (0.0) 0.3
EWO Austria 12.9% 14.7% 13.7% 20.8% 19.2% 20.1% -16.2% -32.6% -32.6% 1.2 (0.1) 0.2
EWK Belgium 8.6% 11.8% 11.7% 16.7% 15.7% 16.7% -12.0% -15.0% -15.0% 0.3 0.4 0.8
EFNL Finland 10.8% 14.8% 14.4% 20.2% 19.0% 21.1% -11.0% -19.2% -29.1% 0.3 0.2 0.4
EWQ France 8.8% 12.6% 12.6% 20.3% 19.0% 20.0% -13.4% -25.8% -25.8% 0.5 0.0 0.3
EWG Germany 9.3% 12.1% 13.0% 19.6% 19.1% 19.5% -12.3% -26.6% -26.6% 0.8 (0.0) 0.4
EIRL Ireland 10.0% 12.3% 12.8% 21.4% 18.3% 19.0% -18.1% -22.7% -22.7% 0.0 0.2 0.8
EWI Italy 14.9% 20.6% 19.3% 28.8% 25.6% 26.8% -18.6% -41.5% -41.5% 0.1 (0.2) 0.0
EWN Netherlands 8.4% 11.6% 12.1% 18.4% 17.6% 17.8% -13.1% -19.6% -19.6% 0.5 0.2 0.5
PGAL Portugal 11.7% 16.1% 15.8% 22.2% 24.0% -15.1% -49.5% 0.0 (0.6)
EWP Spain 12.4% 16.1% 15.6% 26.1% 23.1% 25.5% -19.5% -42.5% -42.5% 0.4 (0.3) 0.1
EWJ Japan 11.0% 11.6% 11.9% 16.9% 17.3% 17.5% -10.3% -21.6% -21.6% 0.7 0.3 0.4
EPP Pacific ex JP 9.9% 11.7% 13.0% 17.2% 17.7% 17.2% -8.1% -30.4% -30.4% 1.4 0.2 0.2
EWA Australia 11.6% 13.8% 15.1% 20.0% 20.7% 19.7% -9.0% -35.4% -35.4% 1.3 0.1 0.2
EWH Hong Kong 12.1% 12.9% 13.3% 15.6% 17.9% 17.1% -12.3% -29.5% -29.5% 1.3 0.4 0.4
ENZL New Zealand 11.7% 16.7% 16.1% 17.2% 16.0% 16.3% -17.5% -23.2% -23.2% 1.7 0.6 0.8
EWS Singapore 11.3% 13.6% 14.8% 17.8% 16.1% 15.8% -10.7% -32.5% -32.5% 1.1 (0.0) 0.1
EEM EM 10.3% 18.4% 17.9% 20.3% 19.7% 19.4% -10.2% -36.1% -36.1% 1.2 0.1 (0.0)
ILF Latin America 18.2% 29.6% 26.5% 30.9% 28.0% 24.9% -15.4% -56.1% -58.8% 1.6 (0.0) (0.2)
EWZ Brazil 23.2% 35.5% 31.3% 38.4% 35.8% 31.0% -18.5% -66.5% -72.2% 2.3 0.0 (0.3)
ECH Chile 13.6% 20.4% 18.0% 19.5% 18.8% 18.9% -10.1% -36.0% -54.7% 1.1 0.0 (0.4)
GXG Colombia 15.4% 22.9% 22.9% 25.7% 26.1% 22.3% -18.4% -67.0% -68.3% 1.2 (0.5) (0.5)
EWW Mexico 22.7% 33.3% 27.9% 26.9% 21.6% 20.9% -22.1% -40.1% -41.6% (0.2) (0.4) (0.2)
EPU Peru 15.1% 14.9% 17.8% 25.3% 20.7% 19.5% -11.3% -50.6% -60.6% 3.2 0.2 (0.1)
EEMA EM Asia 11.2% 15.5% 16.8% 18.0% 18.6% -10.5% -31.5% 1.2 0.2
FXI China H 10.0% 15.6% 17.1% 21.3% 24.5% 23.5% -11.2% -44.6% -44.6% 1.0 0.2 0.1
ASHR China A 14.4% 15.9% 15.3% 22.7% 37.1% -9.8% -50.2% 0.6 0.3
INDA India 12.8% 18.6% 17.7% 19.3% 20.6% -15.5% -28.7% 0.5 0.4
EIDO Indonesia 11.4% 24.6% 22.8% 23.7% 26.4% 27.3% -16.1% -42.8% -52.1% 0.6 0.1 (0.1)
EWM Malaysia 9.1% 20.2% 17.2% 19.7% 20.0% 18.3% -19.4% -40.2% -40.2% (0.2) (0.4) (0.2)
EPHE Philippines 22.6% 23.7% 22.5% 22.2% 20.2% 21.9% -24.2% -31.1% -31.8% 0.3 0.2 0.3
EWY South Korea 15.8% 18.6% 19.5% 20.8% 18.7% 19.3% -12.0% -32.8% -32.8% 1.1 0.0 0.1
EWT Taiwan 11.4% 17.7% 18.1% 19.5% 19.2% 18.6% -11.8% -31.3% -31.3% 1.6 0.4 0.4
THD Thailand 12.2% 15.7% 18.6% 19.1% 19.8% 22.1% -12.2% -33.5% -38.0% 1.4 0.4 0.3
GUR EM Europe 13.2% 16.3% 16.3% 22.9% 25.9% 24.1% -11.9% -48.9% -52.3% 1.5 (0.2) (0.2)
GREK Greece 28.0% 30.7% 26.1% 39.3% 47.2% 46.7% -29.0% -77.4% -77.4% 0.2 (0.6) (0.3)
EPOL Poland 17.9% 21.9% 20.8% 25.1% 23.5% 24.4% -19.5% -47.0% -47.0% 0.9 (0.3) (0.1)
RSX Russia 17.2% 23.1% 21.7% 28.2% 36.8% 32.3% -10.2% -51.6% -58.8% 1.8 (0.1) (0.1)
TUR Turkey 36.6% 34.2% 29.0% 32.2% 31.1% 30.2% -33.4% -48.0% -57.9% (0.2) (0.2) (0.2)
Middle East
QAT Qatar 18.2% 18.5% 18.6% 18.2% -15.3% 0.8
UAE UAE 21.5% 19.3% 18.0% 20.3% -14.0% 1.2
AFK Africa 18.2% 21.9% 22.0% 24.3% 20.1% 18.4% -12.5% -54.0% -54.0% 1.3 (0.4) (0.2)
EGPT Egypt 23.5% 53.1% 40.7% 34.6% 30.5% 29.8% -40.1% -65.3% -65.3% (0.6) (0.8) (0.3)
EZA South Africa 17.2% 35.2% 33.0% 35.3% 31.0% 28.6% -19.7% -45.0% -45.0% 0.7 0.0 (0.0)
FM Frontier Market 14.5% 13.2% 11.8% 13.3% 14.8% -7.3% -36.6% 1.7 (0.1)
ARGT Argentina 15.9% 18.0% 17.0% 19.6% 23.5% 23.9% -9.3% -34.0% -36.5% 2.6 0.6 0.1
NGE Nigeria 15.3% 18.4% 24.9% 31.9% 29.8% -43.2% -72.4% (0.9) (1.1)
PAK Pakistan 16.1% 16.3% 14.6% 16.5% -6.7% 2.9
VNM Vietnam 16.2% 17.1% 17.8% 19.6% 22.1% 24.8% -17.1% -42.9% -42.9% (0.0) (0.5) (0.1)
BKF BRIC 11.8% 17.4% 17.1% 20.2% 21.6% 20.8% -11.0% -39.4% -39.4% 1.5 0.1 (0.1)
Ticker Asset ClassAnnualized Volatility Max Drawdown Sharpe (TR / Vol)
Source: Deutsche Bank FactSet. Note: Data as of the end of last month; Calculations based on total returns; Volatility based on daily total returns annualized using a 252 day factor; Sharpe ratiocalculation assumes Risk free equal to zero. For Max DD and Sharpe calculation, green cells correspond to largest value, while red cells correspond to lowest values. For Volatility calculations, greencells are the least volatile (lowest values), while red cells are the most volatile (highest values). The ETFs mentioned in this figure are provided as reference and have been selected as investable andrepresentative vehicle for each asset class considering the product's asset class representation, liquidity, size, cost, and ease to borrow for tactical or risk hedging purpose; however, they should notbe seen as the only or best alternative for each asset class as finding the right product will depend on the specific investor's objective and intended usage. Please refer to "Product Type Definitions"on Appendix C for further details on product selection criteria depending on product usage.
Page 18 Deutsche Bank Securities Inc.

Deu
tsche B
ank S
ecurities In
c.Pag
e 19
Cross Asset Correlations
Figure 28: 3-Year Cross Asset Class Correlations of Weekly Total Returns3Y - Cross Asset Class Correlation of Weekly Total Returns
Category Ticker ACWI VTI EFA EEM AGG GOVT TIP MUB MBB LQD HYG FLOT BKLN PFF CWB BWX WIP EMB EMLC EMCB DBC DBE DBA DBB DBP UUP FXY FXE
Global Equities ACWI 0.95 0.95 0.85 -0.22 -0.33 -0.04 -0.23 -0.22 -0.01 0.67 0.08 0.59 0.45 0.88 -0.05 0.22 0.53 0.52 0.45 0.46 0.42 0.27 0.43 -0.10 0.09 -0.36 -0.11
US Total Market VTI 0.95 0.84 0.71 -0.28 -0.38 -0.10 -0.29 -0.28 -0.06 0.65 0.08 0.58 0.41 0.90 -0.17 0.07 0.42 0.36 0.36 0.36 0.34 0.21 0.36 -0.18 0.19 -0.42 -0.21
Intl DM EFA 0.95 0.84 0.81 -0.19 -0.28 -0.02 -0.17 -0.20 0.00 0.60 0.07 0.55 0.45 0.80 0.02 0.29 0.52 0.53 0.43 0.46 0.42 0.26 0.43 -0.06 -0.01 -0.33 -0.02
EM EEM 0.85 0.71 0.81 -0.03 -0.13 0.15 -0.07 -0.01 0.14 0.62 0.10 0.52 0.40 0.69 0.14 0.41 0.66 0.74 0.55 0.50 0.41 0.31 0.47 0.09 -0.02 -0.15 -0.02
US Agg Bond IG AGG -0.22 -0.28 -0.19 -0.03 0.96 0.84 0.78 0.87 0.90 -0.03 -0.10 -0.11 0.22 -0.20 0.65 0.55 0.34 0.28 0.15 -0.17 -0.22 -0.05 -0.14 0.42 -0.31 0.57 0.25
US Treasury GOVT -0.33 -0.38 -0.28 -0.13 0.96 0.80 0.77 0.82 0.83 -0.16 -0.13 -0.24 0.14 -0.31 0.64 0.50 0.25 0.21 0.07 -0.26 -0.31 -0.10 -0.19 0.45 -0.32 0.58 0.27
US Inflation TIP -0.04 -0.10 -0.02 0.15 0.84 0.80 0.65 0.78 0.81 0.11 -0.05 0.02 0.25 -0.06 0.63 0.61 0.42 0.42 0.25 0.06 0.00 0.03 0.09 0.42 -0.33 0.47 0.26
Municipal MUB -0.23 -0.29 -0.17 -0.07 0.78 0.77 0.65 0.73 0.69 -0.10 -0.12 -0.20 0.17 -0.23 0.50 0.45 0.28 0.24 0.03 -0.19 -0.25 0.00 -0.13 0.35 -0.24 0.50 0.18
MBS MBB -0.22 -0.28 -0.20 -0.01 0.87 0.82 0.78 0.73 0.74 -0.05 -0.13 -0.14 0.19 -0.21 0.57 0.51 0.30 0.27 0.15 -0.16 -0.20 -0.09 -0.12 0.38 -0.30 0.52 0.23
IG Corporates LQD -0.01 -0.06 0.00 0.14 0.90 0.83 0.81 0.69 0.74 0.24 -0.07 0.15 0.39 0.03 0.56 0.55 0.50 0.39 0.29 -0.04 -0.07 0.00 -0.07 0.34 -0.23 0.46 0.16
HY Corporates HYG 0.67 0.65 0.60 0.62 -0.03 -0.16 0.11 -0.10 -0.05 0.24 0.11 0.76 0.52 0.70 0.00 0.22 0.69 0.56 0.57 0.51 0.50 0.20 0.31 0.01 0.08 -0.17 -0.11
Floater FLOT 0.08 0.08 0.07 0.10 -0.10 -0.13 -0.05 -0.12 -0.13 -0.07 0.11 0.14 -0.08 0.02 0.05 0.06 0.00 0.10 0.17 0.14 0.12 0.14 0.08 0.06 -0.09 0.01 0.07
Senior Loans BKLN 0.59 0.58 0.55 0.52 -0.11 -0.24 0.02 -0.20 -0.14 0.15 0.76 0.14 0.43 0.61 -0.06 0.13 0.47 0.42 0.46 0.43 0.41 0.18 0.30 -0.05 0.12 -0.22 -0.15
Preferred PFF 0.45 0.41 0.45 0.40 0.22 0.14 0.25 0.17 0.19 0.39 0.52 -0.08 0.43 0.51 0.11 0.28 0.52 0.36 0.39 0.21 0.20 0.21 0.17 0.01 0.03 -0.05 -0.07
Convertible CWB 0.88 0.90 0.80 0.69 -0.20 -0.31 -0.06 -0.23 -0.21 0.03 0.70 0.02 0.61 0.51 -0.14 0.10 0.48 0.38 0.40 0.35 0.33 0.19 0.33 -0.16 0.18 -0.36 -0.18
Intl DM Debt BWX -0.05 -0.17 0.02 0.14 0.65 0.64 0.63 0.50 0.57 0.56 0.00 0.05 -0.06 0.11 -0.14 0.85 0.33 0.52 0.18 0.14 0.03 0.17 0.14 0.61 -0.86 0.73 0.79
Intl Inflation WIP 0.22 0.07 0.29 0.41 0.55 0.50 0.61 0.45 0.51 0.55 0.22 0.06 0.13 0.28 0.10 0.85 0.53 0.72 0.34 0.31 0.20 0.23 0.25 0.53 -0.73 0.49 0.66
EM Gov Debt USD EMB 0.53 0.42 0.52 0.66 0.34 0.25 0.42 0.28 0.30 0.50 0.69 0.00 0.47 0.52 0.48 0.33 0.53 0.76 0.72 0.37 0.32 0.21 0.19 0.20 -0.09 0.11 0.03
EM Gov Debt Local EMLC 0.52 0.36 0.53 0.74 0.28 0.21 0.42 0.24 0.27 0.39 0.56 0.10 0.42 0.36 0.38 0.52 0.72 0.76 0.58 0.48 0.37 0.33 0.33 0.38 -0.36 0.21 0.31
EM Corp USD EMCB 0.45 0.36 0.43 0.55 0.15 0.07 0.25 0.03 0.15 0.29 0.57 0.17 0.46 0.39 0.40 0.18 0.34 0.72 0.58 0.37 0.36 0.16 0.16 0.02 -0.02 0.02 -0.03
Commodities DBC 0.46 0.36 0.46 0.50 -0.17 -0.26 0.06 -0.19 -0.16 -0.04 0.51 0.14 0.43 0.21 0.35 0.14 0.31 0.37 0.48 0.37 0.94 0.50 0.49 0.14 -0.21 -0.06 0.17
Energy Cmdty DBE 0.42 0.34 0.42 0.41 -0.22 -0.31 0.00 -0.25 -0.20 -0.07 0.50 0.12 0.41 0.20 0.33 0.03 0.20 0.32 0.37 0.36 0.94 0.29 0.34 -0.04 -0.10 -0.13 0.07
Agriculture DBA 0.27 0.21 0.26 0.31 -0.05 -0.10 0.03 0.00 -0.09 0.00 0.20 0.14 0.18 0.21 0.19 0.17 0.23 0.21 0.33 0.16 0.50 0.29 0.26 0.15 -0.22 0.02 0.21
Industrial Metals DBB 0.43 0.36 0.43 0.47 -0.14 -0.19 0.09 -0.13 -0.12 -0.07 0.31 0.08 0.30 0.17 0.33 0.14 0.25 0.19 0.33 0.16 0.49 0.34 0.26 0.11 -0.20 -0.11 0.19
Precious Metals DBP -0.10 -0.18 -0.06 0.09 0.42 0.45 0.42 0.35 0.38 0.34 0.01 0.06 -0.05 0.01 -0.16 0.61 0.53 0.20 0.38 0.02 0.14 -0.04 0.15 0.11 -0.52 0.56 0.43
Bull USD UUP 0.09 0.19 -0.01 -0.02 -0.31 -0.32 -0.33 -0.24 -0.30 -0.23 0.08 -0.09 0.12 0.03 0.18 -0.86 -0.73 -0.09 -0.36 -0.02 -0.21 -0.10 -0.22 -0.20 -0.52 -0.59 -0.97
JPYUSD FXY -0.36 -0.42 -0.33 -0.15 0.57 0.58 0.47 0.50 0.52 0.46 -0.17 0.01 -0.22 -0.05 -0.36 0.73 0.49 0.11 0.21 0.02 -0.06 -0.13 0.02 -0.11 0.56 -0.59 0.47
EURUSD FXE -0.11 -0.21 -0.02 -0.02 0.25 0.27 0.26 0.18 0.23 0.16 -0.11 0.07 -0.15 -0.07 -0.18 0.79 0.66 0.03 0.31 -0.03 0.17 0.07 0.21 0.19 0.43 -0.97 0.47
Source: Deutsche Bank, FactSet. Data as of the end of last month. Green cells denote highest correlations, while red cells denote lowest correlations.
Figure 29: 26W Rolling Correlation for selected asset class pairs (5Y)
-1
-0.8
-0.6
-0.4
-0.2
0
0.2
0.4
0.6
0.8
1
Apr-11 Apr-12 Apr-13 Apr-14 Apr-15 Apr-16
Global Equities - 26W Rolling Correlation
US Agg Bond IG Commodities Real Estate Bull USD Gold
0
0.1
0.2
0.3
0.4
0.5
0.6
0.7
0.8
0.9
1
Apr-11 Apr-12 Apr-13 Apr-14 Apr-15 Apr-16
US Equities - 26W Rolling Correlation
DM Intl EM Japan Pacific ex JP Europe
-1
-0.8
-0.6
-0.4
-0.2
0
0.2
0.4
0.6
0.8
1
Apr-11 Apr-12 Apr-13 Apr-14 Apr-15 Apr-16
US Fixed Income - 26W Rolling Correlation
US Treasury IG Corp HY Corp Sr Loans
Source: Deutsche Bank, FactSet. Correlations based on weekly total returns of US-listed ETFs: Global Equities (ACWI), US Agg Bond IG (AGG), Commodities (DBC), Real Estate (VNQ) and Gold (GLD). US Equity (VTI), DM Intl (EFA), EM (EEM), Japan (EWJ), Pacific ex JP (EPP), andEurope (VGK). US Fixed Income (AGG), US Treasury (GOVT), IG Corp (LQD), HY Corp (HYG), and Sr Loans (BKLN).
16
Febru
ary 20
17
US
ETF C
om
pass
16 February 2017
US ETF Compass
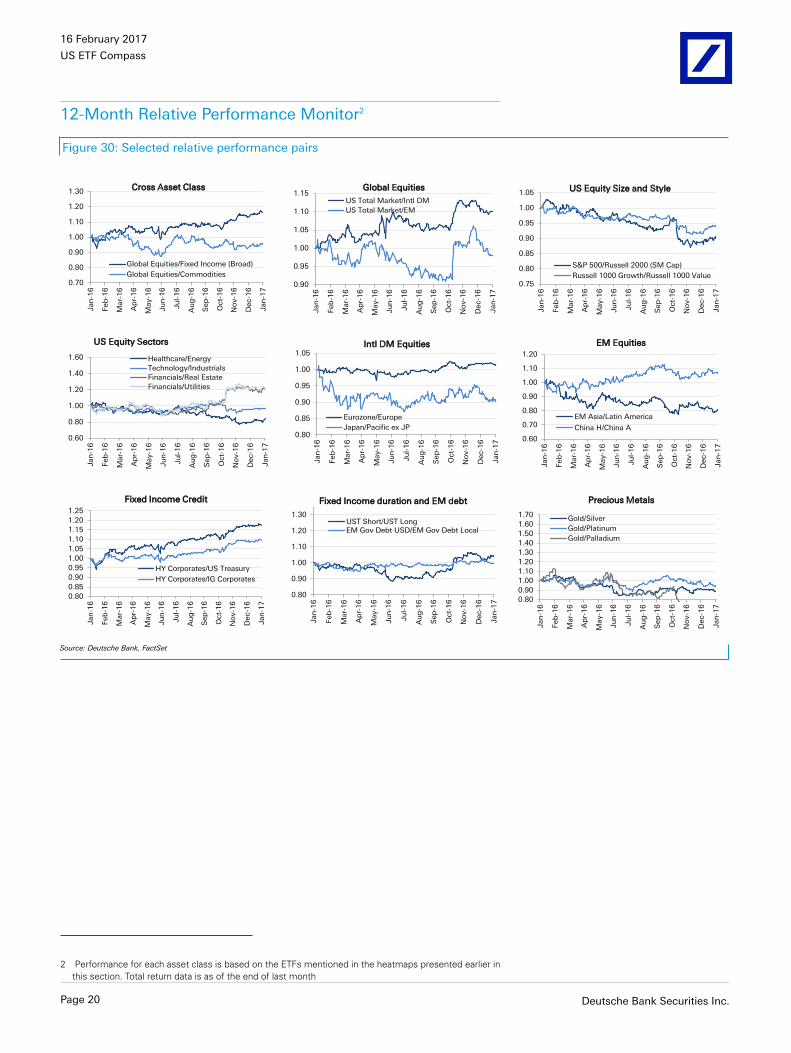
12-Month Relative Performance Monitor2
Figure 30: Selected relative performance pairs
0.60
0.80
1.00
1.20
1.40
1.60
Jan
-16
Feb
-16
Mar-
16
Ap
r-1
6
May-1
6
Ju
n-1
6
Ju
l-1
6
Au
g-1
6
Sep
-16
Oct-
16
No
v-1
6
Dec-1
6
Jan
-17
US Equity Sectors
Healthcare/Energy
Technology/Industrials
Financials/Real Estate
Financials/Utilities
0.90
0.95
1.00
1.05
1.10
1.15
Jan
-16
Feb
-16
Mar-
16
Ap
r-1
6
May-1
6
Ju
n-1
6
Ju
l-1
6
Au
g-1
6
Sep
-16
Oct-
16
No
v-1
6
Dec-1
6
Jan
-17
Global Equities
US Total Market/Intl DM
US Total Market/EM
0.80
0.85
0.90
0.95
1.00
1.05
Jan
-16
Feb
-16
Mar-
16
Ap
r-1
6
May-1
6
Ju
n-1
6
Ju
l-1
6
Au
g-1
6
Sep
-16
Oct-
16
No
v-1
6
Dec-1
6
Jan
-17
Intl DM Equities
Eurozone/Europe
Japan/Pacific ex JP
0.75
0.80
0.85
0.90
0.95
1.00
1.05
Jan
-16
Feb
-16
Mar-
16
Ap
r-1
6
May-1
6
Ju
n-1
6
Ju
l-1
6
Au
g-1
6
Sep
-16
Oct-
16
No
v-1
6
Dec-1
6
Jan
-17
US Equity Size and Style
S&P 500/Russell 2000 (SM Cap)
Russell 1000 Growth/Russell 1000 Value
0.60
0.70
0.80
0.90
1.00
1.10
1.20
Jan
-16
Feb
-16
Mar-
16
Ap
r-1
6
May-1
6
Ju
n-1
6
Ju
l-1
6
Au
g-1
6
Sep
-16
Oct-
16
No
v-1
6
Dec-1
6
Jan
-17
EM Equities
EM Asia/Latin America
China H/China A
0.70
0.80
0.90
1.00
1.10
1.20
1.30
Jan
-16
Feb
-16
Mar-
16
Ap
r-1
6
May-1
6
Ju
n-1
6
Ju
l-1
6
Au
g-1
6
Sep
-16
Oct-
16
No
v-1
6
Dec-1
6
Jan
-17
Cross Asset Class
Global Equities/Fixed Income (Broad)
Global Equities/Commodities
0.80
0.85
0.90
0.95
1.00
1.05
1.10
1.15
1.20
1.25
Jan
-16
Feb
-16
Mar-
16
Ap
r-1
6
May-1
6
Ju
n-1
6
Ju
l-1
6
Au
g-1
6
Sep
-16
Oct-
16
No
v-1
6
Dec-1
6
Jan
-17
Fixed Income Credit
HY Corporates/US Treasury
HY Corporates/IG Corporates
0.80
0.90
1.00
1.10
1.20
1.30
1.40
1.50
1.60
1.70
Jan
-16
Feb
-16
Mar-
16
Ap
r-1
6
May-1
6
Ju
n-1
6
Ju
l-1
6
Au
g-1
6
Sep
-16
Oct-
16
No
v-1
6
Dec-1
6
Jan
-17
Precious Metals
Gold/Silver
Gold/Platinum
Gold/Palladium
0.80
0.90
1.00
1.10
1.20
1.30
Jan
-16
Feb
-16
Mar-
16
Ap
r-1
6
May-1
6
Ju
n-1
6
Ju
l-1
6
Au
g-1
6
Sep
-16
Oct-
16
No
v-1
6
Dec-1
6
Jan
-17
Fixed Income duration and EM debt
UST Short/UST Long
EM Gov Debt USD/EM Gov Debt Local
Source: Deutsche Bank, FactSet
2 Performance for each asset class is based on the ETFs mentioned in the heatmaps presented earlier inthis section. Total return data is as of the end of last month
Page 20 Deutsche Bank Securities Inc.
16 February 2017
US ETF Compass
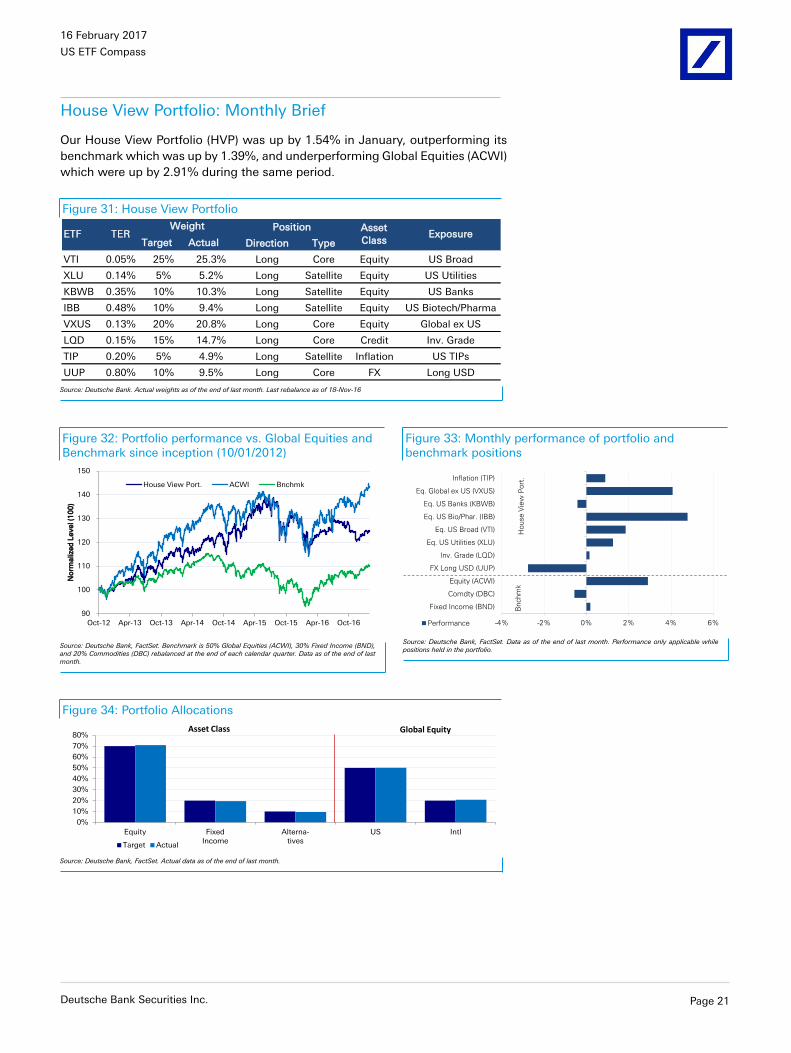
House View Portfolio: Monthly Brief
Our House View Portfolio (HVP) was up by 1.54% in January, outperforming itsbenchmark which was up by 1.39%, and underperforming Global Equities (ACWI)which were up by 2.91% during the same period.
Figure 31: House View Portfolio
Target Actual Direction Type
VTI 0.05% 25% 25.3% Long Core Equity US Broad
XLU 0.14% 5% 5.2% Long Satellite Equity US Utilities
KBWB 0.35% 10% 10.3% Long Satellite Equity US Banks
IBB 0.48% 10% 9.4% Long Satellite Equity US Biotech/Pharma
VXUS 0.13% 20% 20.8% Long Core Equity Global ex US
LQD 0.15% 15% 14.7% Long Core Credit Inv. Grade
TIP 0.20% 5% 4.9% Long Satellite Inflation US TIPs
UUP 0.80% 10% 9.5% Long Core FX Long USD
ExposurePosition Asset
Class
Weight
Source: Deutsche Bank. Actual weights as of the end of last month. Last rebalance as of 18-Nov-16
Figure 32: Portfolio performance vs. Global Equities andBenchmark since inception (10/01/2012)
90
100
110
120
130
140
150
Oct-12 Apr-13 Oct-13 Apr-14 Oct-14 Apr-15 Oct-15 Apr-16 Oct-16
No
rmalized
Level (1
00
)
House View Port. ACWI Bnchmk
Source: Deutsche Bank, FactSet. Benchmark is 50% Global Equities (ACWI), 30% Fixed Income (BND),and 20% Commodities (DBC) rebalanced at the end of each calendar quarter. Data as of the end of lastmonth.
Figure 33: Monthly performance of portfolio andbenchmark positions
-4% -2% 0% 2% 4% 6%
Fixed Income (BND)
Comdty (DBC)
Equity (ACWI)
FX Long USD (UUP)
Inv. Grade (LQD)
Eq. US Utilities (XLU)
Eq. US Broad (VTI)
Eq. US Bio/Phar. (IBB)
Eq. US Banks (KBWB)
Eq. Global ex US (VXUS)
Inflation (TIP)
Performance
Ho
use V
iew
Po
rt.
Bnchm
k
Source: Deutsche Bank, FactSet. Data as of the end of last month. Performance only applicable whilepositions held in the portfolio.
Figure 34: Portfolio Allocations
0%
10%
20%
30%
40%
50%
60%
70%
80%
Equity Fixed
Income
Alterna-
tives
US Intl
Target Actual
Asset Class Global Equity
Source: Deutsche Bank, FactSet. Actual data as of the end of last month.
Deutsche Bank Securities Inc. Page 21
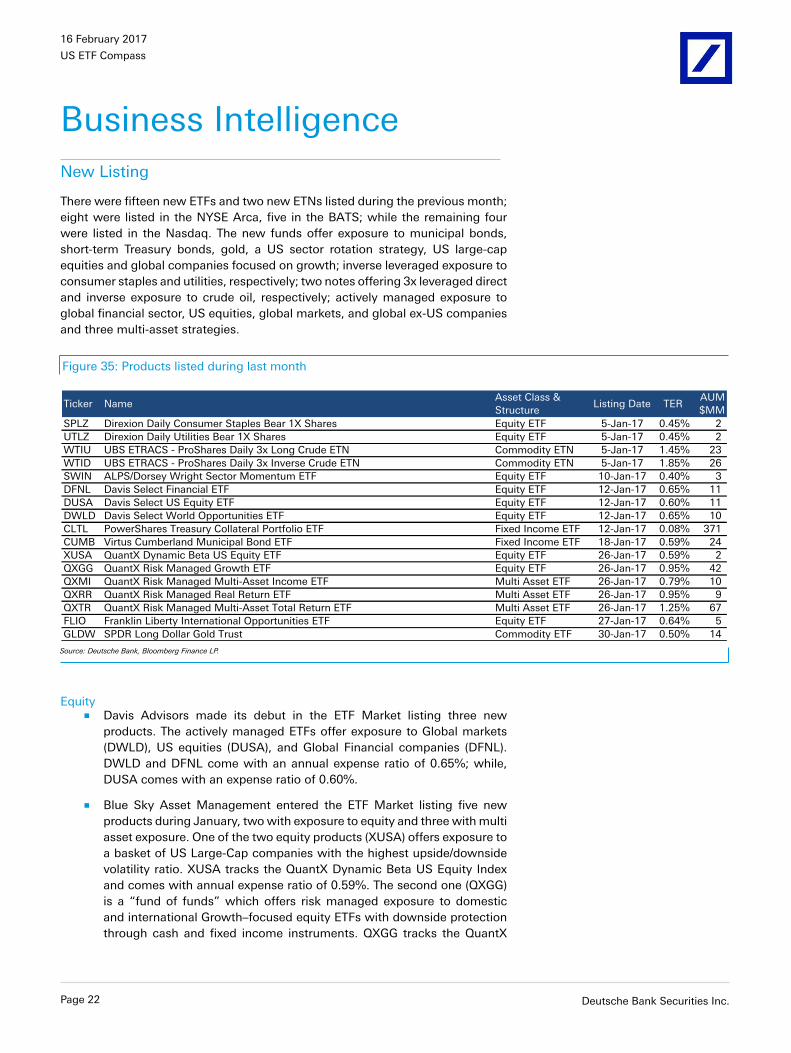
16 February 2017
US ETF Compass
Business IntelligenceNew Listing
There were fifteen new ETFs and two new ETNs listed during the previous month;eight were listed in the NYSE Arca, five in the BATS; while the remaining fourwere listed in the Nasdaq. The new funds offer exposure to municipal bonds,short-term Treasury bonds, gold, a US sector rotation strategy, US large-capequities and global companies focused on growth; inverse leveraged exposure toconsumer staples and utilities, respectively; two notes offering 3x leveraged directand inverse exposure to crude oil, respectively; actively managed exposure toglobal financial sector, US equities, global markets, and global ex-US companiesand three multi-asset strategies.
Figure 35: Products listed during last month
Ticker NameAsset Class &
StructureListing Date TER
AUM
$MM
SPLZ Direxion Daily Consumer Staples Bear 1X Shares Equity ETF 5-Jan-17 0.45% 2
UTLZ Direxion Daily Utilities Bear 1X Shares Equity ETF 5-Jan-17 0.45% 2
WTIU UBS ETRACS - ProShares Daily 3x Long Crude ETN Commodity ETN 5-Jan-17 1.45% 23
WTID UBS ETRACS - ProShares Daily 3x Inverse Crude ETN Commodity ETN 5-Jan-17 1.85% 26
SWIN ALPS/Dorsey Wright Sector Momentum ETF Equity ETF 10-Jan-17 0.40% 3
DFNL Davis Select Financial ETF Equity ETF 12-Jan-17 0.65% 11
DUSA Davis Select US Equity ETF Equity ETF 12-Jan-17 0.60% 11
DWLD Davis Select World Opportunities ETF Equity ETF 12-Jan-17 0.65% 10
CLTL PowerShares Treasury Collateral Portfolio ETF Fixed Income ETF 12-Jan-17 0.08% 371
CUMB Virtus Cumberland Municipal Bond ETF Fixed Income ETF 18-Jan-17 0.59% 24
XUSA QuantX Dynamic Beta US Equity ETF Equity ETF 26-Jan-17 0.59% 2
QXGG QuantX Risk Managed Growth ETF Equity ETF 26-Jan-17 0.95% 42
QXMI QuantX Risk Managed Multi-Asset Income ETF Multi Asset ETF 26-Jan-17 0.79% 10
QXRR QuantX Risk Managed Real Return ETF Multi Asset ETF 26-Jan-17 0.95% 9
QXTR QuantX Risk Managed Multi-Asset Total Return ETF Multi Asset ETF 26-Jan-17 1.25% 67
FLIO Franklin Liberty International Opportunities ETF Equity ETF 27-Jan-17 0.64% 5
GLDW SPDR Long Dollar Gold Trust Commodity ETF 30-Jan-17 0.50% 14
Source: Deutsche Bank, Bloomberg Finance LP.
Equity■ Davis Advisors made its debut in the ETF Market listing three new
products. The actively managed ETFs offer exposure to Global markets(DWLD), US equities (DUSA), and Global Financial companies (DFNL).DWLD and DFNL come with an annual expense ratio of 0.65%; while,DUSA comes with an expense ratio of 0.60%.
■ Blue Sky Asset Management entered the ETF Market listing five newproducts during January, two with exposure to equity and three with multiasset exposure. One of the two equity products (XUSA) offers exposure toa basket of US Large-Cap companies with the highest upside/downsidevolatility ratio. XUSA tracks the QuantX Dynamic Beta US Equity Indexand comes with annual expense ratio of 0.59%. The second one (QXGG)is a “fund of funds” which offers risk managed exposure to domesticand international Growth–focused equity ETFs with downside protectionthrough cash and fixed income instruments. QXGG tracks the QuantX
Page 22 Deutsche Bank Securities Inc.
16 February 2017
US ETF Compass
Risk Managed Growth Index and comes with an annual expense ratio of0.95%.
■ ALPS listed one new ETF (SWIN) during January, which offers equally-weighted exposure to the highest Momentum sectors excluding realestate. SWIN tracks the US sector rotation index called “Dorsey WrightUS Sector Momentum” and comes with an annual expense ratio of0.40%.
■ Franklin Templeton Investments listed one new ETF (FLIO) which offersactively managed exposure to a portfolio of global ex-US companies,including developed, emerging, and frontier markets. FLIO comes withannual expense ratio of 0.64%.
■ DirexionShares listed two new ETFs during January. The products offerinverse leveraged exposure to the Consumer Staples (SPLZ) and Utilities(UTLZ) US sectors, respectively. Both funds track S&P Dow Jones SelectSector indexes and come with annual expense ratio of 0.45%.
Fixed Income■ PowerShares listed one new fixed income ETF (CLTL), offering exposure
to US Treasury bonds with maturities of 12 month or less. The ultra-shortterm fund tracks the ICE U.S. Treasury Short Bond Index and comes withan annual expense ratio of 0.08%. In addition, CLTL has two NAV strikesdaily to enhance liquidity providing T+0 and T+1 settlement optionsdepending of whether the creation/redemption order is received before orafter 12pm, respectively. The enhanced liquidity feature, in addition to theliquidity of the ultra-short Treasuries, all in a single security ETF wrapper,should permit CLTL to serve as an efficient collateral pledge for investors,particularly those whom find challenges in managing multiple short termUS Treasuries positions.
■ Virtus Investment listed one new ETF (CUMB) which is designed toprovide actively managed exposure to an investment grade portfolio ofMunicipal bonds. CUMB employs a barbell strategy which emphasizesshort-term and long-term securities; while underweighting intermediate-term securities. The fund comes with an annual expense ratio of 0.59%.
Commodity■ UBS listed two new Commodity ETNs during last month. Both notes offer
3x leveraged inverse (WTID) and direct (WTIU) exposure to Crude Oilprices tracking the Bloomberg WTI Crude Oil Subindex ER. WTID comeswith a total expense ratio of 1.85%; while, WTIU with an expense ratioof 1.45%.
■ State Street listed one new Commodity ETF (GLDW) offering longexposure to the Gold price and the US dollar. GLDW tracks the SolactiveGLD Long USD Gold Index, which is designed to provide access to thedaily performance of a long position in physical gold, along with a shortposition in a basket of non-US currencies. The fund comes with an annualexpense ratio of 0.50%.
Multi-Asset■ Blue Sky Asset Management listed three new multi-asset ETFs during
January. They are “fund of funds” designed to provide downsideprotection through cash and fixed income instruments following a tacticalallocation strategy. The first product (QXMI) offers exposure to equity and
Deutsche Bank Securities Inc. Page 23
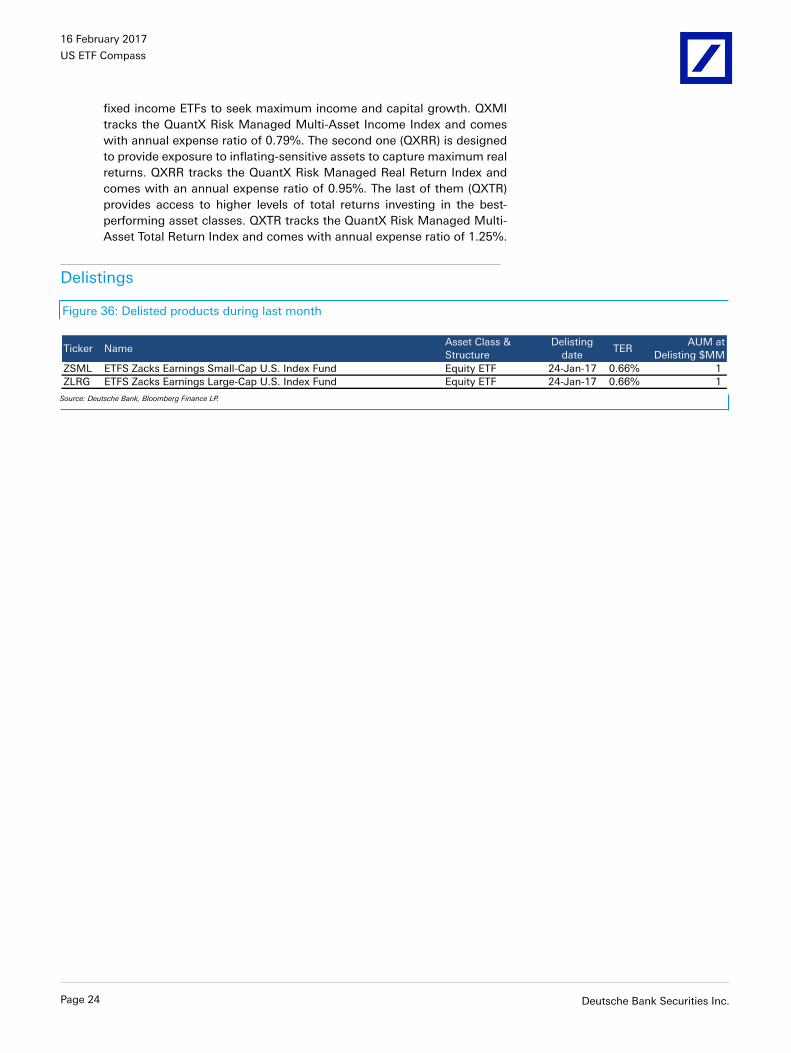
16 February 2017
US ETF Compass
fixed income ETFs to seek maximum income and capital growth. QXMItracks the QuantX Risk Managed Multi-Asset Income Index and comeswith annual expense ratio of 0.79%. The second one (QXRR) is designedto provide exposure to inflating-sensitive assets to capture maximum realreturns. QXRR tracks the QuantX Risk Managed Real Return Index andcomes with an annual expense ratio of 0.95%. The last of them (QXTR)provides access to higher levels of total returns investing in the best-performing asset classes. QXTR tracks the QuantX Risk Managed Multi-Asset Total Return Index and comes with annual expense ratio of 1.25%.
Delistings
Figure 36: Delisted products during last month
Ticker NameAsset Class &
Structure
Delisting
dateTER
AUM at
Delisting $MM
ZSML ETFS Zacks Earnings Small-Cap U.S. Index Fund Equity ETF 24-Jan-17 0.66% 1
ZLRG ETFS Zacks Earnings Large-Cap U.S. Index Fund Equity ETF 24-Jan-17 0.66% 1
Source: Deutsche Bank, Bloomberg Finance LP.
Page 24 Deutsche Bank Securities Inc.
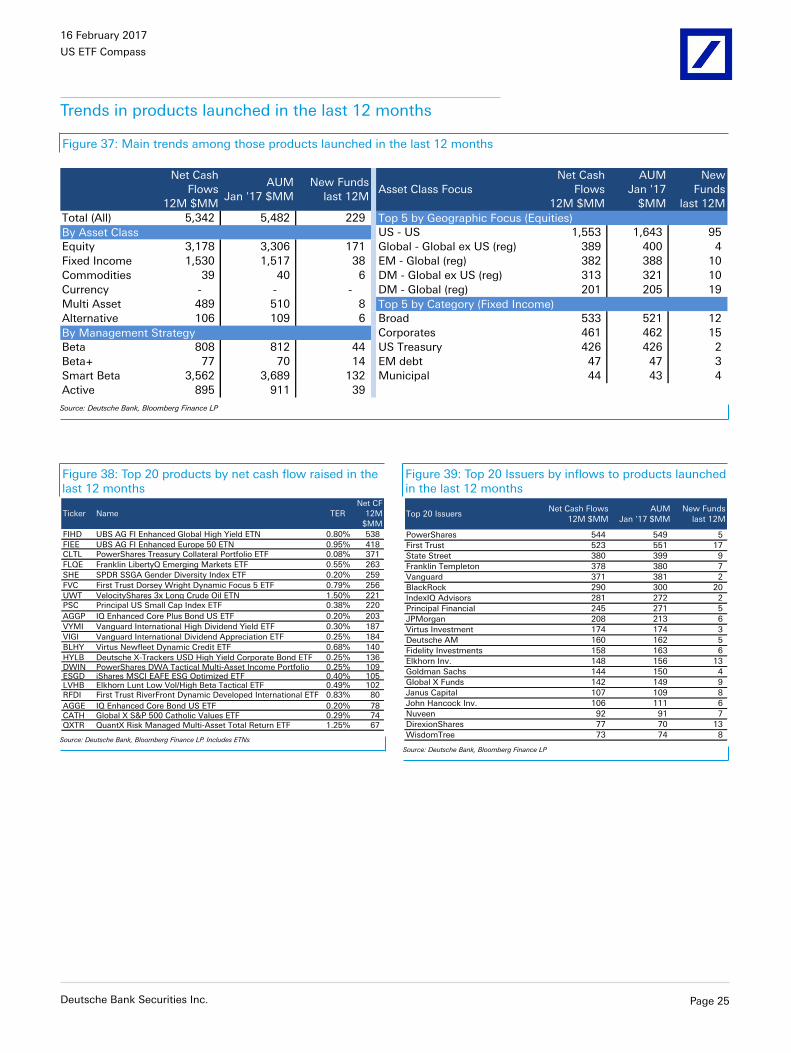
16 February 2017
US ETF Compass
Trends in products launched in the last 12 months
Figure 37: Main trends among those products launched in the last 12 months
Net Cash
Flows
12M $MM
AUM
Jan '17 $MM
New Funds
last 12MAsset Class Focus
Net Cash
Flows
12M $MM
AUM
Jan '17
$MM
New
Funds
last 12M
Total (All) 5,342 5,482 229 Top 5 by Geographic Focus (Equities)
By Asset Class US - US 1,553 1,643 95
Equity 3,178 3,306 171 Global - Global ex US (reg) 389 400 4
Fixed Income 1,530 1,517 38 EM - Global (reg) 382 388 10
Commodities 39 40 6 DM - Global ex US (reg) 313 321 10
Currency - - - DM - Global (reg) 201 205 19
Multi Asset 489 510 8 Top 5 by Category (Fixed Income)
Alternative 106 109 6 Broad 533 521 12
By Management Strategy Corporates 461 462 15
Beta 808 812 44 US Treasury 426 426 2
Beta+ 77 70 14 EM debt 47 47 3
Smart Beta 3,562 3,689 132 Municipal 44 43 4
Active 895 911 39
Source: Deutsche Bank, Bloomberg Finance LP
Figure 38: Top 20 products by net cash flow raised in thelast 12 months
Ticker Name TER
Net CF
12M
$MM
FIHD UBS AG FI Enhanced Global High Yield ETN 0.80% 538
FIEE UBS AG FI Enhanced Europe 50 ETN 0.95% 418 CLTL PowerShares Treasury Collateral Portfolio ETF 0.08% 371
FLQE Franklin LibertyQ Emerging Markets ETF 0.55% 263
SHE SPDR SSGA Gender Diversity Index ETF 0.20% 259
FVC First Trust Dorsey Wright Dynamic Focus 5 ETF 0.79% 256
UWT VelocityShares 3x Long Crude Oil ETN 1.50% 221 PSC Principal US Small Cap Index ETF 0.38% 220
AGGP IQ Enhanced Core Plus Bond US ETF 0.20% 203
VYMI Vanguard International High Dividend Yield ETF 0.30% 187
VIGI Vanguard International Dividend Appreciation ETF 0.25% 184
BLHY Virtus Newfleet Dynamic Credit ETF 0.68% 140
HYLB Deutsche X-Trackers USD High Yield Corporate Bond ETF 0.25% 136 DWIN PowerShares DWA Tactical Multi-Asset Income Portfolio 0.25% 109 ESGD iShares MSCI EAFE ESG Optimized ETF 0.40% 105 LVHB Elkhorn Lunt Low Vol/High Beta Tactical ETF 0.49% 102 RFDI First Trust RiverFront Dynamic Developed International ETF 0.83% 80
AGGE IQ Enhanced Core Bond US ETF 0.20% 78 CATH Global X S&P 500 Catholic Values ETF 0.29% 74 QXTR QuantX Risk Managed Multi-Asset Total Return ETF 1.25% 67
Source: Deutsche Bank, Bloomberg Finance LP. Includes ETNs
Figure 39: Top 20 Issuers by inflows to products launchedin the last 12 months
Top 20 IssuersNet Cash Flows
12M $MM
AUM
Jan '17 $MM
New Funds
last 12M
PowerShares 544 549 5
First Trust 523 551 17
State Street 380 399 9
Franklin Templeton 378 380 7
Vanguard 371 381 2
BlackRock 290 300 20
IndexIQ Advisors 281 272 2
Principal Financial 245 271 5
JPMorgan 208 213 6
Virtus Investment 174 174 3
Deutsche AM 160 162 5
Fidelity Investments 158 163 6
Elkhorn Inv. 148 156 13
Goldman Sachs 144 150 4
Global X Funds 142 149 9
Janus Capital 107 109 8
John Hancock Inv. 106 111 6
Nuveen 92 91 7
DirexionShares 77 70 13
WisdomTree 73 74 8
Source: Deutsche Bank, Bloomberg Finance LP
Deutsche Bank Securities Inc. Page 25
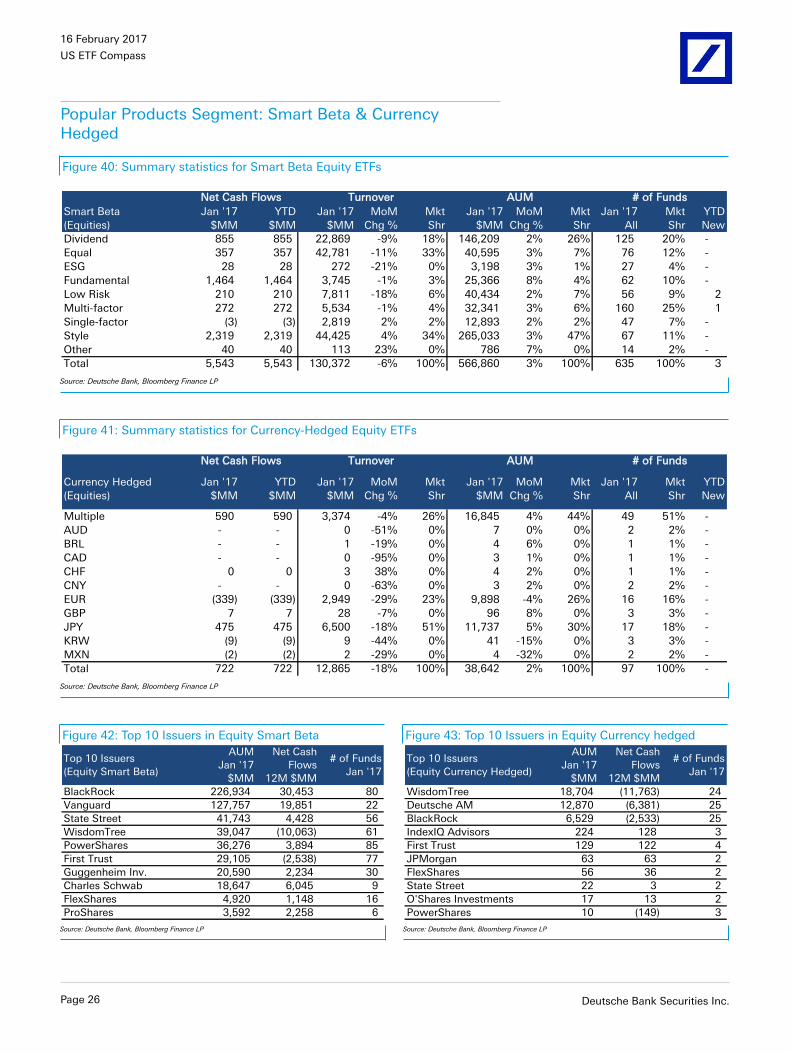
16 February 2017
US ETF Compass
Popular Products Segment: Smart Beta & CurrencyHedged
Figure 40: Summary statistics for Smart Beta Equity ETFs
Smart Beta
(Equities)
Jan '17
$MM
YTD
$MM
Jan '17
$MM
MoM
Chg %
Mkt
Shr
Jan '17
$MM
MoM
Chg %
Mkt
Shr
Jan '17
All
Mkt
Shr
YTD
New
Dividend 855 855 22,869 -9% 18% 146,209 2% 26% 125 20% -
Equal 357 357 42,781 -11% 33% 40,595 3% 7% 76 12% -
ESG 28 28 272 -21% 0% 3,198 3% 1% 27 4% -
Fundamental 1,464 1,464 3,745 -1% 3% 25,366 8% 4% 62 10% -
Low Risk 210 210 7,811 -18% 6% 40,434 2% 7% 56 9% 2
Multi-factor 272 272 5,534 -1% 4% 32,341 3% 6% 160 25% 1
Single-factor (3) (3) 2,819 2% 2% 12,893 2% 2% 47 7% -
Style 2,319 2,319 44,425 4% 34% 265,033 3% 47% 67 11% -
Other 40 40 113 23% 0% 786 7% 0% 14 2% -
Total 5,543 5,543 130,372 -6% 100% 566,860 3% 100% 635 100% 3
Net Cash Flows Turnover AUM # of Funds
Source: Deutsche Bank, Bloomberg Finance LP
Figure 41: Summary statistics for Currency-Hedged Equity ETFs
Currency Hedged
(Equities)
Jan '17
$MM
YTD
$MM
Jan '17
$MM
MoM
Chg %
Mkt
Shr
Jan '17
$MM
MoM
Chg %
Mkt
Shr
Jan '17
All
Mkt
Shr
YTD
New
Multiple 590 590 3,374 -4% 26% 16,845 4% 44% 49 51% -
AUD - - 0 -51% 0% 7 0% 0% 2 2% -
BRL - - 1 -19% 0% 4 6% 0% 1 1% -
CAD - - 0 -95% 0% 3 1% 0% 1 1% -
CHF 0 0 3 38% 0% 4 2% 0% 1 1% -
CNY - - 0 -63% 0% 3 2% 0% 2 2% -
EUR (339) (339) 2,949 -29% 23% 9,898 -4% 26% 16 16% -
GBP 7 7 28 -7% 0% 96 8% 0% 3 3% -
JPY 475 475 6,500 -18% 51% 11,737 5% 30% 17 18% -
KRW (9) (9) 9 -44% 0% 41 -15% 0% 3 3% -
MXN (2) (2) 2 -29% 0% 4 -32% 0% 2 2% -
Total 722 722 12,865 -18% 100% 38,642 2% 100% 97 100% -
Net Cash Flows Turnover AUM # of Funds
Source: Deutsche Bank, Bloomberg Finance LP
Figure 42: Top 10 Issuers in Equity Smart Beta
Top 10 Issuers
(Equity Smart Beta)
AUM
Jan '17
$MM
Net Cash
Flows
12M $MM
# of Funds
Jan '17
BlackRock 226,934 30,453 80
Vanguard 127,757 19,851 22
State Street 41,743 4,428 56
WisdomTree 39,047 (10,063) 61
PowerShares 36,276 3,894 85
First Trust 29,105 (2,538) 77
Guggenheim Inv. 20,590 2,234 30
Charles Schwab 18,647 6,045 9
FlexShares 4,920 1,148 16
ProShares 3,592 2,258 6
Source: Deutsche Bank, Bloomberg Finance LP
Figure 43: Top 10 Issuers in Equity Currency hedged
Top 10 Issuers
(Equity Currency Hedged)
AUM
Jan '17
$MM
Net Cash
Flows
12M $MM
# of Funds
Jan '17
WisdomTree 18,704 (11,763) 24
Deutsche AM 12,870 (6,381) 25
BlackRock 6,529 (2,533) 25
IndexIQ Advisors 224 128 3
First Trust 129 122 4
JPMorgan 63 63 2
FlexShares 56 36 2
State Street 22 3 2
O'Shares Investments 17 13 2
PowerShares 10 (149) 3
Source: Deutsche Bank, Bloomberg Finance LP
Page 26 Deutsche Bank Securities Inc.
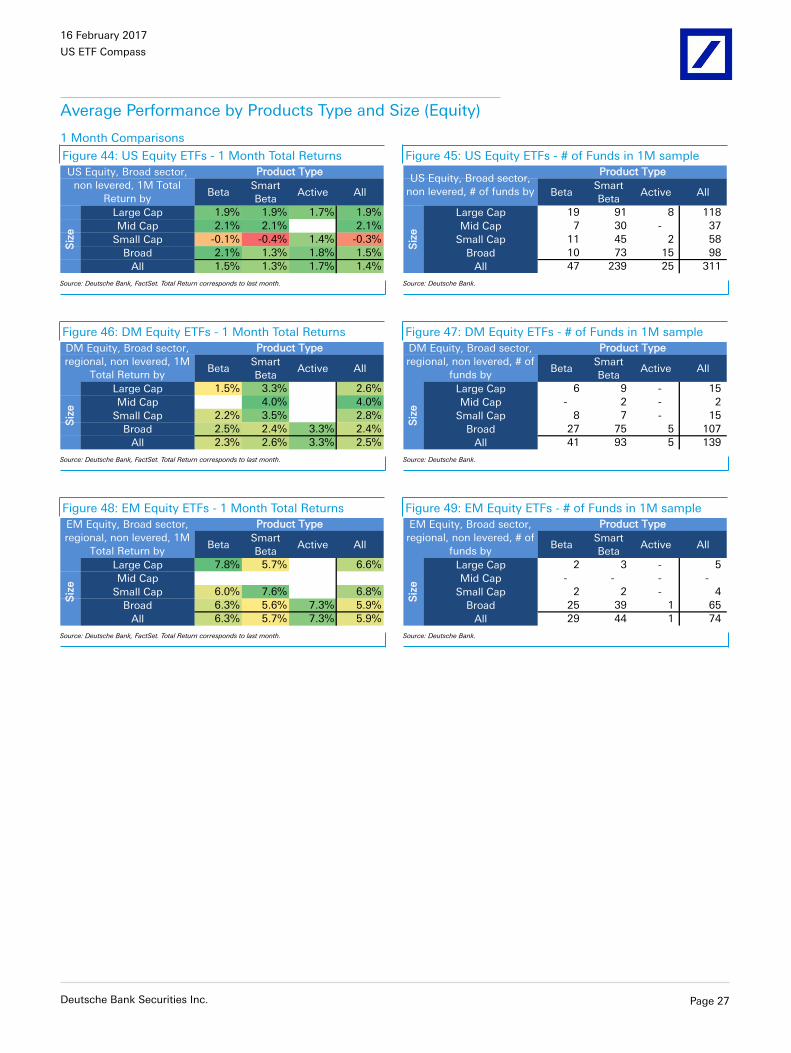
16 February 2017
US ETF Compass
Average Performance by Products Type and Size (Equity)
1 Month Comparisons
Figure 44: US Equity ETFs - 1 Month Total Returns
BetaSmart
BetaActive All
Large Cap 1.9% 1.9% 1.7% 1.9%
Mid Cap 2.1% 2.1% 2.1%
Small Cap -0.1% -0.4% 1.4% -0.3%
Broad 2.1% 1.3% 1.8% 1.5%
All 1.5% 1.3% 1.7% 1.4%
US Equity, Broad sector,
non levered, 1M Total
Return by
Product Type
Siz
e
Source: Deutsche Bank, FactSet. Total Return corresponds to last month.
Figure 45: US Equity ETFs - # of Funds in 1M sample
BetaSmart
BetaActive All
Large Cap 19 91 8 118
Mid Cap 7 30 - 37
Small Cap 11 45 2 58
Broad 10 73 15 98
All 47 239 25 311
US Equity, Broad sector,
non levered, # of funds by
Product Type
Siz
e
Source: Deutsche Bank.
Figure 46: DM Equity ETFs - 1 Month Total Returns
BetaSmart
BetaActive All
Large Cap 1.5% 3.3% 2.6%
Mid Cap 4.0% 4.0%
Small Cap 2.2% 3.5% 2.8%
Broad 2.5% 2.4% 3.3% 2.4%
All 2.3% 2.6% 3.3% 2.5%
DM Equity, Broad sector,
regional, non levered, 1M
Total Return by
Product Type
Siz
e
Source: Deutsche Bank, FactSet. Total Return corresponds to last month.
Figure 47: DM Equity ETFs - # of Funds in 1M sample
BetaSmart
BetaActive All
Large Cap 6 9 - 15
Mid Cap - 2 - 2
Small Cap 8 7 - 15
Broad 27 75 5 107
All 41 93 5 139
DM Equity, Broad sector,
regional, non levered, # of
funds by
Product Type
Siz
e
Source: Deutsche Bank.
Figure 48: EM Equity ETFs - 1 Month Total Returns
BetaSmart
BetaActive All
Large Cap 7.8% 5.7% 6.6%
Mid Cap
Small Cap 6.0% 7.6% 6.8%
Broad 6.3% 5.6% 7.3% 5.9%
All 6.3% 5.7% 7.3% 5.9%
EM Equity, Broad sector,
regional, non levered, 1M
Total Return by
Product Type
Siz
e
Source: Deutsche Bank, FactSet. Total Return corresponds to last month.
Figure 49: EM Equity ETFs - # of Funds in 1M sample
BetaSmart
BetaActive All
Large Cap 2 3 - 5
Mid Cap - - - -
Small Cap 2 2 - 4
Broad 25 39 1 65
All 29 44 1 74
EM Equity, Broad sector,
regional, non levered, # of
funds by
Product Type
Siz
e
Source: Deutsche Bank.
Deutsche Bank Securities Inc. Page 27
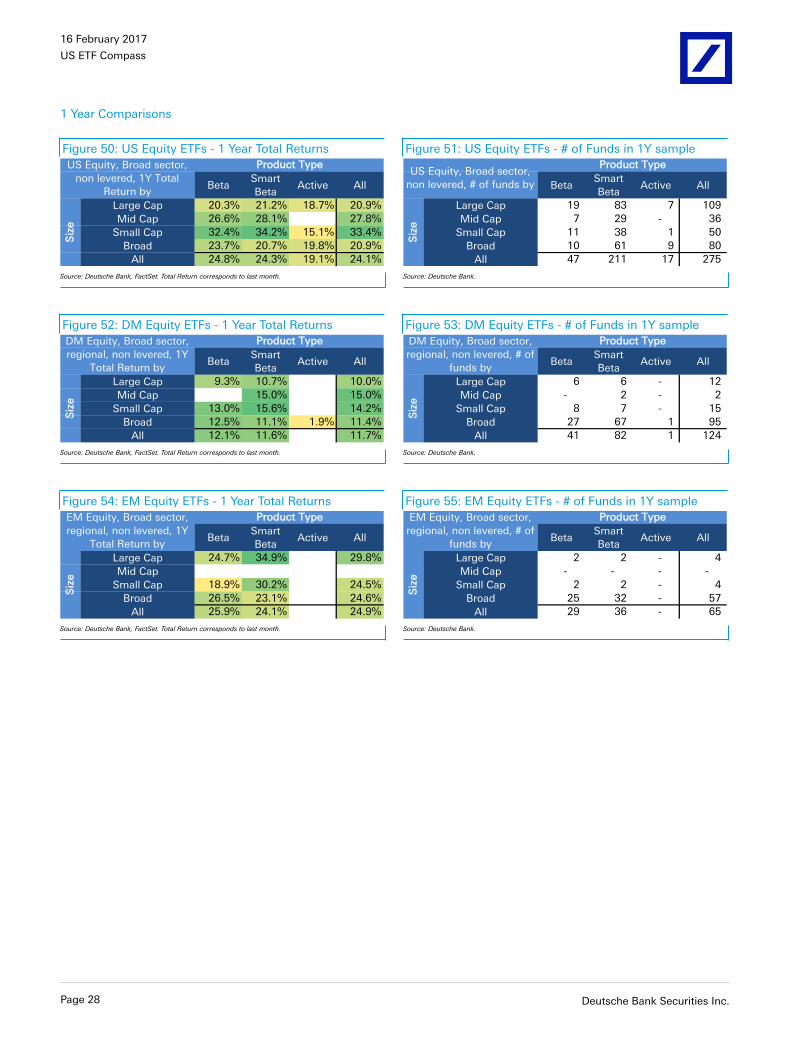
16 February 2017
US ETF Compass
1 Year Comparisons
Figure 50: US Equity ETFs - 1 Year Total Returns
BetaSmart
BetaActive All
Large Cap 20.3% 21.2% 18.7% 20.9%
Mid Cap 26.6% 28.1% 27.8%
Small Cap 32.4% 34.2% 15.1% 33.4%
Broad 23.7% 20.7% 19.8% 20.9%
All 24.8% 24.3% 19.1% 24.1%
Product Type
Siz
e
US Equity, Broad sector,
non levered, 1Y Total
Return by
Source: Deutsche Bank, FactSet. Total Return corresponds to last month.
Figure 51: US Equity ETFs - # of Funds in 1Y sample
BetaSmart
BetaActive All
Large Cap 19 83 7 109
Mid Cap 7 29 - 36
Small Cap 11 38 1 50
Broad 10 61 9 80
All 47 211 17 275
US Equity, Broad sector,
non levered, # of funds by
Product Type
Siz
e
Source: Deutsche Bank.
Figure 52: DM Equity ETFs - 1 Year Total Returns
BetaSmart
BetaActive All
Large Cap 9.3% 10.7% 10.0%
Mid Cap 15.0% 15.0%
Small Cap 13.0% 15.6% 14.2%
Broad 12.5% 11.1% 1.9% 11.4%
All 12.1% 11.6% 11.7%
DM Equity, Broad sector,
regional, non levered, 1Y
Total Return by
Product Type
Siz
e
Source: Deutsche Bank, FactSet. Total Return corresponds to last month.
Figure 53: DM Equity ETFs - # of Funds in 1Y sample
BetaSmart
BetaActive All
Large Cap 6 6 - 12
Mid Cap - 2 - 2
Small Cap 8 7 - 15
Broad 27 67 1 95
All 41 82 1 124
DM Equity, Broad sector,
regional, non levered, # of
funds by
Product Type
Siz
e
Source: Deutsche Bank.
Figure 54: EM Equity ETFs - 1 Year Total Returns
BetaSmart
BetaActive All
Large Cap 24.7% 34.9% 29.8%
Mid Cap
Small Cap 18.9% 30.2% 24.5%
Broad 26.5% 23.1% 24.6%
All 25.9% 24.1% 24.9%
EM Equity, Broad sector,
regional, non levered, 1Y
Total Return by
Product Type
Siz
e
Source: Deutsche Bank, FactSet. Total Return corresponds to last month.
Figure 55: EM Equity ETFs - # of Funds in 1Y sample
BetaSmart
BetaActive All
Large Cap 2 2 - 4
Mid Cap - - - -
Small Cap 2 2 - 4
Broad 25 32 - 57
All 29 36 - 65
EM Equity, Broad sector,
regional, non levered, # of
funds by
Product Type
Siz
e
Source: Deutsche Bank.
Page 28 Deutsche Bank Securities Inc.

16 February 2017
US ETF Compass
Total Expense Ratio X-Ray
Figure 56: Average TER analysis by asset class and product type
TER By Beta Beta+ Smart Beta Active All Beta Beta+ Smart Beta Active All
Equity 0.46% 0.91% 0.47% 0.86% 0.54% 0.19% 0.94% 0.27% 0.93% 0.22%
Fixed Income 0.26% 0.87% 0.30% 0.54% 0.37% 0.21% 0.94% 0.31% 0.52% 0.23%
Commodity 0.80% 0.94% 0.80% 0.71% 0.81% 0.41% 0.95% 0.83% 0.63% 0.47%
Currency 0.45% 0.95% 0.75% 0.48% 0.59% 0.55% 0.95% 0.75% 0.49% 0.63%
Multi Asset 0.56% 0.82% 0.86% 0.75% 0.45% 0.73% 0.82% 0.55%
Alternative 2.09% 0.95% 0.77% 1.01% 1.13% 3.39% 0.95% 0.69% 0.93% 1.21%
All 0.45% 0.91% 0.48% 0.72% 0.53% 0.20% 0.94% 0.28% 0.59% 0.23%
Simple Average AUM-Weighted Average
Source: Source: Deutsche Bank, Bloomberg Finance LP.
Figure 57: Selected TER averages for the top 15 Issuers by AUM
BetaSmart
BetaBeta Active Beta
Smart
BetaBeta Active
BlackRock 1,017,876 0.46% 0.31% 0.22% 0.32% 0.36% 0.27% 0.23% 0.22% 0.27% 0.25%
Vanguard 637,573 0.11% 0.14% 0.11% 0.12% 0.09% 0.09% 0.09% 0.09%
State Street 511,774 0.33% 0.29% 0.27% 0.52% 0.32% 0.13% 0.33% 0.30% 0.59% 0.18%
PowerShares 115,331 0.42% 0.50% 0.40% 0.30% 0.51% 0.23% 0.44% 0.53% 0.39%
Charles Schwab 62,947 0.08% 0.27% 0.07% 0.16% 0.06% 0.18% 0.06% 0.00% 0.09%
First Trust 42,793 0.61% 0.68% 0.79% 0.71% 0.60% 0.62% 0.85% 0.66%
WisdomTree 40,543 0.46% 0.48% 0.15% 0.54% 0.47% 0.43% 0.49% 0.15% 0.50%
VanEck Vectors 33,575 0.62% 0.53% 0.34% 0.69% 0.53% 0.49% 0.00% 0.53%
Guggenheim Inv. 33,032 0.62% 0.49% 0.39% 0.46% 0.55% 0.42% 0.00% 0.28% 0.40%
ProShares 26,222 0.29% 0.47% 0.51% 0.88% 0.39% 0.36% 0.66% 0.84%
ALPS 13,988 0.63% 0.62% 0.41% 0.60% 0.84% 0.46% 0.00% 0.75%
Deutsche AM 13,596 0.53% 0.43% 0.28% 0.47% 0.27% 0.00% 0.40%
PIMCO 12,574 0.27% 0.51% 0.39% 0.00% 0.00% 0.41% 0.40%
FlexShares 12,413 0.48% 0.45% 0.20% 0.30% 0.39% 0.40% 0.38%
DirexionShares 11,149 0.64% 0.84% 0.00% 0.64% 0.00% 0.00% 0.93%
AllEquity Fixed IncomeAUM Jan
'17 $MMTop 15 Issuers
Equity Fixed IncomeAll
Simple Average AUM-Weighted Average
Source: Deutsche Bank, Bloomberg Finance LP.
Deutsche Bank Securities Inc. Page 29
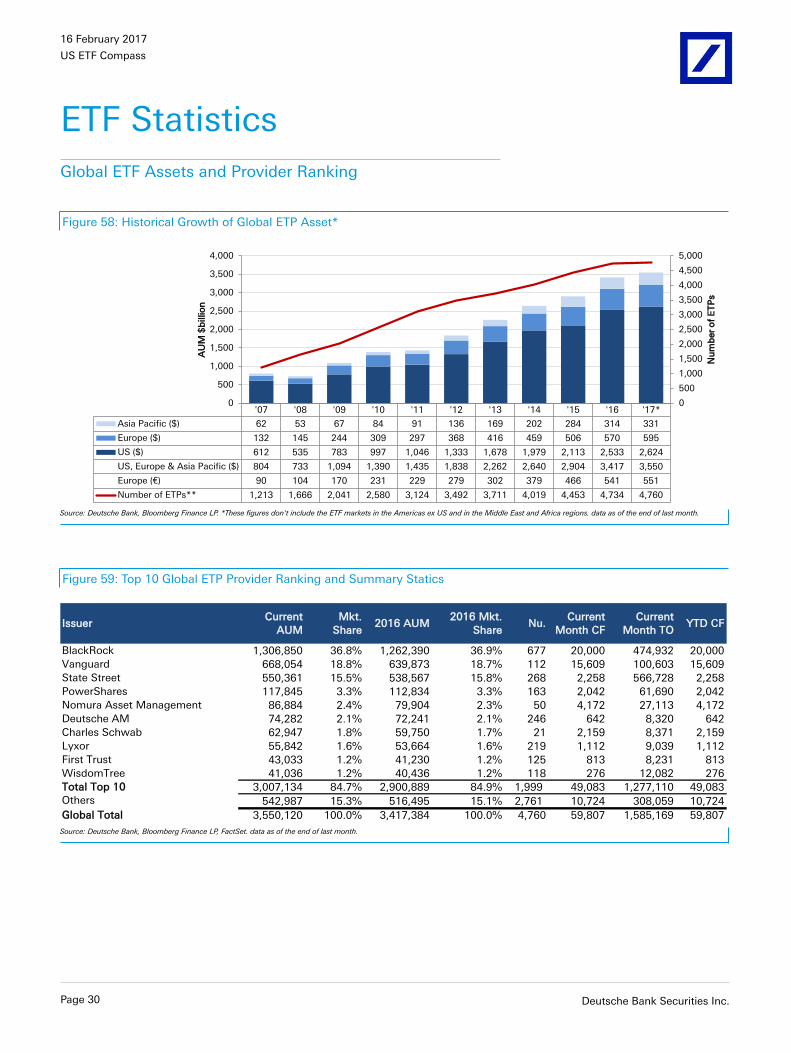
16 February 2017
US ETF Compass
ETF StatisticsGlobal ETF Assets and Provider Ranking
Figure 58: Historical Growth of Global ETP Asset*
'07 '08 '09 '10 '11 '12 '13 '14 '15 '16 '17*
Asia Pacific ($) 62 53 67 84 91 136 169 202 284 314 331
Europe ($) 132 145 244 309 297 368 416 459 506 570 595
US ($) 612 535 783 997 1,046 1,333 1,678 1,979 2,113 2,533 2,624
US, Europe & Asia Pacific ($) 804 733 1,094 1,390 1,435 1,838 2,262 2,640 2,904 3,417 3,550
Europe (€) 90 104 170 231 229 279 302 379 466 541 551
Number of ETPs** 1,213 1,666 2,041 2,580 3,124 3,492 3,711 4,019 4,453 4,734 4,760
0
500
1,000
1,500
2,000
2,500
3,000
3,500
4,000
4,500
5,000
0
500
1,000
1,500
2,000
2,500
3,000
3,500
4,000
Nu
mb
er
of
ET
Ps
AU
M $
billio
n
Source: Deutsche Bank, Bloomberg Finance LP. *These figures don't include the ETF markets in the Americas ex US and in the Middle East and Africa regions. data as of the end of last month.
Figure 59: Top 10 Global ETP Provider Ranking and Summary Statics
IssuerCurrent
AUM
Mkt.
Share2016 AUM
2016 Mkt.
Share
Current
Month CF
Current
Month TOYTD CF
BlackRock 1,306,850 36.8% 1,262,390 36.9% 677 20,000 474,932 20,000
Vanguard 668,054 18.8% 639,873 18.7% 112 15,609 100,603 15,609
State Street 550,361 15.5% 538,567 15.8% 268 2,258 566,728 2,258
PowerShares 117,845 3.3% 112,834 3.3% 163 2,042 61,690 2,042
Nomura Asset Management 86,884 2.4% 79,904 2.3% 50 4,172 27,113 4,172
Deutsche AM 74,282 2.1% 72,241 2.1% 246 642 8,320 642
Charles Schwab 62,947 1.8% 59,750 1.7% 21 2,159 8,371 2,159
Lyxor 55,842 1.6% 53,664 1.6% 219 1,112 9,039 1,112
First Trust 43,033 1.2% 41,230 1.2% 125 813 8,231 813
WisdomTree 41,036 1.2% 40,436 1.2% 118 276 12,082 276
Total Top 10 3,007,134 84.7% 2,900,889 84.9% 1,999 49,083 1,277,110 49,083
Others 542,987 15.3% 516,495 15.1% 2,761 10,724 308,059 10,724
Global Total 3,550,120 100.0% 3,417,384 100.0% 4,760 59,807 1,585,169 59,807
Source: Deutsche Bank, Bloomberg Finance LP, FactSet. data as of the end of last month.
Page 30 Deutsche Bank Securities Inc.

16 February 2017
US ETF Compass
US Historical ETF Trends
Figure 60: Annual ETP historical growth in AUM and # offunds
-
200
400
600
800
1,000
1,200
1,400
1,600
1,800
2,000
-
200
400
600
800
1,000
1,200
1,400
1,600
1,800
2,000
2,200
2,400
2,600
2,800
2007 2008 2009 2010 2011 2012 2013 2014 2015 2016 2017*
Nu
mb
er
of
ET
Ps
AU
M $
billio
n
Others
Fixed Income
Equity
# Funds
Source: Deutsche Bank, Bloomberg Finance LP. ETPs include ETFs and ETVs; ETVs represent about 2%of ETP assets and track mostly non-Equity and non-Fixed Income exposures. *YTD data as of the endof last month.
Figure 61: Monthly ETF Volume $ growth vs. VIX and ETFVolume
0%
10%
20%
30%
40%
50%
60%
70%
-
500
1,000
1,500
2,000
2,500
3,000
3,500
Jan
-05
Au
g-0
5
Mar-
06
Oct-
06
May-0
7
Dec-0
7
Ju
l-0
8
Feb
-09
Sep
-09
Ap
r-1
0
No
v-1
0
Ju
n-1
1
Jan
-12
Au
g-1
2
Mar-
13
Oct-
13
May-1
4
Dec-1
4
Ju
l-1
5
Feb
-16
Sep
-16
ET
F t
rad
ing
as %
of
all U
S C
ash
E
qu
ity t
rad
ing
an
d V
IX L
evel (
en
d o
f m
on
th)
Mo
nth
ly E
TF T
urn
over
$b
illio
n ETF Turnover ETF % Cash Eqty VIX
Source: Deutsche Bank, Bloomberg Finance LP. ETF Turnover excludes ETVs and ETNs. Data as of theend of last month.
Figure 62: Net Cash Flows and AUM historicalcomparison between Mutual Funds and ETFs*
0%
2%
4%
6%
8%
10%
12%
14%
16%
18%
20%
-300,000
-200,000
-100,000
0
100,000
200,000
300,000
400,000
500,000
ET
F A
UM
as %
of
Mu
tual Fu
nd
AU
M
Net
Cash
Flo
ws $
millio
n
MF CF ETF CF ETF/MF % AUM
Source: Deutsche Bank, ICI, Bloomberg Finance LP. *Data as of the end of December 2016. Mutual Fundsonly include Long Term Mutual Funds.
Figure 63: Net Cash Flows and AUM historicalcomparison between Active and Passive mgmt style*
0%
5%
10%
15%
20%
25%
30%
35%
40%
45%
50%
-500,000
-400,000
-300,000
-200,000
-100,000
0
100,000
200,000
300,000
400,000
500,000
600,000
Passiv
e A
UM
as %
of
Acti
ve A
UM
Net
Cash
Flo
ws $
millio
n
Active MF+ETF Passive MF+ETF
Passive / Active %
Source: Deutsche Bank, ICI, Bloomberg Finance LP. *Data as of the end of December 2016. Mutual Fundsonly include Long Term Mutual Funds.
Deutsche Bank Securities Inc. Page 31

16 February 2017
US ETF Compass
ETF Issuer and Index Provider league tables
Figure 64: ETP Issuer league table (excludes ETN assets)
Top 50 Issuers TotalMkt
Shr EquityFixed
IncomeCmdty Other
Jan '17
$MM
YTD
$MMJan '17
$MM
Mkt
Shr Jan '17YTD
New
BlackRock 1,017,876 38.8% 765,402 234,983 14,863 2,628 15,813 15,813 442,466 31.6% 335 0
Vanguard 637,573 24.3% 523,801 113,772 - - 14,601 14,601 97,318 6.9% 70 0
State Street 511,774 19.5% 436,580 43,639 31,162 393 1,396 1,396 560,882 40.0% 150 1
PowerShares 115,331 4.4% 83,872 24,350 5,186 1,923 2,036 2,036 61,463 4.4% 144 1
Charles Schwab 62,947 2.4% 55,577 7,370 - - 2,159 2,159 8,371 0.6% 21 0
First Trust 42,793 1.6% 36,448 4,825 147 1,373 800 800 8,206 0.6% 114 0
WisdomTree 40,543 1.5% 39,158 532 225 628 202 202 11,975 0.9% 94 0
VanEck Vectors 33,575 1.3% 25,144 8,161 123 146 1,376 1,376 65,083 4.6% 59 0
Guggenheim Inv. 33,032 1.3% 22,815 8,567 - 1,650 973 973 7,605 0.5% 78 0
ProShares 26,222 1.0% 18,653 3,760 1,605 2,203 152 152 53,838 3.8% 142 0
ALPS 13,988 0.5% 13,607 350 - 31 487 487 2,904 0.2% 24 1
Deutsche AM 13,596 0.5% 13,369 228 - - 327 327 3,089 0.2% 40 0
PIMCO 12,574 0.5% - 12,574 - - (100) (100) 2,551 0.2% 14 0
FlexShares 12,413 0.5% 9,551 2,863 - - 393 393 1,326 0.1% 25 0
DirexionShares 11,149 0.4% 10,585 563 - - (219) (219) 60,485 4.3% 82 2
Fidelity Investments 5,451 0.2% 5,013 438 - - 187 187 1,505 0.1% 21 0
Global X Funds 4,281 0.2% 4,026 223 - 32 295 295 1,154 0.1% 55 0
US Commodity Funds 4,262 0.2% 6 - 4,256 - (179) (179) 7,123 0.5% 13 0
Goldman Sachs 2,931 0.1% 2,876 55 - - 124 124 362 0.0% 7 0
ETC 2,363 0.1% 1,627 494 - 242 85 85 239 0.0% 20 0
ETF Securities 2,322 0.1% - - 2,322 - 16 16 349 0.0% 5 0
IndexIQ Advisors 2,205 0.1% 537 272 - 1,395 (39) (39) 251 0.0% 19 0
OppenheimerFunds 1,750 0.1% 1,750 - - - 150 150 348 0.0% 10 0
JPMorgan 1,229 0.0% 1,150 25 - 54 81 81 234 0.0% 11 0
AdvisorShares Trust 1,072 0.0% 420 585 33 34 (6) (6) 143 0.0% 22 0
Millington Securities 1,041 0.0% 558 - - 484 (4) (4) 60 0.0% 12 0
ETFMG 1,039 0.0% 1,027 12 - - 81 81 394 0.0% 14 0
Compass EMP 1,017 0.0% 1,017 - - - 101 101 188 0.0% 11 0
Columbia Mgmt 963 0.0% 950 13 - - (0) (0) 192 0.0% 14 0
Pacer Advisors 780 0.0% 780 - - - 29 29 108 0.0% 7 0
Virtus Investment 746 0.0% 363 363 - 20 147 147 302 0.0% 10 1
John Hancock Inv. 680 0.0% 680 - - - 11 11 39 0.0% 12 0
Principal Financial 552 0.0% 271 - - 281 2 2 3 0.0% 6 0
Franklin Templeton 550 0.0% 327 223 - - 10 10 11 0.0% 8 1
Highland Capital 494 0.0% - 494 - - 17 17 88 0.0% 1 0
O'Shares Investments 430 0.0% 430 - - - 13 13 74 0.0% 6 0
Cambria Funds 347 0.0% 266 8 - 73 11 11 52 0.0% 8 0
KraneShares 267 0.0% 257 10 - - 0 0 98 0.0% 5 0
Empowered Funds 163 0.0% 163 - - - 25 25 32 0.0% 4 0
Elkhorn Inv. 161 0.0% 129 13 19 - 26 26 49 0.0% 15 0
Teucrium Trading 158 0.0% - - 158 - (1) (1) 66 0.0% 5 0
Legg Mason 140 0.0% 140 - - - 10 10 21 0.0% 6 0
Blue Sky Asset Management 130 0.0% 45 - - 85 131 131 142 0.0% 5 5
ArrowShares 114 0.0% 5 - - 109 1 1 24 0.0% 3 0
Hartford Funds 112 0.0% 112 - - - 5 5 8 0.0% 5 0
Janus Capital 109 0.0% 74 35 - - 31 31 10 0.0% 8 0
Nuveen 91 0.0% 43 49 - - 4 4 7 0.0% 7 0
Recon Capital 84 0.0% 84 - - - 3 3 14 0.0% 4 0
ARK Inv. Mgmt 78 0.0% 78 - - - 7 7 16 0.0% 5 0
U.S. Global Investors 64 0.0% 64 - - - (1) (1) 24 0.0% 1 0Other 438 0.0% 407 - - 32 52 52 99 0.0% 34 3
Total 2,623,996 100% 2,080,232 469,847 60,101 13,816 41,822 41,822 1,401,391 100% 1,791 15
Assets Under Management Jan '17 $MM Net Cash Flows Turnover # of Funds
Source: Deutsche Bank, Bloomberg Finance LP, FactSet. Data as of the end of last month.
Page 32 Deutsche Bank Securities Inc.
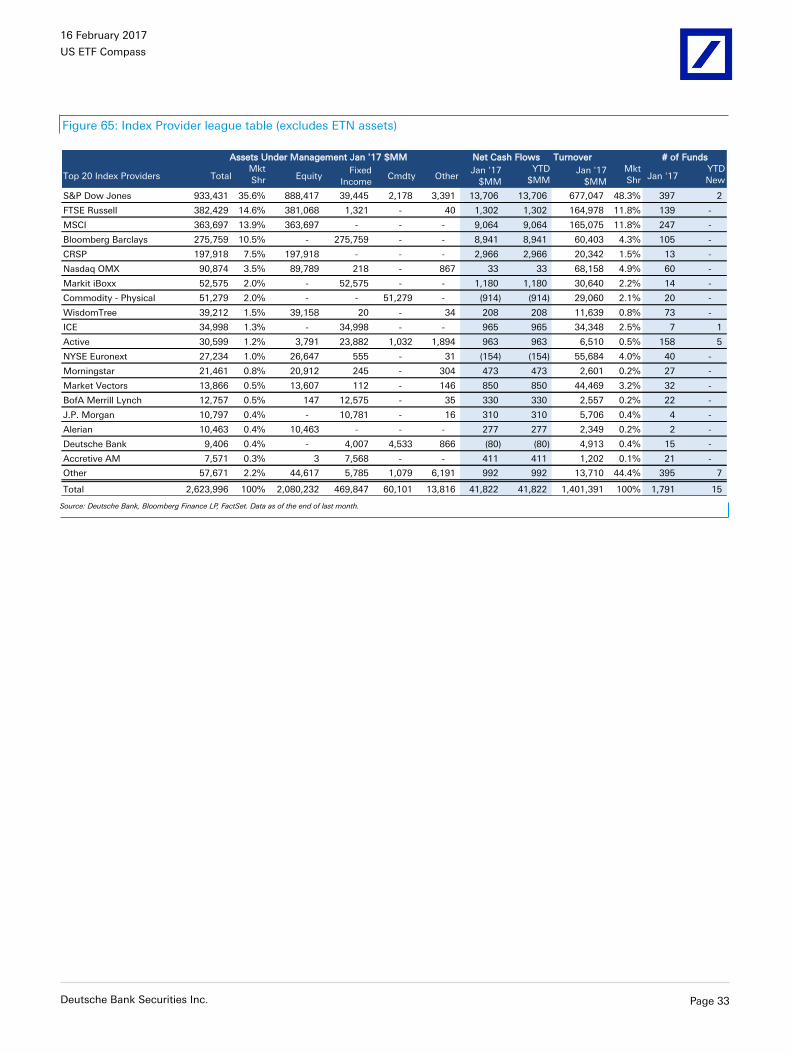
16 February 2017
US ETF Compass
Figure 65: Index Provider league table (excludes ETN assets)
Turnover
Top 20 Index Providers TotalMkt
Shr EquityFixed
IncomeCmdty Other
Jan '17
$MM
YTD
$MMJan '17
$MM
Mkt
Shr Jan '17YTD
New
S&P Dow Jones 933,431 35.6% 888,417 39,445 2,178 3,391 13,706 13,706 677,047 48.3% 397 2
FTSE Russell 382,429 14.6% 381,068 1,321 - 40 1,302 1,302 164,978 11.8% 139 -
MSCI 363,697 13.9% 363,697 - - - 9,064 9,064 165,075 11.8% 247 -
Bloomberg Barclays 275,759 10.5% - 275,759 - - 8,941 8,941 60,403 4.3% 105 -
CRSP 197,918 7.5% 197,918 - - - 2,966 2,966 20,342 1.5% 13 -
Nasdaq OMX 90,874 3.5% 89,789 218 - 867 33 33 68,158 4.9% 60 -
Markit iBoxx 52,575 2.0% - 52,575 - - 1,180 1,180 30,640 2.2% 14 -
Commodity - Physical 51,279 2.0% - - 51,279 - (914) (914) 29,060 2.1% 20 -
WisdomTree 39,212 1.5% 39,158 20 - 34 208 208 11,639 0.8% 73 -
ICE 34,998 1.3% - 34,998 - - 965 965 34,348 2.5% 7 1
Active 30,599 1.2% 3,791 23,882 1,032 1,894 963 963 6,510 0.5% 158 5
NYSE Euronext 27,234 1.0% 26,647 555 - 31 (154) (154) 55,684 4.0% 40 -
Morningstar 21,461 0.8% 20,912 245 - 304 473 473 2,601 0.2% 27 -
Market Vectors 13,866 0.5% 13,607 112 - 146 850 850 44,469 3.2% 32 -
BofA Merrill Lynch 12,757 0.5% 147 12,575 - 35 330 330 2,557 0.2% 22 -
J.P. Morgan 10,797 0.4% - 10,781 - 16 310 310 5,706 0.4% 4 -
Alerian 10,463 0.4% 10,463 - - - 277 277 2,349 0.2% 2 -
Deutsche Bank 9,406 0.4% - 4,007 4,533 866 (80) (80) 4,913 0.4% 15 -
Accretive AM 7,571 0.3% 3 7,568 - - 411 411 1,202 0.1% 21 -
Other 57,671 2.2% 44,617 5,785 1,079 6,191 992 992 13,710 44.4% 395 7
Total 2,623,996 100% 2,080,232 469,847 60,101 13,816 41,822 41,822 1,401,391 100% 1,791 15
Assets Under Management Jan '17 $MM Net Cash Flows # of Funds
Source: Deutsche Bank, Bloomberg Finance LP, FactSet. Data as of the end of last month.
Deutsche Bank Securities Inc. Page 33
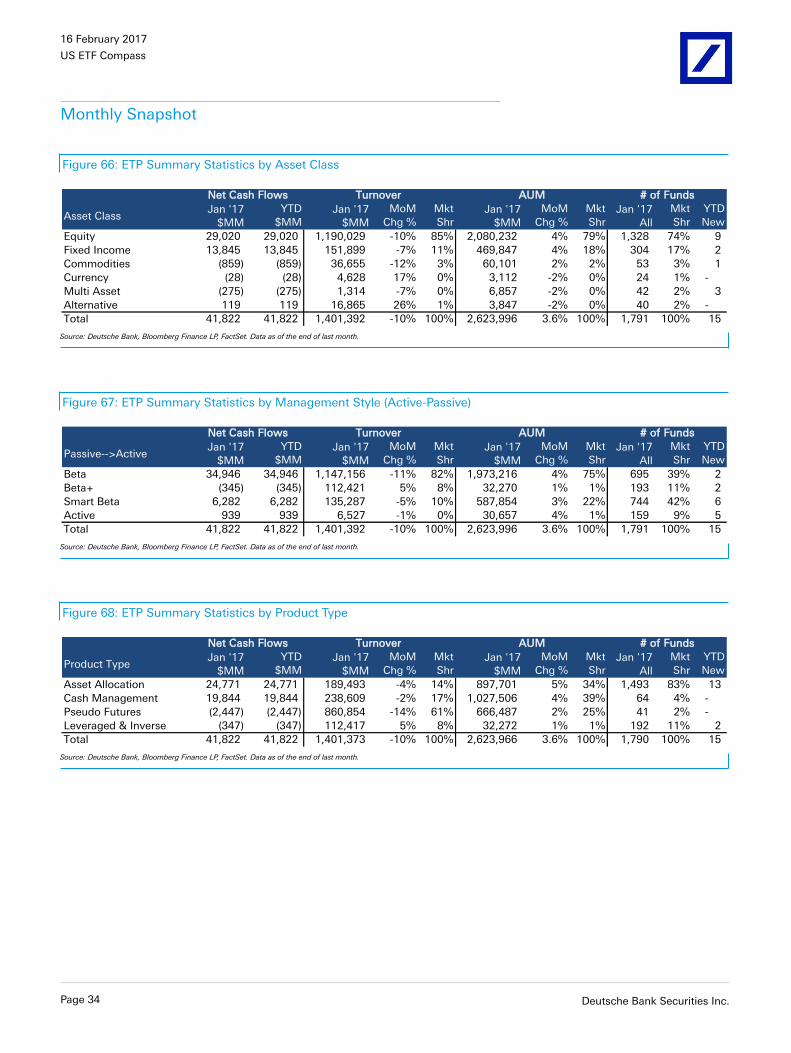
16 February 2017
US ETF Compass
Monthly Snapshot
Figure 66: ETP Summary Statistics by Asset Class
Asset ClassJan '17
$MM
YTD
$MMJan '17
$MM
MoM
Chg %
Mkt
ShrJan '17
$MM
MoM
Chg %
Mkt
ShrJan '17
All
Mkt
Shr
YTD
New
Equity 29,020 29,020 1,190,029 -10% 85% 2,080,232 4% 79% 1,328 74% 9
Fixed Income 13,845 13,845 151,899 -7% 11% 469,847 4% 18% 304 17% 2
Commodities (859) (859) 36,655 -12% 3% 60,101 2% 2% 53 3% 1
Currency (28) (28) 4,628 17% 0% 3,112 -2% 0% 24 1% -
Multi Asset (275) (275) 1,314 -7% 0% 6,857 -2% 0% 42 2% 3
Alternative 119 119 16,865 26% 1% 3,847 -2% 0% 40 2% -
Total 41,822 41,822 1,401,392 -10% 100% 2,623,996 3.6% 100% 1,791 100% 15
# of FundsAUMTurnover Net Cash Flows
Source: Deutsche Bank, Bloomberg Finance LP, FactSet. Data as of the end of last month.
Figure 67: ETP Summary Statistics by Management Style (Active-Passive)
Passive-->ActiveJan '17
$MM
YTD
$MMJan '17
$MM
MoM
Chg %
Mkt
ShrJan '17
$MM
MoM
Chg %
Mkt
ShrJan '17
All
Mkt
Shr
YTD
New
Beta 34,946 34,946 1,147,156 -11% 82% 1,973,216 4% 75% 695 39% 2
Beta+ (345) (345) 112,421 5% 8% 32,270 1% 1% 193 11% 2
Smart Beta 6,282 6,282 135,287 -5% 10% 587,854 3% 22% 744 42% 6
Active 939 939 6,527 -1% 0% 30,657 4% 1% 159 9% 5
Total 41,822 41,822 1,401,392 -10% 100% 2,623,996 3.6% 100% 1,791 100% 15
# of FundsTurnover AUMNet Cash Flows
Source: Deutsche Bank, Bloomberg Finance LP, FactSet. Data as of the end of last month.
Figure 68: ETP Summary Statistics by Product Type
Product TypeJan '17
$MM
YTD
$MMJan '17
$MM
MoM
Chg %
Mkt
ShrJan '17
$MM
MoM
Chg %
Mkt
ShrJan '17
All
Mkt
Shr
YTD
New
Asset Allocation 24,771 24,771 189,493 -4% 14% 897,701 5% 34% 1,493 83% 13
Cash Management 19,844 19,844 238,609 -2% 17% 1,027,506 4% 39% 64 4% -
Pseudo Futures (2,447) (2,447) 860,854 -14% 61% 666,487 2% 25% 41 2% -
Leveraged & Inverse (347) (347) 112,417 5% 8% 32,272 1% 1% 192 11% 2
Total 41,822 41,822 1,401,373 -10% 100% 2,623,966 3.6% 100% 1,790 100% 15
# of FundsTurnover AUMNet Cash Flows
Source: Deutsche Bank, Bloomberg Finance LP, FactSet. Data as of the end of last month.
Page 34 Deutsche Bank Securities Inc.
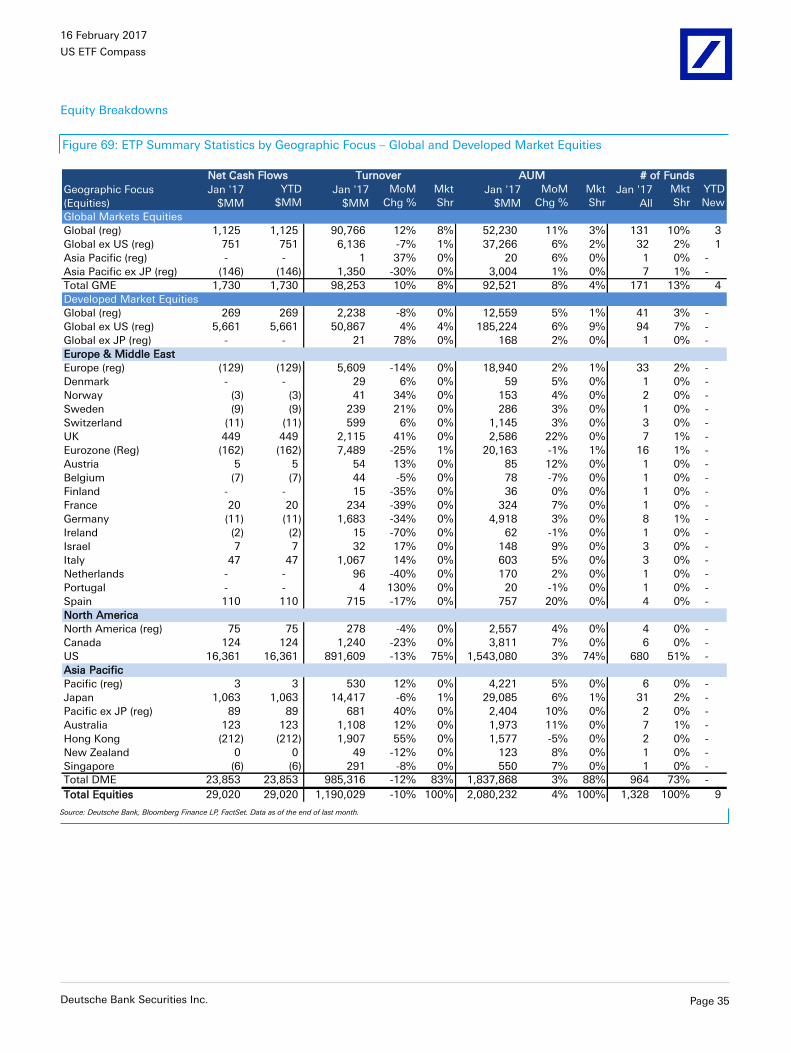
16 February 2017
US ETF Compass
Equity Breakdowns
Figure 69: ETP Summary Statistics by Geographic Focus – Global and Developed Market Equities
Geographic Focus
(Equities)
Jan '17
$MM
YTD
$MMJan '17
$MM
MoM
Chg %
Mkt
ShrJan '17
$MM
MoM
Chg %
Mkt
ShrJan '17
All
Mkt
Shr
YTD
New
Global Markets Equities
Global (reg) 1,125 1,125 90,766 12% 8% 52,230 11% 3% 131 10% 3
Global ex US (reg) 751 751 6,136 -7% 1% 37,266 6% 2% 32 2% 1
Asia Pacific (reg) - - 1 37% 0% 20 6% 0% 1 0% -
Asia Pacific ex JP (reg) (146) (146) 1,350 -30% 0% 3,004 1% 0% 7 1% -
Total GME 1,730 1,730 98,253 10% 8% 92,521 8% 4% 171 13% 4
Developed Market Equities
Global (reg) 269 269 2,238 -8% 0% 12,559 5% 1% 41 3% -
Global ex US (reg) 5,661 5,661 50,867 4% 4% 185,224 6% 9% 94 7% -
Global ex JP (reg) - - 21 78% 0% 168 2% 0% 1 0% -
Europe & Middle East
Europe (reg) (129) (129) 5,609 -14% 0% 18,940 2% 1% 33 2% -
Denmark - - 29 6% 0% 59 5% 0% 1 0% -
Norway (3) (3) 41 34% 0% 153 4% 0% 2 0% -
Sweden (9) (9) 239 21% 0% 286 3% 0% 1 0% -
Switzerland (11) (11) 599 6% 0% 1,145 3% 0% 3 0% -
UK 449 449 2,115 41% 0% 2,586 22% 0% 7 1% -
Eurozone (Reg) (162) (162) 7,489 -25% 1% 20,163 -1% 1% 16 1% -
Austria 5 5 54 13% 0% 85 12% 0% 1 0% -
Belgium (7) (7) 44 -5% 0% 78 -7% 0% 1 0% -
Finland - - 15 -35% 0% 36 0% 0% 1 0% -
France 20 20 234 -39% 0% 324 7% 0% 1 0% -
Germany (11) (11) 1,683 -34% 0% 4,918 3% 0% 8 1% -
Ireland (2) (2) 15 -70% 0% 62 -1% 0% 1 0% -
Israel 7 7 32 17% 0% 148 9% 0% 3 0% -
Italy 47 47 1,067 14% 0% 603 5% 0% 3 0% -
Netherlands - - 96 -40% 0% 170 2% 0% 1 0% -
Portugal - - 4 130% 0% 20 -1% 0% 1 0% -
Spain 110 110 715 -17% 0% 757 20% 0% 4 0% -
North America
North America (reg) 75 75 278 -4% 0% 2,557 4% 0% 4 0% -
Canada 124 124 1,240 -23% 0% 3,811 7% 0% 6 0% -
US 16,361 16,361 891,609 -13% 75% 1,543,080 3% 74% 680 51% -
Asia Pacific
Pacific (reg) 3 3 530 12% 0% 4,221 5% 0% 6 0% -
Japan 1,063 1,063 14,417 -6% 1% 29,085 6% 1% 31 2% -
Pacific ex JP (reg) 89 89 681 40% 0% 2,404 10% 0% 2 0% -
Australia 123 123 1,108 12% 0% 1,973 11% 0% 7 1% -
Hong Kong (212) (212) 1,907 55% 0% 1,577 -5% 0% 2 0% -
New Zealand 0 0 49 -12% 0% 123 8% 0% 1 0% -
Singapore (6) (6) 291 -8% 0% 550 7% 0% 1 0% -
Total DME 23,853 23,853 985,316 -12% 83% 1,837,868 3% 88% 964 73% -
Total Equities 29,020 29,020 1,190,029 -10% 100% 2,080,232 4% 100% 1,328 100% 9
# of FundsNet Cash Flows Turnover AUM
Source: Deutsche Bank, Bloomberg Finance LP, FactSet. Data as of the end of last month.
Deutsche Bank Securities Inc. Page 35
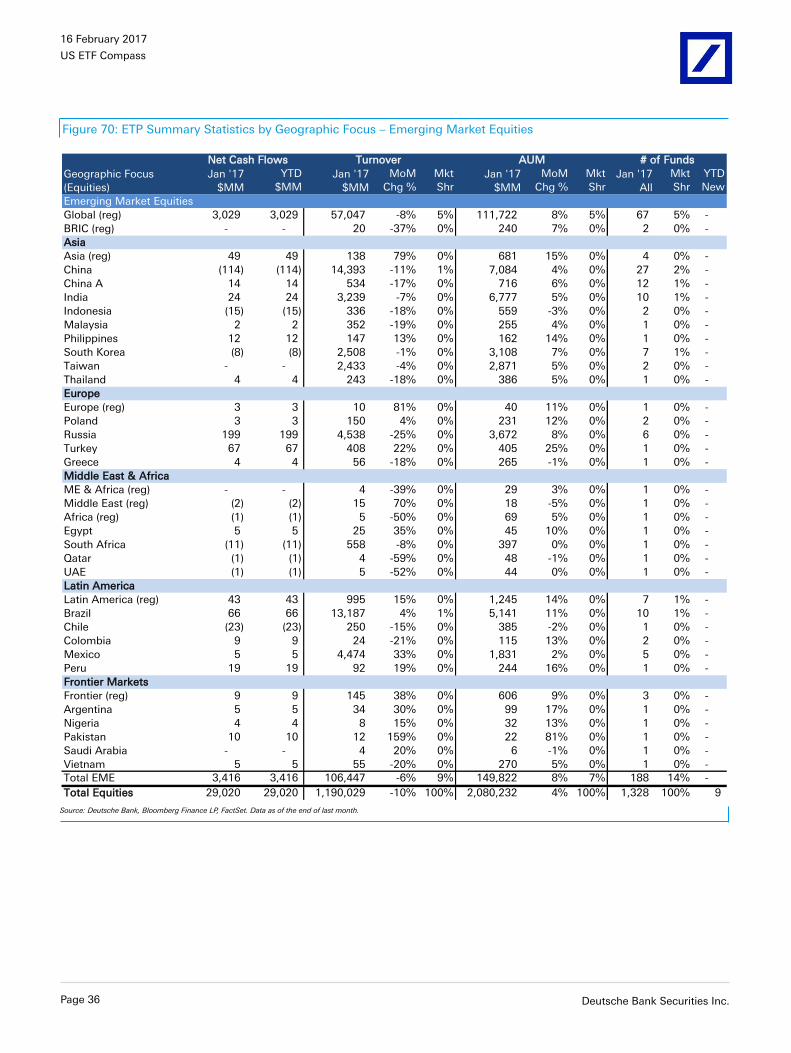
16 February 2017
US ETF Compass
Figure 70: ETP Summary Statistics by Geographic Focus – Emerging Market Equities
Geographic Focus
(Equities)
Jan '17
$MM
YTD
$MMJan '17
$MM
MoM
Chg %
Mkt
ShrJan '17
$MM
MoM
Chg %
Mkt
ShrJan '17
All
Mkt
Shr
YTD
New
Emerging Market Equities
Global (reg) 3,029 3,029 57,047 -8% 5% 111,722 8% 5% 67 5% -
BRIC (reg) - - 20 -37% 0% 240 7% 0% 2 0% -
Asia
Asia (reg) 49 49 138 79% 0% 681 15% 0% 4 0% -
China (114) (114) 14,393 -11% 1% 7,084 4% 0% 27 2% -
China A 14 14 534 -17% 0% 716 6% 0% 12 1% -
India 24 24 3,239 -7% 0% 6,777 5% 0% 10 1% -
Indonesia (15) (15) 336 -18% 0% 559 -3% 0% 2 0% -
Malaysia 2 2 352 -19% 0% 255 4% 0% 1 0% -
Philippines 12 12 147 13% 0% 162 14% 0% 1 0% -
South Korea (8) (8) 2,508 -1% 0% 3,108 7% 0% 7 1% -
Taiwan - - 2,433 -4% 0% 2,871 5% 0% 2 0% -
Thailand 4 4 243 -18% 0% 386 5% 0% 1 0% -
Europe
Europe (reg) 3 3 10 81% 0% 40 11% 0% 1 0% -
Poland 3 3 150 4% 0% 231 12% 0% 2 0% -
Russia 199 199 4,538 -25% 0% 3,672 8% 0% 6 0% -
Turkey 67 67 408 22% 0% 405 25% 0% 1 0% -
Greece 4 4 56 -18% 0% 265 -1% 0% 1 0% -
Middle East & Africa
ME & Africa (reg) - - 4 -39% 0% 29 3% 0% 1 0% -
Middle East (reg) (2) (2) 15 70% 0% 18 -5% 0% 1 0% -
Africa (reg) (1) (1) 5 -50% 0% 69 5% 0% 1 0% -
Egypt 5 5 25 35% 0% 45 10% 0% 1 0% -
South Africa (11) (11) 558 -8% 0% 397 0% 0% 1 0% -
Qatar (1) (1) 4 -59% 0% 48 -1% 0% 1 0% -
UAE (1) (1) 5 -52% 0% 44 0% 0% 1 0% -
Latin America
Latin America (reg) 43 43 995 15% 0% 1,245 14% 0% 7 1% -
Brazil 66 66 13,187 4% 1% 5,141 11% 0% 10 1% -
Chile (23) (23) 250 -15% 0% 385 -2% 0% 1 0% -
Colombia 9 9 24 -21% 0% 115 13% 0% 2 0% -
Mexico 5 5 4,474 33% 0% 1,831 2% 0% 5 0% -
Peru 19 19 92 19% 0% 244 16% 0% 1 0% -
Frontier Markets
Frontier (reg) 9 9 145 38% 0% 606 9% 0% 3 0% -
Argentina 5 5 34 30% 0% 99 17% 0% 1 0% -
Nigeria 4 4 8 15% 0% 32 13% 0% 1 0% -
Pakistan 10 10 12 159% 0% 22 81% 0% 1 0% -
Saudi Arabia - - 4 20% 0% 6 -1% 0% 1 0% -
Vietnam 5 5 55 -20% 0% 270 5% 0% 1 0% -
Total EME 3,416 3,416 106,447 -6% 9% 149,822 8% 7% 188 14% -
Total Equities 29,020 29,020 1,190,029 -10% 100% 2,080,232 4% 100% 1,328 100% 9
# of FundsNet Cash Flows Turnover AUM
Source: Deutsche Bank, Bloomberg Finance LP, FactSet. Data as of the end of last month.
Page 36 Deutsche Bank Securities Inc.
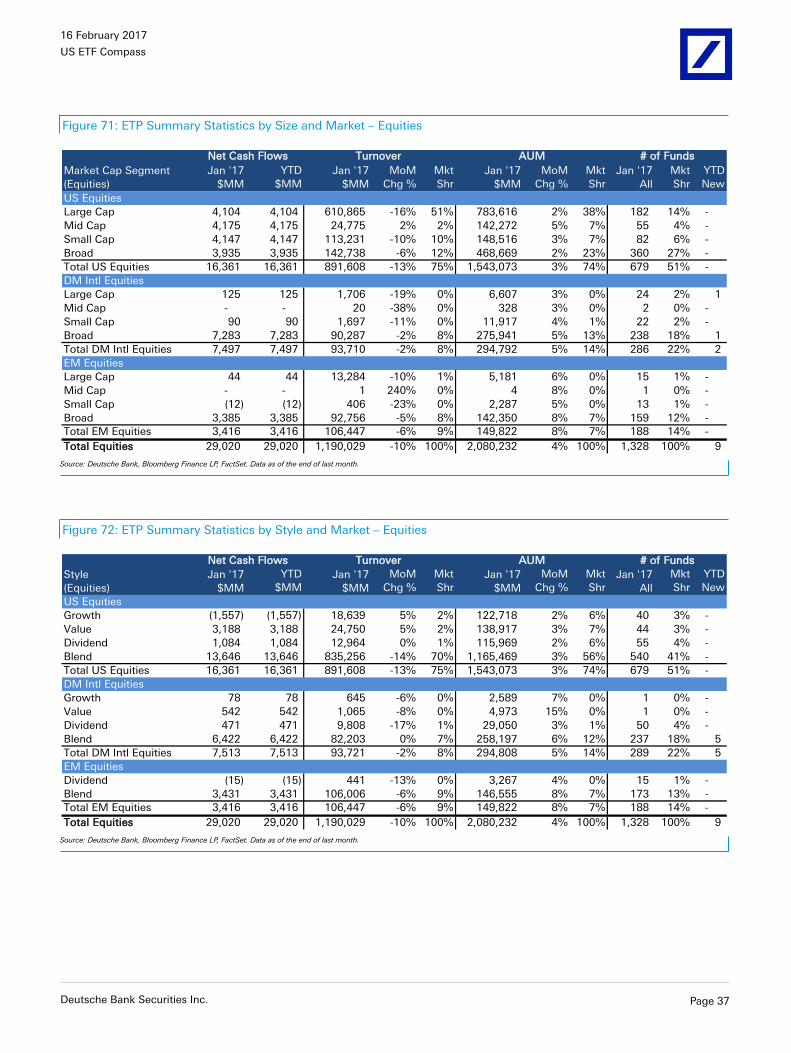
16 February 2017
US ETF Compass
Figure 71: ETP Summary Statistics by Size and Market – Equities
Market Cap Segment
(Equities)
Jan '17
$MM
YTD
$MM
Jan '17
$MM
MoM
Chg %
Mkt
Shr
Jan '17
$MM
MoM
Chg %
Mkt
Shr
Jan '17
All
Mkt
Shr
YTD
New
US Equities
Large Cap 4,104 4,104 610,865 -16% 51% 783,616 2% 38% 182 14% -
Mid Cap 4,175 4,175 24,775 2% 2% 142,272 5% 7% 55 4% -
Small Cap 4,147 4,147 113,231 -10% 10% 148,516 3% 7% 82 6% -
Broad 3,935 3,935 142,738 -6% 12% 468,669 2% 23% 360 27% -
Total US Equities 16,361 16,361 891,608 -13% 75% 1,543,073 3% 74% 679 51% -
DM Intl Equities
Large Cap 125 125 1,706 -19% 0% 6,607 3% 0% 24 2% 1
Mid Cap - - 20 -38% 0% 328 3% 0% 2 0% -
Small Cap 90 90 1,697 -11% 0% 11,917 4% 1% 22 2% -
Broad 7,283 7,283 90,287 -2% 8% 275,941 5% 13% 238 18% 1
Total DM Intl Equities 7,497 7,497 93,710 -2% 8% 294,792 5% 14% 286 22% 2
EM Equities
Large Cap 44 44 13,284 -10% 1% 5,181 6% 0% 15 1% -
Mid Cap - - 1 240% 0% 4 8% 0% 1 0% -
Small Cap (12) (12) 406 -23% 0% 2,287 5% 0% 13 1% -
Broad 3,385 3,385 92,756 -5% 8% 142,350 8% 7% 159 12% -
Total EM Equities 3,416 3,416 106,447 -6% 9% 149,822 8% 7% 188 14% -
Total Equities 29,020 29,020 1,190,029 -10% 100% 2,080,232 4% 100% 1,328 100% 9
# of FundsNet Cash Flows Turnover AUM
Source: Deutsche Bank, Bloomberg Finance LP, FactSet. Data as of the end of last month.
Figure 72: ETP Summary Statistics by Style and Market – Equities
Style
(Equities)
Jan '17
$MM
YTD
$MMJan '17
$MM
MoM
Chg %
Mkt
ShrJan '17
$MM
MoM
Chg %
Mkt
ShrJan '17
All
Mkt
Shr
YTD
New
US Equities
Growth (1,557) (1,557) 18,639 5% 2% 122,718 2% 6% 40 3% -
Value 3,188 3,188 24,750 5% 2% 138,917 3% 7% 44 3% -
Dividend 1,084 1,084 12,964 0% 1% 115,969 2% 6% 55 4% -
Blend 13,646 13,646 835,256 -14% 70% 1,165,469 3% 56% 540 41% -
Total US Equities 16,361 16,361 891,608 -13% 75% 1,543,073 3% 74% 679 51% -
DM Intl Equities
Growth 78 78 645 -6% 0% 2,589 7% 0% 1 0% -
Value 542 542 1,065 -8% 0% 4,973 15% 0% 1 0% -
Dividend 471 471 9,808 -17% 1% 29,050 3% 1% 50 4% -
Blend 6,422 6,422 82,203 0% 7% 258,197 6% 12% 237 18% 5
Total DM Intl Equities 7,513 7,513 93,721 -2% 8% 294,808 5% 14% 289 22% 5
EM Equities
Dividend (15) (15) 441 -13% 0% 3,267 4% 0% 15 1% -
Blend 3,431 3,431 106,006 -6% 9% 146,555 8% 7% 173 13% -
Total EM Equities 3,416 3,416 106,447 -6% 9% 149,822 8% 7% 188 14% -
Total Equities 29,020 29,020 1,190,029 -10% 100% 2,080,232 4% 100% 1,328 100% 9
# of FundsNet Cash Flows Turnover AUM
Source: Deutsche Bank, Bloomberg Finance LP, FactSet. Data as of the end of last month.
Deutsche Bank Securities Inc. Page 37
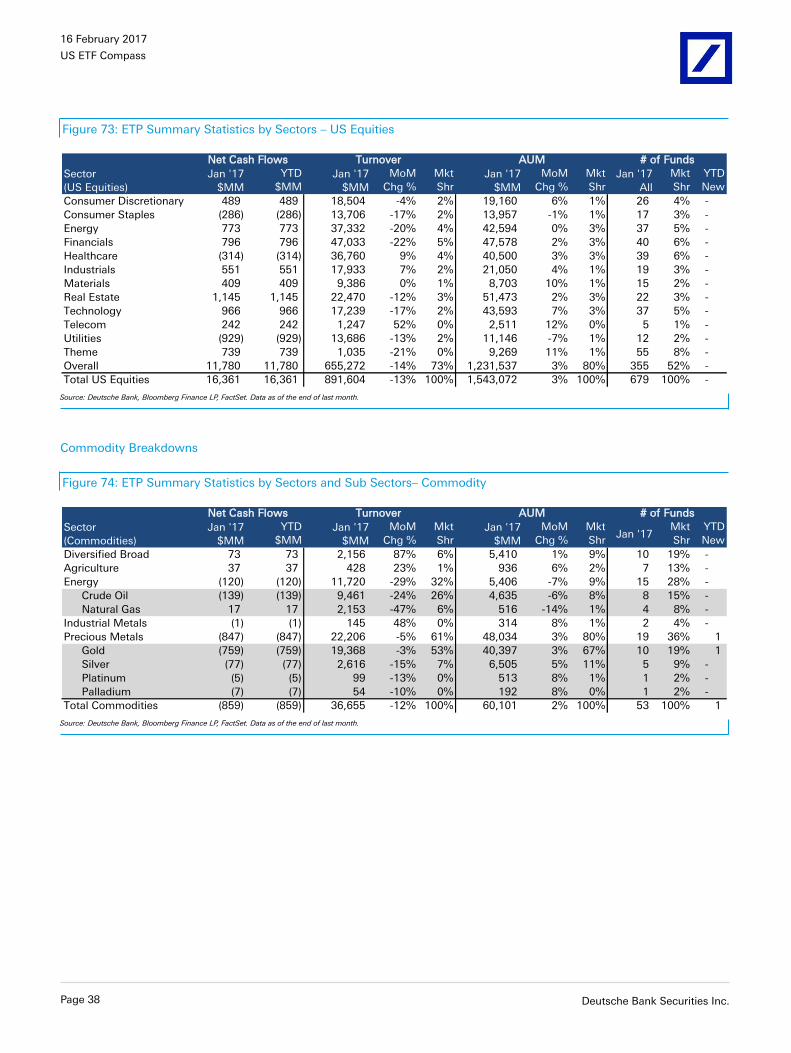
16 February 2017
US ETF Compass
Figure 73: ETP Summary Statistics by Sectors – US Equities
Sector
(US Equities)
Jan '17
$MM
YTD
$MMJan '17
$MM
MoM
Chg %
Mkt
ShrJan '17
$MM
MoM
Chg %
Mkt
ShrJan '17
All
Mkt
Shr
YTD
New
Consumer Discretionary 489 489 18,504 -4% 2% 19,160 6% 1% 26 4% -
Consumer Staples (286) (286) 13,706 -17% 2% 13,957 -1% 1% 17 3% -
Energy 773 773 37,332 -20% 4% 42,594 0% 3% 37 5% -
Financials 796 796 47,033 -22% 5% 47,578 2% 3% 40 6% -
Healthcare (314) (314) 36,760 9% 4% 40,500 3% 3% 39 6% -
Industrials 551 551 17,933 7% 2% 21,050 4% 1% 19 3% -
Materials 409 409 9,386 0% 1% 8,703 10% 1% 15 2% -
Real Estate 1,145 1,145 22,470 -12% 3% 51,473 2% 3% 22 3% -
Technology 966 966 17,239 -17% 2% 43,593 7% 3% 37 5% -
Telecom 242 242 1,247 52% 0% 2,511 12% 0% 5 1% -
Utilities (929) (929) 13,686 -13% 2% 11,146 -7% 1% 12 2% -
Theme 739 739 1,035 -21% 0% 9,269 11% 1% 55 8% -
Overall 11,780 11,780 655,272 -14% 73% 1,231,537 3% 80% 355 52% -
Total US Equities 16,361 16,361 891,604 -13% 100% 1,543,072 3% 100% 679 100% -
# of FundsNet Cash Flows Turnover AUM
Source: Deutsche Bank, Bloomberg Finance LP, FactSet. Data as of the end of last month.
Commodity Breakdowns
Figure 74: ETP Summary Statistics by Sectors and Sub Sectors– Commodity
Sector
(Commodities)
Jan '17
$MM
YTD
$MMJan '17
$MM
MoM
Chg %
Mkt
ShrJan '17
$MM
MoM
Chg %
Mkt
ShrJan '17
Mkt
Shr
YTD
New
Diversified Broad 73 73 2,156 87% 6% 5,410 1% 9% 10 19% -
Agriculture 37 37 428 23% 1% 936 6% 2% 7 13% -
Energy (120) (120) 11,720 -29% 32% 5,406 -7% 9% 15 28% -
Crude Oil (139) (139) 9,461 -24% 26% 4,635 -6% 8% 8 15% -
Natural Gas 17 17 2,153 -47% 6% 516 -14% 1% 4 8% -
Industrial Metals (1) (1) 145 48% 0% 314 8% 1% 2 4% -
Precious Metals (847) (847) 22,206 -5% 61% 48,034 3% 80% 19 36% 1
Gold (759) (759) 19,368 -3% 53% 40,397 3% 67% 10 19% 1
Silver (77) (77) 2,616 -15% 7% 6,505 5% 11% 5 9% -
Platinum (5) (5) 99 -13% 0% 513 8% 1% 1 2% -
Palladium (7) (7) 54 -10% 0% 192 8% 0% 1 2% -
Total Commodities (859) (859) 36,655 -12% 100% 60,101 2% 100% 53 100% 1
# of FundsNet Cash Flows Turnover AUM
Source: Deutsche Bank, Bloomberg Finance LP, FactSet. Data as of the end of last month.
Page 38 Deutsche Bank Securities Inc.
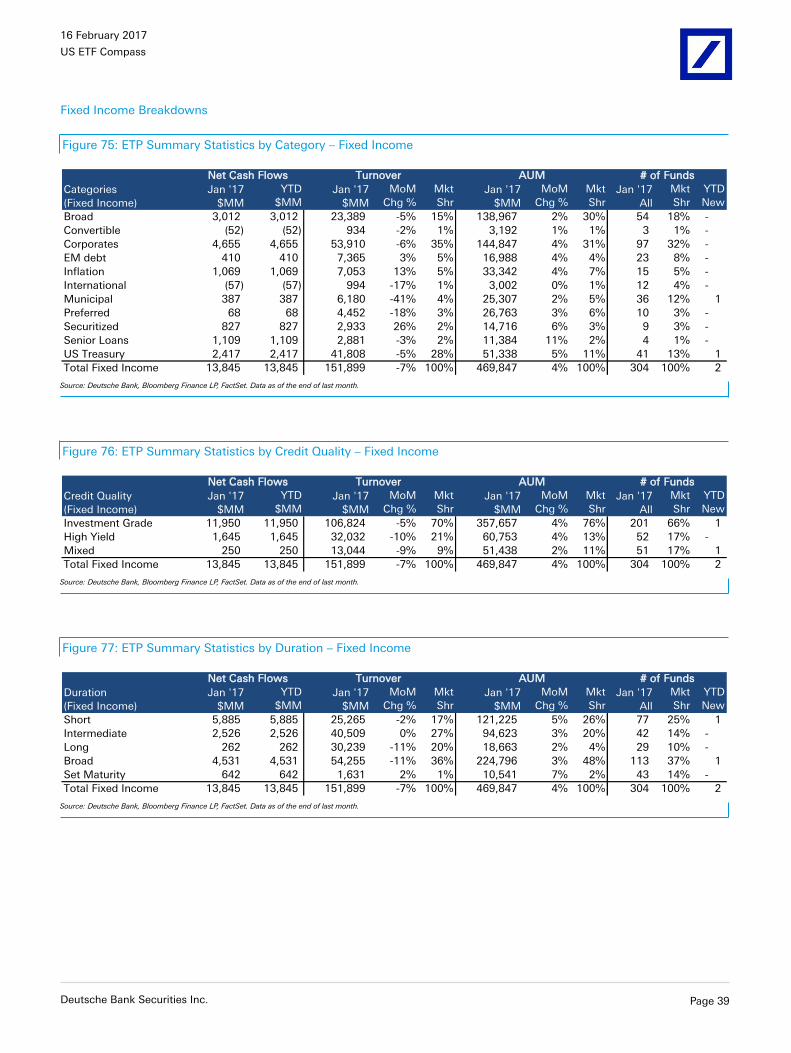
16 February 2017
US ETF Compass
Fixed Income Breakdowns
Figure 75: ETP Summary Statistics by Category – Fixed Income
Categories
(Fixed Income)
Jan '17
$MM
YTD
$MMJan '17
$MM
MoM
Chg %
Mkt
ShrJan '17
$MM
MoM
Chg %
Mkt
ShrJan '17
All
Mkt
Shr
YTD
New
Broad 3,012 3,012 23,389 -5% 15% 138,967 2% 30% 54 18% -
Convertible (52) (52) 934 -2% 1% 3,192 1% 1% 3 1% -
Corporates 4,655 4,655 53,910 -6% 35% 144,847 4% 31% 97 32% -
EM debt 410 410 7,365 3% 5% 16,988 4% 4% 23 8% -
Inflation 1,069 1,069 7,053 13% 5% 33,342 4% 7% 15 5% -
International (57) (57) 994 -17% 1% 3,002 0% 1% 12 4% -
Municipal 387 387 6,180 -41% 4% 25,307 2% 5% 36 12% 1
Preferred 68 68 4,452 -18% 3% 26,763 3% 6% 10 3% -
Securitized 827 827 2,933 26% 2% 14,716 6% 3% 9 3% -
Senior Loans 1,109 1,109 2,881 -3% 2% 11,384 11% 2% 4 1% -
US Treasury 2,417 2,417 41,808 -5% 28% 51,338 5% 11% 41 13% 1
Total Fixed Income 13,845 13,845 151,899 -7% 100% 469,847 4% 100% 304 100% 2
# of FundsNet Cash Flows Turnover AUM
Source: Deutsche Bank, Bloomberg Finance LP, FactSet. Data as of the end of last month.
Figure 76: ETP Summary Statistics by Credit Quality – Fixed Income
Credit Quality
(Fixed Income)
Jan '17
$MM
YTD
$MMJan '17
$MM
MoM
Chg %
Mkt
ShrJan '17
$MM
MoM
Chg %
Mkt
ShrJan '17
All
Mkt
Shr
YTD
New
Investment Grade 11,950 11,950 106,824 -5% 70% 357,657 4% 76% 201 66% 1
High Yield 1,645 1,645 32,032 -10% 21% 60,753 4% 13% 52 17% -
Mixed 250 250 13,044 -9% 9% 51,438 2% 11% 51 17% 1
Total Fixed Income 13,845 13,845 151,899 -7% 100% 469,847 4% 100% 304 100% 2
# of FundsNet Cash Flows Turnover AUM
Source: Deutsche Bank, Bloomberg Finance LP, FactSet. Data as of the end of last month.
Figure 77: ETP Summary Statistics by Duration – Fixed Income
Duration
(Fixed Income)
Jan '17
$MM
YTD
$MMJan '17
$MM
MoM
Chg %
Mkt
ShrJan '17
$MM
MoM
Chg %
Mkt
ShrJan '17
All
Mkt
Shr
YTD
New
Short 5,885 5,885 25,265 -2% 17% 121,225 5% 26% 77 25% 1
Intermediate 2,526 2,526 40,509 0% 27% 94,623 3% 20% 42 14% -
Long 262 262 30,239 -11% 20% 18,663 2% 4% 29 10% -
Broad 4,531 4,531 54,255 -11% 36% 224,796 3% 48% 113 37% 1
Set Maturity 642 642 1,631 2% 1% 10,541 7% 2% 43 14% -
Total Fixed Income 13,845 13,845 151,899 -7% 100% 469,847 4% 100% 304 100% 2
# of FundsNet Cash Flows Turnover AUM
Source: Deutsche Bank, Bloomberg Finance LP, FactSet. Data as of the end of last month.
Deutsche Bank Securities Inc. Page 39
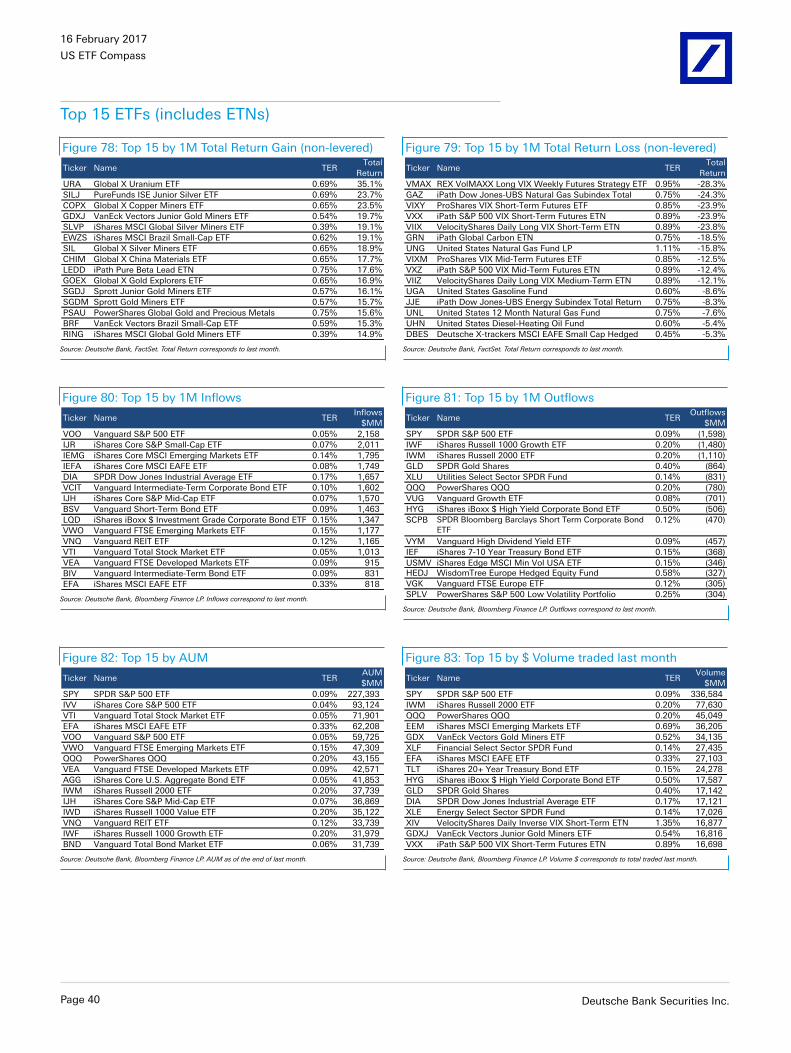
16 February 2017
US ETF Compass
Top 15 ETFs (includes ETNs)
Figure 78: Top 15 by 1M Total Return Gain (non-levered)
Ticker Name TERTotal
Return
URA Global X Uranium ETF 0.69% 35.1%
SILJ PureFunds ISE Junior Silver ETF 0.69% 23.7%
COPX Global X Copper Miners ETF 0.65% 23.5%
GDXJ VanEck Vectors Junior Gold Miners ETF 0.54% 19.7%
SLVP iShares MSCI Global Silver Miners ETF 0.39% 19.1%
EWZS iShares MSCI Brazil Small-Cap ETF 0.62% 19.1%
SIL Global X Silver Miners ETF 0.65% 18.9%
CHIM Global X China Materials ETF 0.65% 17.7%
LEDD iPath Pure Beta Lead ETN 0.75% 17.6%
GOEX Global X Gold Explorers ETF 0.65% 16.9%
SGDJ Sprott Junior Gold Miners ETF 0.57% 16.1%
SGDM Sprott Gold Miners ETF 0.57% 15.7%
PSAU PowerShares Global Gold and Precious Metals 0.75% 15.6%
BRF VanEck Vectors Brazil Small-Cap ETF 0.59% 15.3%
RING iShares MSCI Global Gold Miners ETF 0.39% 14.9%
Source: Deutsche Bank, FactSet. Total Return corresponds to last month.
Figure 79: Top 15 by 1M Total Return Loss (non-levered)
Ticker Name TERTotal
Return
VMAX REX VolMAXX Long VIX Weekly Futures Strategy ETF 0.95% -28.3%
GAZ iPath Dow Jones-UBS Natural Gas Subindex Total 0.75% -24.3%
VIXY ProShares VIX Short-Term Futures ETF 0.85% -23.9%
VXX iPath S&P 500 VIX Short-Term Futures ETN 0.89% -23.9%
VIIX VelocityShares Daily Long VIX Short-Term ETN 0.89% -23.8%
GRN iPath Global Carbon ETN 0.75% -18.5%
UNG United States Natural Gas Fund LP 1.11% -15.8%
VIXM ProShares VIX Mid-Term Futures ETF 0.85% -12.5%
VXZ iPath S&P 500 VIX Mid-Term Futures ETN 0.89% -12.4%
VIIZ VelocityShares Daily Long VIX Medium-Term ETN 0.89% -12.1%
UGA United States Gasoline Fund 0.60% -8.6%
JJE iPath Dow Jones-UBS Energy Subindex Total Return 0.75% -8.3%
UNL United States 12 Month Natural Gas Fund 0.75% -7.6%
UHN United States Diesel-Heating Oil Fund 0.60% -5.4%
DBES Deutsche X-trackers MSCI EAFE Small Cap Hedged 0.45% -5.3%
Source: Deutsche Bank, FactSet. Total Return corresponds to last month.
Figure 80: Top 15 by 1M Inflows
Ticker Name TERInflows
$MM
VOO Vanguard S&P 500 ETF 0.05% 2,158
IJR iShares Core S&P Small-Cap ETF 0.07% 2,011
IEMG iShares Core MSCI Emerging Markets ETF 0.14% 1,795
IEFA iShares Core MSCI EAFE ETF 0.08% 1,749
DIA SPDR Dow Jones Industrial Average ETF 0.17% 1,657
VCIT Vanguard Intermediate-Term Corporate Bond ETF 0.10% 1,602
IJH iShares Core S&P Mid-Cap ETF 0.07% 1,570
BSV Vanguard Short-Term Bond ETF 0.09% 1,463
LQD iShares iBoxx $ Investment Grade Corporate Bond ETF 0.15% 1,347
VWO Vanguard FTSE Emerging Markets ETF 0.15% 1,177
VNQ Vanguard REIT ETF 0.12% 1,165
VTI Vanguard Total Stock Market ETF 0.05% 1,013
VEA Vanguard FTSE Developed Markets ETF 0.09% 915
BIV Vanguard Intermediate-Term Bond ETF 0.09% 831
EFA iShares MSCI EAFE ETF 0.33% 818
Source: Deutsche Bank, Bloomberg Finance LP. Inflows correspond to last month.
Figure 81: Top 15 by 1M Outflows
Ticker Name TEROutflows
$MM
SPY SPDR S&P 500 ETF 0.09% (1,598)
IWF iShares Russell 1000 Growth ETF 0.20% (1,480)
IWM iShares Russell 2000 ETF 0.20% (1,110)
GLD SPDR Gold Shares 0.40% (864)
XLU Utilities Select Sector SPDR Fund 0.14% (831)
QQQ PowerShares QQQ 0.20% (780)
VUG Vanguard Growth ETF 0.08% (701)
HYG iShares iBoxx $ High Yield Corporate Bond ETF 0.50% (506)
SCPB SPDR Bloomberg Barclays Short Term Corporate Bond
ETF0.12% (470)
VYM Vanguard High Dividend Yield ETF 0.09% (457)
IEF iShares 7-10 Year Treasury Bond ETF 0.15% (368)
USMV iShares Edge MSCI Min Vol USA ETF 0.15% (346) HEDJ WisdomTree Europe Hedged Equity Fund 0.58% (327)
VGK Vanguard FTSE Europe ETF 0.12% (305)
SPLV PowerShares S&P 500 Low Volatility Portfolio 0.25% (304)
Source: Deutsche Bank, Bloomberg Finance LP. Outflows correspond to last month.
Figure 82: Top 15 by AUM
Ticker Name TERAUM
$MM
SPY SPDR S&P 500 ETF 0.09% 227,393
IVV iShares Core S&P 500 ETF 0.04% 93,124
VTI Vanguard Total Stock Market ETF 0.05% 71,901
EFA iShares MSCI EAFE ETF 0.33% 62,208
VOO Vanguard S&P 500 ETF 0.05% 59,725
VWO Vanguard FTSE Emerging Markets ETF 0.15% 47,309
QQQ PowerShares QQQ 0.20% 43,155
VEA Vanguard FTSE Developed Markets ETF 0.09% 42,571
AGG iShares Core U.S. Aggregate Bond ETF 0.05% 41,853
IWM iShares Russell 2000 ETF 0.20% 37,739
IJH iShares Core S&P Mid-Cap ETF 0.07% 36,869
IWD iShares Russell 1000 Value ETF 0.20% 35,122
VNQ Vanguard REIT ETF 0.12% 33,739
IWF iShares Russell 1000 Growth ETF 0.20% 31,979
BND Vanguard Total Bond Market ETF 0.06% 31,739
Source: Deutsche Bank, Bloomberg Finance LP. AUM as of the end of last month.
Figure 83: Top 15 by $ Volume traded last month
Ticker Name TERVolume
$MM
SPY SPDR S&P 500 ETF 0.09% 336,584
IWM iShares Russell 2000 ETF 0.20% 77,630
QQQ PowerShares QQQ 0.20% 45,049
EEM iShares MSCI Emerging Markets ETF 0.69% 36,205
GDX VanEck Vectors Gold Miners ETF 0.52% 34,135
XLF Financial Select Sector SPDR Fund 0.14% 27,435
EFA iShares MSCI EAFE ETF 0.33% 27,103
TLT iShares 20+ Year Treasury Bond ETF 0.15% 24,278
HYG iShares iBoxx $ High Yield Corporate Bond ETF 0.50% 17,587
GLD SPDR Gold Shares 0.40% 17,142
DIA SPDR Dow Jones Industrial Average ETF 0.17% 17,121
XLE Energy Select Sector SPDR Fund 0.14% 17,026
XIV VelocityShares Daily Inverse VIX Short-Term ETN 1.35% 16,877
GDXJ VanEck Vectors Junior Gold Miners ETF 0.54% 16,816
VXX iPath S&P 500 VIX Short-Term Futures ETN 0.89% 16,698
Source: Deutsche Bank, Bloomberg Finance LP. Volume $ corresponds to total traded last month.
Page 40 Deutsche Bank Securities Inc.
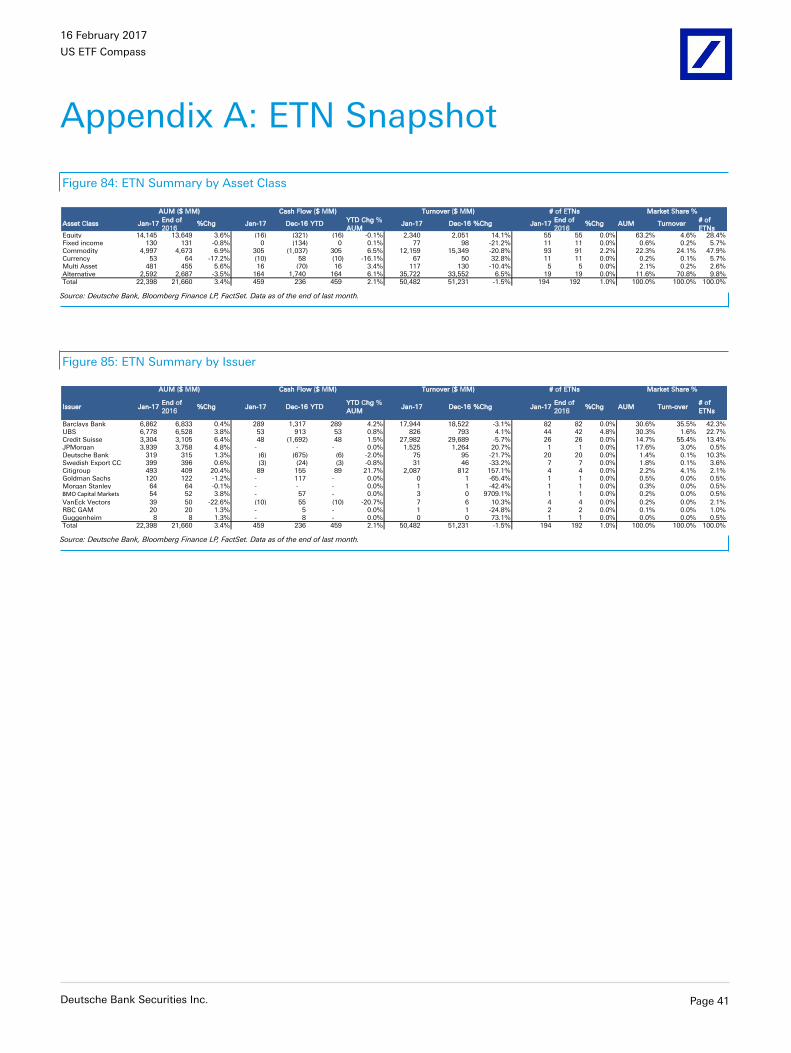
16 February 2017
US ETF Compass
Appendix A: ETN Snapshot
Figure 84: ETN Summary by Asset Class
Asset Class Jan-17End of
%Chg Jan-17 Dec-16 YTDYTD Chg %
AUMJan-17 Dec-16 %Chg Jan-17
End of %Chg AUM Turnover
# of
ETNsEquity 14,145 13,649 3.6% (16) (321) (16) -0.1% 2,340 2,051 14.1% 55 55 0.0% 63.2% 4.6% 28.4%Fixed income 130 131 -0.8% 0 (134) 0 0.1% 77 98 -21.2% 11 11 0.0% 0.6% 0.2% 5.7%Commodity 4,997 4,673 6.9% 305 (1,037) 305 6.5% 12,159 15,349 -20.8% 93 91 2.2% 22.3% 24.1% 47.9%Currency 53 64 -17.2% (10) 58 (10) -16.1% 67 50 32.8% 11 11 0.0% 0.2% 0.1% 5.7%Multi Asset 481 455 5.6% 16 (70) 16 3.4% 117 130 -10.4% 5 5 0.0% 2.1% 0.2% 2.6%Alternative 2,592 2,687 -3.5% 164 1,740 164 6.1% 35,722 33,552 6.5% 19 19 0.0% 11.6% 70.8% 9.8%Total 22,398 21,660 3.4% 459 236 459 2.1% 50,482 51,231 -1.5% 194 192 1.0% 100.0% 100.0% 100.0%
AUM ($ MM) Cash Flow ($ MM) Turnover ($ MM) # of ETNs Market Share %
Source: Deutsche Bank, Bloomberg Finance LP, FactSet. Data as of the end of last month.
Figure 85: ETN Summary by Issuer
Issuer Jan-17End of
%Chg Jan-17 Dec-16 YTDYTD Chg %
AUMJan-17 Dec-16 %Chg Jan-17
End of %Chg AUM Turn-over
# of
ETNs
Barclays Bank 6,862 6,833 0.4% 289 1,317 289 4.2% 17,944 18,522 -3.1% 82 82 0.0% 30.6% 35.5% 42.3%UBS 6,778 6,528 3.8% 53 913 53 0.8% 826 793 4.1% 44 42 4.8% 30.3% 1.6% 22.7%Credit Suisse 3,304 3,105 6.4% 48 (1,692) 48 1.5% 27,982 29,689 -5.7% 26 26 0.0% 14.7% 55.4% 13.4%JPMorgan 3,939 3,758 4.8% - - - 0.0% 1,525 1,264 20.7% 1 1 0.0% 17.6% 3.0% 0.5%Deutsche Bank 319 315 1.3% (6) (675) (6) -2.0% 75 95 -21.7% 20 20 0.0% 1.4% 0.1% 10.3%Swedish Export CC 399 396 0.6% (3) (24) (3) -0.8% 31 46 -33.2% 7 7 0.0% 1.8% 0.1% 3.6%Citigroup 493 409 20.4% 89 155 89 21.7% 2,087 812 157.1% 4 4 0.0% 2.2% 4.1% 2.1%Goldman Sachs 120 122 -1.2% - 117 - 0.0% 0 1 -65.4% 1 1 0.0% 0.5% 0.0% 0.5%Morgan Stanley 64 64 -0.1% - - - 0.0% 1 1 -42.4% 1 1 0.0% 0.3% 0.0% 0.5%BMO Capital Markets 54 52 3.8% - 57 - 0.0% 3 0 9709.1% 1 1 0.0% 0.2% 0.0% 0.5%
VanEck Vectors 39 50 -22.6% (10) 55 (10) -20.7% 7 6 10.3% 4 4 0.0% 0.2% 0.0% 2.1%RBC GAM 20 20 1.3% - 5 - 0.0% 1 1 -24.8% 2 2 0.0% 0.1% 0.0% 1.0%Guggenheim 8 8 1.3% - 8 - 0.0% 0 0 73.1% 1 1 0.0% 0.0% 0.0% 0.5%Total 22,398 21,660 3.4% 459 236 459 2.1% 50,482 51,231 -1.5% 194 192 1.0% 100.0% 100.0% 100.0%
AUM ($ MM) Cash Flow ($ MM) Turnover ($ MM) # of ETNs Market Share %
Source: Deutsche Bank, Bloomberg Finance LP, FactSet. Data as of the end of last month.
Deutsche Bank Securities Inc. Page 41
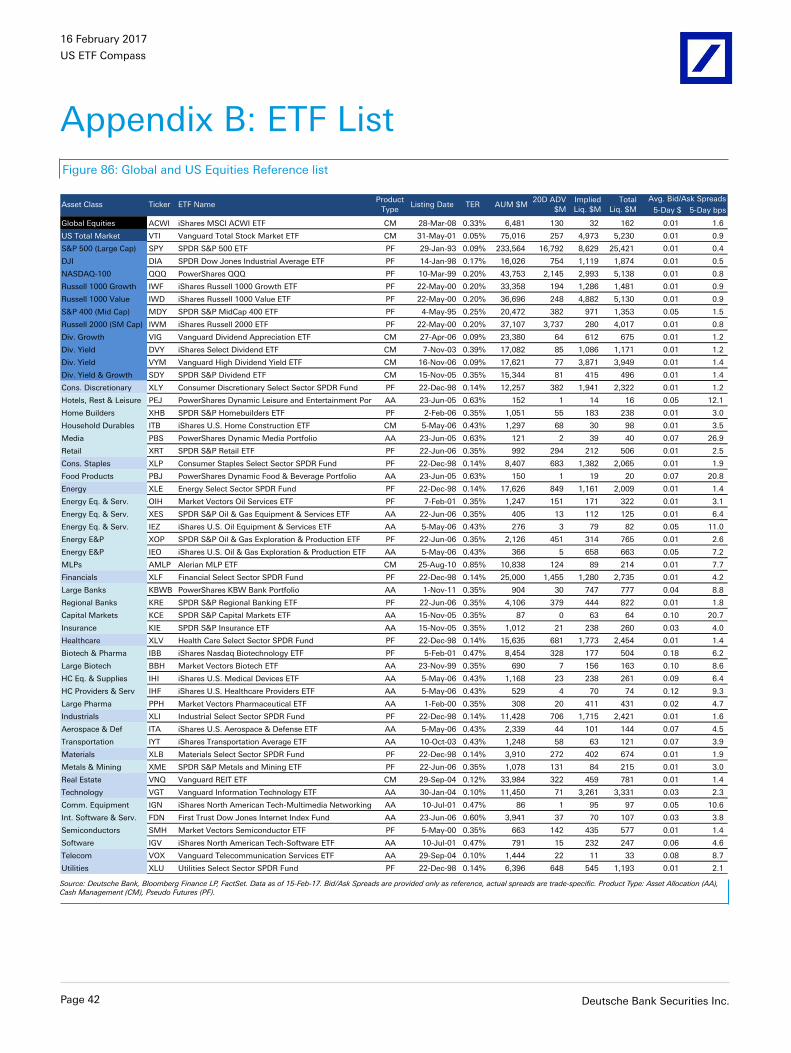
16 February 2017
US ETF Compass
Appendix B: ETF ListFigure 86: Global and US Equities Reference list
5-Day $ 5-Day bps
Global Equities ACWI iShares MSCI ACWI ETF CM 28-Mar-08 0.33% 6,481 130 32 162 0.01 1.6
US Total Market VTI Vanguard Total Stock Market ETF CM 31-May-01 0.05% 75,016 257 4,973 5,230 0.01 0.9
S&P 500 (Large Cap) SPY SPDR S&P 500 ETF PF 29-Jan-93 0.09% 233,564 16,792 8,629 25,421 0.01 0.4
DJI DIA SPDR Dow Jones Industrial Average ETF PF 14-Jan-98 0.17% 16,026 754 1,119 1,874 0.01 0.5
NASDAQ-100 QQQ PowerShares QQQ PF 10-Mar-99 0.20% 43,753 2,145 2,993 5,138 0.01 0.8
Russell 1000 Growth IWF iShares Russell 1000 Growth ETF PF 22-May-00 0.20% 33,358 194 1,286 1,481 0.01 0.9
Russell 1000 Value IWD iShares Russell 1000 Value ETF PF 22-May-00 0.20% 36,696 248 4,882 5,130 0.01 0.9
S&P 400 (Mid Cap) MDY SPDR S&P MidCap 400 ETF PF 4-May-95 0.25% 20,472 382 971 1,353 0.05 1.5
Russell 2000 (SM Cap) IWM iShares Russell 2000 ETF PF 22-May-00 0.20% 37,107 3,737 280 4,017 0.01 0.8
Div. Growth VIG Vanguard Dividend Appreciation ETF CM 27-Apr-06 0.09% 23,380 64 612 675 0.01 1.2
Div. Yield DVY iShares Select Dividend ETF CM 7-Nov-03 0.39% 17,082 85 1,086 1,171 0.01 1.2
Div. Yield VYM Vanguard High Dividend Yield ETF CM 16-Nov-06 0.09% 17,621 77 3,871 3,949 0.01 1.4
Div. Yield & Growth SDY SPDR S&P Dividend ETF CM 15-Nov-05 0.35% 15,344 81 415 496 0.01 1.4
Cons. Discretionary XLY Consumer Discretionary Select Sector SPDR Fund PF 22-Dec-98 0.14% 12,257 382 1,941 2,322 0.01 1.2
Hotels, Rest & Leisure PEJ PowerShares Dynamic Leisure and Entertainment Portf AA 23-Jun-05 0.63% 152 1 14 16 0.05 12.1
Home Builders XHB SPDR S&P Homebuilders ETF PF 2-Feb-06 0.35% 1,051 55 183 238 0.01 3.0
Household Durables ITB iShares U.S. Home Construction ETF CM 5-May-06 0.43% 1,297 68 30 98 0.01 3.5
Media PBS PowerShares Dynamic Media Portfolio AA 23-Jun-05 0.63% 121 2 39 40 0.07 26.9
Retail XRT SPDR S&P Retail ETF PF 22-Jun-06 0.35% 992 294 212 506 0.01 2.5
Cons. Staples XLP Consumer Staples Select Sector SPDR Fund PF 22-Dec-98 0.14% 8,407 683 1,382 2,065 0.01 1.9
Food Products PBJ PowerShares Dynamic Food & Beverage Portfolio AA 23-Jun-05 0.63% 150 1 19 20 0.07 20.8
Energy XLE Energy Select Sector SPDR Fund PF 22-Dec-98 0.14% 17,626 849 1,161 2,009 0.01 1.4
Energy Eq. & Serv. OIH Market Vectors Oil Services ETF PF 7-Feb-01 0.35% 1,247 151 171 322 0.01 3.1
Energy Eq. & Serv. XES SPDR S&P Oil & Gas Equipment & Services ETF AA 22-Jun-06 0.35% 405 13 112 125 0.01 6.4
Energy Eq. & Serv. IEZ iShares U.S. Oil Equipment & Services ETF AA 5-May-06 0.43% 276 3 79 82 0.05 11.0
Energy E&P XOP SPDR S&P Oil & Gas Exploration & Production ETF PF 22-Jun-06 0.35% 2,126 451 314 765 0.01 2.6
Energy E&P IEO iShares U.S. Oil & Gas Exploration & Production ETF AA 5-May-06 0.43% 366 5 658 663 0.05 7.2
MLPs AMLP Alerian MLP ETF CM 25-Aug-10 0.85% 10,838 124 89 214 0.01 7.7
Financials XLF Financial Select Sector SPDR Fund PF 22-Dec-98 0.14% 25,000 1,455 1,280 2,735 0.01 4.2
Large Banks KBWB PowerShares KBW Bank Portfolio AA 1-Nov-11 0.35% 904 30 747 777 0.04 8.8
Regional Banks KRE SPDR S&P Regional Banking ETF PF 22-Jun-06 0.35% 4,106 379 444 822 0.01 1.8
Capital Markets KCE SPDR S&P Capital Markets ETF AA 15-Nov-05 0.35% 87 0 63 64 0.10 20.7
Insurance KIE SPDR S&P Insurance ETF AA 15-Nov-05 0.35% 1,012 21 238 260 0.03 4.0
Healthcare XLV Health Care Select Sector SPDR Fund PF 22-Dec-98 0.14% 15,635 681 1,773 2,454 0.01 1.4
Biotech & Pharma IBB iShares Nasdaq Biotechnology ETF PF 5-Feb-01 0.47% 8,454 328 177 504 0.18 6.2
Large Biotech BBH Market Vectors Biotech ETF AA 23-Nov-99 0.35% 690 7 156 163 0.10 8.6
HC Eq. & Supplies IHI iShares U.S. Medical Devices ETF AA 5-May-06 0.43% 1,168 23 238 261 0.09 6.4
HC Providers & Serv IHF iShares U.S. Healthcare Providers ETF AA 5-May-06 0.43% 529 4 70 74 0.12 9.3
Large Pharma PPH Market Vectors Pharmaceutical ETF AA 1-Feb-00 0.35% 308 20 411 431 0.02 4.7
Industrials XLI Industrial Select Sector SPDR Fund PF 22-Dec-98 0.14% 11,428 706 1,715 2,421 0.01 1.6
Aerospace & Def ITA iShares U.S. Aerospace & Defense ETF AA 5-May-06 0.43% 2,339 44 101 144 0.07 4.5
Transportation IYT iShares Transportation Average ETF AA 10-Oct-03 0.43% 1,248 58 63 121 0.07 3.9
Materials XLB Materials Select Sector SPDR Fund PF 22-Dec-98 0.14% 3,910 272 402 674 0.01 1.9
Metals & Mining XME SPDR S&P Metals and Mining ETF PF 22-Jun-06 0.35% 1,078 131 84 215 0.01 3.0
Real Estate VNQ Vanguard REIT ETF CM 29-Sep-04 0.12% 33,984 322 459 781 0.01 1.4
Technology VGT Vanguard Information Technology ETF AA 30-Jan-04 0.10% 11,450 71 3,261 3,331 0.03 2.3
Comm. Equipment IGN iShares North American Tech-Multimedia Networking E AA 10-Jul-01 0.47% 86 1 95 97 0.05 10.6
Int. Software & Serv. FDN First Trust Dow Jones Internet Index Fund AA 23-Jun-06 0.60% 3,941 37 70 107 0.03 3.8
Semiconductors SMH Market Vectors Semiconductor ETF PF 5-May-00 0.35% 663 142 435 577 0.01 1.4
Software IGV iShares North American Tech-Software ETF AA 10-Jul-01 0.47% 791 15 232 247 0.06 4.6
Telecom VOX Vanguard Telecommunication Services ETF AA 29-Sep-04 0.10% 1,444 22 11 33 0.08 8.7
Utilities XLU Utilities Select Sector SPDR Fund PF 22-Dec-98 0.14% 6,396 648 545 1,193 0.01 2.1
Listing Date TERProduct
TypeAsset Class Ticker ETF Name AUM $M
20D ADV
$M
Implied
Liq. $M
Total
Liq. $M
Avg. Bid/Ask Spreads
Source: Deutsche Bank, Bloomberg Finance LP, FactSet. Data as of 15-Feb-17. Bid/Ask Spreads are provided only as reference, actual spreads are trade-specific. Product Type: Asset Allocation (AA),Cash Management (CM), Pseudo Futures (PF).
Page 42 Deutsche Bank Securities Inc.
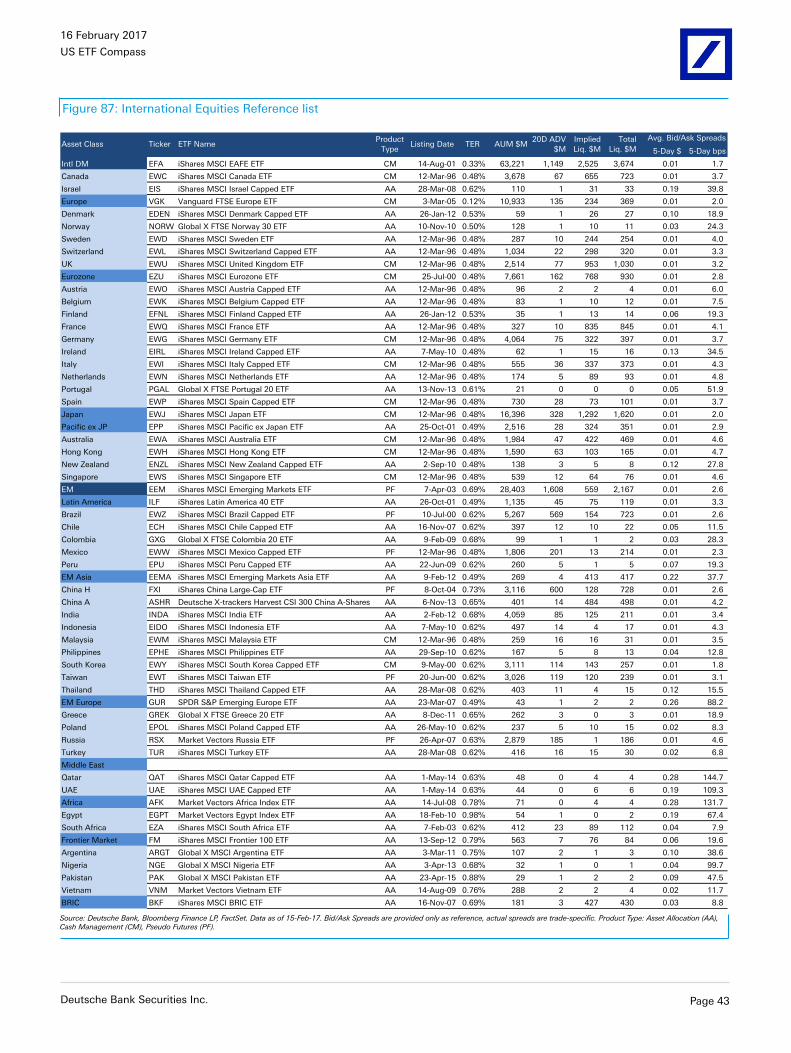
16 February 2017
US ETF Compass
Figure 87: International Equities Reference list
5-Day $ 5-Day bps
Intl DM EFA iShares MSCI EAFE ETF CM 14-Aug-01 0.33% 63,221 1,149 2,525 3,674 0.01 1.7
Canada EWC iShares MSCI Canada ETF CM 12-Mar-96 0.48% 3,678 67 655 723 0.01 3.7
Israel EIS iShares MSCI Israel Capped ETF AA 28-Mar-08 0.62% 110 1 31 33 0.19 39.8
Europe VGK Vanguard FTSE Europe ETF CM 3-Mar-05 0.12% 10,933 135 234 369 0.01 2.0
Denmark EDEN iShares MSCI Denmark Capped ETF AA 26-Jan-12 0.53% 59 1 26 27 0.10 18.9
Norway NORW Global X FTSE Norway 30 ETF AA 10-Nov-10 0.50% 128 1 10 11 0.03 24.3
Sweden EWD iShares MSCI Sweden ETF AA 12-Mar-96 0.48% 287 10 244 254 0.01 4.0
Switzerland EWL iShares MSCI Switzerland Capped ETF AA 12-Mar-96 0.48% 1,034 22 298 320 0.01 3.3
UK EWU iShares MSCI United Kingdom ETF CM 12-Mar-96 0.48% 2,514 77 953 1,030 0.01 3.2
Eurozone EZU iShares MSCI Eurozone ETF CM 25-Jul-00 0.48% 7,661 162 768 930 0.01 2.8
Austria EWO iShares MSCI Austria Capped ETF AA 12-Mar-96 0.48% 96 2 2 4 0.01 6.0
Belgium EWK iShares MSCI Belgium Capped ETF AA 12-Mar-96 0.48% 83 1 10 12 0.01 7.5
Finland EFNL iShares MSCI Finland Capped ETF AA 26-Jan-12 0.53% 35 1 13 14 0.06 19.3
France EWQ iShares MSCI France ETF AA 12-Mar-96 0.48% 327 10 835 845 0.01 4.1
Germany EWG iShares MSCI Germany ETF CM 12-Mar-96 0.48% 4,064 75 322 397 0.01 3.7
Ireland EIRL iShares MSCI Ireland Capped ETF AA 7-May-10 0.48% 62 1 15 16 0.13 34.5
Italy EWI iShares MSCI Italy Capped ETF CM 12-Mar-96 0.48% 555 36 337 373 0.01 4.3
Netherlands EWN iShares MSCI Netherlands ETF AA 12-Mar-96 0.48% 174 5 89 93 0.01 4.8
Portugal PGAL Global X FTSE Portugal 20 ETF AA 13-Nov-13 0.61% 21 0 0 0 0.05 51.9
Spain EWP iShares MSCI Spain Capped ETF CM 12-Mar-96 0.48% 730 28 73 101 0.01 3.7
Japan EWJ iShares MSCI Japan ETF CM 12-Mar-96 0.48% 16,396 328 1,292 1,620 0.01 2.0
Pacific ex JP EPP iShares MSCI Pacific ex Japan ETF AA 25-Oct-01 0.49% 2,516 28 324 351 0.01 2.9
Australia EWA iShares MSCI Australia ETF CM 12-Mar-96 0.48% 1,984 47 422 469 0.01 4.6
Hong Kong EWH iShares MSCI Hong Kong ETF CM 12-Mar-96 0.48% 1,590 63 103 165 0.01 4.7
New Zealand ENZL iShares MSCI New Zealand Capped ETF AA 2-Sep-10 0.48% 138 3 5 8 0.12 27.8
Singapore EWS iShares MSCI Singapore ETF CM 12-Mar-96 0.48% 539 12 64 76 0.01 4.6
EM EEM iShares MSCI Emerging Markets ETF PF 7-Apr-03 0.69% 28,403 1,608 559 2,167 0.01 2.6
Latin America ILF iShares Latin America 40 ETF AA 26-Oct-01 0.49% 1,135 45 75 119 0.01 3.3
Brazil EWZ iShares MSCI Brazil Capped ETF PF 10-Jul-00 0.62% 5,267 569 154 723 0.01 2.6
Chile ECH iShares MSCI Chile Capped ETF AA 16-Nov-07 0.62% 397 12 10 22 0.05 11.5
Colombia GXG Global X FTSE Colombia 20 ETF AA 9-Feb-09 0.68% 99 1 1 2 0.03 28.3
Mexico EWW iShares MSCI Mexico Capped ETF PF 12-Mar-96 0.48% 1,806 201 13 214 0.01 2.3
Peru EPU iShares MSCI Peru Capped ETF AA 22-Jun-09 0.62% 260 5 1 5 0.07 19.3
EM Asia EEMA iShares MSCI Emerging Markets Asia ETF AA 9-Feb-12 0.49% 269 4 413 417 0.22 37.7
China H FXI iShares China Large-Cap ETF PF 8-Oct-04 0.73% 3,116 600 128 728 0.01 2.6
China A ASHR Deutsche X-trackers Harvest CSI 300 China A-Shares ET AA 6-Nov-13 0.65% 401 14 484 498 0.01 4.2
India INDA iShares MSCI India ETF AA 2-Feb-12 0.68% 4,059 85 125 211 0.01 3.4
Indonesia EIDO iShares MSCI Indonesia ETF AA 7-May-10 0.62% 497 14 4 17 0.01 4.3
Malaysia EWM iShares MSCI Malaysia ETF CM 12-Mar-96 0.48% 259 16 16 31 0.01 3.5
Philippines EPHE iShares MSCI Philippines ETF AA 29-Sep-10 0.62% 167 5 8 13 0.04 12.8
South Korea EWY iShares MSCI South Korea Capped ETF CM 9-May-00 0.62% 3,111 114 143 257 0.01 1.8
Taiwan EWT iShares MSCI Taiwan ETF PF 20-Jun-00 0.62% 3,026 119 120 239 0.01 3.1
Thailand THD iShares MSCI Thailand Capped ETF AA 28-Mar-08 0.62% 403 11 4 15 0.12 15.5
EM Europe GUR SPDR S&P Emerging Europe ETF AA 23-Mar-07 0.49% 43 1 2 2 0.26 88.2
Greece GREK Global X FTSE Greece 20 ETF AA 8-Dec-11 0.65% 262 3 0 3 0.01 18.9
Poland EPOL iShares MSCI Poland Capped ETF AA 26-May-10 0.62% 237 5 10 15 0.02 8.3
Russia RSX Market Vectors Russia ETF PF 26-Apr-07 0.63% 2,879 185 1 186 0.01 4.6
Turkey TUR iShares MSCI Turkey ETF AA 28-Mar-08 0.62% 416 16 15 30 0.02 6.8
Middle East
Qatar QAT iShares MSCI Qatar Capped ETF AA 1-May-14 0.63% 48 0 4 4 0.28 144.7
UAE UAE iShares MSCI UAE Capped ETF AA 1-May-14 0.63% 44 0 6 6 0.19 109.3
Africa AFK Market Vectors Africa Index ETF AA 14-Jul-08 0.78% 71 0 4 4 0.28 131.7
Egypt EGPT Market Vectors Egypt Index ETF AA 18-Feb-10 0.98% 54 1 0 2 0.19 67.4
South Africa EZA iShares MSCI South Africa ETF AA 7-Feb-03 0.62% 412 23 89 112 0.04 7.9
Frontier Market FM iShares MSCI Frontier 100 ETF AA 13-Sep-12 0.79% 563 7 76 84 0.06 19.6
Argentina ARGT Global X MSCI Argentina ETF AA 3-Mar-11 0.75% 107 2 1 3 0.10 38.6
Nigeria NGE Global X MSCI Nigeria ETF AA 3-Apr-13 0.68% 32 1 0 1 0.04 99.7
Pakistan PAK Global X MSCI Pakistan ETF AA 23-Apr-15 0.88% 29 1 2 2 0.09 47.5
Vietnam VNM Market Vectors Vietnam ETF AA 14-Aug-09 0.76% 288 2 2 4 0.02 11.7
BRIC BKF iShares MSCI BRIC ETF AA 16-Nov-07 0.69% 181 3 427 430 0.03 8.8
Avg. Bid/Ask SpreadsTER AUM $M
20D ADV
$M
Implied
Liq. $M
Total
Liq. $MAsset Class Ticker ETF Name
Product
TypeListing Date
Source: Deutsche Bank, Bloomberg Finance LP, FactSet. Data as of 15-Feb-17. Bid/Ask Spreads are provided only as reference, actual spreads are trade-specific. Product Type: Asset Allocation (AA),Cash Management (CM), Pseudo Futures (PF).
Deutsche Bank Securities Inc. Page 43
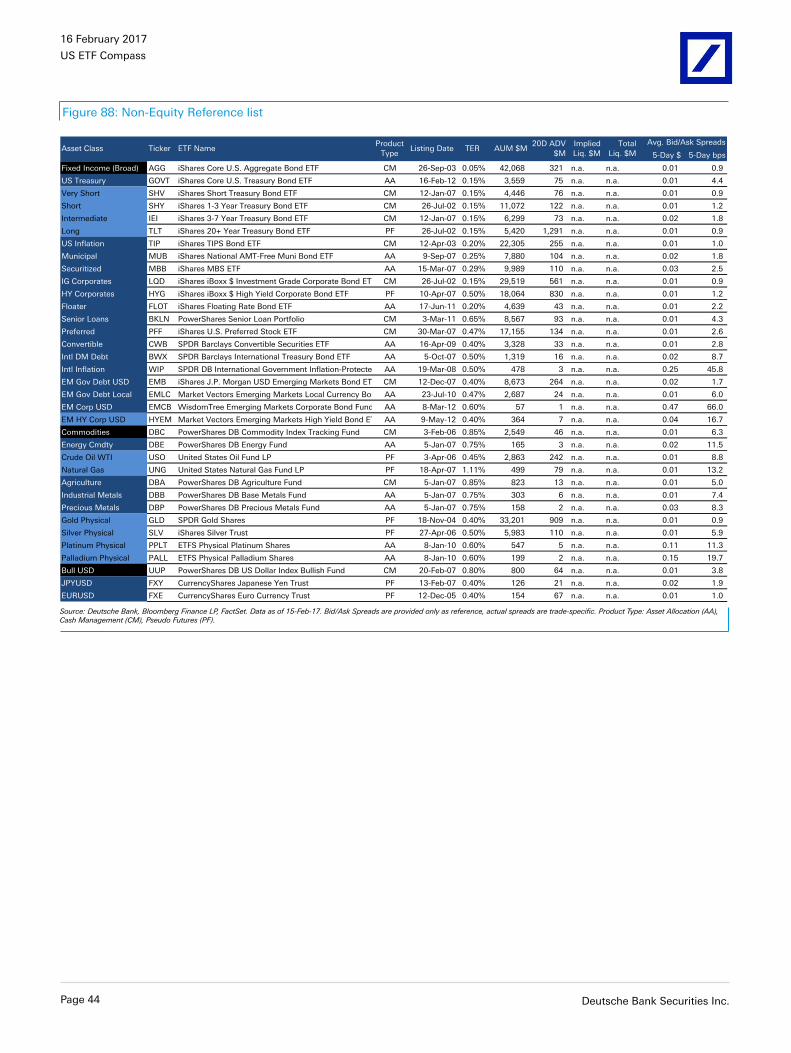
16 February 2017
US ETF Compass
Figure 88: Non-Equity Reference list
5-Day $ 5-Day bps
Fixed Income (Broad) AGG iShares Core U.S. Aggregate Bond ETF CM 26-Sep-03 0.05% 42,068 321 n.a. n.a. 0.01 0.9
US Treasury GOVT iShares Core U.S. Treasury Bond ETF AA 16-Feb-12 0.15% 3,559 75 n.a. n.a. 0.01 4.4
Very Short SHV iShares Short Treasury Bond ETF CM 12-Jan-07 0.15% 4,446 76 n.a. n.a. 0.01 0.9
Short SHY iShares 1-3 Year Treasury Bond ETF CM 26-Jul-02 0.15% 11,072 122 n.a. n.a. 0.01 1.2
Intermediate IEI iShares 3-7 Year Treasury Bond ETF CM 12-Jan-07 0.15% 6,299 73 n.a. n.a. 0.02 1.8
Long TLT iShares 20+ Year Treasury Bond ETF PF 26-Jul-02 0.15% 5,420 1,291 n.a. n.a. 0.01 0.9
US Inflation TIP iShares TIPS Bond ETF CM 12-Apr-03 0.20% 22,305 255 n.a. n.a. 0.01 1.0
Municipal MUB iShares National AMT-Free Muni Bond ETF AA 9-Sep-07 0.25% 7,880 104 n.a. n.a. 0.02 1.8
Securitized MBB iShares MBS ETF AA 15-Mar-07 0.29% 9,989 110 n.a. n.a. 0.03 2.5
IG Corporates LQD iShares iBoxx $ Investment Grade Corporate Bond ETF CM 26-Jul-02 0.15% 29,519 561 n.a. n.a. 0.01 0.9
HY Corporates HYG iShares iBoxx $ High Yield Corporate Bond ETF PF 10-Apr-07 0.50% 18,064 830 n.a. n.a. 0.01 1.2
Floater FLOT iShares Floating Rate Bond ETF AA 17-Jun-11 0.20% 4,639 43 n.a. n.a. 0.01 2.2
Senior Loans BKLN PowerShares Senior Loan Portfolio CM 3-Mar-11 0.65% 8,567 93 n.a. n.a. 0.01 4.3
Preferred PFF iShares U.S. Preferred Stock ETF CM 30-Mar-07 0.47% 17,155 134 n.a. n.a. 0.01 2.6
Convertible CWB SPDR Barclays Convertible Securities ETF AA 16-Apr-09 0.40% 3,328 33 n.a. n.a. 0.01 2.8
Intl DM Debt BWX SPDR Barclays International Treasury Bond ETF AA 5-Oct-07 0.50% 1,319 16 n.a. n.a. 0.02 8.7
Intl Inflation WIP SPDR DB International Government Inflation-Protected AA 19-Mar-08 0.50% 478 3 n.a. n.a. 0.25 45.8
EM Gov Debt USD EMB iShares J.P. Morgan USD Emerging Markets Bond ETF CM 12-Dec-07 0.40% 8,673 264 n.a. n.a. 0.02 1.7
EM Gov Debt Local EMLC Market Vectors Emerging Markets Local Currency Bon AA 23-Jul-10 0.47% 2,687 24 n.a. n.a. 0.01 6.0
EM Corp USD EMCB WisdomTree Emerging Markets Corporate Bond Fund AA 8-Mar-12 0.60% 57 1 n.a. n.a. 0.47 66.0
EM HY Corp USD HYEM Market Vectors Emerging Markets High Yield Bond ET AA 9-May-12 0.40% 364 7 n.a. n.a. 0.04 16.7
Commodities DBC PowerShares DB Commodity Index Tracking Fund CM 3-Feb-06 0.85% 2,549 46 n.a. n.a. 0.01 6.3
Energy Cmdty DBE PowerShares DB Energy Fund AA 5-Jan-07 0.75% 165 3 n.a. n.a. 0.02 11.5
Crude Oil WTI USO United States Oil Fund LP PF 3-Apr-06 0.45% 2,863 242 n.a. n.a. 0.01 8.8
Natural Gas UNG United States Natural Gas Fund LP PF 18-Apr-07 1.11% 499 79 n.a. n.a. 0.01 13.2
Agriculture DBA PowerShares DB Agriculture Fund CM 5-Jan-07 0.85% 823 13 n.a. n.a. 0.01 5.0
Industrial Metals DBB PowerShares DB Base Metals Fund AA 5-Jan-07 0.75% 303 6 n.a. n.a. 0.01 7.4
Precious Metals DBP PowerShares DB Precious Metals Fund AA 5-Jan-07 0.75% 158 2 n.a. n.a. 0.03 8.3
Gold Physical GLD SPDR Gold Shares PF 18-Nov-04 0.40% 33,201 909 n.a. n.a. 0.01 0.9
Silver Physical SLV iShares Silver Trust PF 27-Apr-06 0.50% 5,983 110 n.a. n.a. 0.01 5.9
Platinum Physical PPLT ETFS Physical Platinum Shares AA 8-Jan-10 0.60% 547 5 n.a. n.a. 0.11 11.3
Palladium Physical PALL ETFS Physical Palladium Shares AA 8-Jan-10 0.60% 199 2 n.a. n.a. 0.15 19.7
Bull USD UUP PowerShares DB US Dollar Index Bullish Fund CM 20-Feb-07 0.80% 800 64 n.a. n.a. 0.01 3.8
JPYUSD FXY CurrencyShares Japanese Yen Trust PF 13-Feb-07 0.40% 126 21 n.a. n.a. 0.02 1.9
EURUSD FXE CurrencyShares Euro Currency Trust PF 12-Dec-05 0.40% 154 67 n.a. n.a. 0.01 1.0
Asset Class Ticker ETF NameProduct
TypeListing Date TER AUM $M
20D ADV
$M
Implied
Liq. $M
Total
Liq. $M
Avg. Bid/Ask Spreads
Source: Deutsche Bank, Bloomberg Finance LP, FactSet. Data as of 15-Feb-17. Bid/Ask Spreads are provided only as reference, actual spreads are trade-specific. Product Type: Asset Allocation (AA),Cash Management (CM), Pseudo Futures (PF).
Page 44 Deutsche Bank Securities Inc.
16 February 2017
US ETF Compass
Appendix C: DefinitionsETP Universe Definitions
Exchange-Traded Products (ETPs)We define an exchange-traded product (ETP) as a secure (funded or collateralized)open-ended exchange-traded equity with no embedded optionality and market-wide appeal to investors. This includes exchange traded funds (ETF), andexchange-traded vehicles (ETV). The vast majority of instruments are ETFs (~98%in AUM).
Exchange-Traded Funds (ETFs)ETFs are open-ended funds which are listed on an exchange and offer intra-daydual liquidity to access diversified investments in a transparent, cheap, and taxefficient way. ETFs indexed to equity and fixed income benchmarks are registeredunder the investment company act of 1940. Only physical index replicationtechniques are permissible by this legislation while synthetic replication is notallowed.
Exchange-traded vehicles (ETVs)This terminology typically refers to grantor trusts that exist in the US market.These instruments track primarily commodity benchmarks. They differ fromETFs in that they are registered under the Securities Act of 1933 and not theInvestment Company Act of 1940, hence they are not classed as funds. Vehiclesthat replicate commodity benchmarks, more often known as pools, and fundstargeting alternative index returns are formed under the Commodities ExchangeAct and are listed under the 33 Securities Act, and report under 34 Corporate Act.
Management Style or Product Strategy Definitions
BetaThis is the main group with the largest number of products and assets.Within this category we account for all those ETFs that track an index whichemploys a market capitalization weighting methodology, and a simple selectionmethodology usually involving screenings such as minimum market cap andliquidity levels, or profitability levels. ETFs in this group are also referred to as“plain-vanilla” ETFs. Some examples of indices falling within this category are:S&P 500, S&P 400, S&P 600, MSCI EAFE, MSCI EM, Russell 2000, and Russell1000, to name a few.
Beta+In this group we include every product that offers any level of leverage or inverseimplementation. For example, an ETF offering access to twice the daily returnsof the S&P 500 on either direction (long or short) would be classified under thiscategory.
ActiveClassifying products in this group is still easy; basically if the ETF doesn’t trackany index then we classify the fund as active.
Enhanced Beta (aka Smart Beta)This category is reserved for those ETFs that also track an index, but whichfollow more elaborated strategies. After defining an index universe, there aretwo main levers that determine most of the risk/return profile of the index: (1)
Deutsche Bank Securities Inc. Page 45
16 February 2017
US ETF Compass
the selection criteria, and (2) the weighting criteria. In their selection process,enhanced beta ETFs usually employ additional screening processes and scoringsystems involving multiple factors beyond just minimum market cap and liquiditylevels. For example, they could include growth or value scores, dividends paidor dividend yield, earnings, volatility, or momentum screens, to name a few. Theweighting methodology of enhanced beta ETFs is usually anything but marketcap weighted, it can include simple equal weighting or variations of it, optimizedweights, and other metric-specific weights such as those based on dividendspaid, inverse volatility, dividend yield, fundamental multi factor scores, earnings,and revenues, to name a few. An enhanced beta ETF will either have a non-traditional selection methodology, a non-traditional weighting methodology, or acombination of both.
Product Type Definitions
Asset Allocation ETFsThis group covers all ETFs with exception of levered and inverse products. Theseare usually good products for market access strategies, portfolio completion, andcore positions. They are also efficient building blocks for multi asset strategies.When selecting these products, major emphasis should be set on the desiredexposure, tracking efficiency, primary liquidity (i.e. the liquidity of the underlyingbasket), and cost.
Cash Management ETFsThis group covers a more selected group of ETFs which in addition to beinggood asset allocation tools, also serves a series of cash management portfolioneeds. For example, these products are very good for equitizing cash betweentransitions, around reporting periods (window dressing), and during tax lossharvesting. These ETFs usually have good liquidity, large fund size, and lowcost, all of which makes it easier to execute sizeable short-term transactions,therefore secondary market liquidity and fund size tend to be a more relevantfactor compared to asset allocation ETFs. The most popular asset allocation usageof these funds is as core building blocks.
Pseudo Futures ETFsThis group covers an even more selected sample of ETFs which in additionto being good asset allocation and cash management tools can also be usedfor fulfilling risk management functions such as risk hedging, portable alphastrategies, or tactical shorts. Many times they also trade at a cheaper level thantheir underlying basket, and offer large amounts of liquidity which can make themattractive for market making activities as well. Secondary and short liquidity (easeto borrow), and fund size tend to be more relevant characteristics at the momentof selecting this type of ETFs. There is usually no more than one pseudo futuresETF per asset class. The most popular asset allocation usage of these fundsis among portfolios that require more liquidity given their size or more tacticalnature.
Page 46 Deutsche Bank Securities Inc.
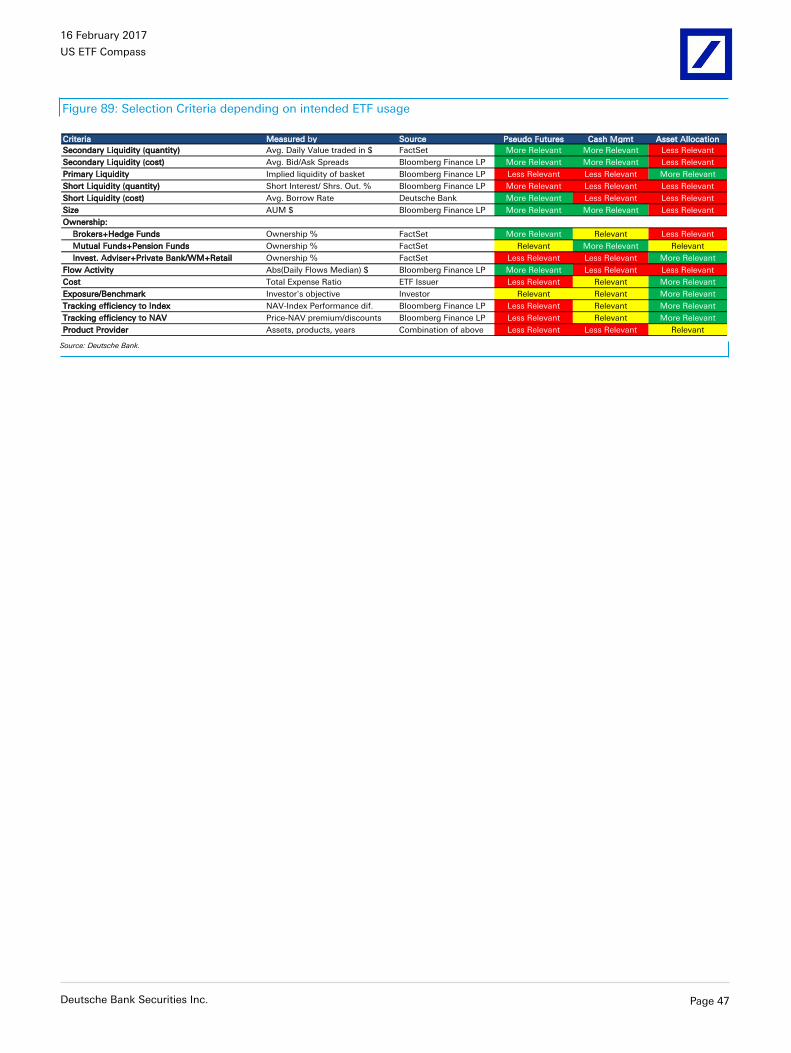
16 February 2017
US ETF Compass
Figure 89: Selection Criteria depending on intended ETF usage
Criteria Measured by Source Pseudo Futures Cash Mgmt Asset Allocation
Secondary Liquidity (quantity) Avg. Daily Value traded in $ FactSet More Relevant More Relevant Less Relevant
Secondary Liquidity (cost) Avg. Bid/Ask Spreads Bloomberg Finance LP More Relevant More Relevant Less Relevant
Primary Liquidity Implied liquidity of basket Bloomberg Finance LP Less Relevant Less Relevant More Relevant
Short Liquidity (quantity) Short Interest/ Shrs. Out. % Bloomberg Finance LP More Relevant Less Relevant Less Relevant
Short Liquidity (cost) Avg. Borrow Rate Deutsche Bank More Relevant Less Relevant Less Relevant
Size AUM $ Bloomberg Finance LP More Relevant More Relevant Less Relevant
Ownership:
Brokers+Hedge Funds Ownership % FactSet More Relevant Relevant Less Relevant
Mutual Funds+Pension Funds Ownership % FactSet Relevant More Relevant Relevant
Invest. Adviser+Private Bank/WM+Retail Ownership % FactSet Less Relevant Less Relevant More Relevant
Flow Activity Abs(Daily Flows Median) $ Bloomberg Finance LP More Relevant Less Relevant Less Relevant
Cost Total Expense Ratio ETF Issuer Less Relevant Relevant More Relevant
Exposure/Benchmark Investor's objective Investor Relevant Relevant More Relevant
Tracking efficiency to Index NAV-Index Performance dif. Bloomberg Finance LP Less Relevant Relevant More Relevant
Tracking efficiency to NAV Price-NAV premium/discounts Bloomberg Finance LP Less Relevant Relevant More Relevant
Product Provider Assets, products, years Combination of above Less Relevant Less Relevant Relevant
Source: Deutsche Bank.
Deutsche Bank Securities Inc. Page 47

16 February 2017
US ETF Compass
The authors of this report wish to acknowledge the contribution made by AlfonsoDelgado Valdivia, employee of Evalueserve, a third-party provider of offshoreresearch support services to Deutsche Bank.
Page 48 Deutsche Bank Securities Inc.
16 February 2017
US ETF Compass
Appendix 1
Important Disclosures
*Other information available upon request
*Prices are current as of the end of the previous trading session unless otherwise indicated and are sourced fromlocal exchanges via Reuters, Bloomberg, and other vendors. Other information is sourced from Deutsche Bank, subjectcompanies, and other sources. For disclosures pertaining to recommendations or estimates made on securities other thanthe primary subject of this research, please see the most recently published company report or visit our global disclosurelook-up page on our website at http://gm.db.com/ger/disclosure/DisclosureDirectory.eqsr. Aside from within this report,important conflict disclosures can also be found at https://gm/db.com/equities under the "Disclosures Lookup" and "Legal"tabs. Investors are strongly encouraged to review this information before investing.
Analyst Certification
The views expressed in this report accurately reflect the personal views of the undersigned lead analyst(s). In addition,the undersigned lead analyst(s) has not and will not receive any compensation for providing a specific recommendationor view in this report. Sebastian Mercado, Hallie Martin, Srineel Jalagani
Hypothetical Disclaimer
Backtested, hypothetical or simulated performance results have inherent limitations. Unlike an actual performancerecord based on trading actual client portfolios, simulated results are achieved by means of the retroactive applicationof a backtested model itself designed with the benefit of hindsight. Taking into account historical events the backtestingof performance also differs from actual account performance because an actual investment strategy may be adjustedany time, for any reason, including a response to material, economic or market factors. The backtested performanceincludes hypothetical results that do not reflect the reinvestment of dividends and other earnings or the deduction ofadvisory fees, brokerage or other commissions, and any other expenses that a client would have paid or actually paid.No representation is made that any trading strategy or account will or is likely to achieve profits or losses similar tothose shown. Alternative modeling techniques or assumptions might produce significantly different results and prove tobe more appropriate. Past hypothetical backtest results are neither an indicator nor guarantee of future returns. Actualresults will vary, perhaps materially, from the analysis.
Equity Rating Key Equity rating dispersion and banking relationships
Buy: Based on a current 12- month view of total share-holderreturn (TSR = percentage change in share price from currentprice to projected target price plus pro-jected dividend yield ) ,we recommend that investors buy the stock.Sell: Based on a current 12-month view of total share-holderreturn, we recommend that investors sell the stock.Hold: We take a neutral view on the stock 12-months out and,based on this time horizon, do not recommend either a Buyor Sell.
Newly issued research recommendations and target pricessupersede previously published research.
Regulatory Disclosures
1.Additional Information
Deutsche Bank Securities Inc. Page 49

16 February 2017
US ETF Compass
Information on ETFs is provided strictly for illustrative purposes and should not be deemed an offer to sell or asolicitation of an offer to buy shares of any fund that is described in this document. Consider carefully any fund'sinvestment objectives, risk factors, and charges and expenses before investing. This and other information can be foundin the fund's prospectus. Prospectuses about db X-trackers funds and Powershares DB funds can be obtained by calling1-877-369-4617 or by visiting www.DBXUS.com. Read prospectuses carefully before investing. Past performance is notnecessarily indicative of future results. Investing involves risk, including possible loss of principal. To better understandthe similarities and differences between investments, including investment objectives, risks, fees and expenses, it isimportant to read the products' prospectuses. Shares of ETFs may be sold throughout the day on an exchange throughany brokerage account. However, shares may only be redeemed directly from an ETF by authorized participants, in verylarge creation/redemption units. Transactions in shares of ETFs will result in brokerage commissions and will generatetax consequences. ETFs are obliged to distribute portfolio gains to shareholders. Deutsche Bank may be an issuer,advisor, manager, distributor or administrator of, or provide other services to, an ETF included in this report, for which itreceives compensation. db X-trackers and Powershares DB funds are distributed by ALPS Distributors, Inc. The opinionsexpressed are those of the authors and do not necessarily reflect the views of DB, ALPS or their affiliates.
Aside from within this report, important conflict disclosures can also be found at https://gm.db.com/equities under the"Disclosures Lookup" and "Legal" tabs. Investors are strongly encouraged to review this information before investing.
Page 50 Deutsche Bank Securities Inc.
16 February 2017
US ETF Compass
Additional Information?The information and opinions in this report were prepared by Deutsche Bank AG or one of its affiliates (collectively"Deutsche Bank"). Though the information herein is believed to be reliable and has been obtained from public sourcesbelieved to be reliable, Deutsche Bank makes no representation as to its accuracy or completeness.
If you use the services of Deutsche Bank in connection with a purchase or sale of a security that is discussed in this report,or is included or discussed in another communication (oral or written) from a Deutsche Bank analyst, Deutsche Bank mayact as principal for its own account or as agent for another person.
Deutsche Bank may consider this report in deciding to trade as principal. It may also engage in transactions, for itsown account or with customers, in a manner inconsistent with the views taken in this research report. Others withinDeutsche Bank, including strategists, sales staff and other analysts, may take views that are inconsistent with those takenin this research report. Deutsche Bank issues a variety of research products, including fundamental analysis, equity-linkedanalysis, quantitative analysis and trade ideas. Recommendations contained in one type of communication may differfrom recommendations contained in others, whether as a result of differing time horizons, methodologies or otherwise.Deutsche Bank and/or its affiliates may also be holding debt or equity securities of the issuers it writes on. Analysts arepaid in part based on the profitability of Deutsche Bank AG and its affiliates, which includes investment banking, tradingand principal trading revenues.
Opinions, estimates and projections constitute the current judgment of the author as of the date of this report. They donot necessarily reflect the opinions of Deutsche Bank and are subject to change without notice. Deutsche Bank providesliquidity for buyers and sellers of securities issued by the companies it covers. Deutsche Bank research analysts sometimeshave shorter-term trade ideas that are consistent or inconsistent with Deutsche Bank's existing longer term ratings. Tradeideas for equities can be found at the SOLAR link at http://gm.db.com. A SOLAR idea represents a high conviction beliefby an analyst that a stock will outperform or underperform the market and/or sector delineated over a time frame of noless than two weeks. In addition to SOLAR ideas, the analysts named in this report may from time to time discuss withour clients, Deutsche Bank salespersons and Deutsche Bank traders, trading strategies or ideas that reference catalystsor events that may have a near-term or medium-term impact on the market price of the securities discussed in this report,which impact may be directionally counter to the analysts' current 12-month view of total return or investment return asdescribed herein. Deutsche Bank has no obligation to update, modify or amend this report or to otherwise notify a recipientthereof if any opinion, forecast or estimate contained herein changes or subsequently becomes inaccurate. Coverage andthe frequency of changes in market conditions and in both general and company specific economic prospects make itdifficult to update research at defined intervals. Updates are at the sole discretion of the coverage analyst concerned or ofthe Research Department Management and as such the majority of reports are published at irregular intervals. This reportis provided for informational purposes only and does not take into account the particular investment objectives, financialsituations, or needs of individual clients. It is not an offer or a solicitation of an offer to buy or sell any financial instrumentsor to participate in any particular trading strategy. Target prices are inherently imprecise and a product of the analyst’sjudgment. The financial instruments discussed in this report may not be suitable for all investors and investors must maketheir own informed investment decisions. Prices and availability of financial instruments are subject to change withoutnotice and investment transactions can lead to losses as a result of price fluctuations and other factors. If a financialinstrument is denominated in a currency other than an investor's currency, a change in exchange rates may adverselyaffect the investment. Past performance is not necessarily indicative of future results. Unless otherwise indicated, pricesare current as of the end of the previous trading session, and are sourced from local exchanges via Reuters, Bloombergand other vendors. Data is sourced from Deutsche Bank, subject companies, and in some cases, other parties.
The Deutsche Bank Research Department is independent of other business areas divisions of the Bank. Details regardingour organizational arrangements and information barriers we have to prevent and avoid conflicts of interest with respectto our research is available on our website under Disclaimer found on the Legal tab.??Macroeconomic fluctuations often account for most of the risks associated with exposures to instruments that promiseto pay fixed or variable interest rates. For an investor who is long fixed rate instruments (thus receiving these cash flows),increases in interest rates naturally lift the discount factors applied to the expected cash flows and thus cause a loss.
Deutsche Bank Securities Inc. Page 51

16 February 2017
US ETF Compass
The longer the maturity of a certain cash flow and the higher the move in the discount factor, the higher will be theloss. Upside surprises in inflation, fiscal funding needs, and FX depreciation rates are among the most common adversemacroeconomic shocks to receivers. But counterparty exposure, issuer creditworthiness, client segmentation, regulation(including changes in assets holding limits for different types of investors), changes in tax policies, currency convertibility(which may constrain currency conversion, repatriation of profits and/or the liquidation of positions), and settlement issuesrelated to local clearing houses are also important risk factors to be considered. The sensitivity of fixed income instrumentsto macroeconomic shocks may be mitigated by indexing the contracted cash flows to inflation, to FX depreciation, or tospecified interest rates – these are common in emerging markets. It is important to note that the index fixings may -- byconstruction -- lag or mis-measure the actual move in the underlying variables they are intended to track. The choice of theproper fixing (or metric) is particularly important in swaps markets, where floating coupon rates (i.e., coupons indexed toa typically short-dated interest rate reference index) are exchanged for fixed coupons. It is also important to acknowledgethat funding in a currency that differs from the currency in which coupons are denominated carries FX risk. Naturally,options on swaps (swaptions) also bear the risks typical to options in addition to the risks related to rates movements.??Derivative transactions involve numerous risks including, among others, market, counterparty default and illiquidity risk.The appropriateness or otherwise of these products for use by investors is dependent on the investors' own circumstancesincluding their tax position, their regulatory environment and the nature of their other assets and liabilities, and as such,investors should take expert legal and financial advice before entering into any transaction similar to or inspired by thecontents of this publication. The risk of loss in futures trading and options, foreign or domestic, can be substantial. As aresult of the high degree of leverage obtainable in futures and options trading, losses may be incurred that are greaterthan the amount of funds initially deposited. Trading in options involves risk and is not suitable for all investors. Priorto buying or selling an option investors must review the "Characteristics and Risks of Standardized Options”, at http://www.optionsclearing.com/about/publications/character-risks.jsp. If you are unable to access the website please contactyour Deutsche Bank representative for a copy of this important document.?
Participants in foreign exchange transactions may incur risks arising from several factors, including the following: ( i)exchange rates can be volatile and are subject to large fluctuations; ( ii) the value of currencies may be affected bynumerous market factors, including world and national economic, political and regulatory events, events in equity anddebt markets and changes in interest rates; and (iii) currencies may be subject to devaluation or government imposedexchange controls which could affect the value of the currency. Investors in securities such as ADRs, whose values areaffected by the currency of an underlying security, effectively assume currency risk.?
Unless governing law provides otherwise, all transactions should be executed through the Deutsche Bank entity in theinvestor's home jurisdiction. Aside from within this report, important conflict disclosures can also be found at https://gm.db.com/equities under the "Disclosures Lookup" and "Legal" tabs. Investors are strongly encouraged to review thisinformation before investing.??United States: Approved and/or distributed by Deutsche Bank Securities Incorporated, a member of FINRA, NFA and SIPC.Analysts located outside of the United States are employed by non-US affiliates that are not subject to FINRA regulations.
Germany: Approved and/or distributed by Deutsche Bank AG, a joint stock corporation with limited liability incorporatedin the Federal Republic of Germany with its principal office in Frankfurt am Main. Deutsche Bank AG is authorized underGerman Banking Law and is subject to supervision by the European Central Bank and by BaFin, Germany’s FederalFinancial Supervisory Authority.
United Kingdom: Approved and/or distributed by Deutsche Bank AG acting through its London Branch at WinchesterHouse, 1 Great Winchester Street, London EC2N 2DB. Deutsche Bank AG in the United Kingdom is authorised by thePrudential Regulation Authority and is subject to limited regulation by the Prudential Regulation Authority and FinancialConduct Authority. Details about the extent of our authorisation and regulation are available on request.??Hong Kong: Distributed by Deutsche Bank AG, Hong Kong Branch.??
Page 52 Deutsche Bank Securities Inc.

16 February 2017
US ETF Compass
India: Prepared by Deutsche Equities India Pvt Ltd, which is registered by the Securities and Exchange Board of India (SEBI)as a stock broker. Research Analyst SEBI Registration Number is INH000001741. DEIPL may have received administrativewarnings from the SEBI for breaches of Indian regulations.
Japan: Approved and/or distributed by Deutsche Securities Inc.(DSI). Registration number - Registered as a financialinstruments dealer by the Head of the Kanto Local Finance Bureau (Kinsho) No. 117. Member of associations: JSDA, TypeII Financial Instruments Firms Association and The Financial Futures Association of Japan. Commissions and risks involvedin stock transactions - for stock transactions, we charge stock commissions and consumption tax by multiplying thetransaction amount by the commission rate agreed with each customer. Stock transactions can lead to losses as a resultof share price fluctuations and other factors. Transactions in foreign stocks can lead to additional losses stemming fromforeign exchange fluctuations. We may also charge commissions and fees for certain categories of investment advice,products and services. Recommended investment strategies, products and services carry the risk of losses to principaland other losses as a result of changes in market and/or economic trends, and/or fluctuations in market value. Beforedeciding on the purchase of financial products and/or services, customers should carefully read the relevant disclosures,prospectuses and other documentation. "Moody's", "Standard & Poor's", and "Fitch" mentioned in this report are notregistered credit rating agencies in Japan unless Japan or "Nippon" is specifically designated in the name of the entity.Reports on Japanese listed companies not written by analysts of DSI are written by Deutsche Bank Group's analysts withthe coverage companies specified by DSI. Some of the foreign securities stated on this report are not disclosed accordingto the Financial Instruments and Exchange Law of Japan. Target prices set by Deutsche Bank's equity analysts are basedon a 12-month forecast period.
Korea: Distributed by Deutsche Securities Korea Co.?
South Africa: Deutsche Bank AG Johannesburg is incorporated in the Federal Republic of Germany (Branch RegisterNumber in South Africa: 1998/003298/10).??Singapore: by Deutsche Bank AG, Singapore Branch or Deutsche Securities Asia Limited, Singapore Branch (One RafflesQuay #18-00 South Tower Singapore 048583, +65 6423 8001), which may be contacted in respect of any matters arisingfrom, or in connection with, this report. Where this report is issued or promulgated in Singapore to a person who is not anaccredited investor, expert investor or institutional investor (as defined in the applicable Singapore laws and regulations),they accept legal responsibility to such person for its contents.
Taiwan: Information on securities/investments that trade in Taiwan is for your reference only. Readers shouldindependently evaluate investment risks and are solely responsible for their investment decisions. Deutsche Bank researchmay not be distributed to the Taiwan public media or quoted or used by the Taiwan public media without written consent.Information on securities/instruments that do not trade in Taiwan is for informational purposes only and is not to beconstrued as a recommendation to trade in such securities/instruments. Deutsche Securities Asia Limited, Taipei Branchmay not execute transactions for clients in these securities/instruments.??Qatar: Deutsche Bank AG in the Qatar Financial Centre (registered no. 00032) is regulated by the Qatar Financial CentreRegulatory Authority. Deutsche Bank AG - QFC Branch may only undertake the financial services activities that fall withinthe scope of its existing QFCRA license. Principal place of business in the QFC: Qatar Financial Centre, Tower, WestBay, Level 5, PO Box 14928, Doha, Qatar. This information has been distributed by Deutsche Bank AG. Related financialproducts or services are only available to Business Customers, as defined by the Qatar Financial Centre RegulatoryAuthority.
Russia: This information, interpretation and opinions submitted herein are not in the context of, and do not constitute,any appraisal or evaluation activity requiring a license in the Russian Federation.
?Kingdom of Saudi Arabia: Deutsche Securities Saudi Arabia LLC Company, (registered no. 07073-37) is regulated bythe Capital Market Authority. Deutsche Securities Saudi Arabia may only undertake the financial services activities thatfall within the scope of its existing CMA license. Principal place of business in Saudi Arabia: King Fahad Road, Al OlayaDistrict, P.O. Box 301809, Faisaliah Tower - 17th Floor, 11372 Riyadh, Saudi Arabia.??
Deutsche Bank Securities Inc. Page 53
16 February 2017
US ETF Compass
United Arab Emirates: Deutsche Bank AG in the Dubai International Financial Centre (registered no. 00045) is regulatedby the Dubai Financial Services Authority. Deutsche Bank AG - DIFC Branch may only undertake the financial servicesactivities that fall within the scope of its existing DFSA license. Principal place of business in the DIFC: Dubai InternationalFinancial Centre, The Gate Village, Building 5, PO Box 504902, Dubai, U.A.E. This information has been distributed byDeutsche Bank AG. Related financial products or services are only available to Professional Clients, as defined by theDubai Financial Services Authority.
Australia: Retail clients should obtain a copy of a Product Disclosure Statement (PDS) relating to any financial productreferred to in this report and consider the PDS before making any decision about whether to acquire the product. Pleaserefer to Australian specific research disclosures and related information at https://australia.db.com/australia/content/research-information.html??Australia and New Zealand: This research is intended only for "wholesale clients" within the meaning of the AustralianCorporations Act and New Zealand Financial Advisors Act respectively.?
Additional information relative to securities, other financial products or issuers discussed in this report is available uponrequest. This report may not be reproduced, distributed or published without Deutsche Bank's prior written consent.??Copyright © 2017 Deutsche Bank AG
Page 54 Deutsche Bank Securities Inc.
David Folkerts-LandauGroup Chief Economist and Global Head of Research
Raj HindochaGlobal Chief Operating Officer
Research
Michael SpencerHead of APAC Research
Global Head of Economics
Steve PollardHead of Americas Research
Global Head of Equity Research
Anthony KlarmanGlobal Head ofDebt Research
Paul ReynoldsHead of EMEA
Equity Research
Dave ClarkHead of APAC
Equity Research
Pam FinelliGlobal Head of
Equity Derivatives Research
Andreas NeubauerHead of Research - Germany
Stuart KirkHead of Thematic Research
International locations
Deutsche Bank AGDeutsche Bank PlaceLevel 16Corner of Hunter & Phillip StreetsSydney, NSW 2000AustraliaTel: (61) 2 8258 1234
Deutsche Bank AGGroße Gallusstraße 10-1460272 Frankfurt am MainGermanyTel: (49) 69 910 00
Deutsche Bank AGFiliale HongkongInternational Commerce Centre,1 Austin Road West,Kowloon,Hong KongTel: (852) 2203 8888
Deutsche Securities Inc.2-11-1 NagatachoSanno Park TowerChiyoda-ku, Tokyo 100-6171JapanTel: (81) 3 5156 6770
Deutsche Bank AG London1 Great Winchester StreetLondon EC2N 2EQUnited KingdomTel: (44) 20 7545 8000
Deutsche Bank Securities Inc.60 Wall StreetNew York, NY 10005United States of AmericaTel: (1) 212 250 2500