Embed Size (px)
Citation preview
U.S., Florida & Orange County Economic Update
2018 Economic Summit
Orlando, FL January 19th, 2018
Year One Trump Administration
How are the policies of the Trump administration impacting the U.S. economic outlook? Is Trump “lifting us up where
we belong?”

Year One Trump Administration

Year One Trump Administration
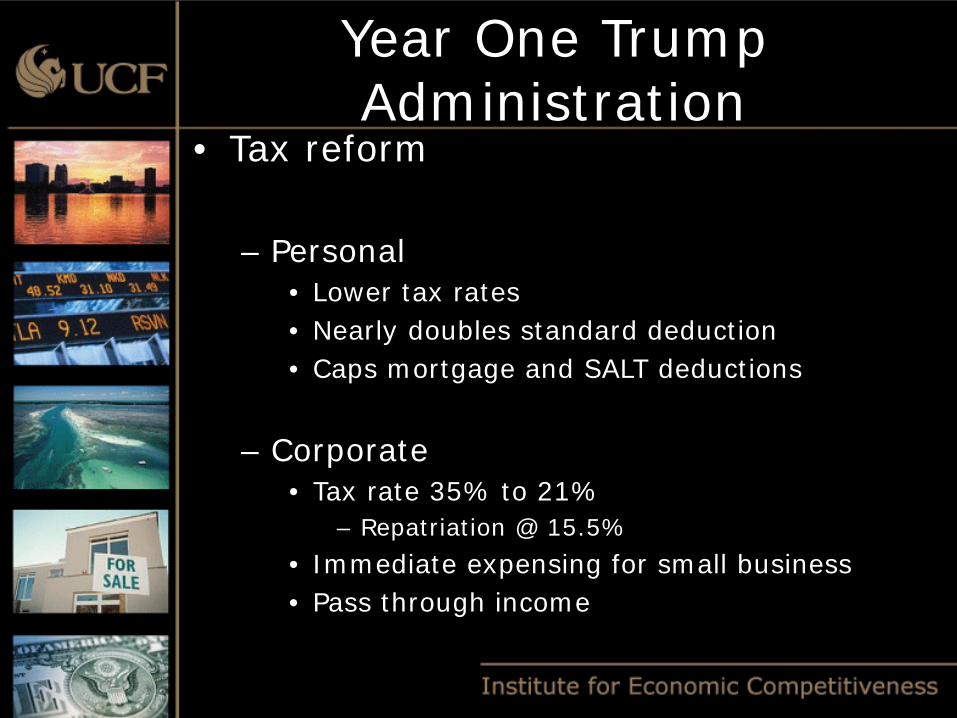
• Tax reform – Personal
• Lower tax rates • Nearly doubles standard deduction • Caps mortgage and SALT deductions
– Corporate
• Tax rate 35% to 21% – Repatriation @ 15.5%
• Immediate expensing for small business • Pass through income
Year One Trump Administration
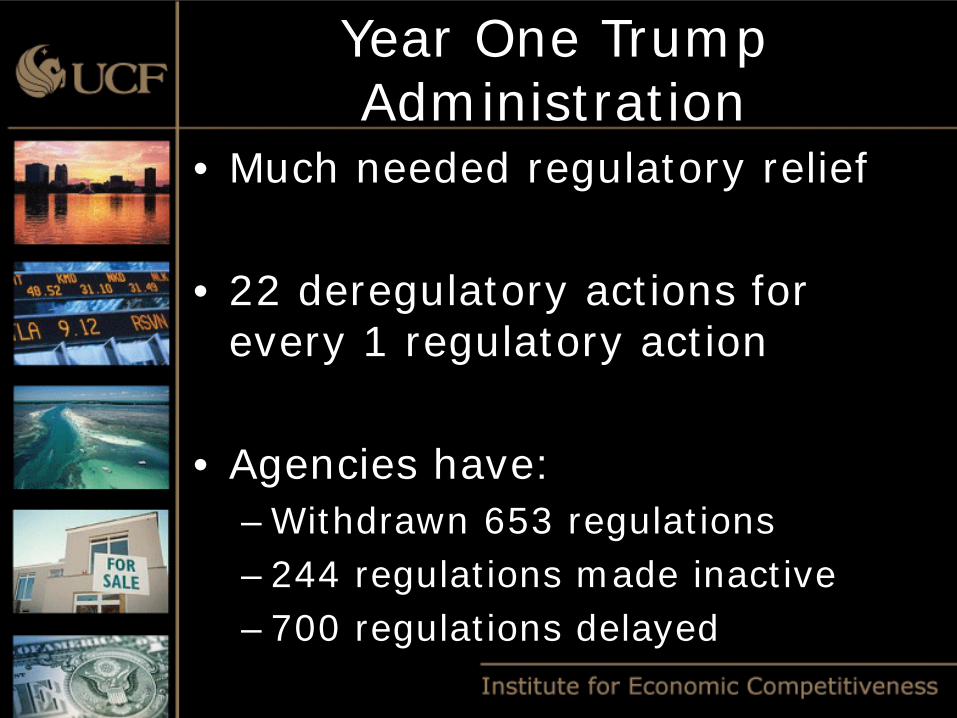
• Much needed regulatory relief
• 22 deregulatory actions for every 1 regulatory action
• Agencies have: – Withdrawn 653 regulations – 244 regulations made inactive – 700 regulations delayed
Year One Trump Administration
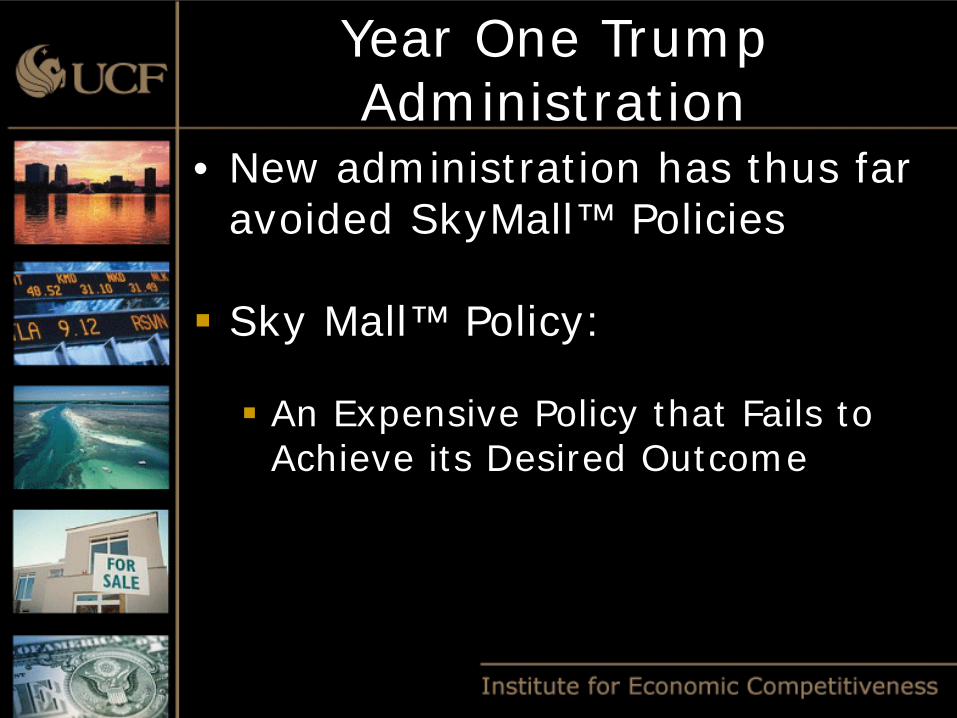
• New administration has thus far avoided SkyMall™ Policies Sky Mall™ Policy:
An Expensive Policy that Fails to
Achieve its Desired Outcome
Year One Trump Administration
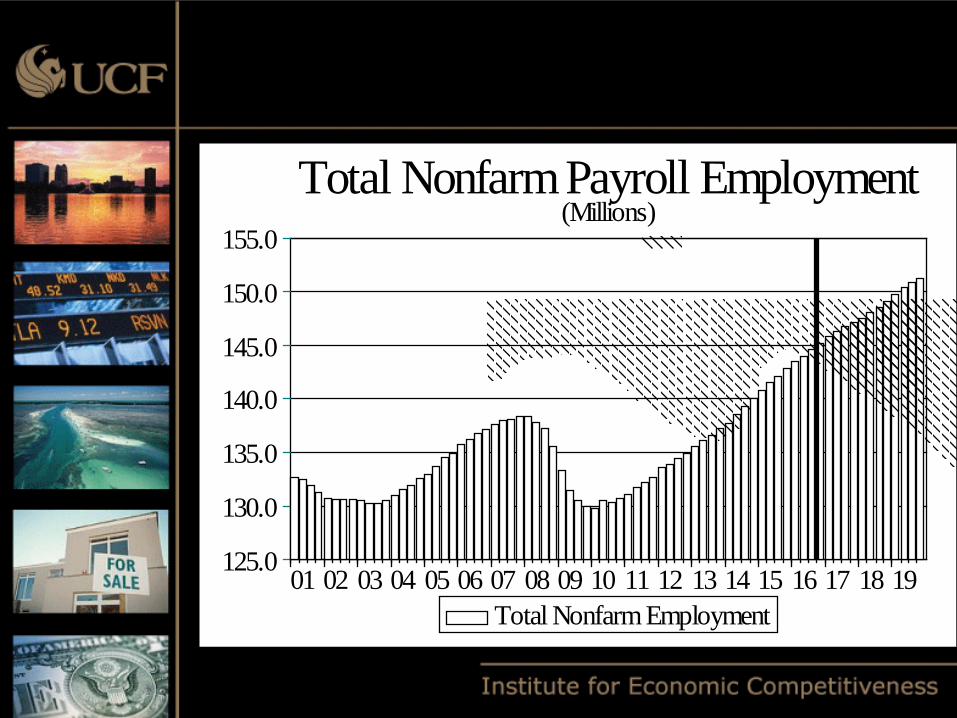
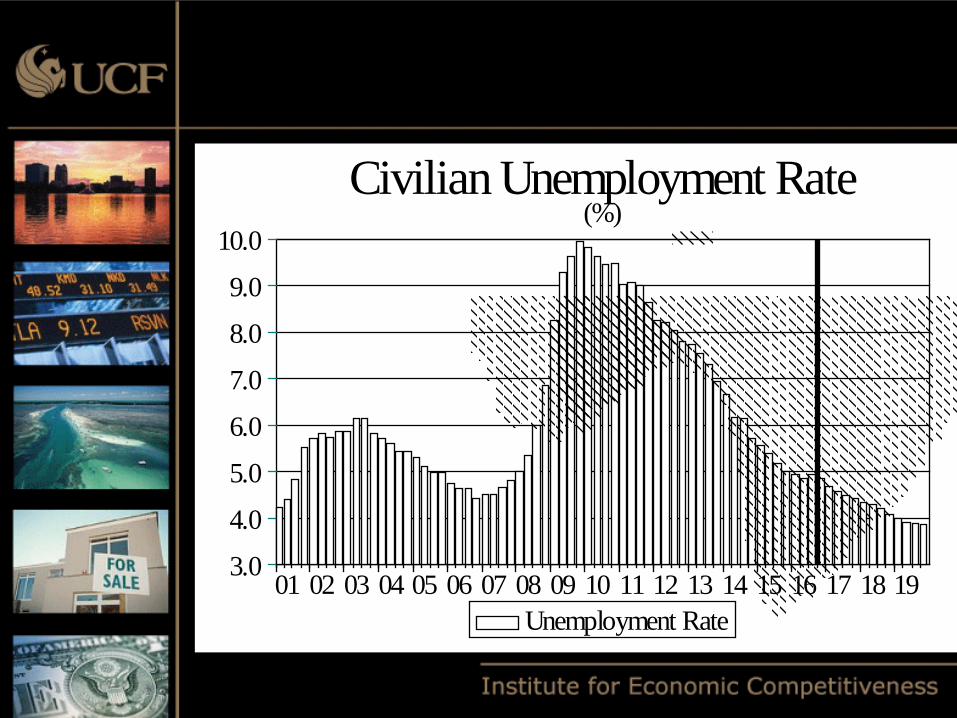
U.S. Forecast


19181716151413121110090807060504030201
155.0
150.0
145.0
140.0
135.0
130.0
125.0
Total Nonfarm Payroll Employment(Millions)
Total Nonfarm Employment
19181716151413121110090807060504030201
10.0
9.0
8.0
7.0
6.0
5.0
4.0
3.0
Civilian Unemployment Rate(%)
Unemployment Rate
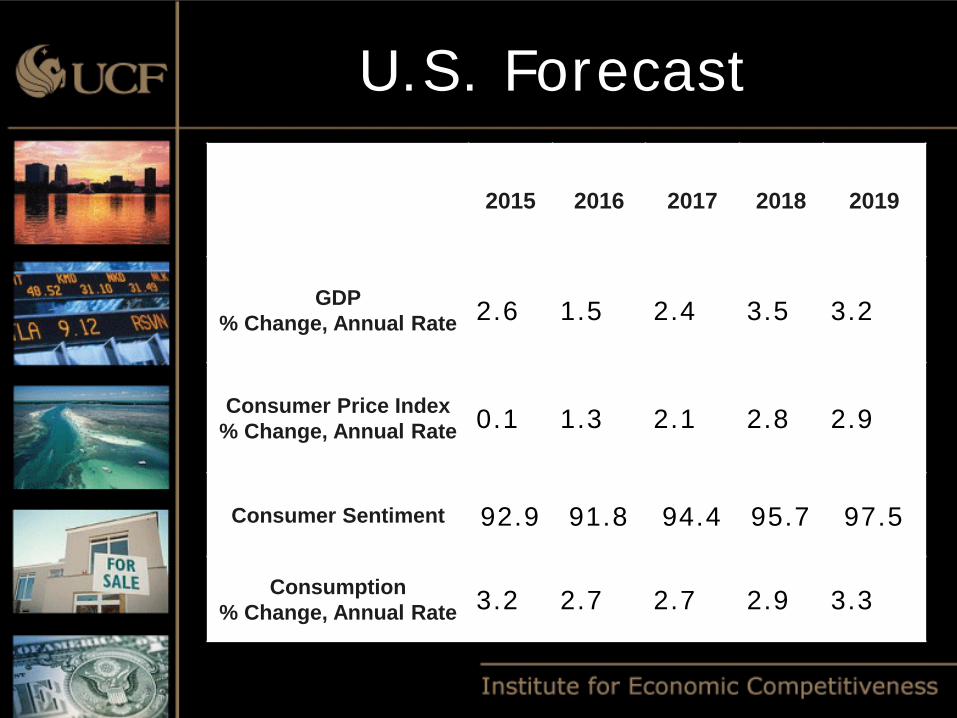
2015 2016 2017 2018 2019
GDP % Change, Annual Rate 2.6 1.5 2.4 3.5 3.2
Consumer Price Index % Change, Annual Rate 0.1 1.3 2.1 2.8 2.9
Consumer Sentiment 92.9 91.8 94.4 95.7 97.5
Consumption % Change, Annual Rate 3.2 2.7 2.7 2.9 3.3
U.S. Forecast
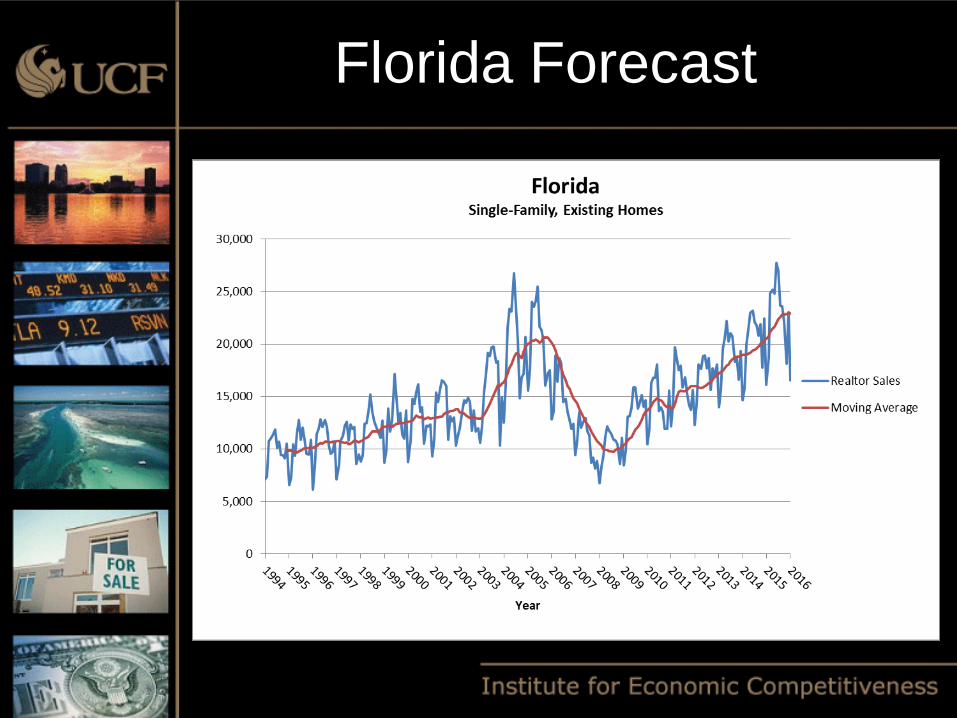
Florida Forecast
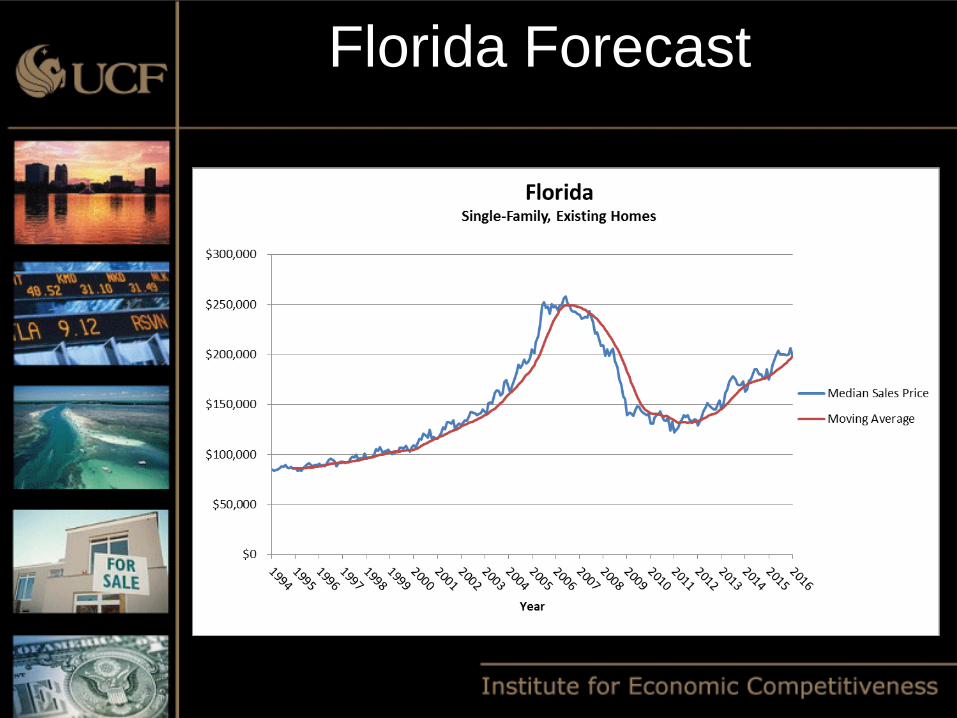
Florida Forecast

November 2017 November 2016 Percent change
Closed Sales 19,990 19,725 1.3%
Median Sale Price $240,000 $220,000 9.1%
Median Days on Market 46 43 7.0%
Inventory (Months Supply) 3.8 4.1 -7.3%
Florida Housing Market
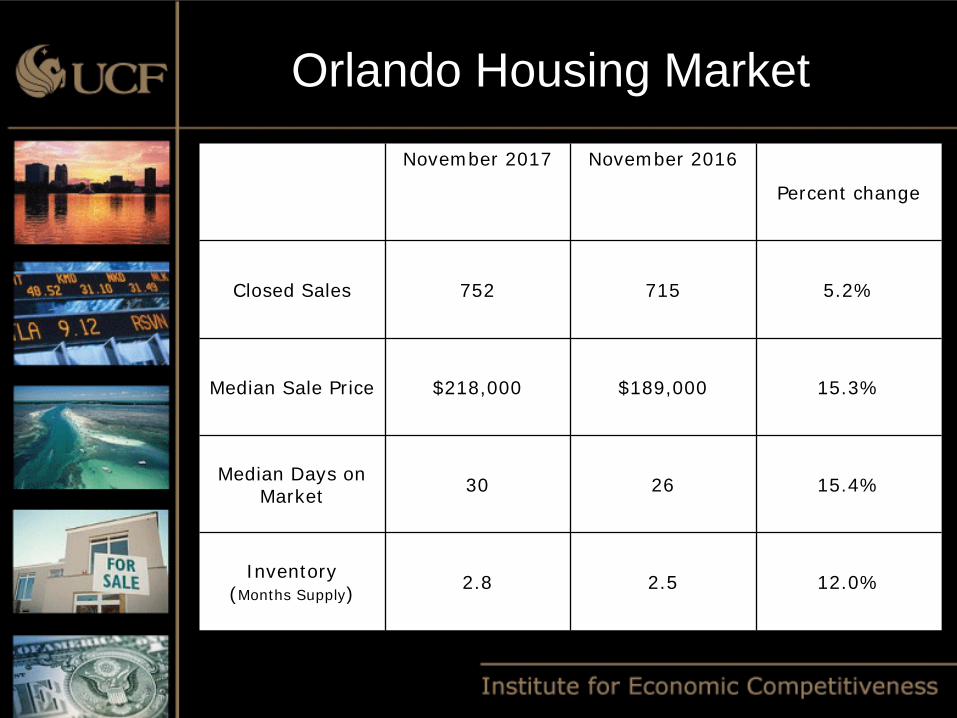
November 2017 November 2016 Percent change
Closed Sales 752 715 5.2%
Median Sale Price $218,000 $189,000 15.3%
Median Days on Market 30 26 15.4%
Inventory (Months Supply) 2.8 2.5 12.0%
Orlando Housing Market
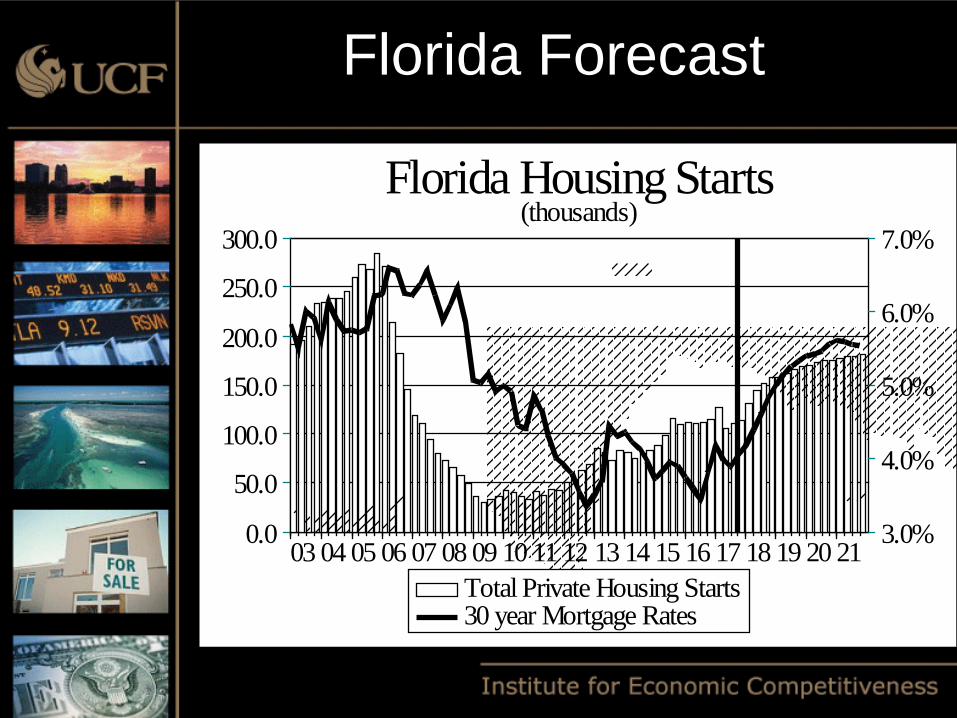
Florida Forecast
21201918171615141312111009080706050403
300.0
250.0
200.0
150.0
100.0
50.0
0.0
7.0%
6.0%
5.0%
4.0%
3.0%
Florida Housing Starts(thousands)
Total Private Housing Starts30 year Mortgage Rates
Florida Forecast
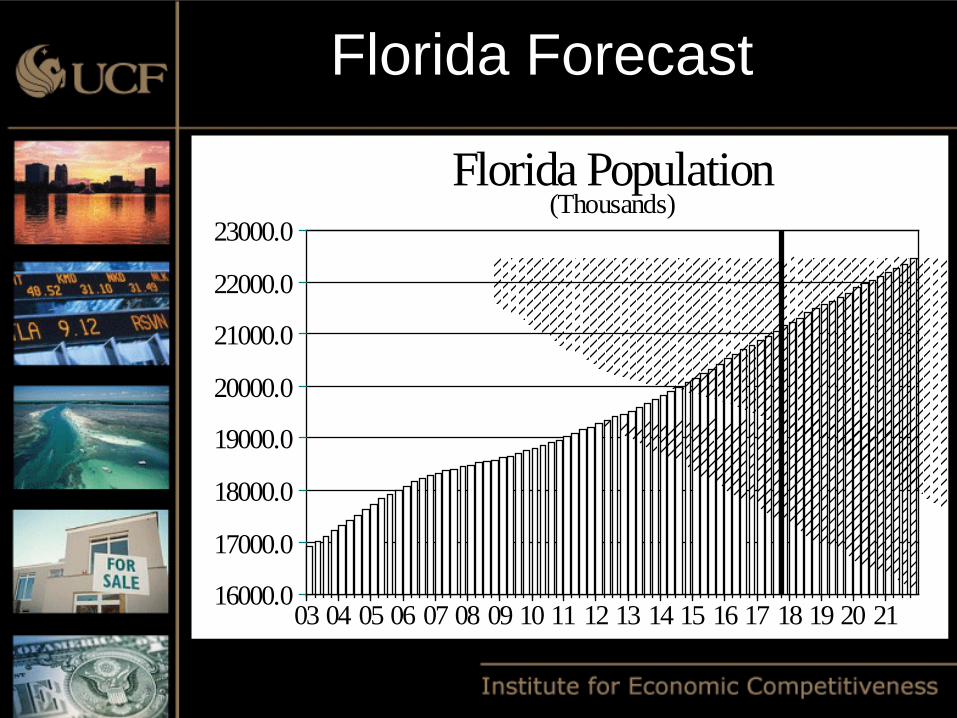
21201918171615141312111009080706050403
23000.0
22000.0
21000.0
20000.0
19000.0
18000.0
17000.0
16000.0
Florida Population(Thousands)
Florida Forecast
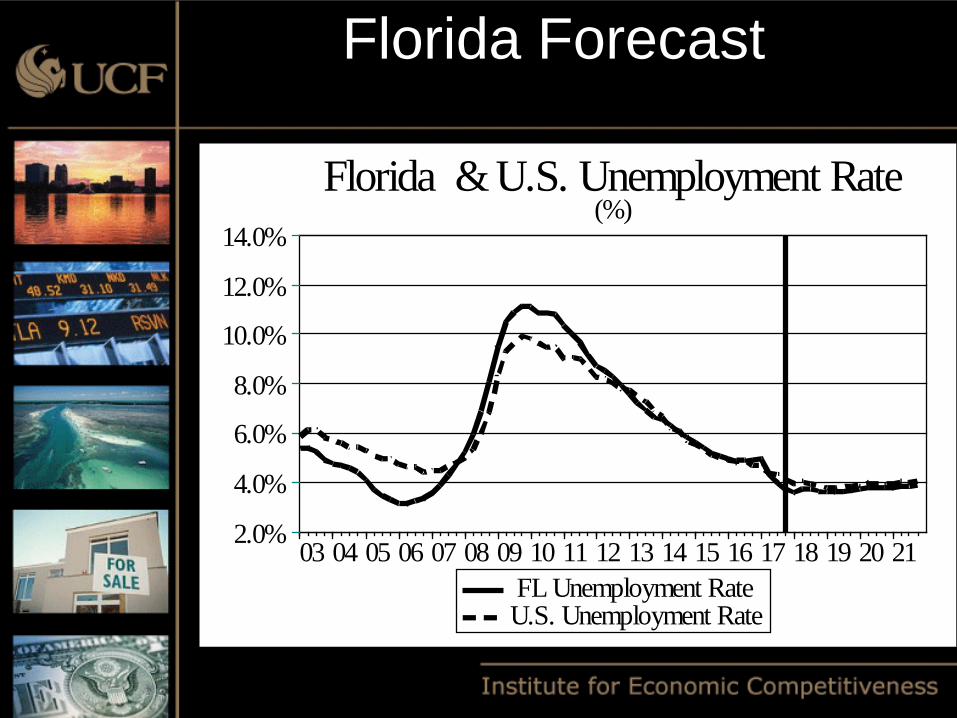
21201918171615141312111009080706050403
14.0%
12.0%
10.0%
8.0%
6.0%
4.0%
2.0%
Florida & U.S. Unemployment Rate(%)
FL Unemployment RateU.S. Unemployment Rate
Florida Forecast
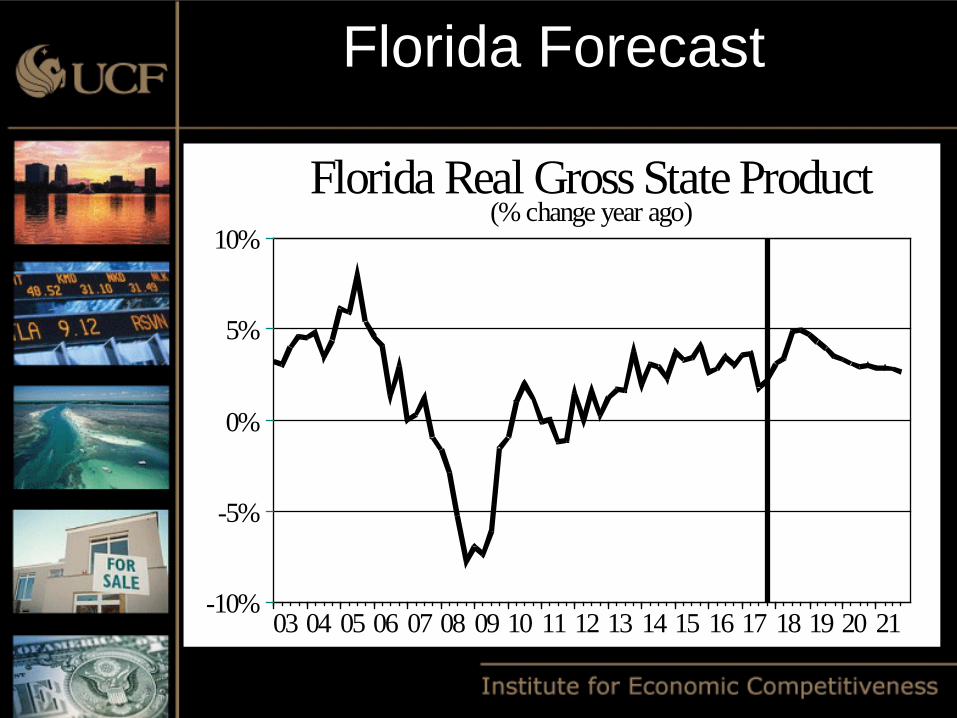
21201918171615141312111009080706050403
10%
5%
0%
-5%
-10%
Florida Real Gross State Product(% change year ago)
Florida Forecast
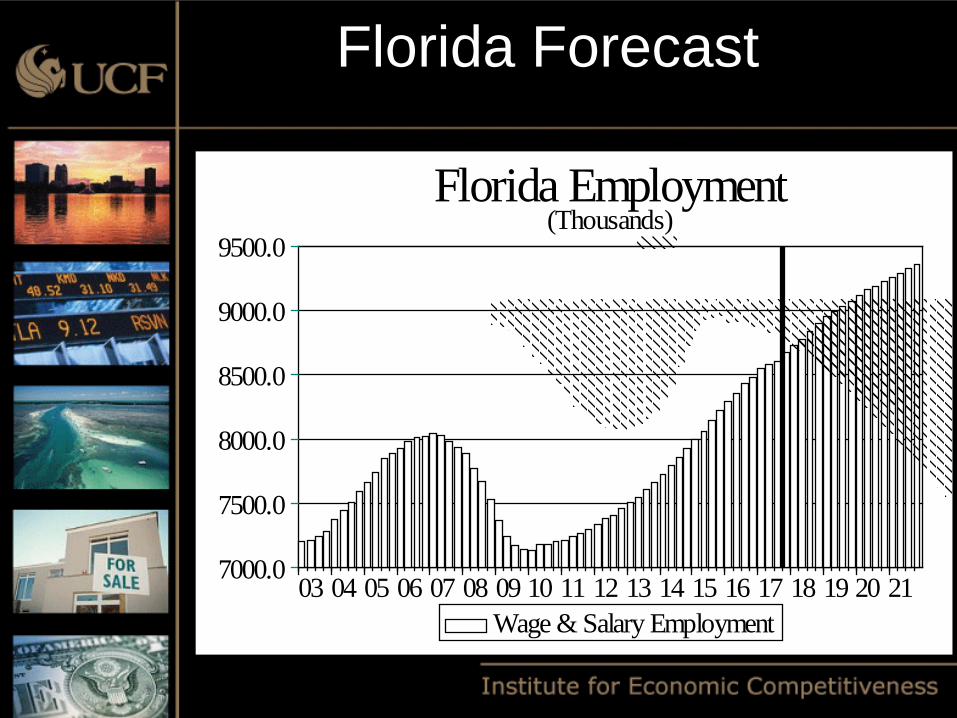
21201918171615141312111009080706050403
9500.0
9000.0
8500.0
8000.0
7500.0
7000.0
Florida Employment(Thousands)
Wage & Salary Employment
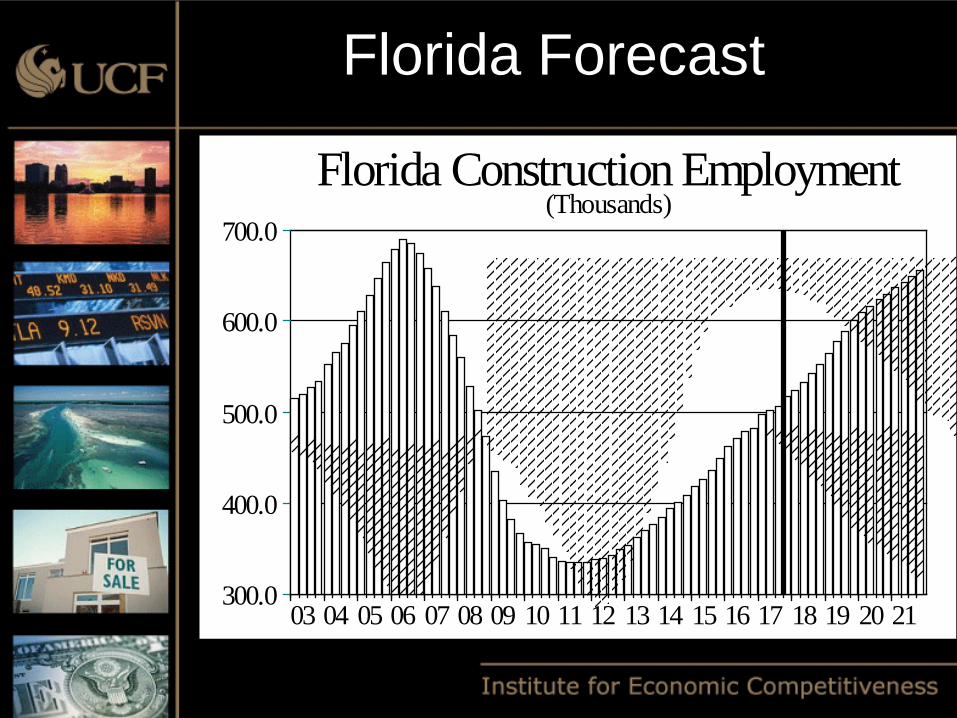
Florida Forecast
21201918171615141312111009080706050403
700.0
600.0
500.0
400.0
300.0
Florida Construction Employment(Thousands)
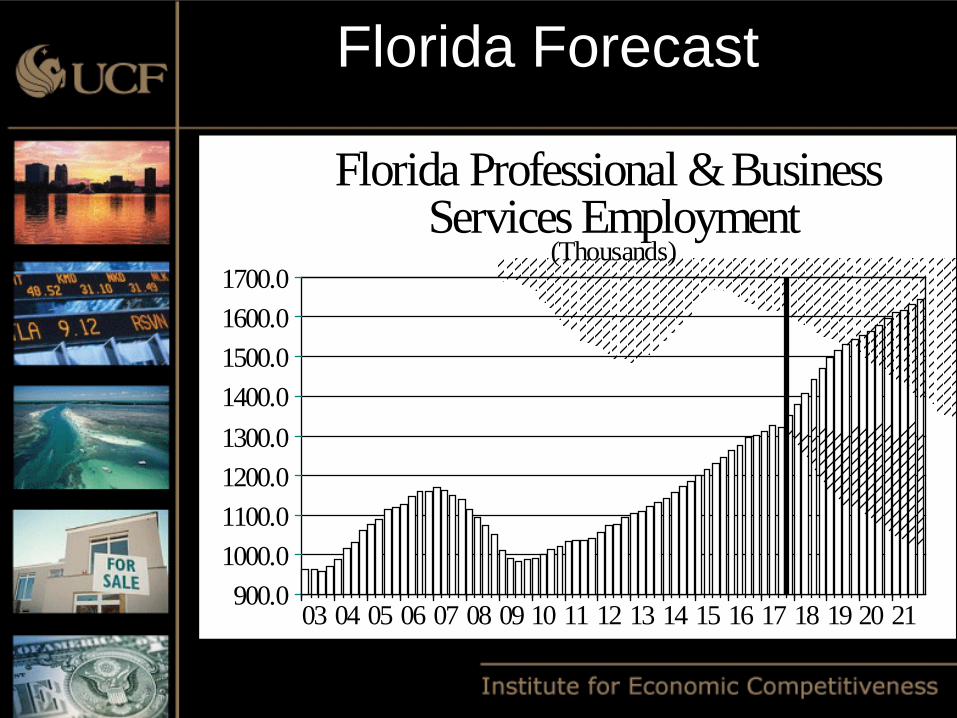
Florida Forecast
21201918171615141312111009080706050403
1700.01600.01500.01400.01300.01200.01100.01000.0900.0
Florida Professional & Business Services Employment
(Thousands)
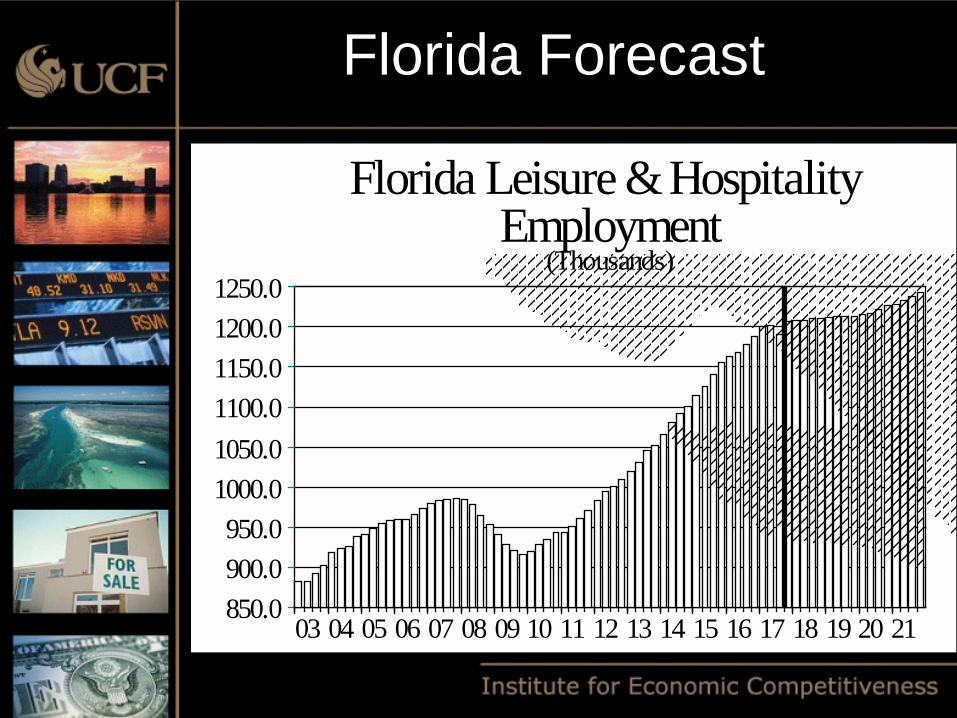
Florida Forecast
21201918171615141312111009080706050403
1250.01200.01150.01100.01050.01000.0950.0900.0850.0
Florida Leisure & Hospitality Employment
(Thousands)
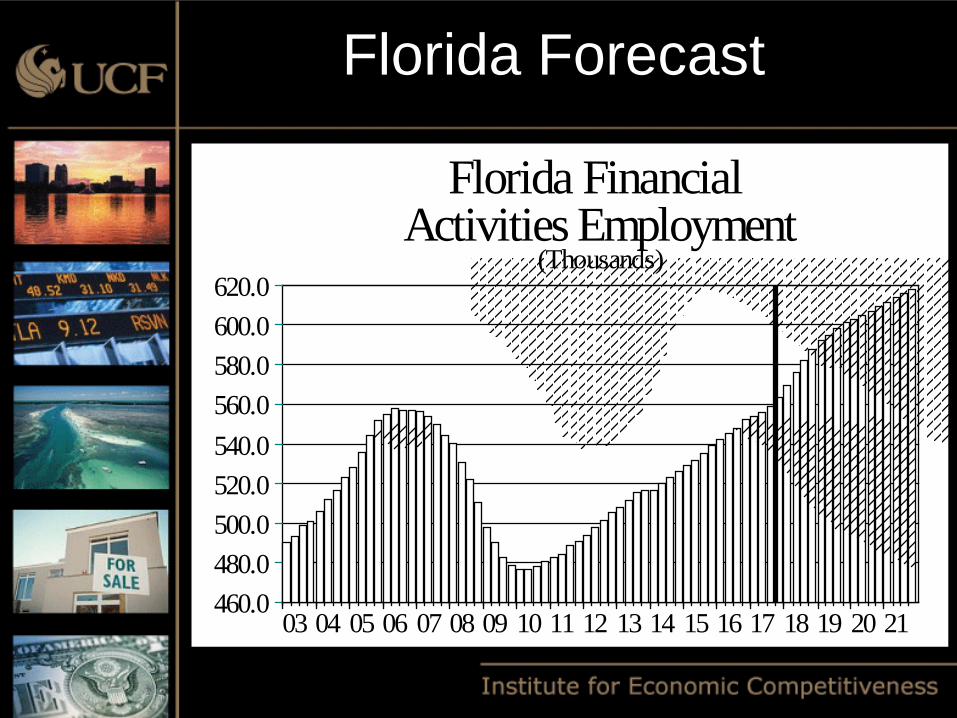
Florida Forecast
21201918171615141312111009080706050403
620.0600.0580.0560.0540.0520.0500.0480.0460.0
Florida Financial Activities Employment
(Thousands)
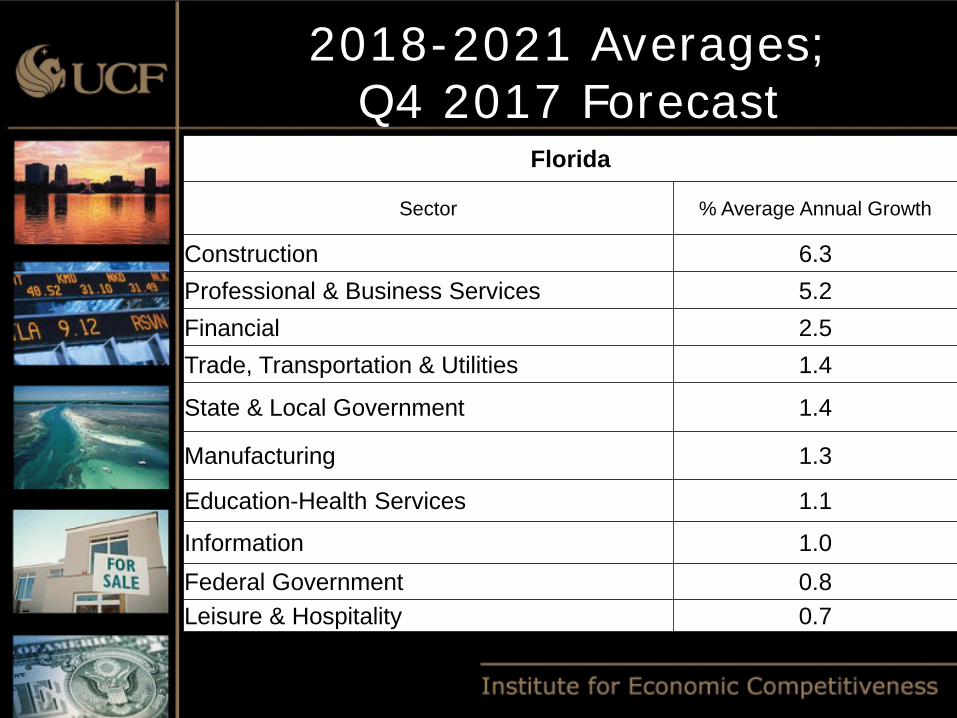
2018-2021 Averages; Q4 2017 Forecast
Florida
Sector % Average Annual Growth
Construction 6.3 Professional & Business Services 5.2 Financial 2.5 Trade, Transportation & Utilities 1.4
State & Local Government 1.4
Manufacturing 1.3
Education-Health Services 1.1
Information 1.0 Federal Government 0.8 Leisure & Hospitality 0.7
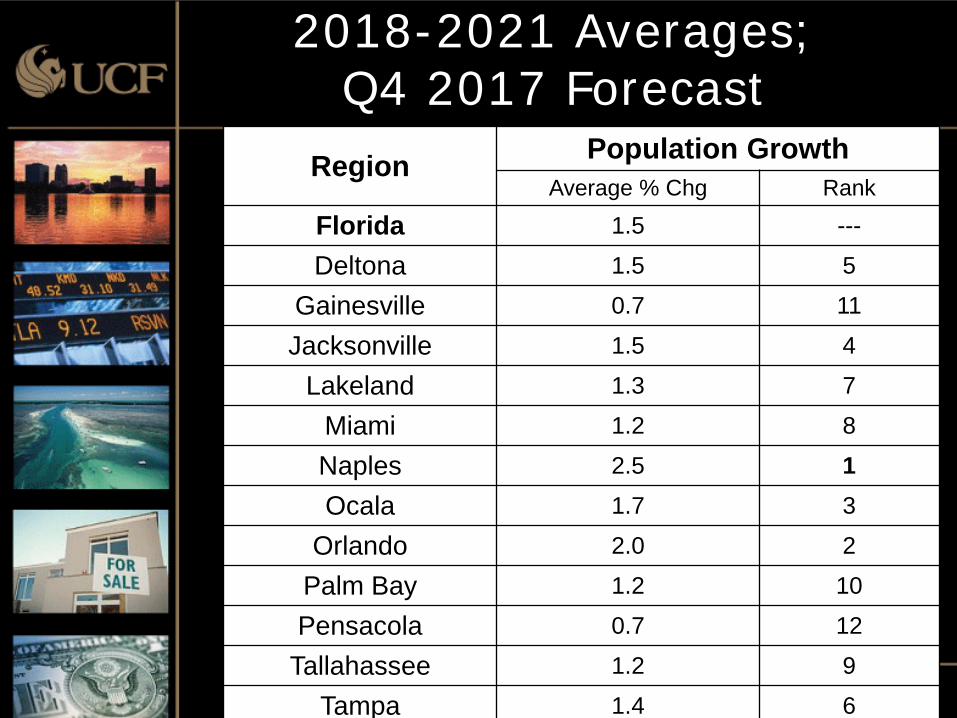
Region Population Growth Average % Chg Rank
Florida 1.5 ---
Deltona 1.5 5
Gainesville 0.7 11
Jacksonville 1.5 4
Lakeland 1.3 7
Miami 1.2 8
Naples 2.5 1 Ocala 1.7 3
Orlando 2.0 2
Palm Bay 1.2 10
Pensacola 0.7 12
Tallahassee 1.2 9
Tampa 1.4 6
2018-2021 Averages; Q4 2017 Forecast
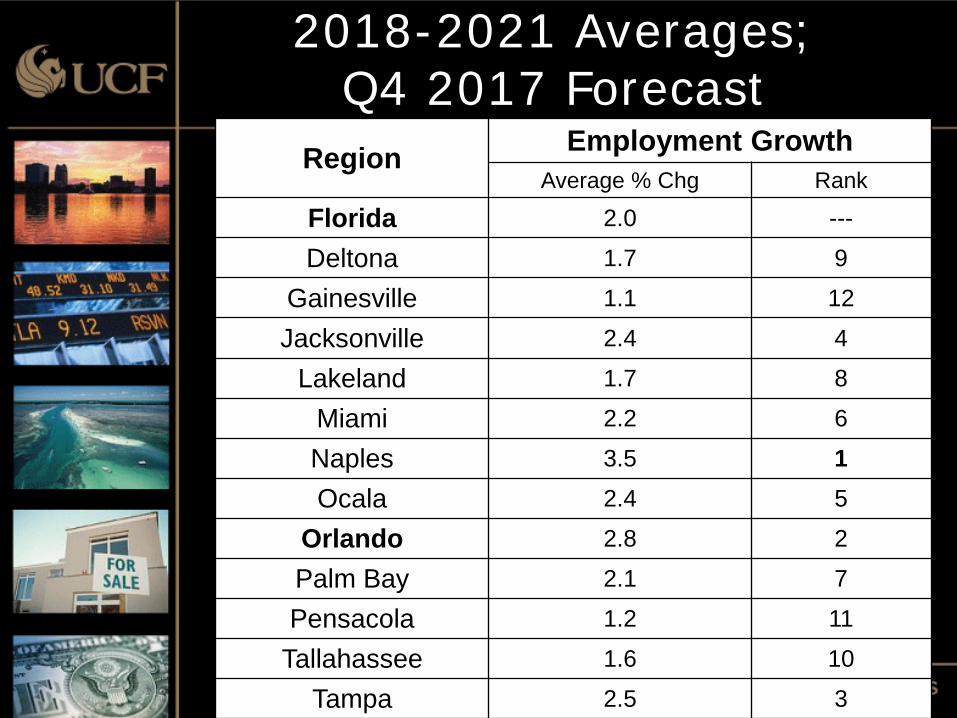
Region Employment Growth Average % Chg Rank
Florida 2.0 ---
Deltona 1.7 9
Gainesville 1.1 12
Jacksonville 2.4 4
Lakeland 1.7 8
Miami 2.2 6
Naples 3.5 1 Ocala 2.4 5
Orlando 2.8 2
Palm Bay 2.1 7
Pensacola 1.2 11
Tallahassee 1.6 10
Tampa 2.5 3
2018-2021 Averages; Q4 2017 Forecast
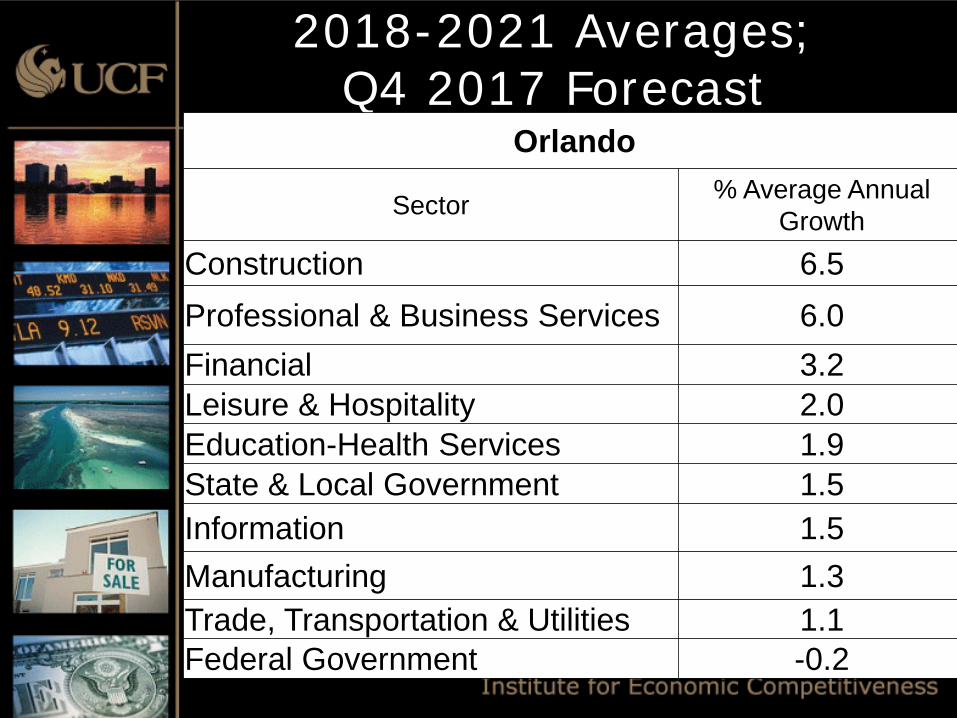
2018-2021 Averages; Q4 2017 Forecast
Orlando
Sector % Average Annual Growth
Construction 6.5 Professional & Business Services 6.0 Financial 3.2 Leisure & Hospitality 2.0 Education-Health Services 1.9 State & Local Government 1.5 Information 1.5 Manufacturing 1.3 Trade, Transportation & Utilities 1.1 Federal Government -0.2
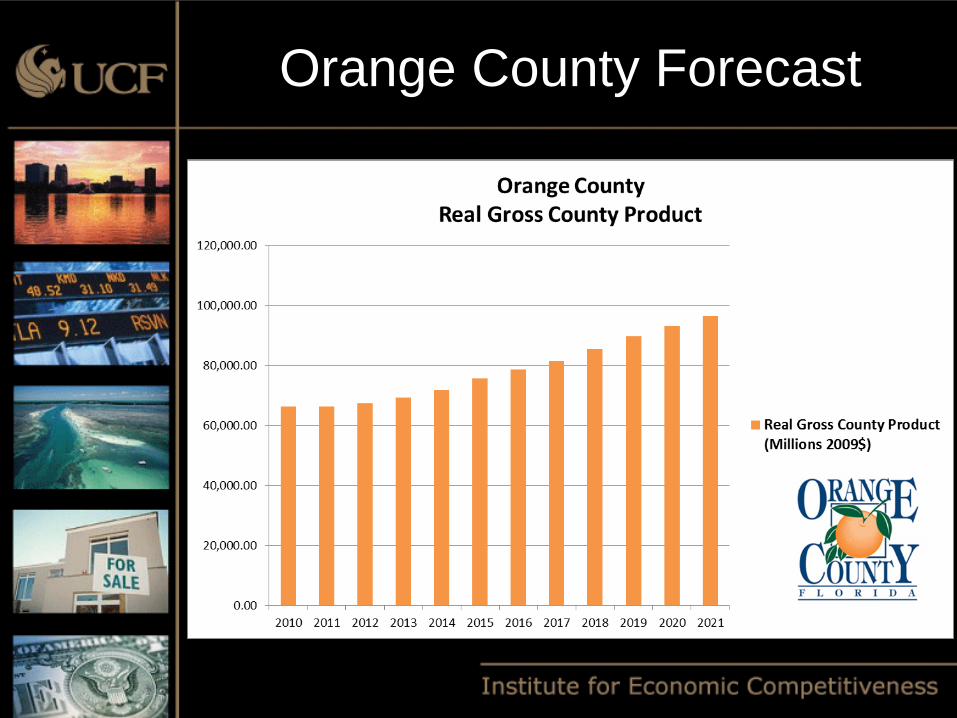
Orange County Forecast
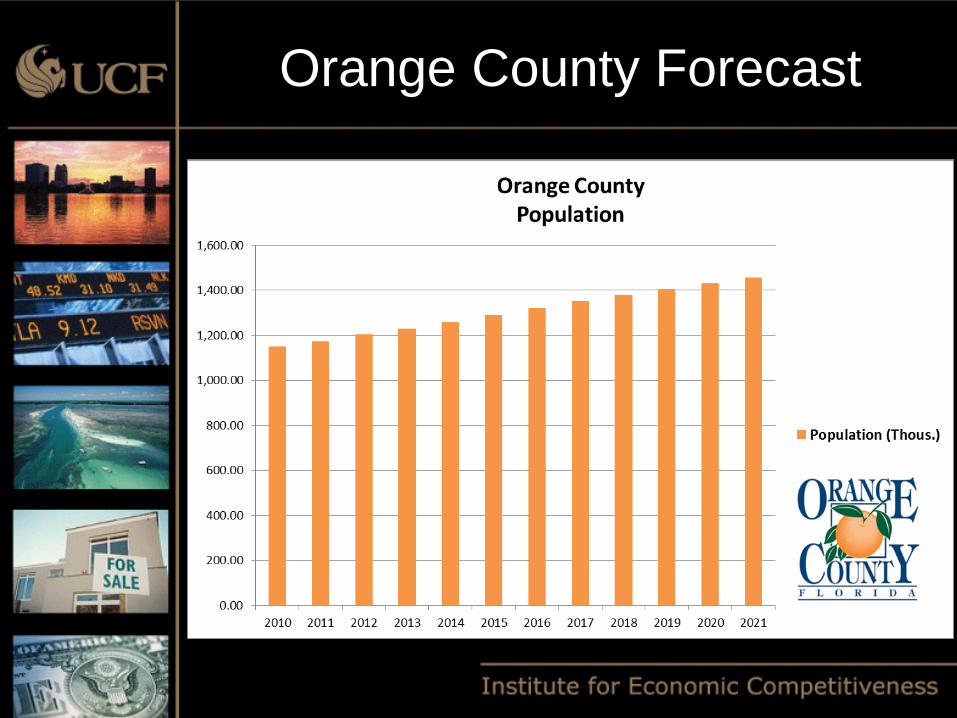
Orange County Forecast
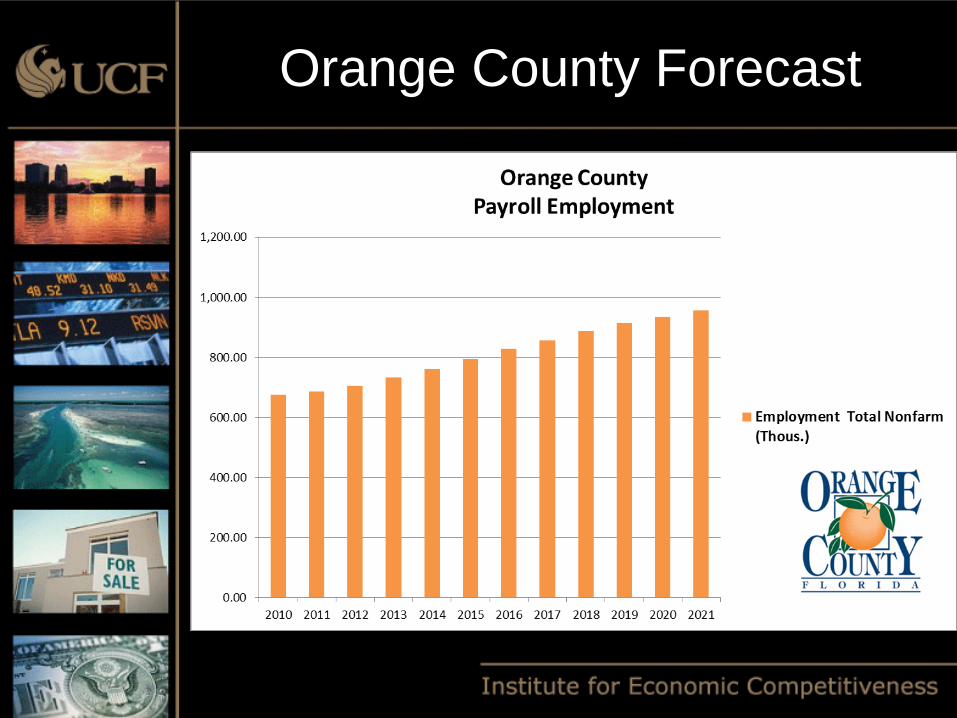
Orange County Forecast
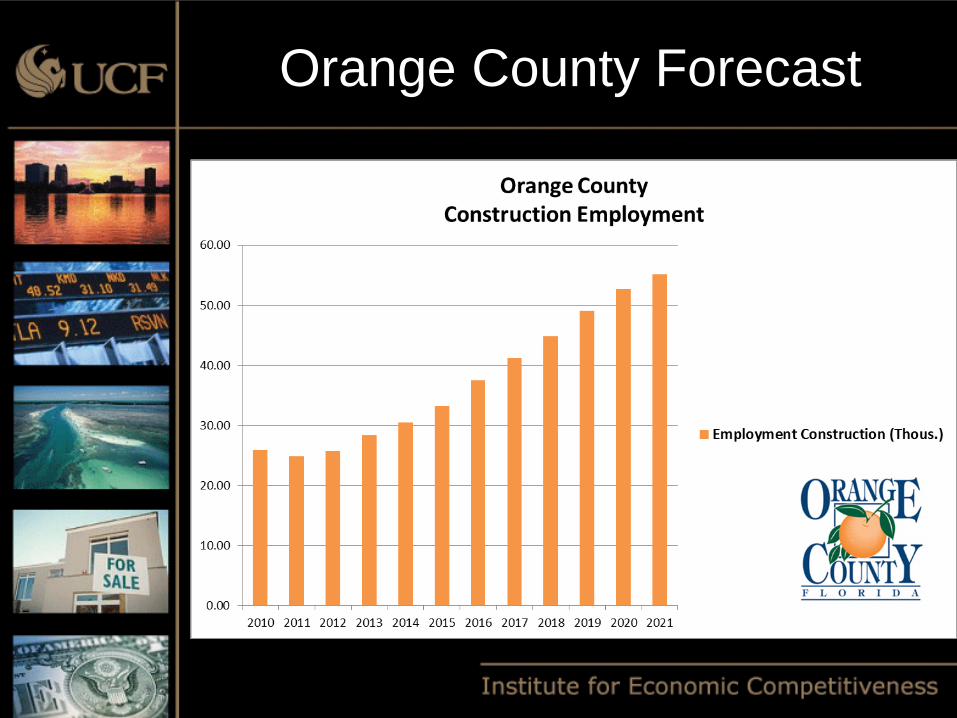
Orange County Forecast
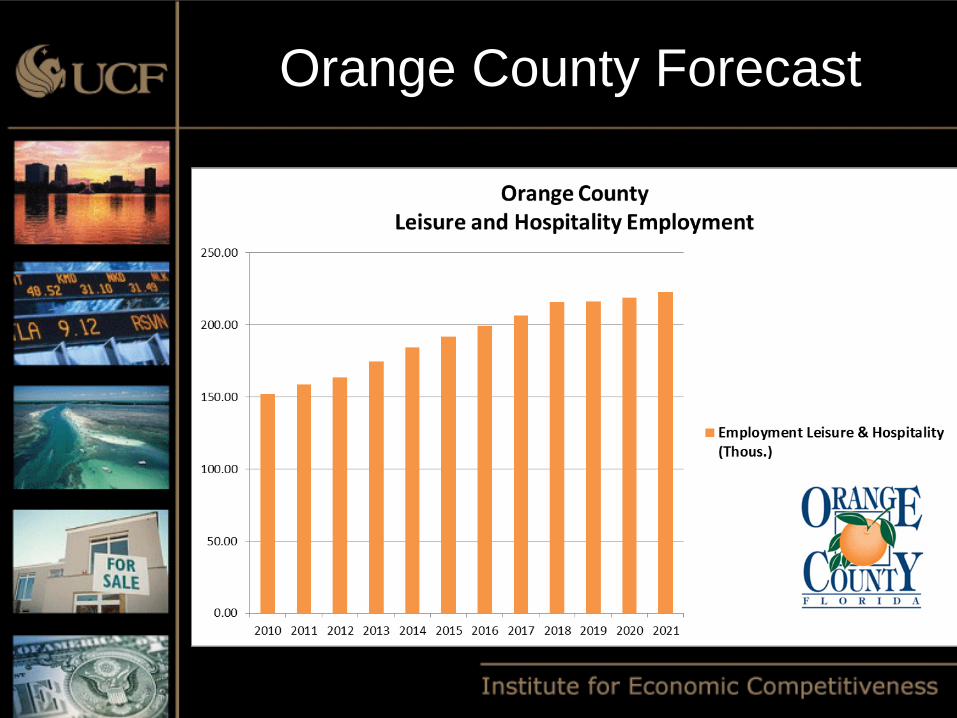
Orange County Forecast
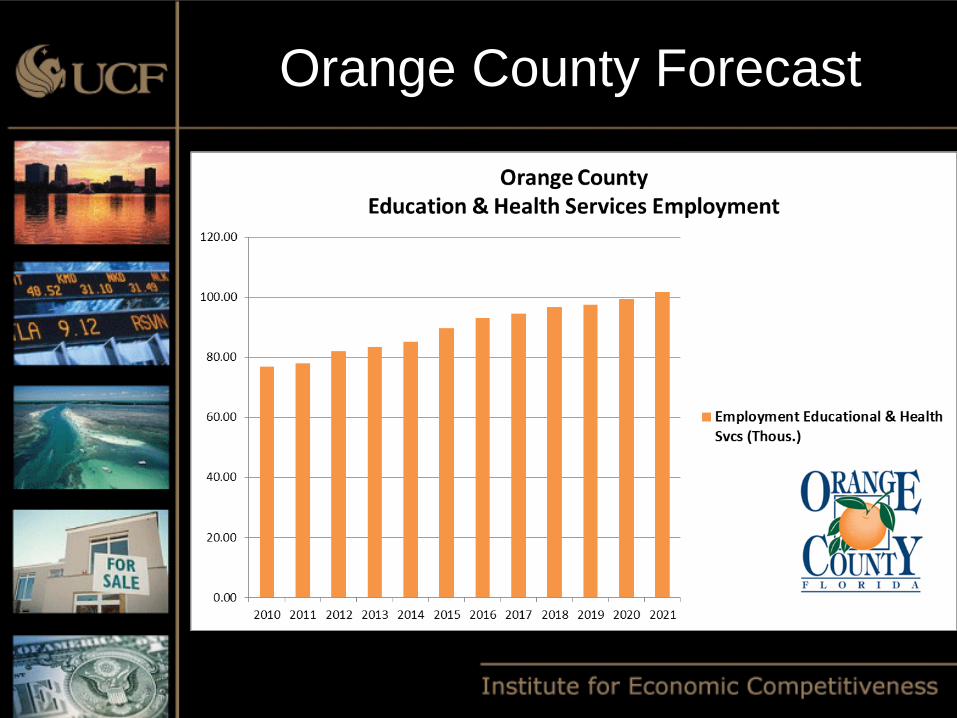
Orange County Forecast
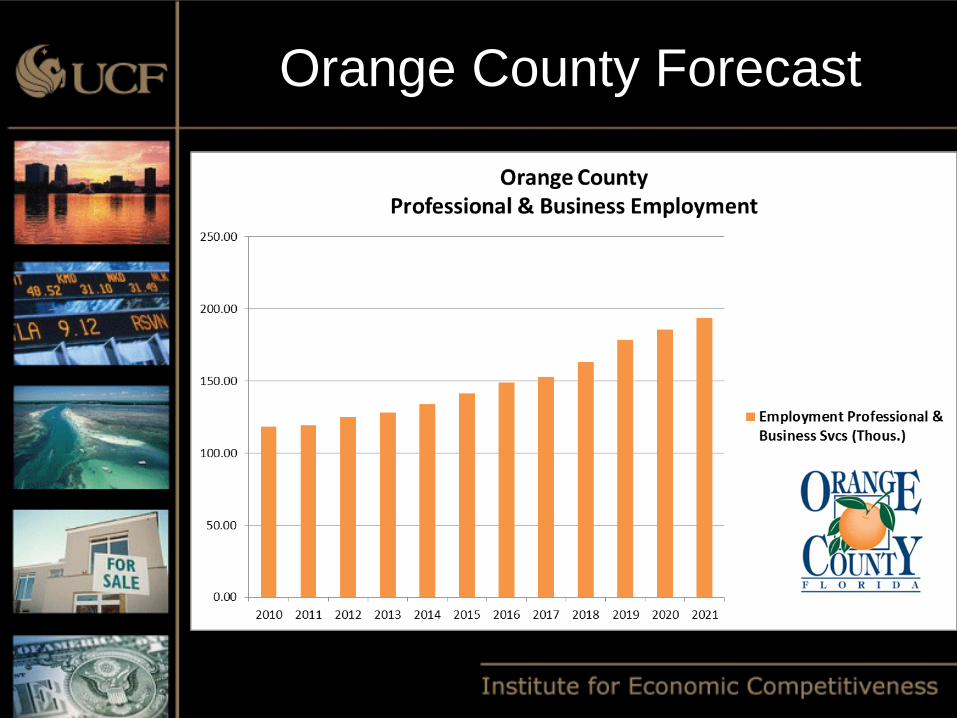
Orange County Forecast
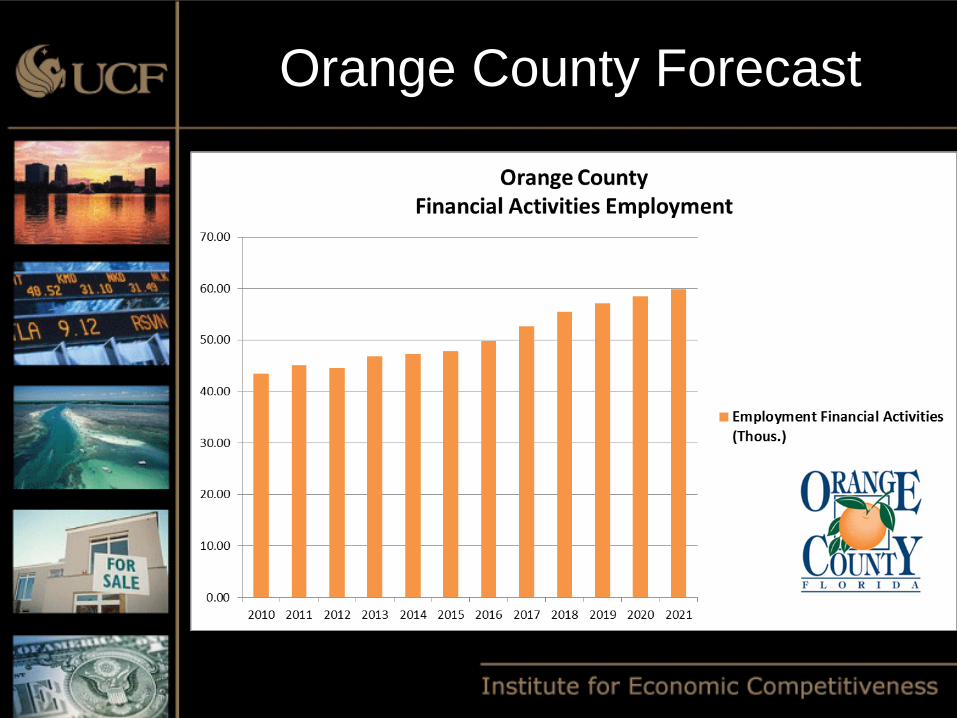
Orange County Forecast
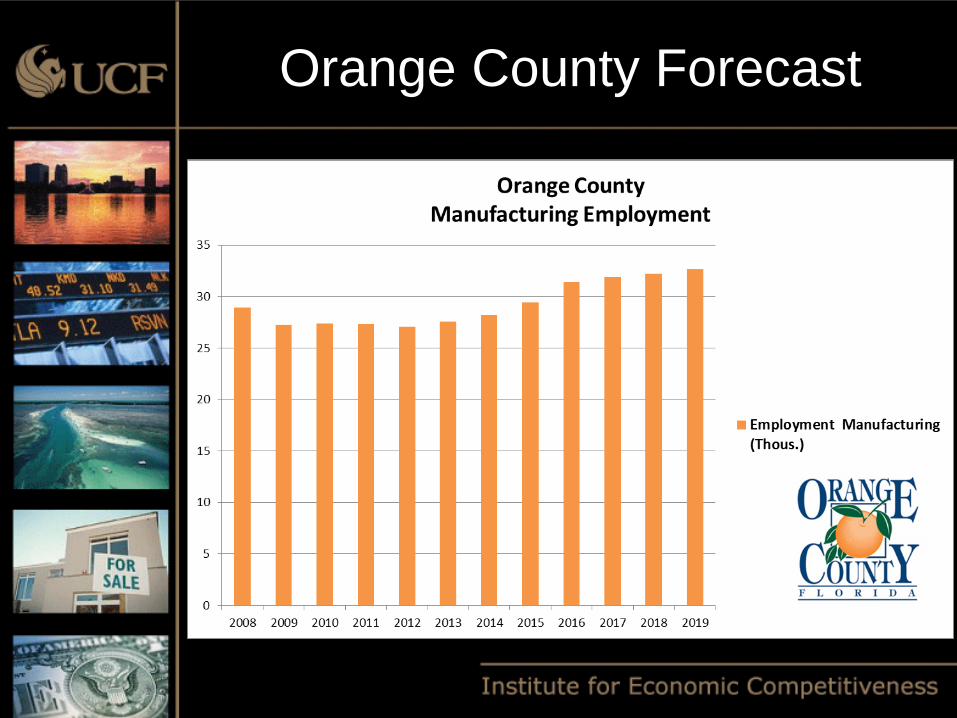
Orange County Forecast
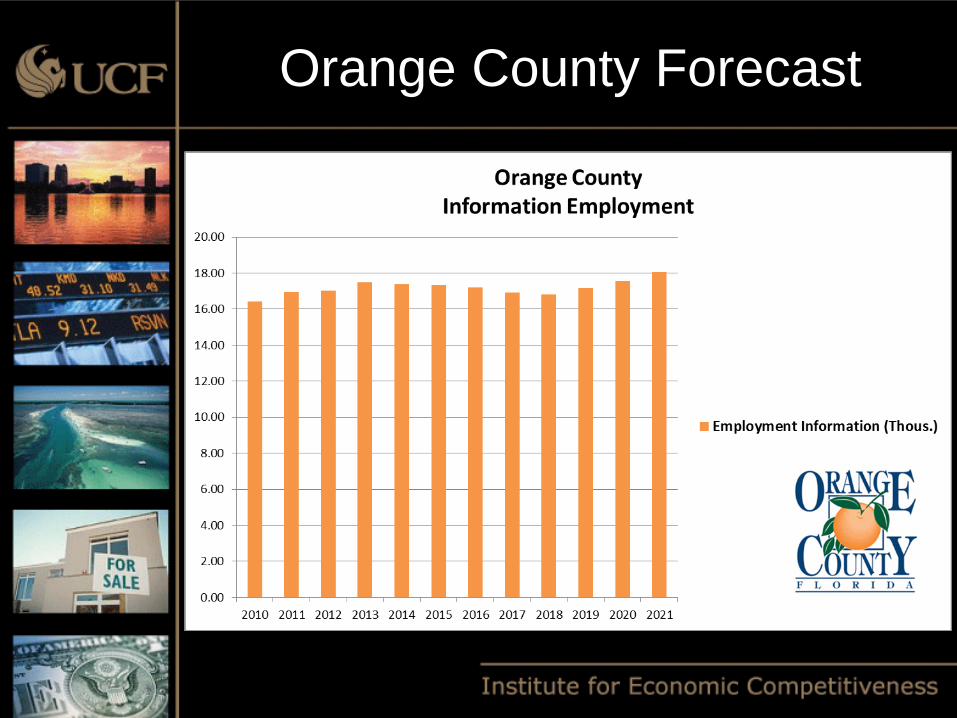
Orange County Forecast
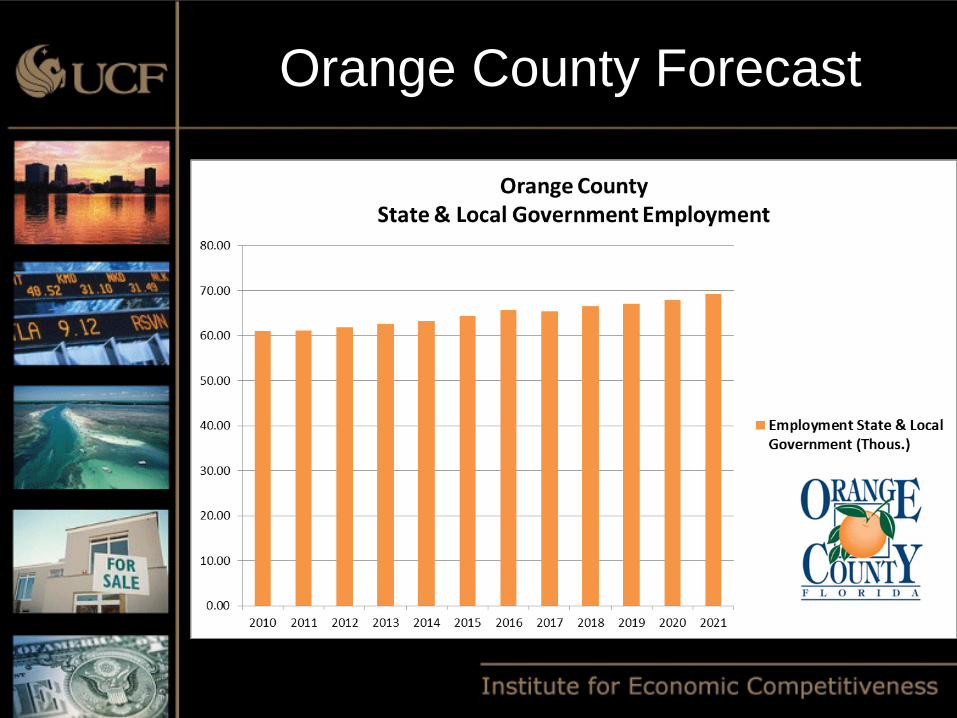
Orange County Forecast
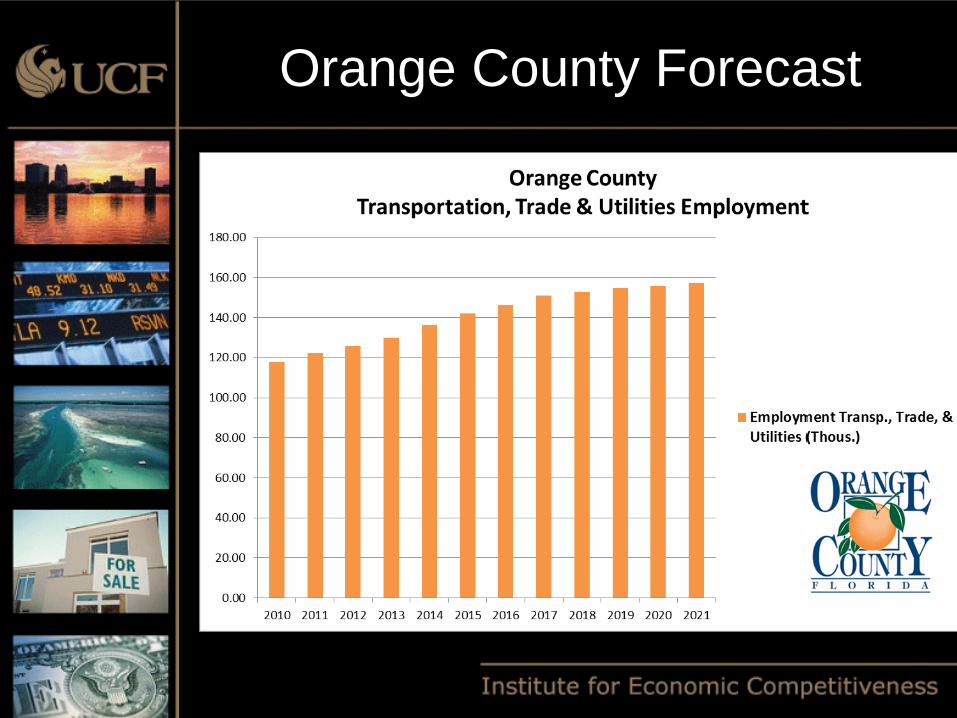
Orange County Forecast

Sean M. Snaith, Ph.D.
Director
Institute for Economic Competitiveness
(407) 823-1453
WWW.IEC.UCF.EDU
www.facebook.com/seansnaith
Twitter: @seansnaith
Thank you