Embed Size (px)
Citation preview
www.usfunds.com 1.800.US.FUNDS
U.S. Global Investors Searching for Opportunities, Managing Risk
September 10, 2010 10-506
Frank E. Holmes CEO and CIO
Susan McGee President and General Counsel
Catherine Rademacher CFO
Terry Badger Director of Communications
GROW Earnings FY10

www.usfunds.com September 2010 10-506 2
Today’s Presenters
Frank Holmes Susan McGee Catherine Rademacher Terry Badger
www.usfunds.com September 2010 10-506 3
Forward-Looking Statements During this webcast we may make forward-looking statements about our relative business outlook. Any forward-looking statements and all other statements made during this webcast that don’t pertain to historical facts are subject to risks and uncertainties that may materially affect actual results. Please refer to our press release and the corresponding Form 10-K filing for more detail on factors that could cause actual results to differ materially from any described today in forward-looking statements. Any such statements are made as of today, and U.S. Global Investors accepts no obligation to update them in the future.
www.usfunds.com September 2010 10-506 4
GROW Strengths
“Go-to” stock for exposure to emerging markets and resources
Debt-free, strong balance sheet with a reflexive cost structure
Monthly dividend and return on equity discipline
www.usfunds.com September 2010 10-506 5
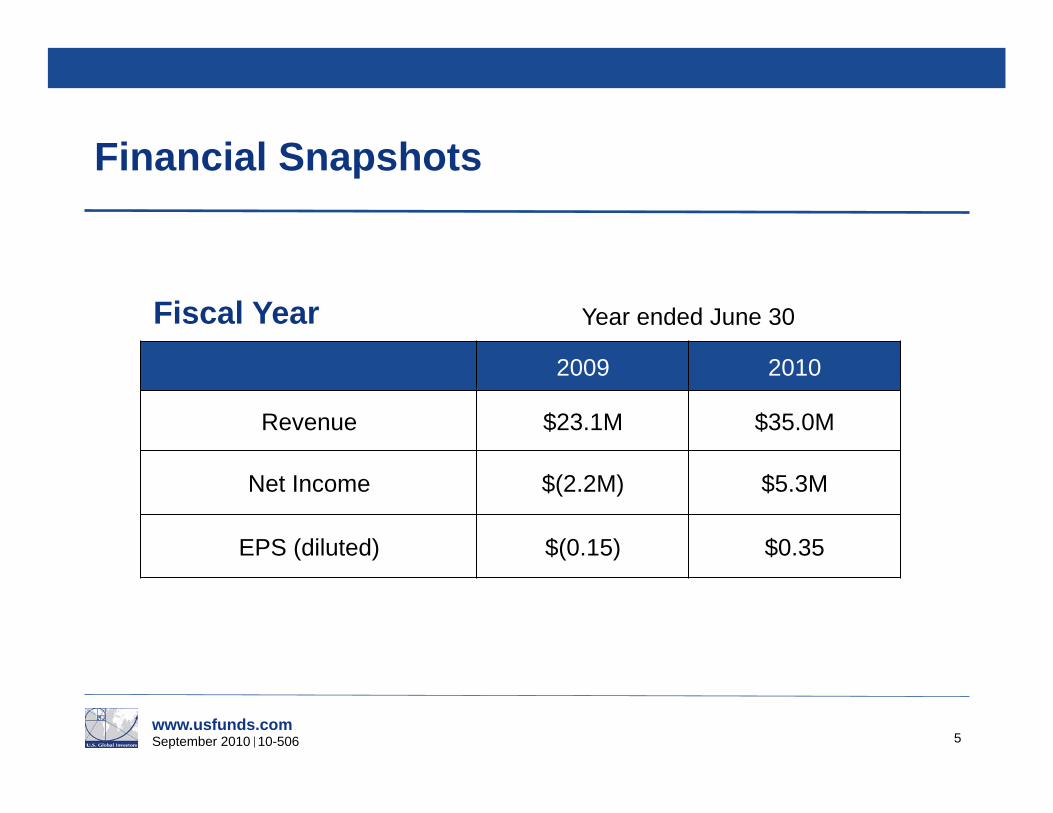
2009 2010
Revenue $23.1M $35.0M
Net Income $(2.2M) $5.3M
EPS (diluted) $(0.15) $0.35
Year ended June 30
Financial Snapshots
Fiscal Year
www.usfunds.com September 2010 10-506 6
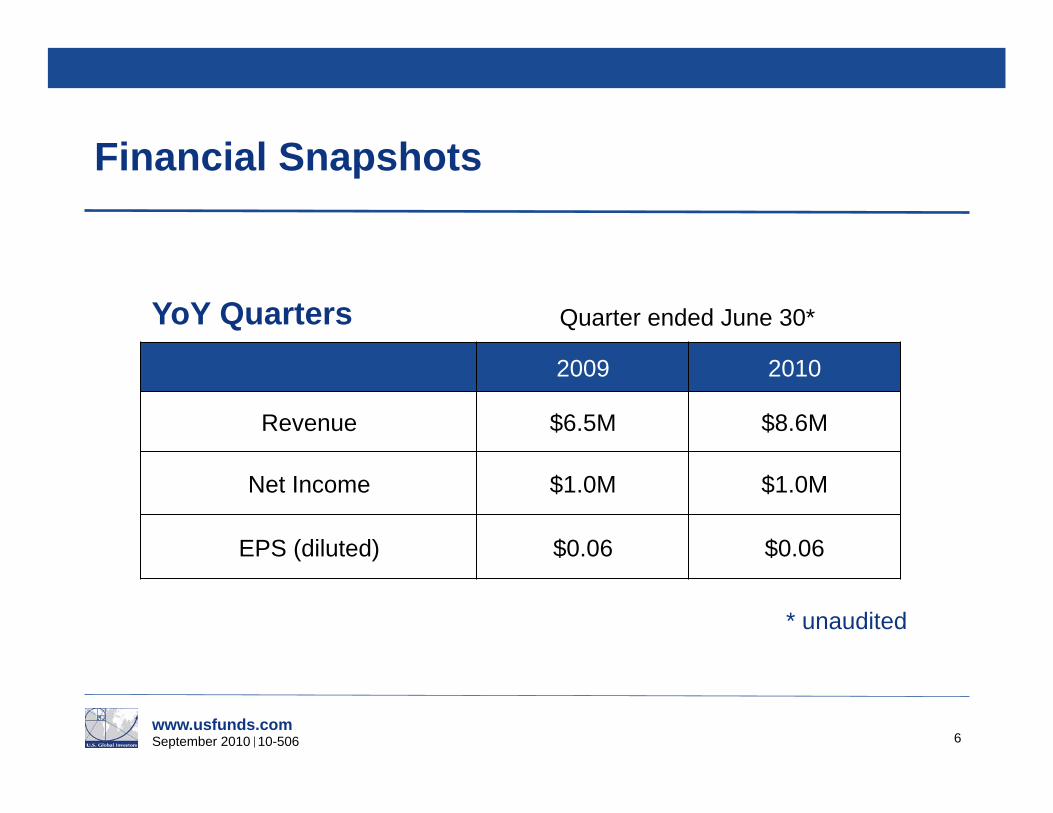
2009 2010
Revenue $6.5M $8.6M
Net Income $1.0M $1.0M
EPS (diluted) $0.06 $0.06
Quarter ended June 30*
Financial Snapshots
* unaudited
YoY Quarters
www.usfunds.com September 2010 10-506 7
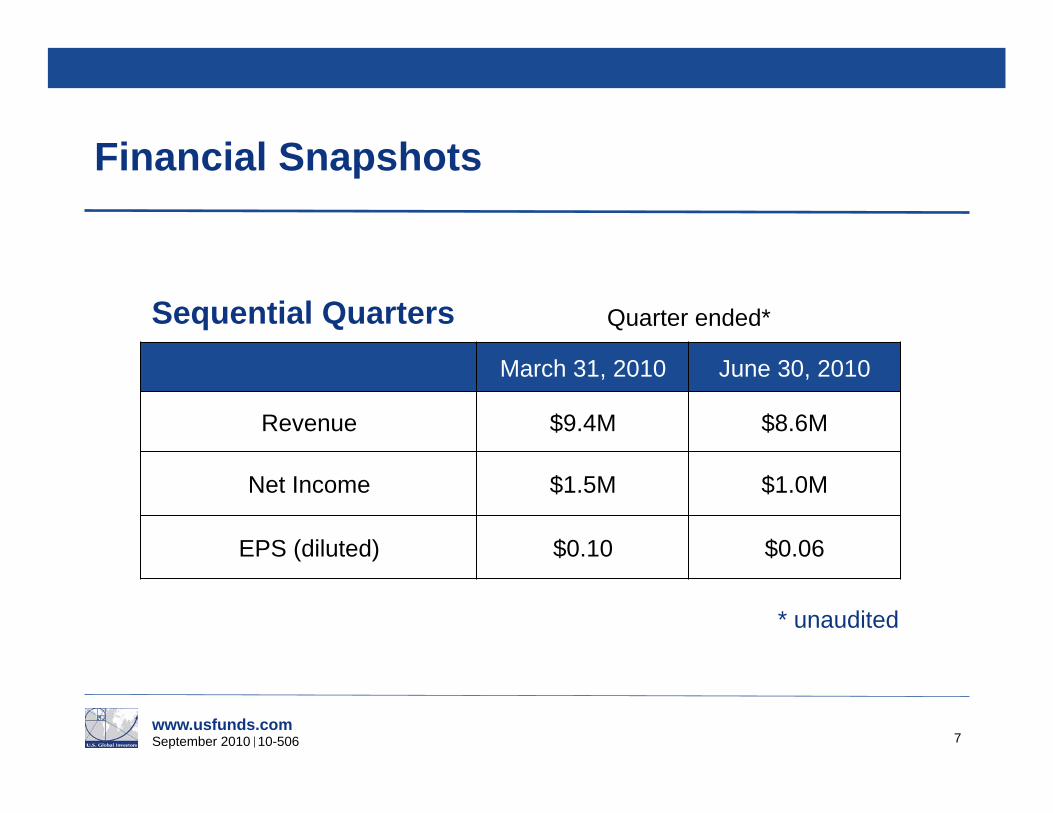
March 31, 2010 June 30, 2010
Revenue $9.4M $8.6M
Net Income $1.5M $1.0M
EPS (diluted) $0.10 $0.06
Quarter ended*
Financial Snapshots
Sequential Quarters
* unaudited
www.usfunds.com September 2010 10-506 8
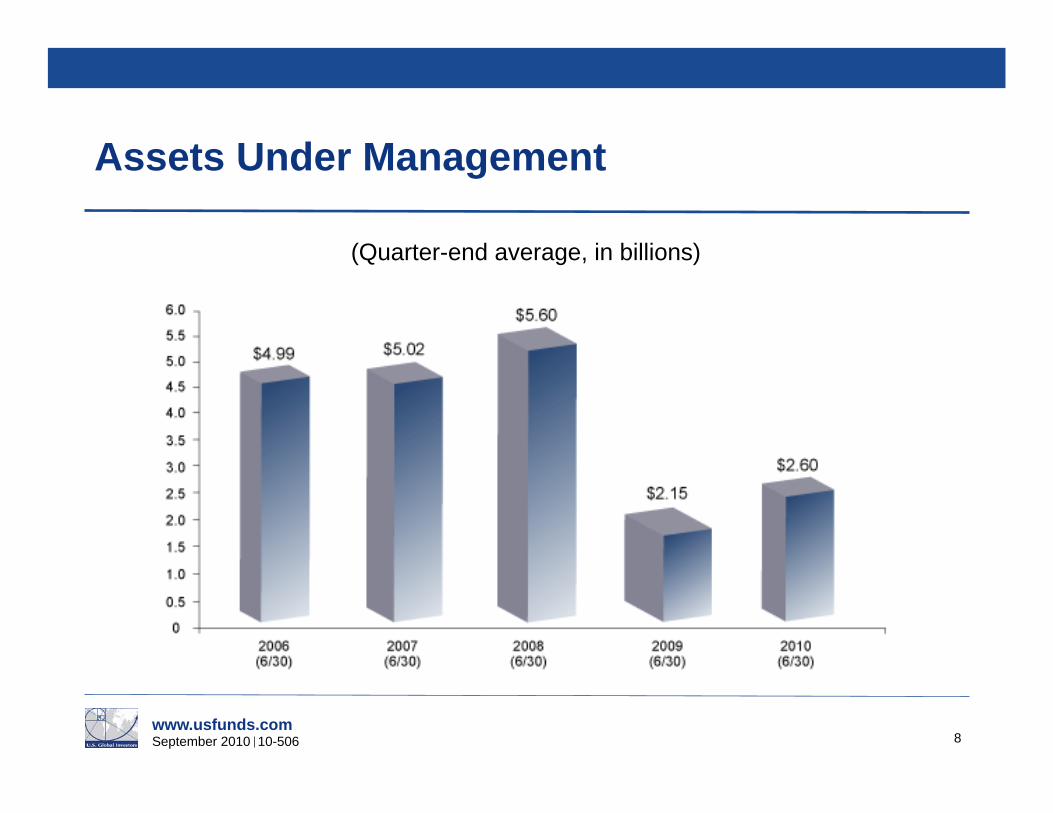
Assets Under Management
(Quarter-end average, in billions)
www.usfunds.com September 2010 10-506 9
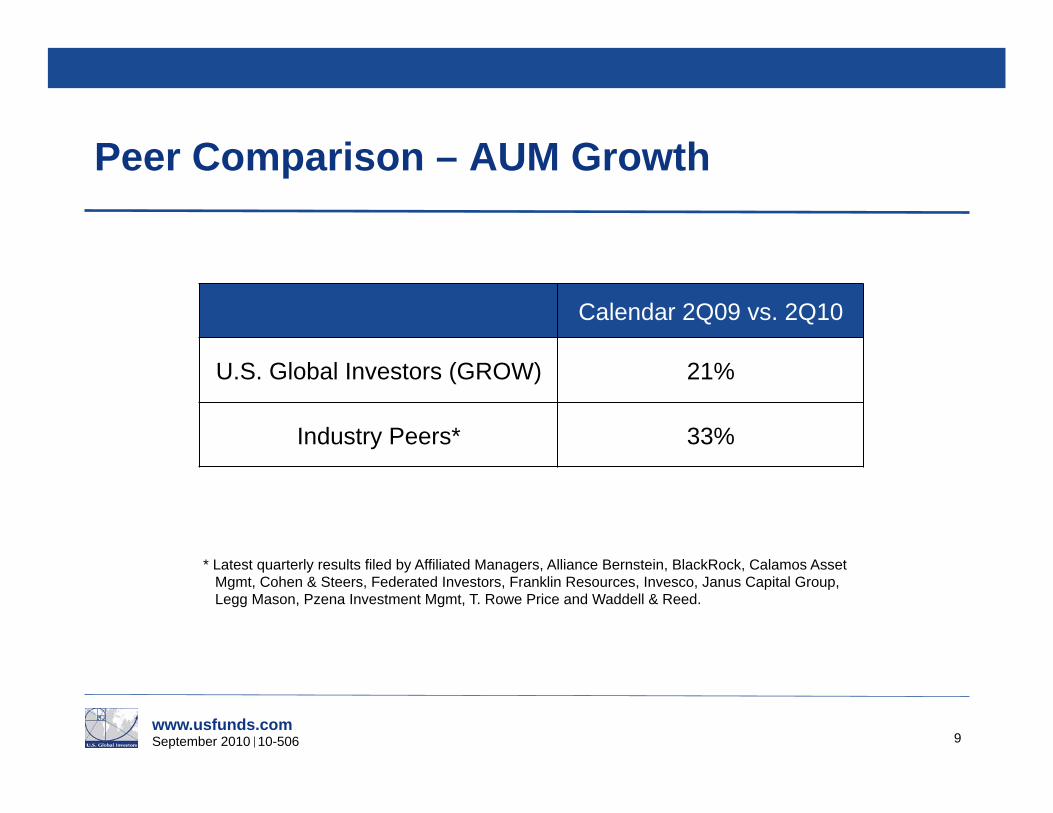
Calendar 2Q09 vs. 2Q10
U.S. Global Investors (GROW) 21%
Industry Peers* 33%
* Latest quarterly results filed by Affiliated Managers, Alliance Bernstein, BlackRock, Calamos Asset Mgmt, Cohen & Steers, Federated Investors, Franklin Resources, Invesco, Janus Capital Group, Legg Mason, Pzena Investment Mgmt, T. Rowe Price and Waddell & Reed.
Peer Comparison – AUM Growth
www.usfunds.com September 2010 10-506 10
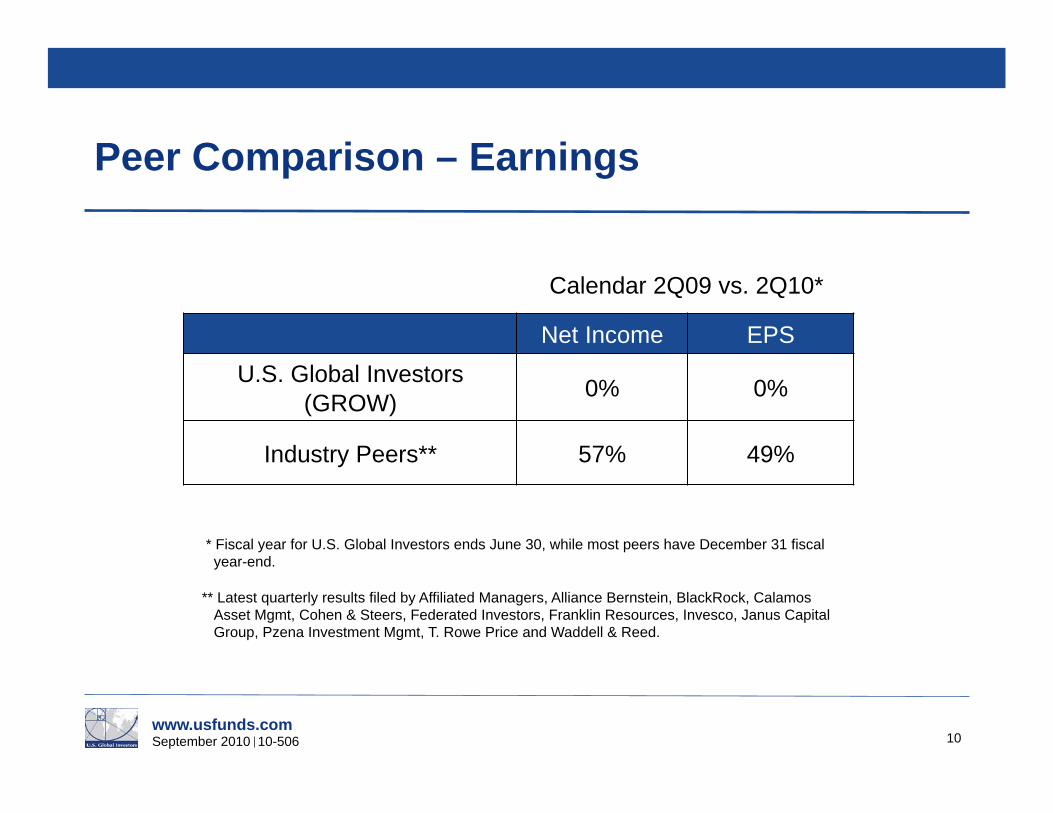
Net Income EPS U.S. Global Investors
(GROW) 0% 0%
Industry Peers** 57% 49%
* Fiscal year for U.S. Global Investors ends June 30, while most peers have December 31 fiscal year-end.
** Latest quarterly results filed by Affiliated Managers, Alliance Bernstein, BlackRock, Calamos Asset Mgmt, Cohen & Steers, Federated Investors, Franklin Resources, Invesco, Janus Capital Group, Pzena Investment Mgmt, T. Rowe Price and Waddell & Reed.
Peer Comparison – Earnings
Calendar 2Q09 vs. 2Q10*
www.usfunds.com September 2010 10-506 11
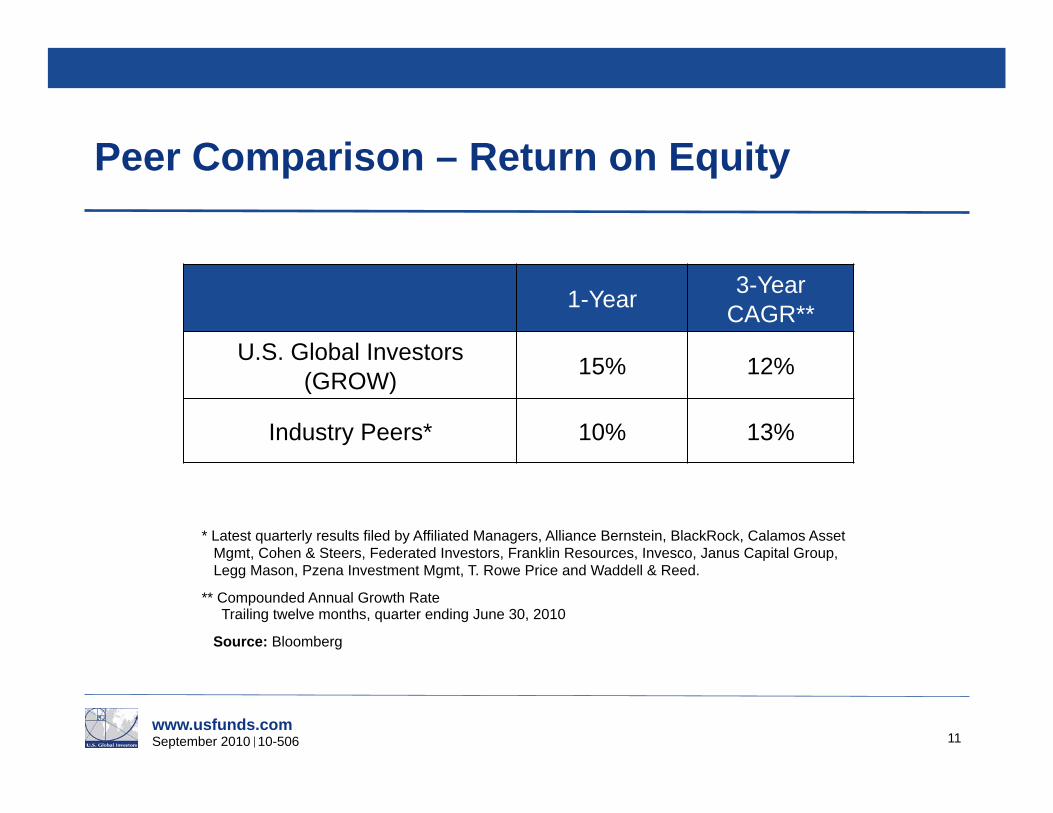
1-Year 3-Year CAGR**
U.S. Global Investors (GROW) 15% 12%
Industry Peers* 10% 13%
* Latest quarterly results filed by Affiliated Managers, Alliance Bernstein, BlackRock, Calamos Asset Mgmt, Cohen & Steers, Federated Investors, Franklin Resources, Invesco, Janus Capital Group, Legg Mason, Pzena Investment Mgmt, T. Rowe Price and Waddell & Reed.
** Compounded Annual Growth Rate Trailing twelve months, quarter ending June 30, 2010
Source: Bloomberg
Peer Comparison – Return on Equity
www.usfunds.com September 2010 10-506 12
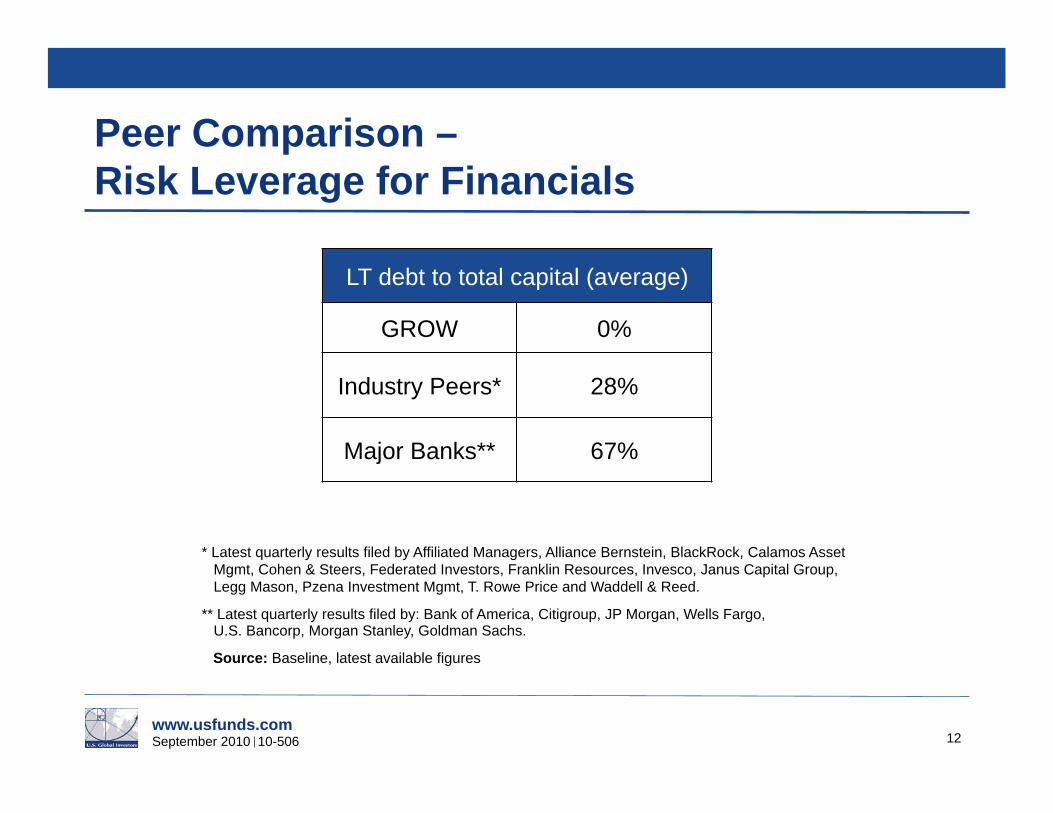
LT debt to total capital (average)
GROW 0%
Industry Peers* 28%
Major Banks** 67%
* Latest quarterly results filed by Affiliated Managers, Alliance Bernstein, BlackRock, Calamos Asset Mgmt, Cohen & Steers, Federated Investors, Franklin Resources, Invesco, Janus Capital Group, Legg Mason, Pzena Investment Mgmt, T. Rowe Price and Waddell & Reed.
** Latest quarterly results filed by: Bank of America, Citigroup, JP Morgan, Wells Fargo, U.S. Bancorp, Morgan Stanley, Goldman Sachs.
Source: Baseline, latest available figures
Peer Comparison – Risk Leverage for Financials
www.usfunds.com September 2010 10-506
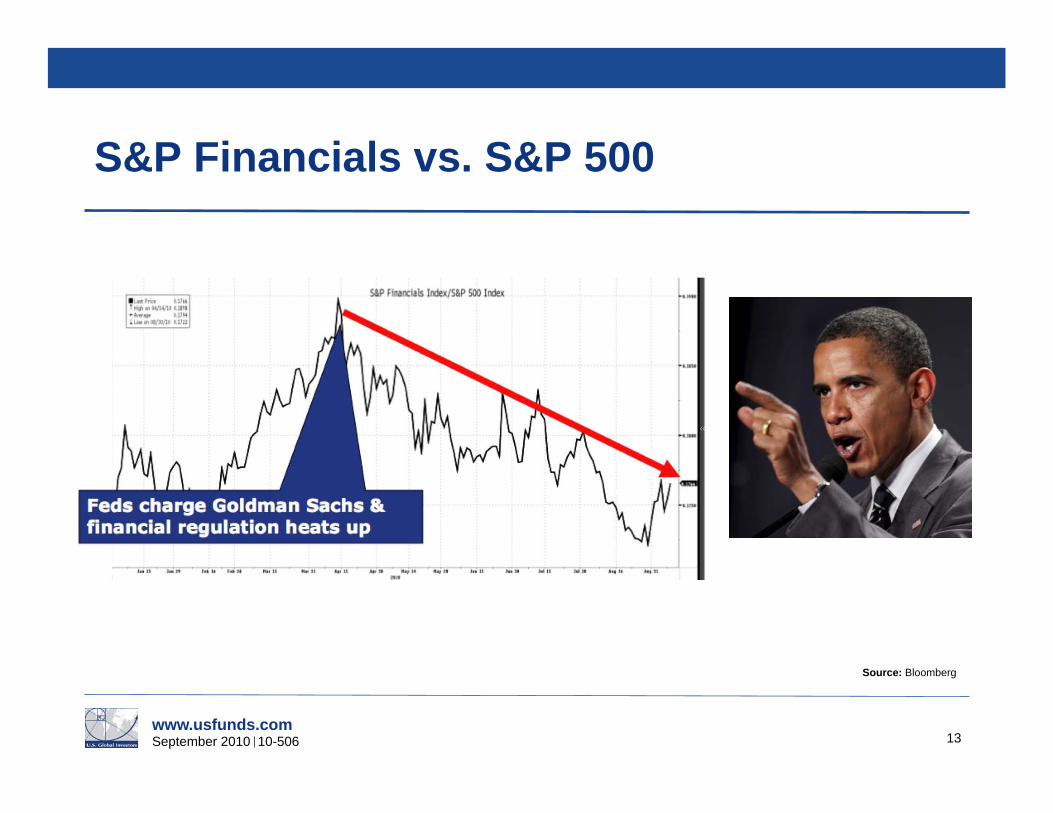
S&P Financials vs. S&P 500
13
Source: Bloomberg
www.usfunds.com September 2010 10-506
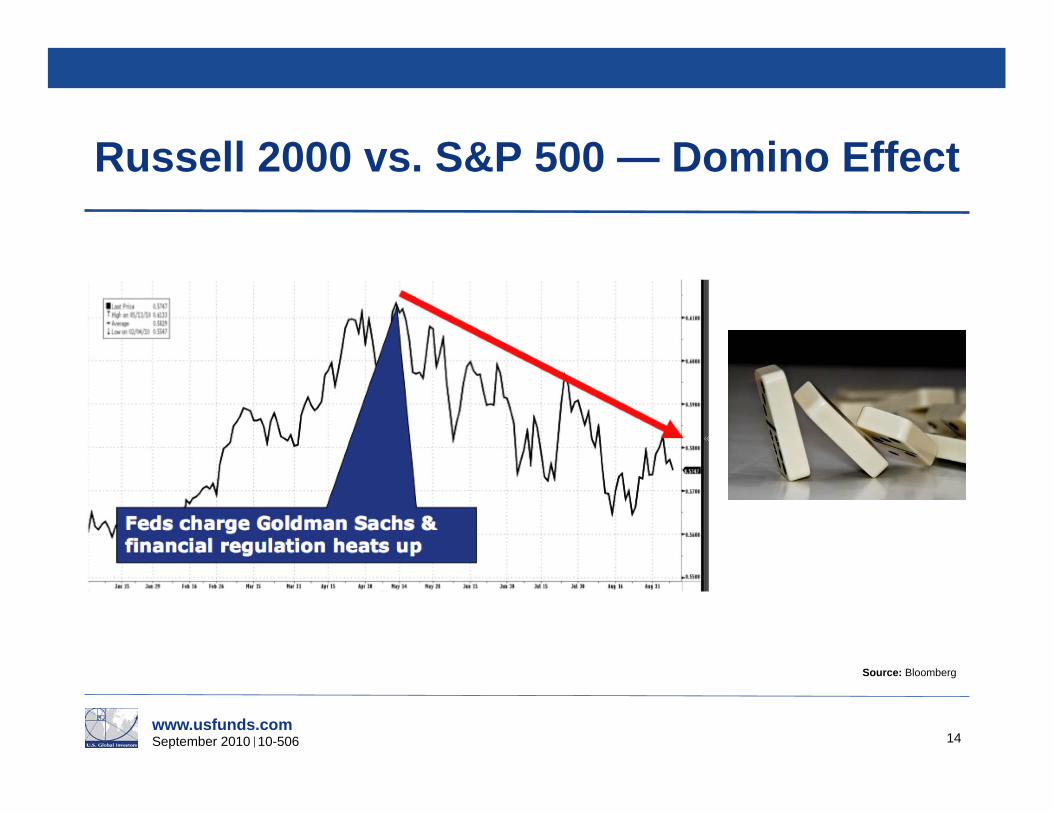
Russell 2000 vs. S&P 500 — Domino Effect
14
Source: Bloomberg
www.usfunds.com September 2010 10-506 15
Significant Events FY10
Institutional Shares
Institutional AUM
Expense Caps
GROW Dividends
www.usfunds.com September 2010 10-506
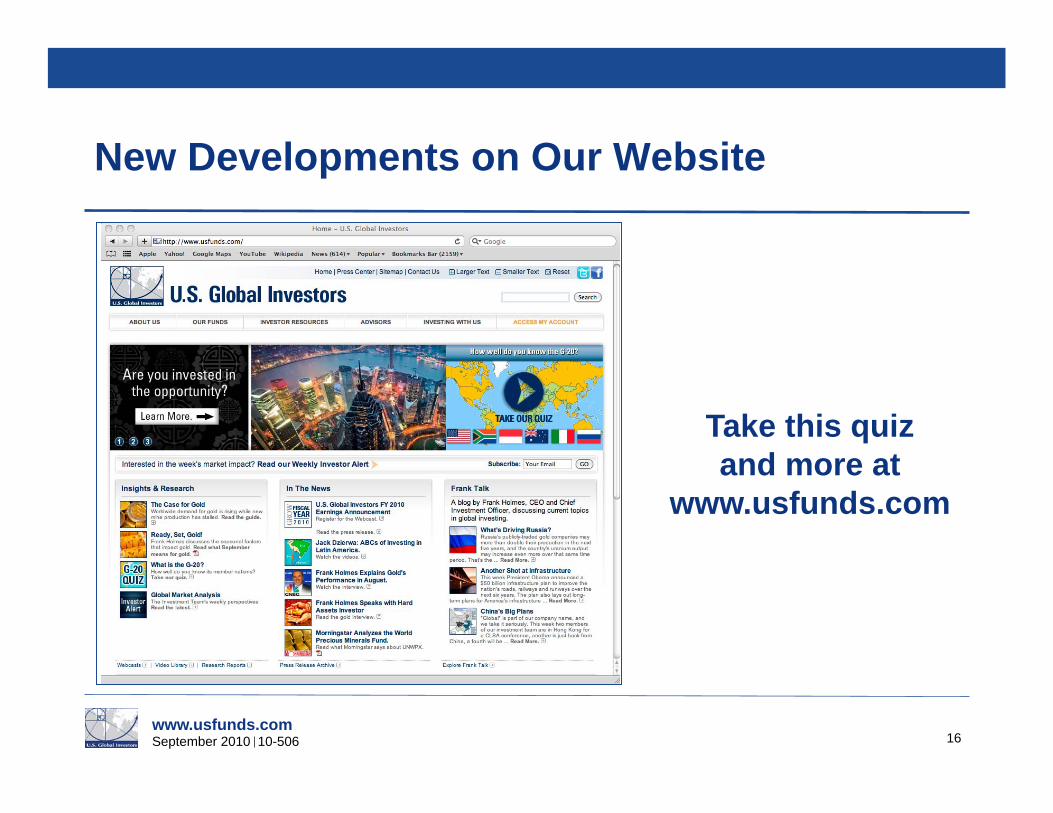
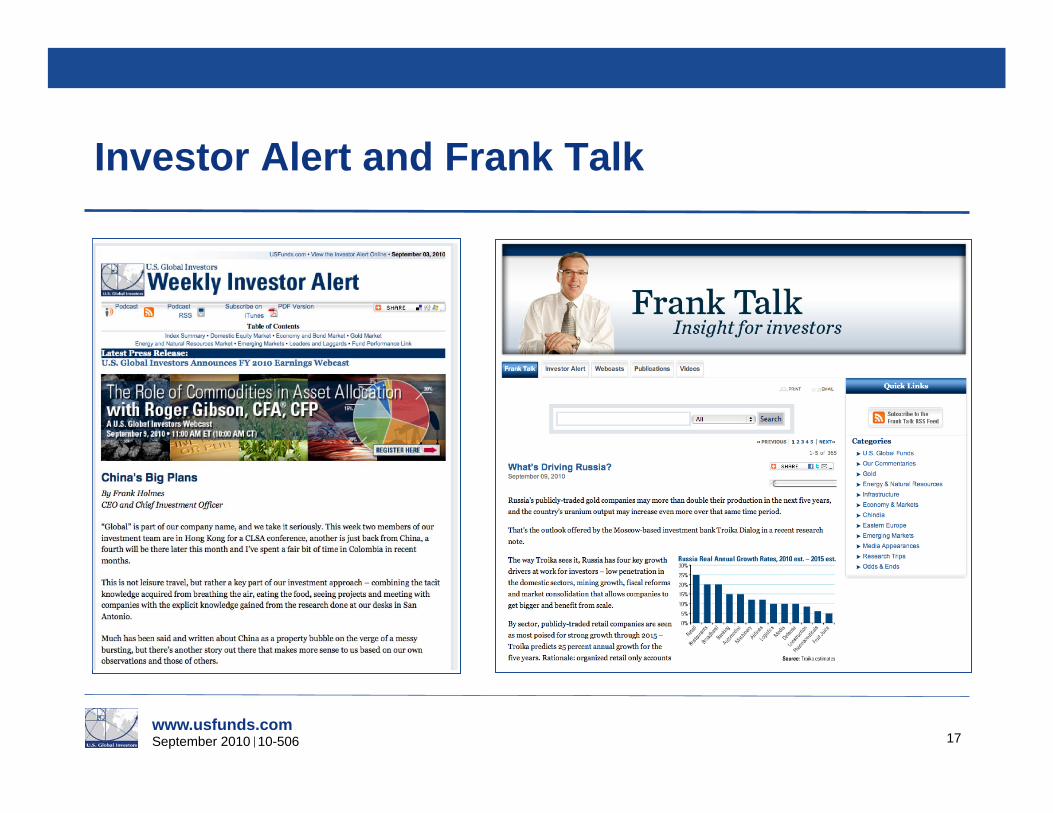
New Developments on Our Website
16
Take this quiz and more at
www.usfunds.com
www.usfunds.com September 2010 10-506
Investor Alert and Frank Talk
17
www.usfunds.com September 2010 10-506 18
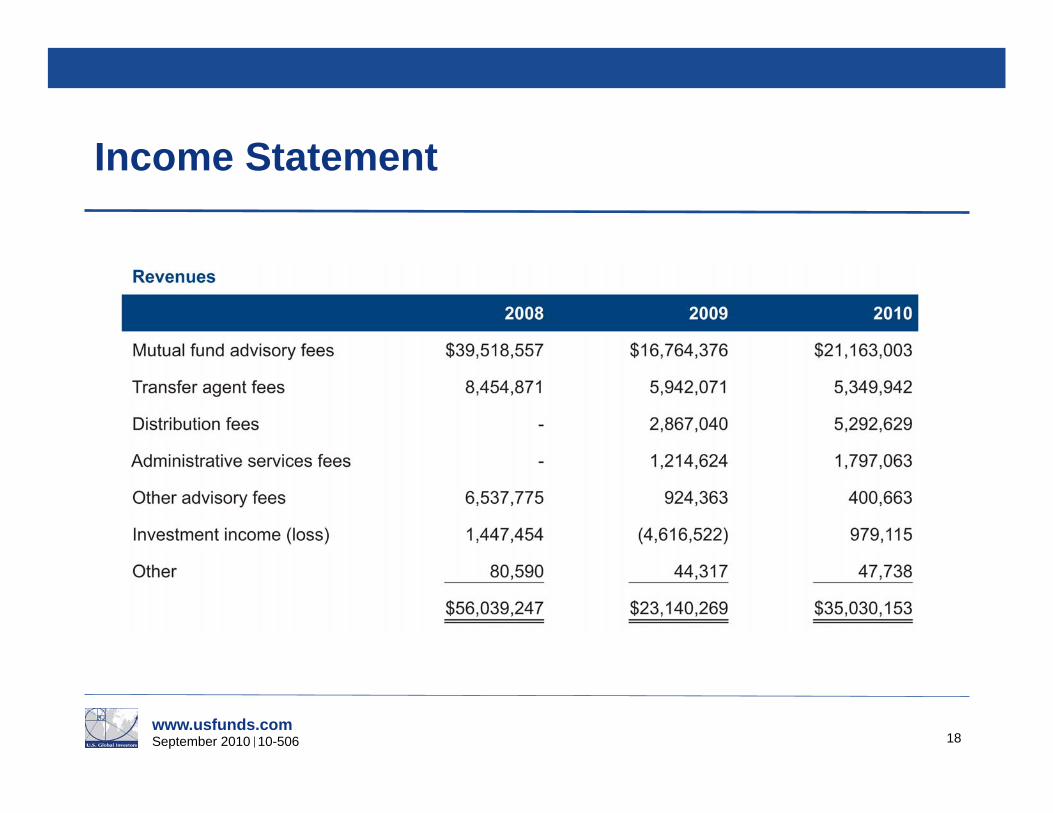
Income Statement
www.usfunds.com September 2010 10-506 19
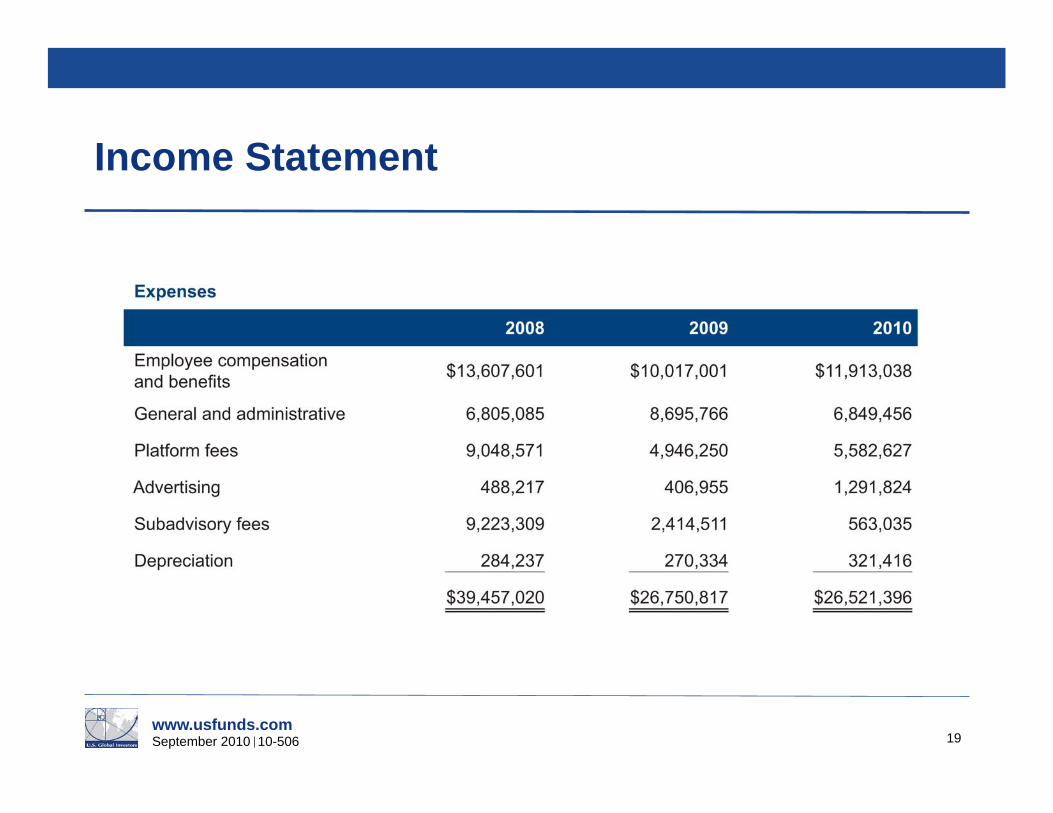
Income Statement
www.usfunds.com September 2010 10-506 20
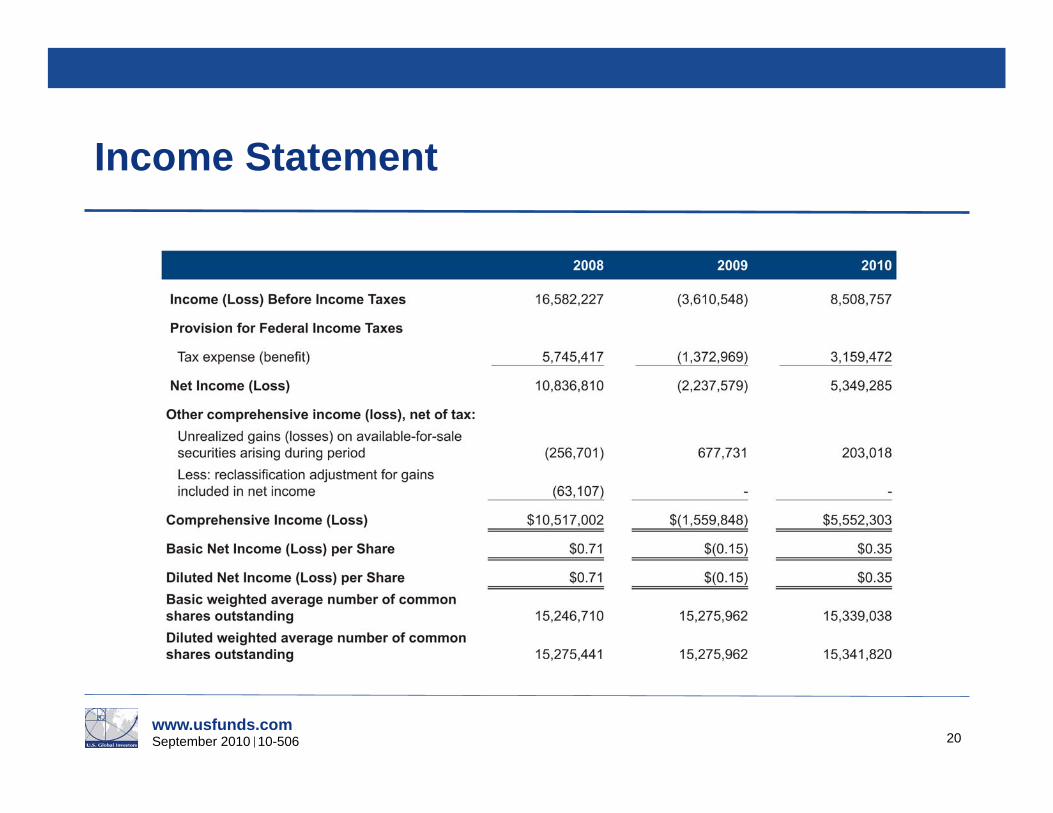
Income Statement
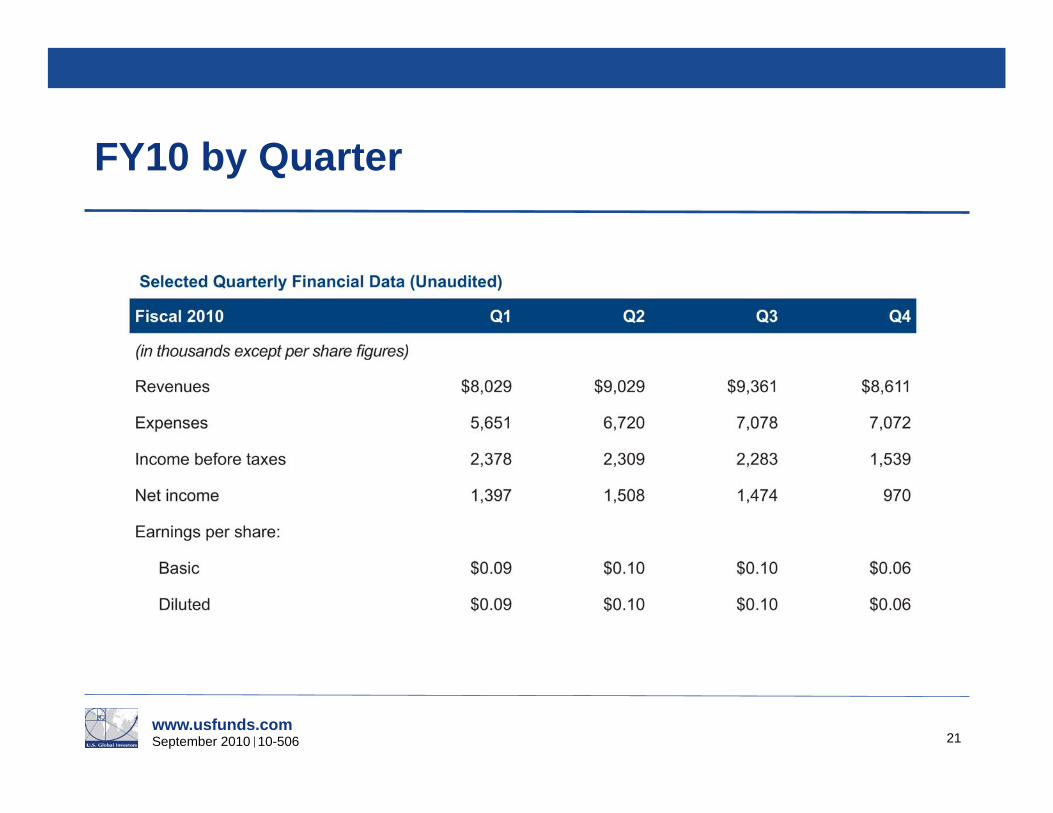
www.usfunds.com September 2010 10-506 21
FY10 by Quarter
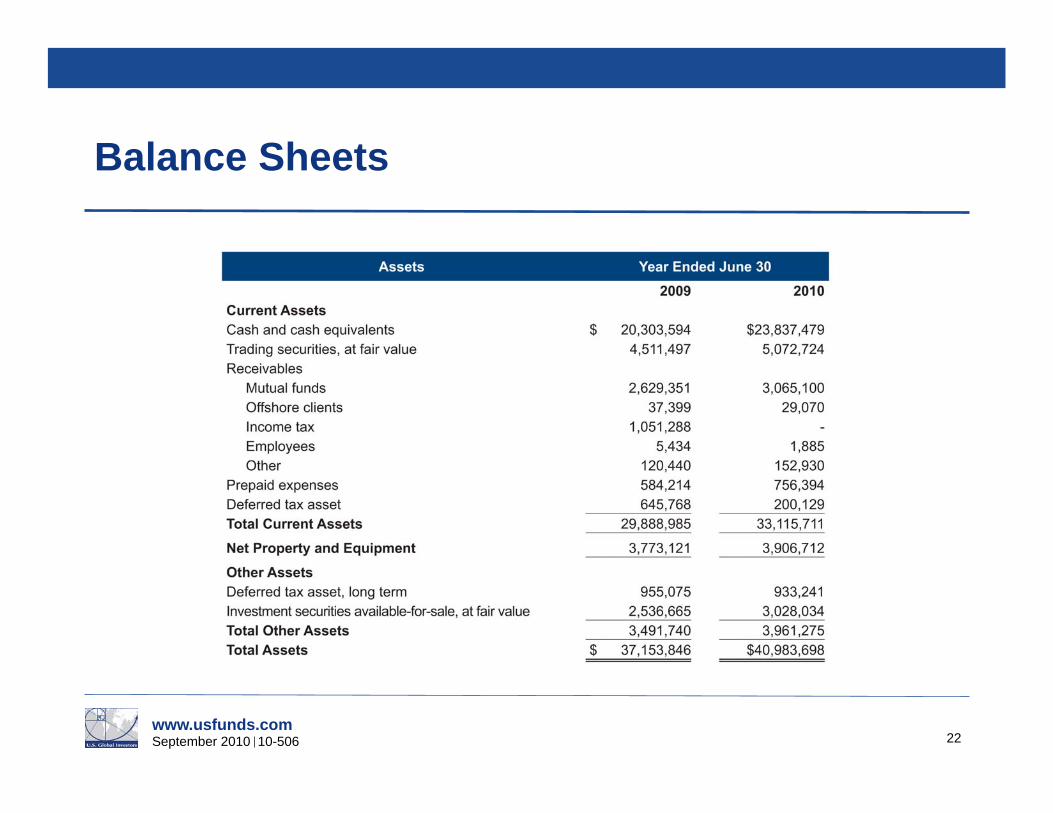
www.usfunds.com September 2010 10-506 22
Balance Sheets
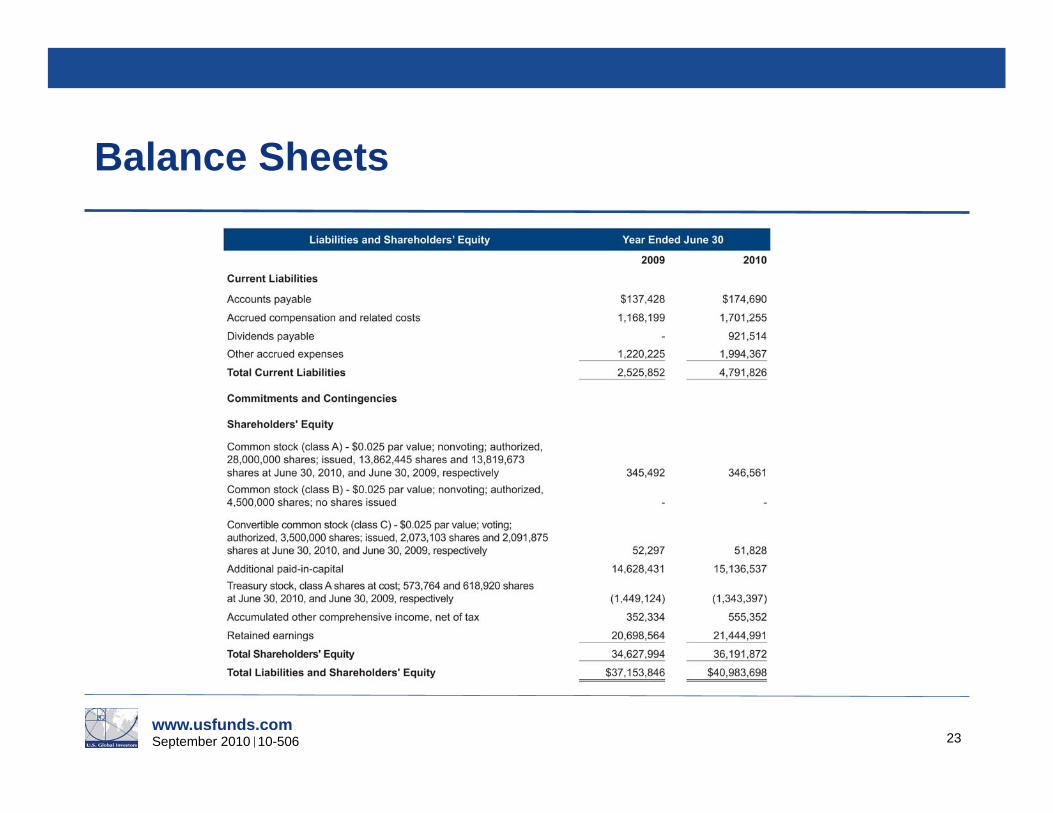
www.usfunds.com September 2010 10-506 23
Balance Sheets
www.usfunds.com September 2010 10-506 24
Opportunities in Gold and Emerging Markets
www.usfunds.com September 2010 10-506
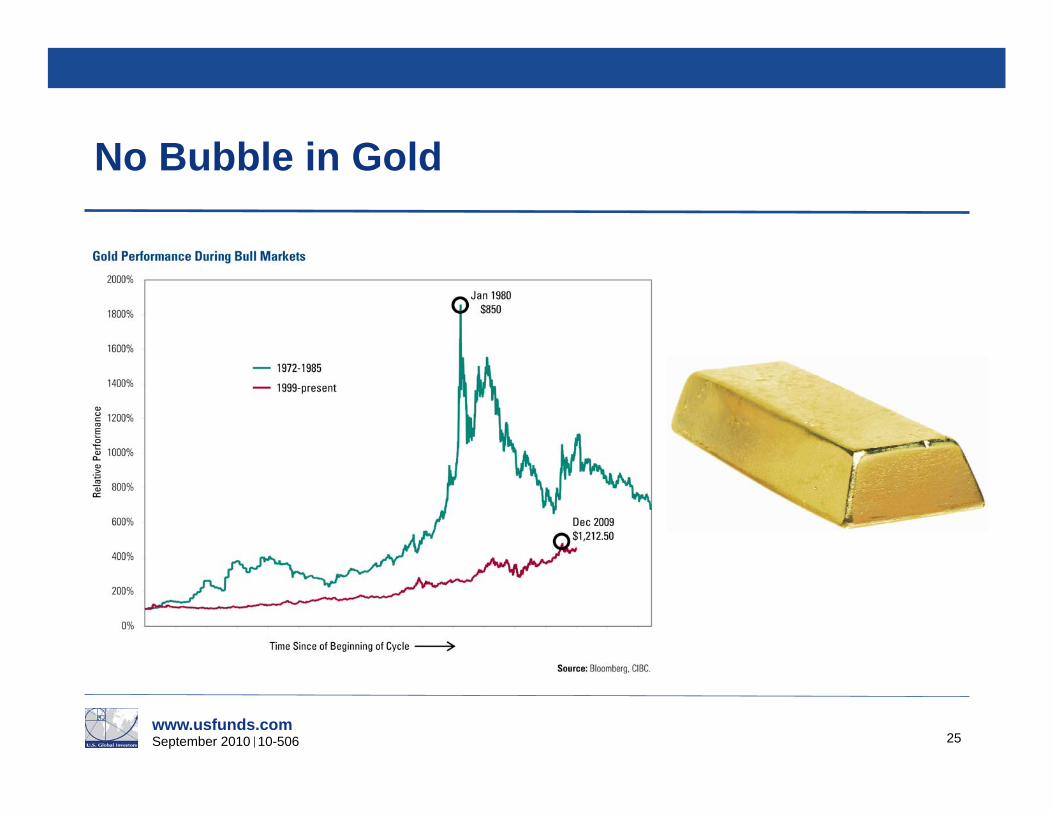
No Bubble in Gold
25
www.usfunds.com September 2010 10-506
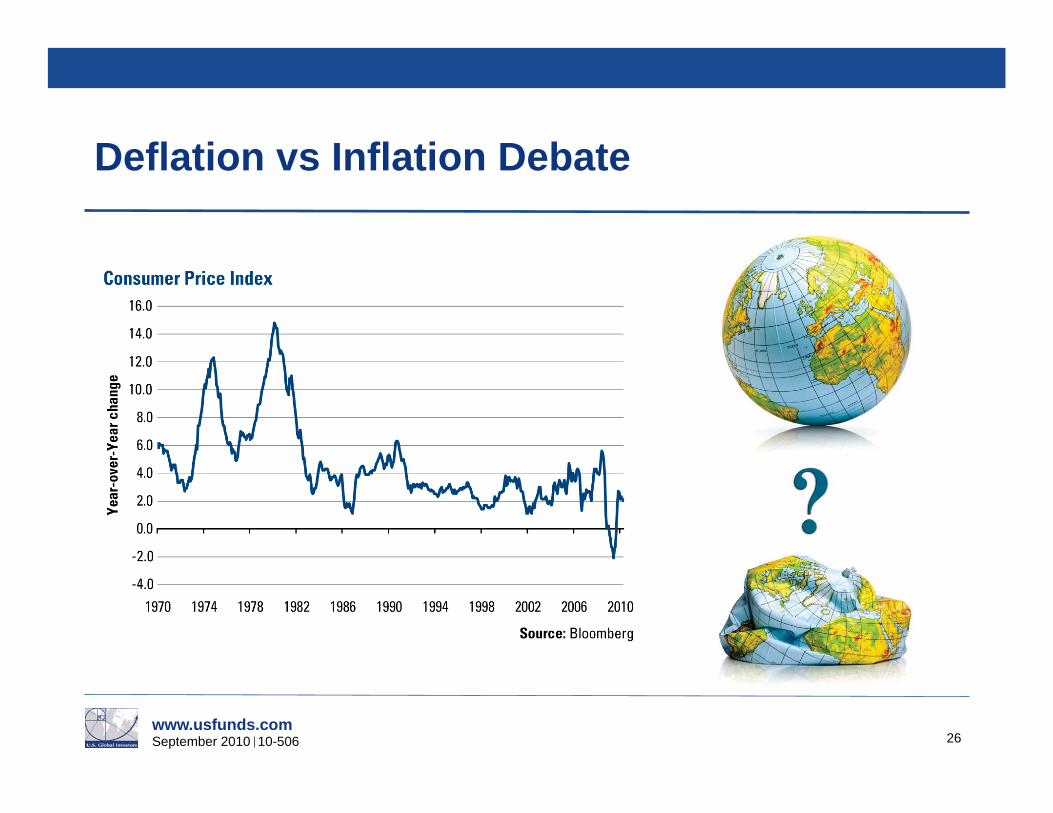
Deflation vs Inflation Debate
26
www.usfunds.com September 2010 10-506
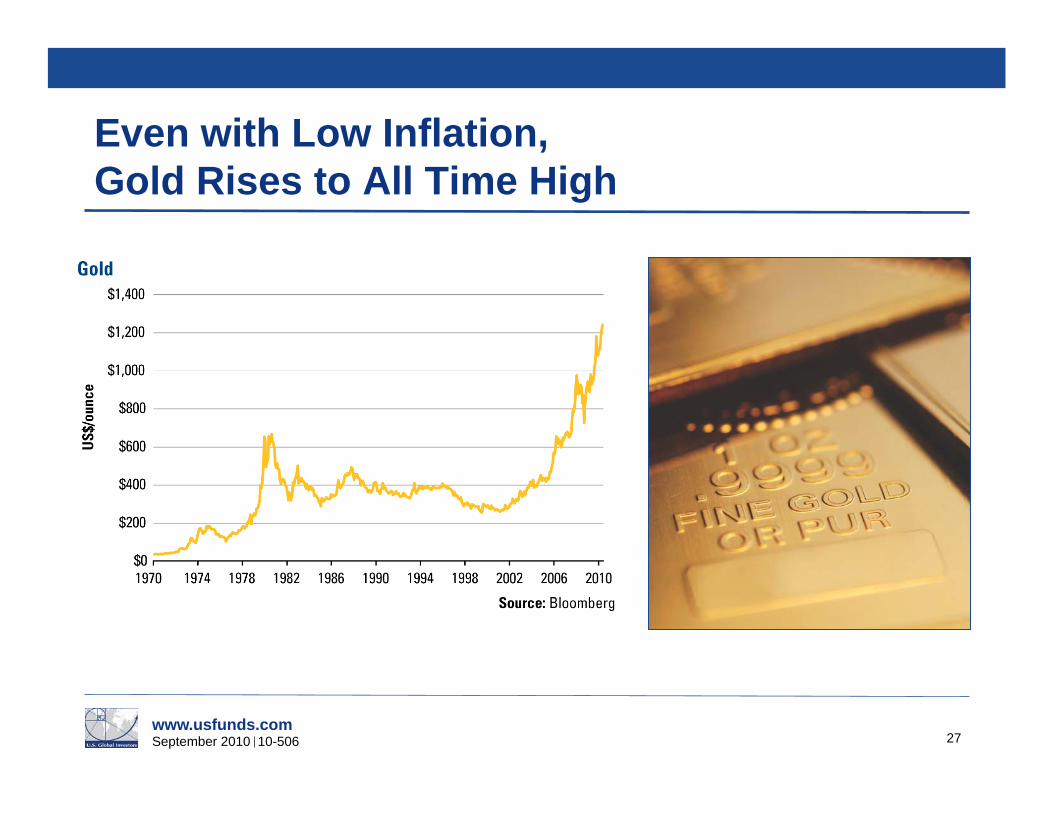
Even with Low Inflation, Gold Rises to All Time High
27
www.usfunds.com September 2010 10-506
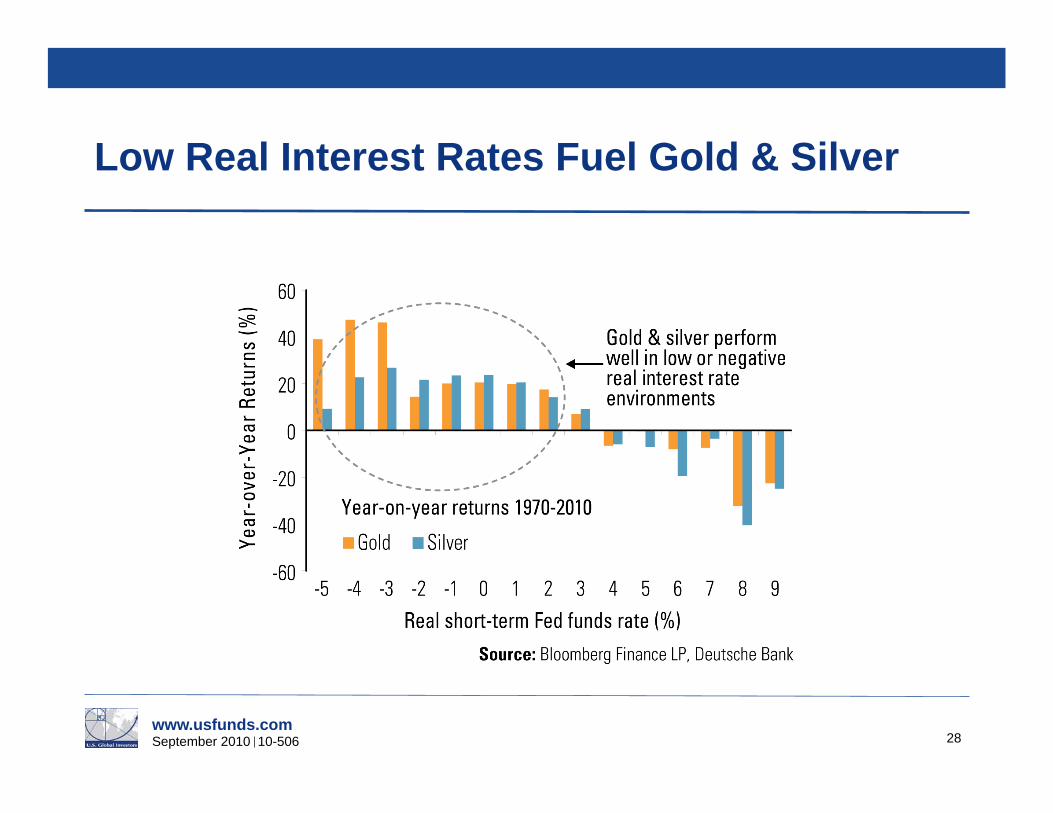
Low Real Interest Rates Fuel Gold & Silver
28
www.usfunds.com September 2010 10-506
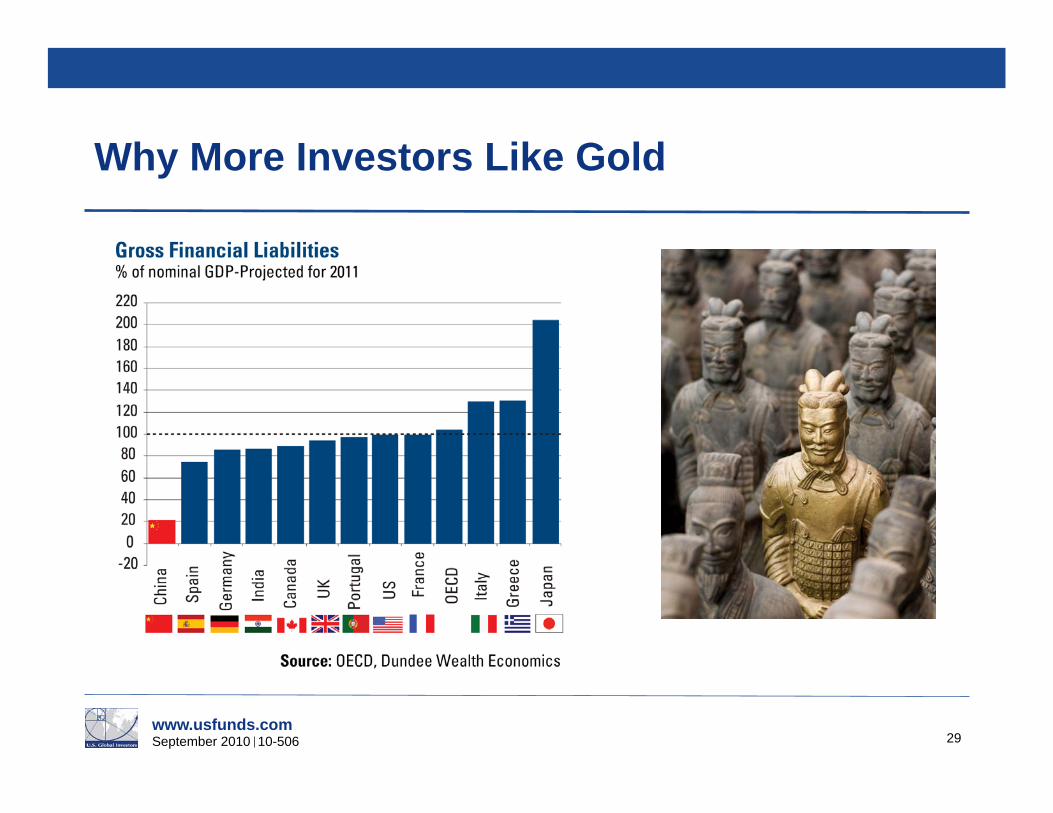
Why More Investors Like Gold
29
www.usfunds.com September 2010 10-506
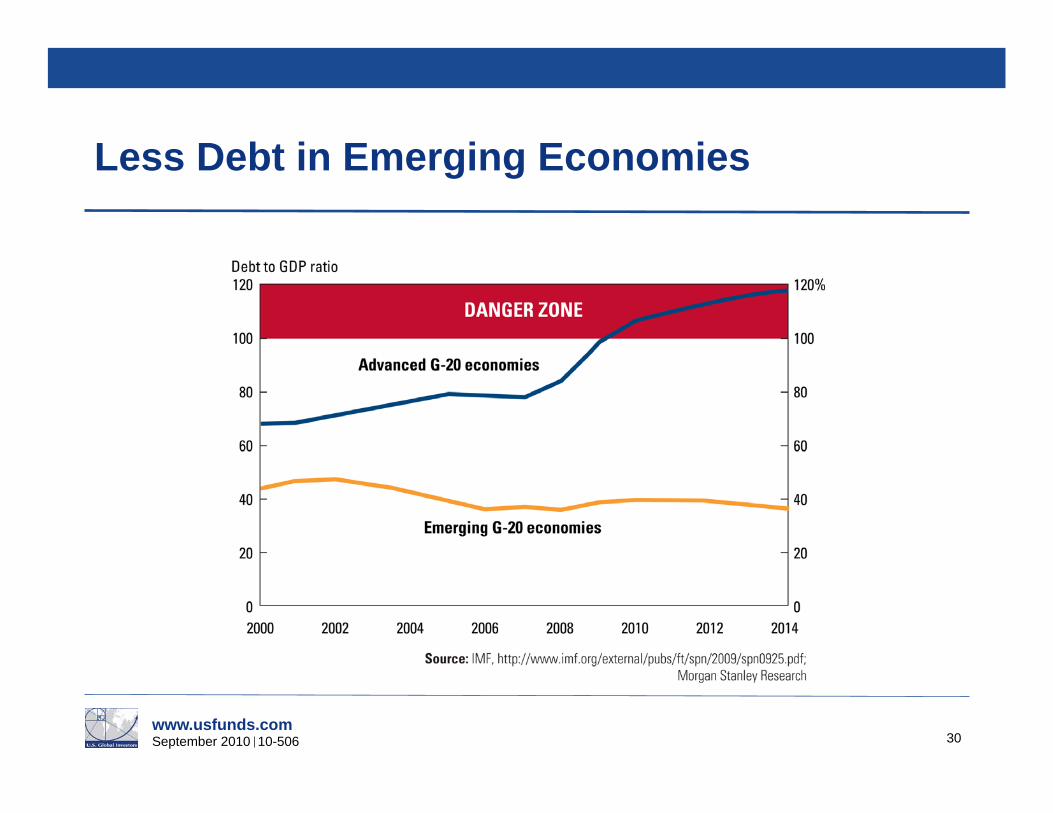
Less Debt in Emerging Economies
30
www.usfunds.com September 2010 10-506
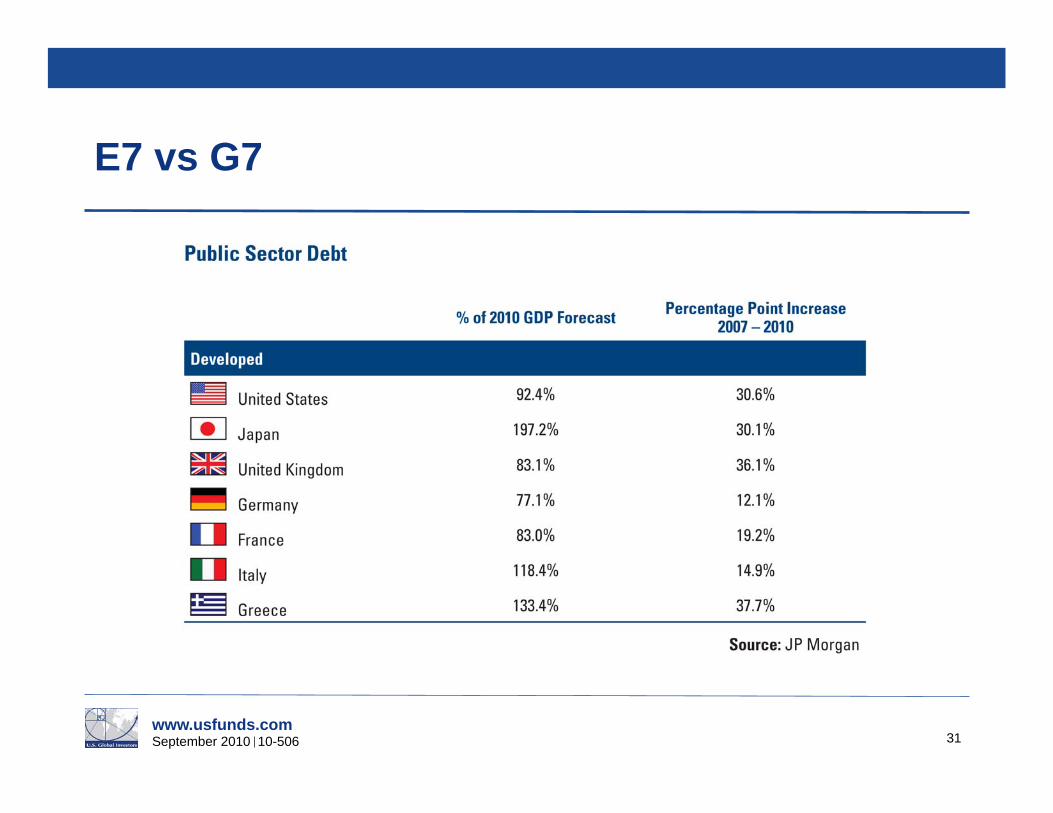
E7 vs G7
31
www.usfunds.com September 2010 10-506
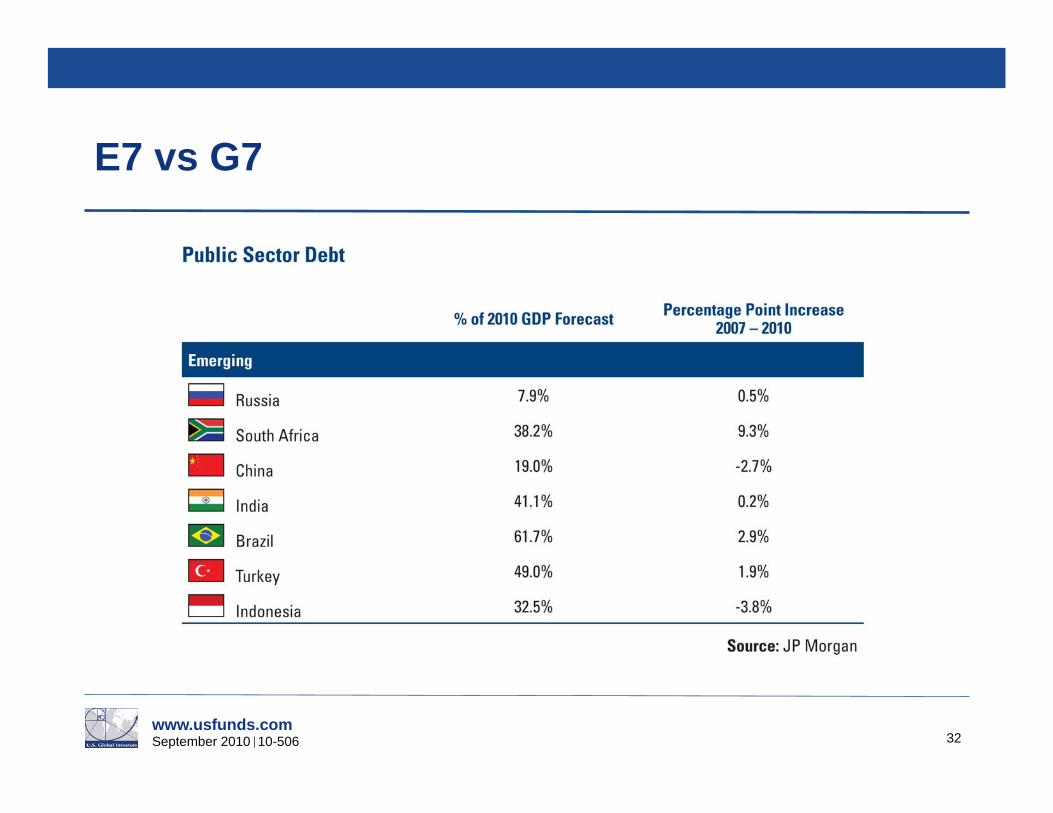
E7 vs G7
32
www.usfunds.com September 2010 10-506
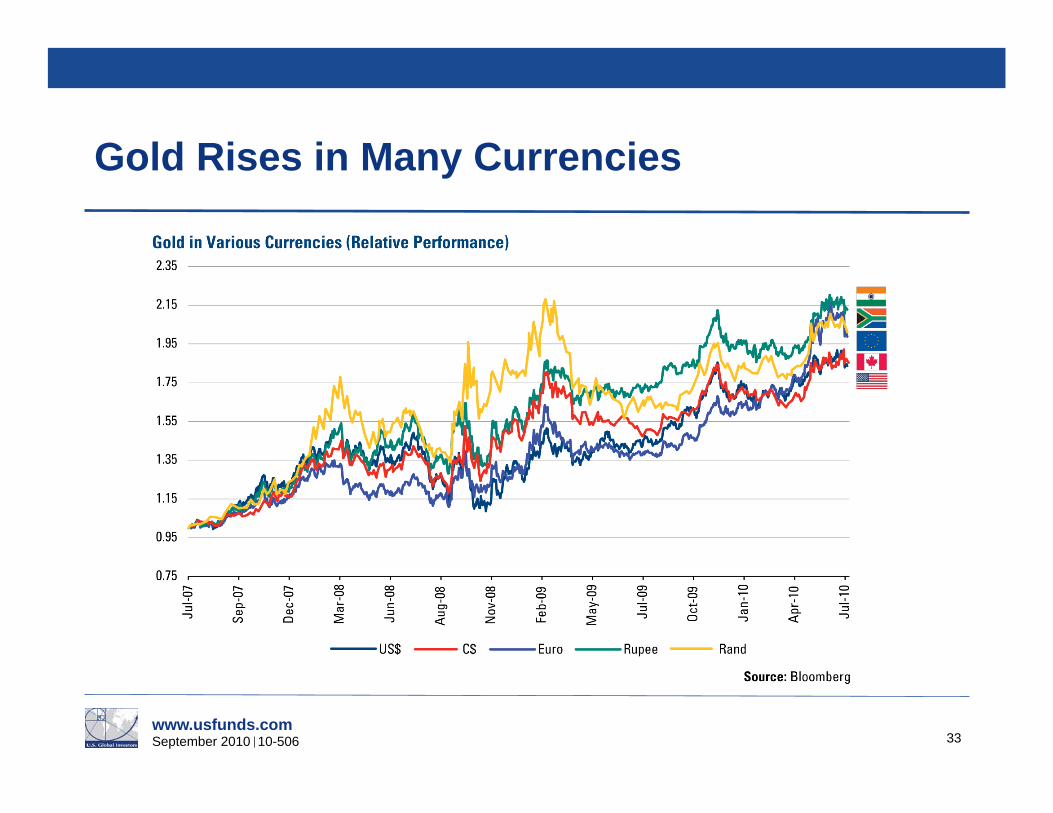
Gold Rises in Many Currencies
33
www.usfunds.com September 2010 10-506
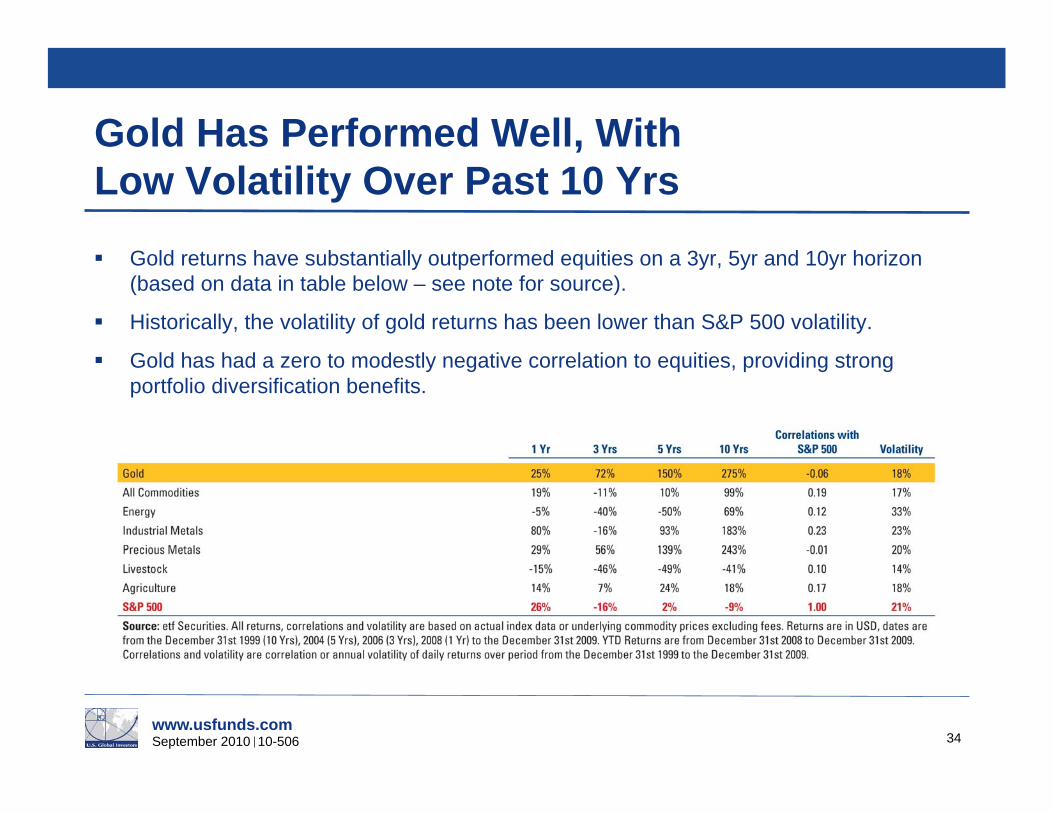
Gold Has Performed Well, With Low Volatility Over Past 10 Yrs
Gold returns have substantially outperformed equities on a 3yr, 5yr and 10yr horizon (based on data in table below – see note for source).
Historically, the volatility of gold returns has been lower than S&P 500 volatility.
Gold has had a zero to modestly negative correlation to equities, providing strong portfolio diversification benefits.
34
www.usfunds.com September 2010 10-506 35
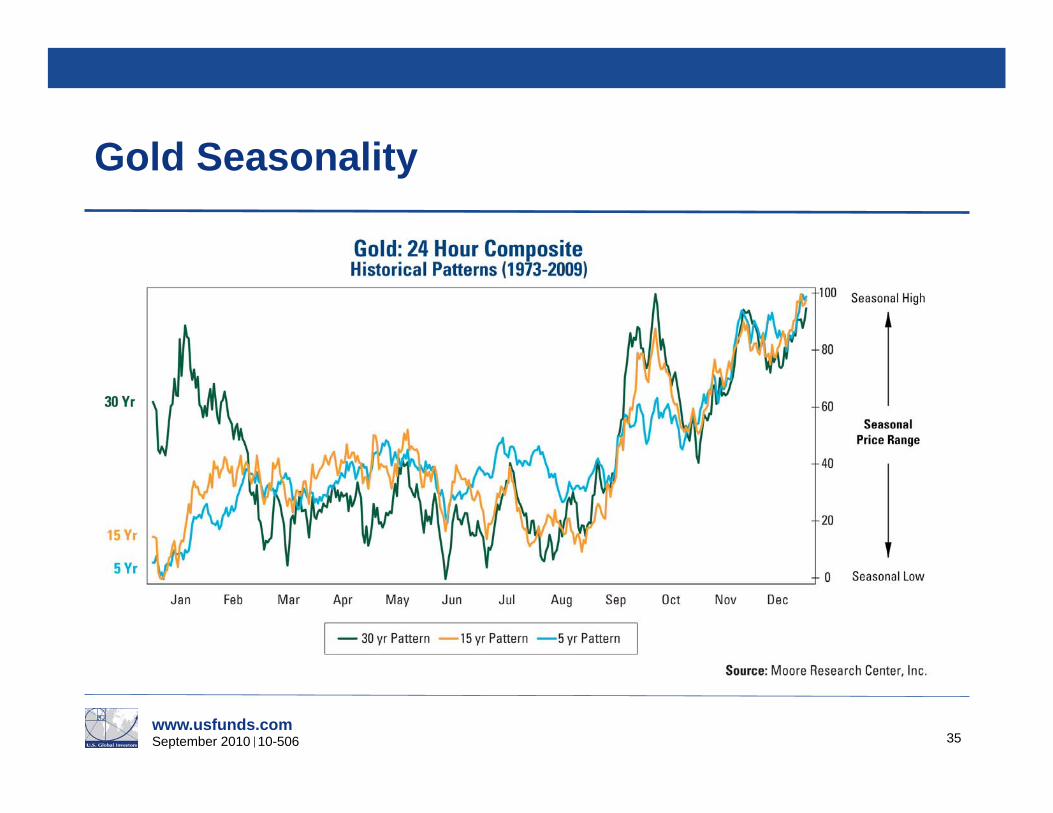
Gold Seasonality
www.usfunds.com September 2010 10-506
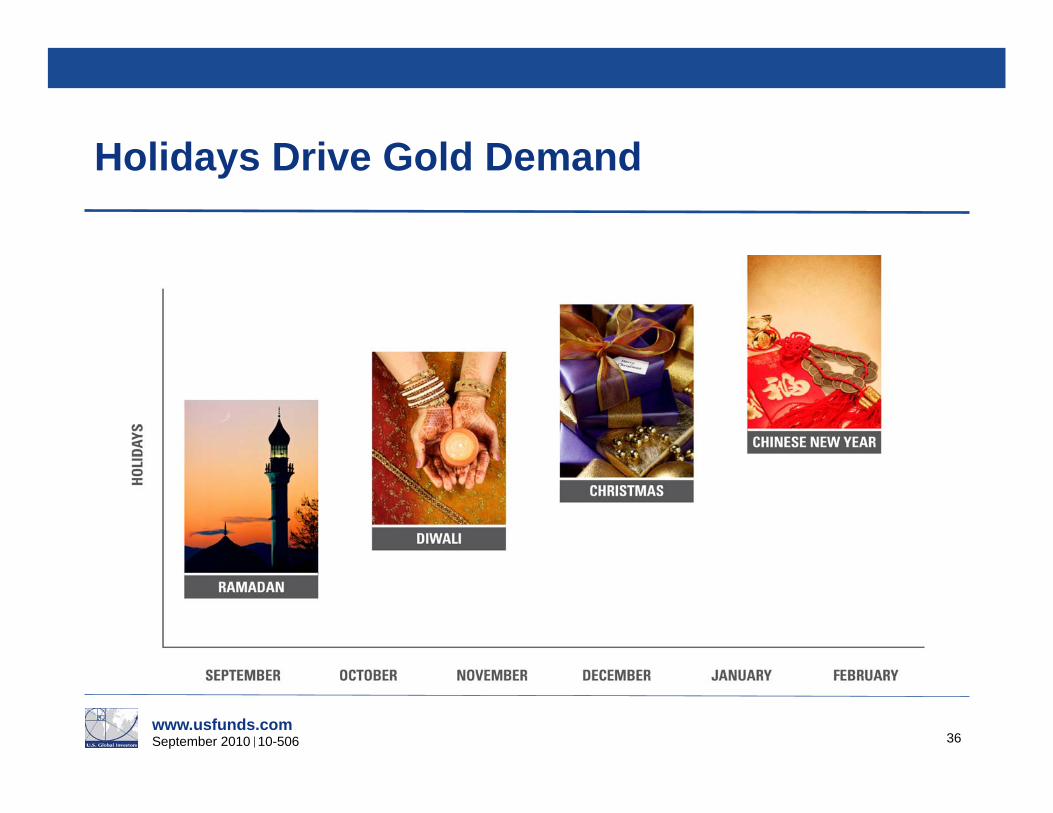
Holidays Drive Gold Demand
36
www.usfunds.com September 2010 10-506 37
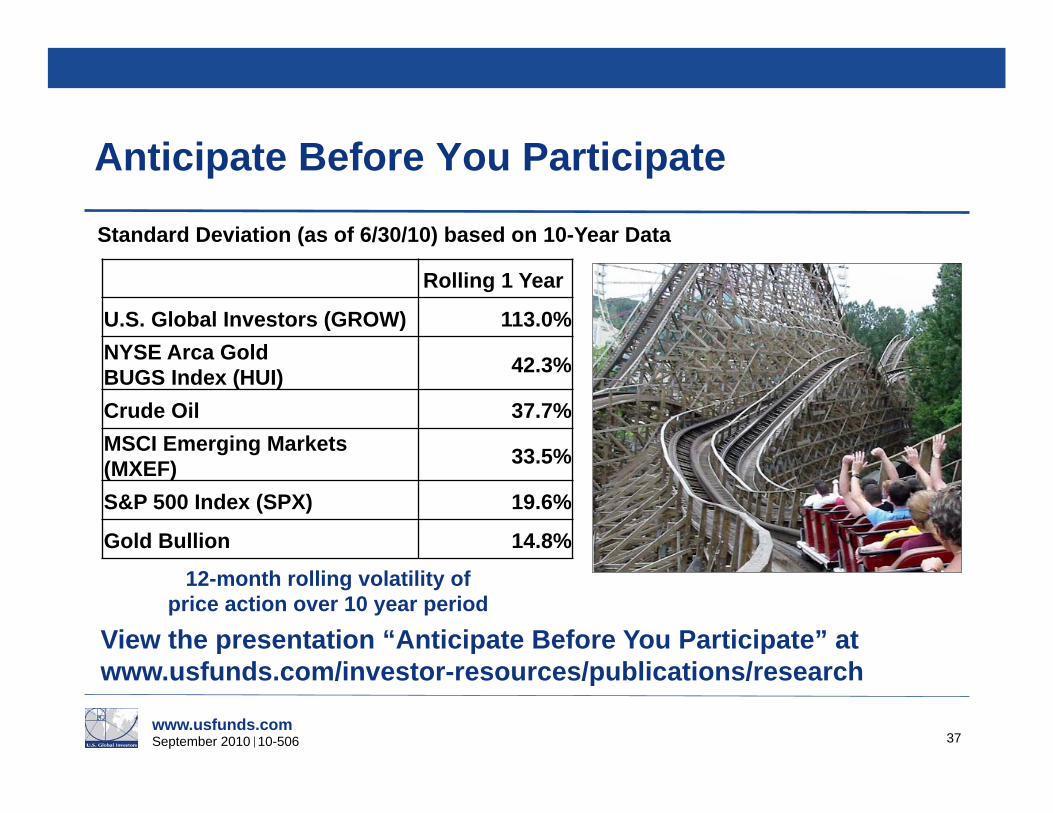
Anticipate Before You Participate
View the presentation “Anticipate Before You Participate” at www.usfunds.com/investor-resources/publications/research
Rolling 1 Year
U.S. Global Investors (GROW) 113.0% NYSE Arca Gold BUGS Index (HUI) 42.3%
Crude Oil 37.7% MSCI Emerging Markets (MXEF) 33.5%
S&P 500 Index (SPX) 19.6%
Gold Bullion 14.8%
12-month rolling volatility of price action over 10 year period
Standard Deviation (as of 6/30/10) based on 10-Year Data
www.usfunds.com September 2010 10-506
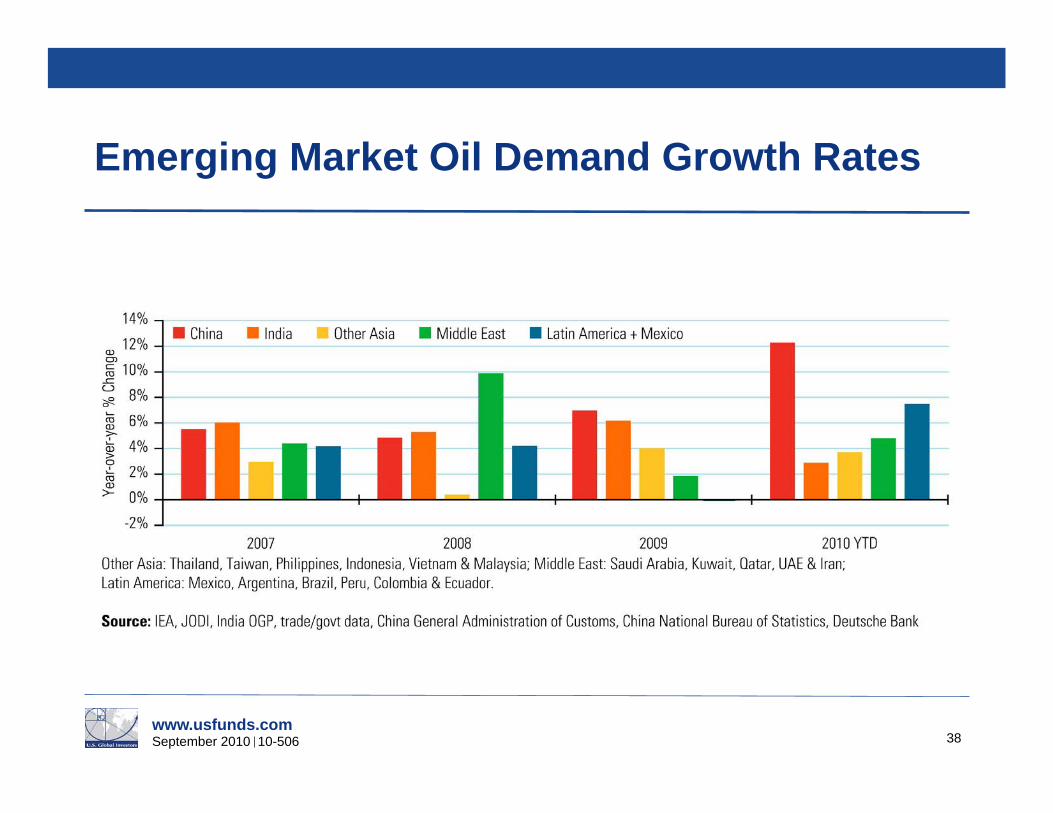
Emerging Market Oil Demand Growth Rates
38
www.usfunds.com September 2010 10-506
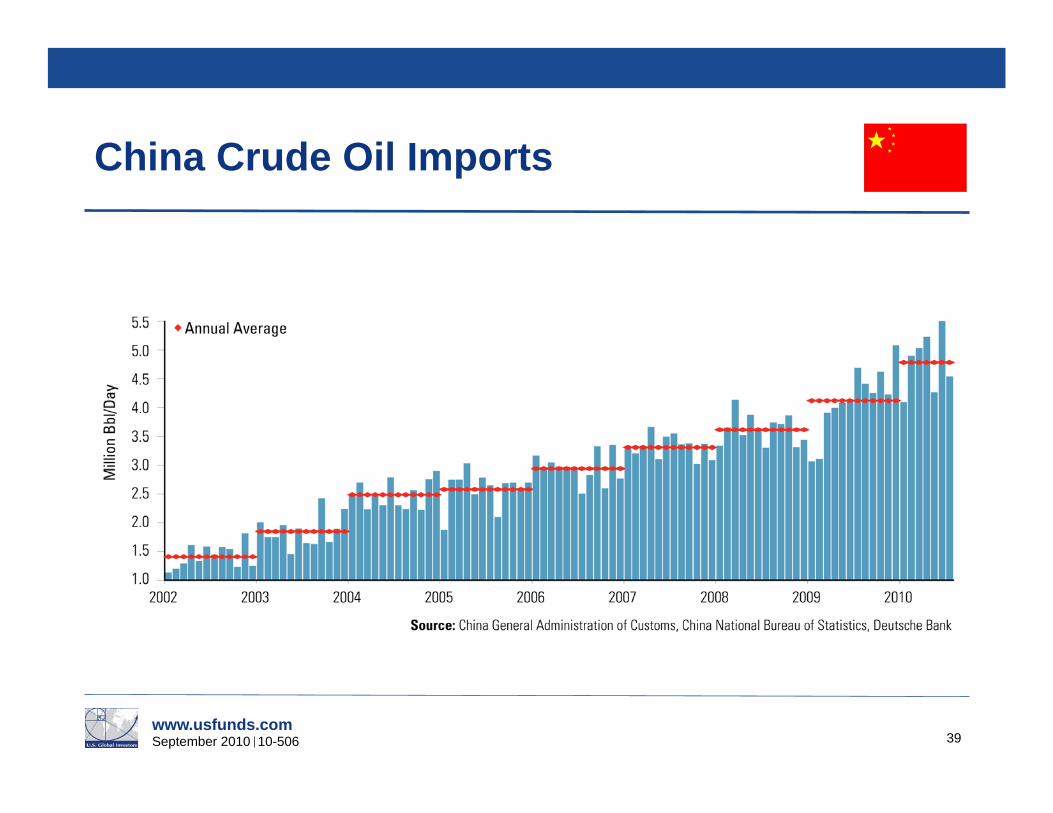
China Crude Oil Imports
39
www.usfunds.com September 2010 10-506
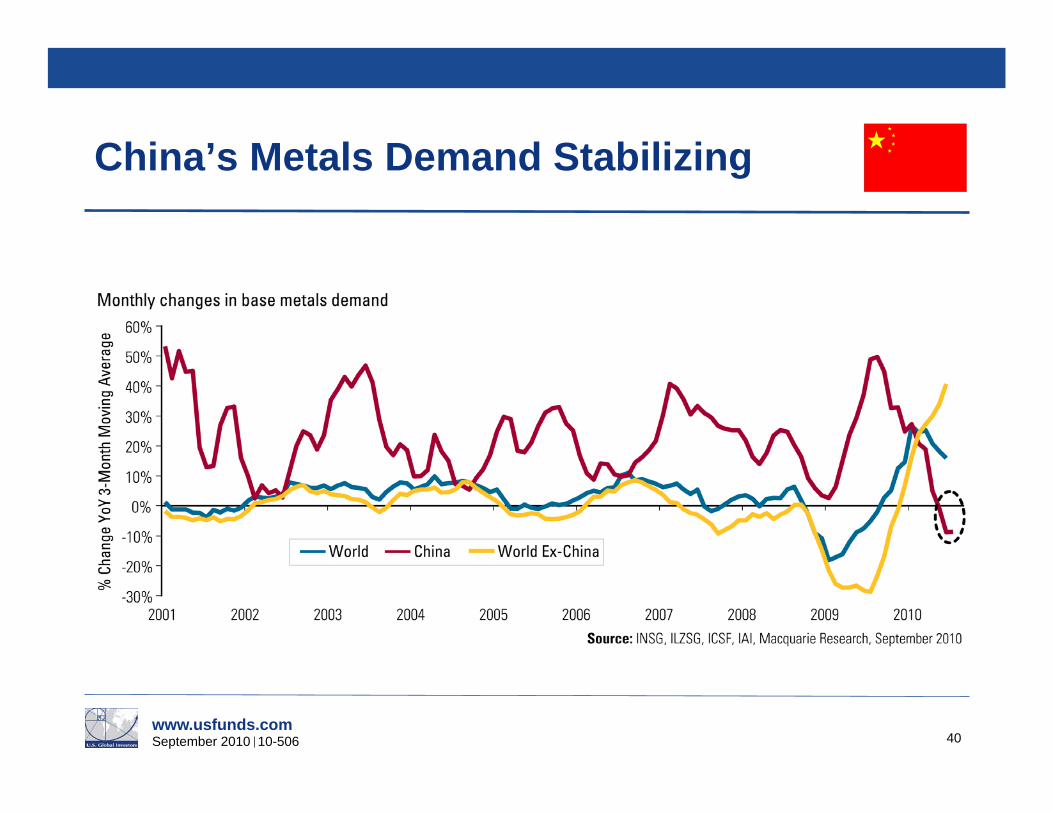
China’s Metals Demand Stabilizing
40
www.usfunds.com September 2010 10-506
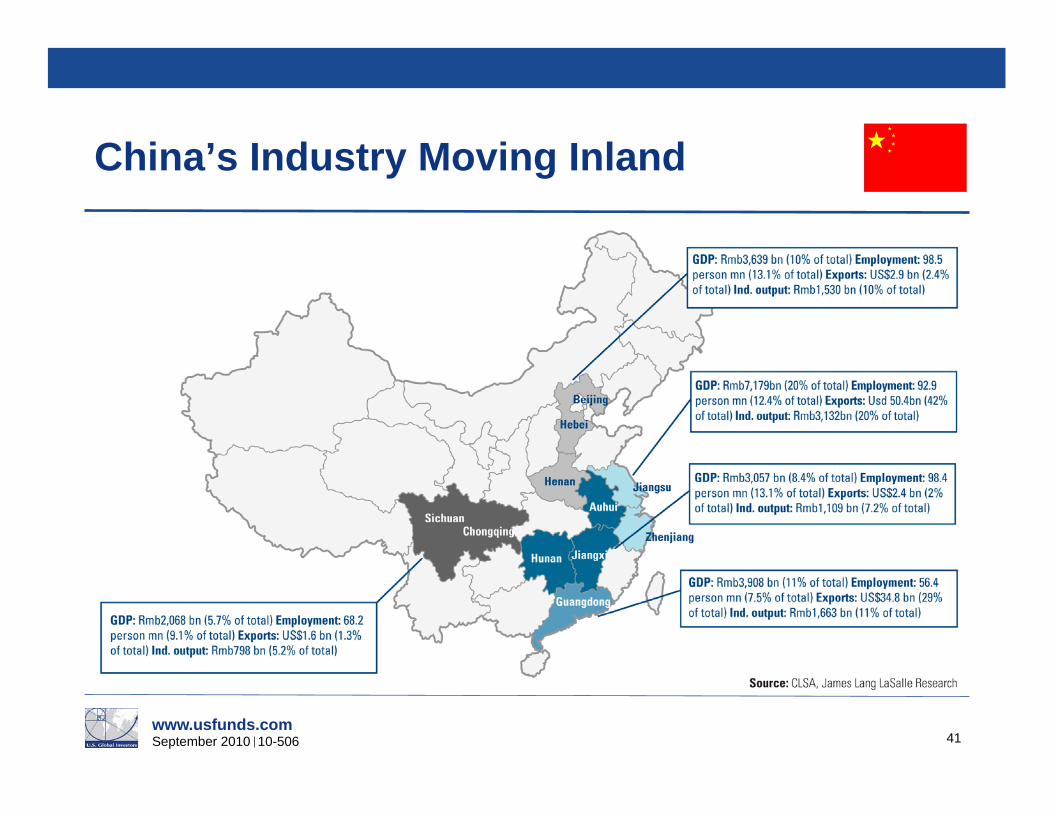
China’s Industry Moving Inland
41
www.usfunds.com September 2010 10-506
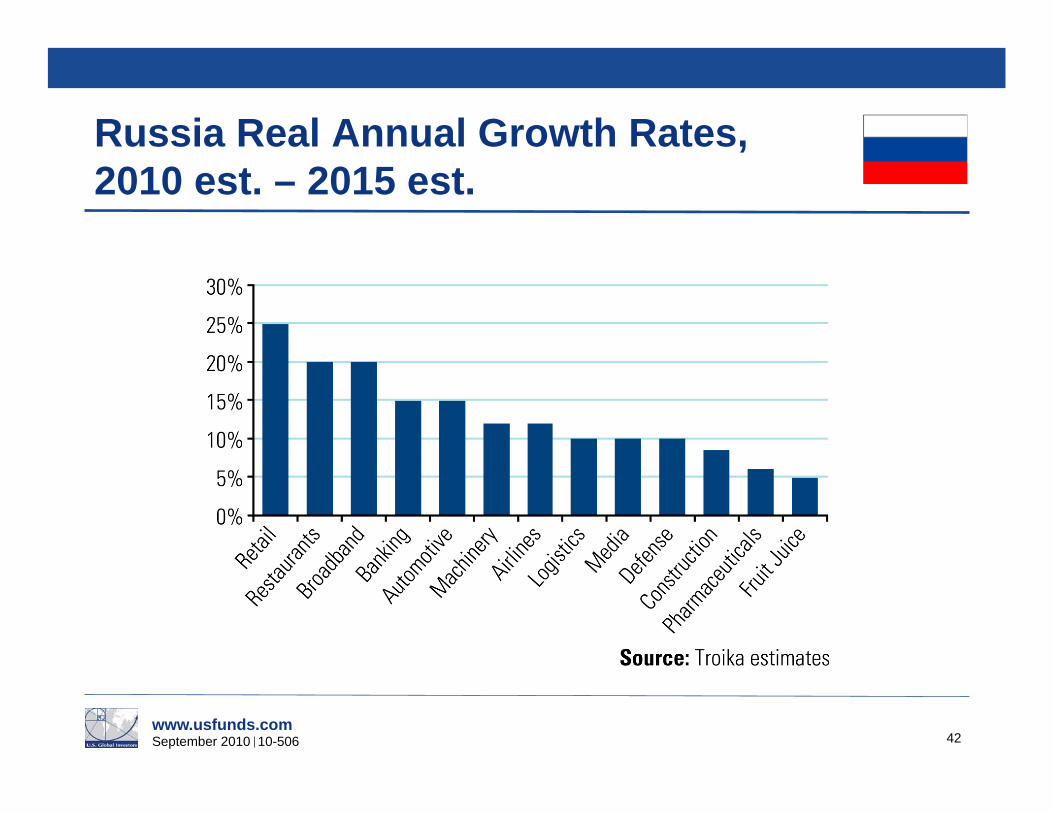
Russia Real Annual Growth Rates, 2010 est. – 2015 est.
42
www.usfunds.com September 2010 10-506 43
Come Visit Us at…
Facebook: www.facebook.com/usfunds
Twitter: www.twitter.com/usfunds
Frank Talk: www.usfunds.com
Investor Alert: www.usfunds.com
www.usfunds.com September 2010 10-506 44
Disclosures
Please consider carefully a fund’s investment objectives, risks, charges and expenses. For this and other important information, obtain a fund prospectus by visiting www.usfunds.com or by calling 1-800-US-FUNDS (1-800-873-8637). Read it carefully before investing. Distributed by U.S. Global Brokerage, Inc.
Gold, precious metals, and precious minerals funds may be susceptible to adverse economic, political or regulatory developments due to concentrating in a single theme. The prices of gold, precious metals, and precious minerals are subject to substantial price fluctuations over short periods of time and may be affected by unpredicted international monetary and political policies. We suggest investing no more than 5% to 10% of your portfolio in these sectors.
All opinions expressed and data provided are subject to change without notice. Some of these opinions may not be appropriate to every investor.
The S&P 500 Financials Index is a capitalization-weighted index. The index was developed with a base level of 10 for the 1941-43 base period. Advanced G-20 economies references members of the G-20 whose economies are considered by the IMF to be developed. This includes Canada, United States, Austria, Belgium, France, Greece, Ireland, Italy, Netherlands, Norway, Portugal, Spain, Sweden, Switzerland, United Kingdom, Australia, Japan and Korea. Emerging G-20 economies references members of the G-20 whose economies are considered by the IMF to be emerging. This includes Brazil, India, Indonesia, Hungary, Russia and Saudi Arabia. Standard deviation is a measure of the dispersion of a set of data from its mean. The more spread apart the data, the higher the deviation. Standard deviation is also known as historical volatility. The Consumer Price Index (CPI) is one of the most widely recognized price measures for tracking the price of a market basket of goods and services purchased by individuals. The weights of components are based on consumer spending patterns. The MSCI Emerging Markets Index is a free float-adjusted market capitalization index that is designed to measure equity market performance in the global emerging markets. The NYSE Arca Gold BUGS (Basket of Unhedged Gold Stocks) Index (HUI) is a modified equal dollar weighted index of companies involved in gold mining. The HUI Index was designed to provide significant exposure to near term movements in gold prices by including companies that do not hedge their gold production beyond 1.5 years. The Russell 2000 Index is a U.S. equity index measuring the performance of the 2,000 smallest companies in the Russell 3000. The Russell 3000 Index consists of the 3,000 largest U.S. companies as determined by total market capitalization. The S&P 500 Stock Index is a widely recognized capitalization-weighted index of 500 common stock prices in U.S. companies.