Embed Size (px)
Citation preview
Part I: Summary Analysis
The Department of the Treasury The Office of Management and Budget
U.S. Government Foreign Credit Exposure As of December 31, 2007

[Data retrieved on 1/8/2009]

Page 3
Table of Contents
U.S. Government Foreign Credit Exposure as of December 31, 2007
Table of Contents
Part I – Summary Analysis A. Introduction ........................................................................................................................................................................ 7
1) Background......................................................................................................................................................... 7 2) Overview ............................................................................................................................................................ 7
a) U.S. Agencies...................................................................................................................................... 7 b) Types of Foreign Exposure ................................................................................................................. 8 c) Key Figures......................................................................................................................................... 9
B. U.S. Government Foreign Credit Exposure ...................................................................................................................... 10
1) Foreign Credit Exposure by Category............................................................................................................... 10 2) Foreign Credit Exposure by Type of Foreign Entity......................................................................................... 12
a) Sovereign Exposure .......................................................................................................................... 12 b) Private Exposure ............................................................................................................................... 12
3) Foreign Credit Exposure by Region.................................................................................................................. 14 4) Foreign Credit Exposure by Credit Rating........................................................................................................ 14
C. U.S. Government Sovereign Loans, Guarantees of Sovereign Debt, and Insurance......................................................... 19
1) Sovereign Foreign Credit by Country, Region, and Agency............................................................................. 19 a) By Country........................................................................................................................................ 19 b) By Region ......................................................................................................................................... 19 c) By Agency ........................................................................................................................................ 19
2) U.S. Government Direct Loans to Sovereign Governments and Foreign Official Entities ................................................................................................................................... 20
• Direct Loan Principal Outstanding.................................................................................................... 20
• Arrears of Principal and Interest ....................................................................................................... 20
• Scheduled Principal and Interest Payments....................................................................................... 20
• Principal Repaid................................................................................................................................ 20
• Interest and Fees Repaid ................................................................................................................... 20 3) U.S. Government Guarantees of Private Loans to Sovereign Governments and Foreign Official Entities ................................................................................................................................... 21
• Guaranteed Loans Principal Outstanding.......................................................................................... 21
• Claims Outstanding........................................................................................................................... 21
• Scheduled Principal and Interest Payments....................................................................................... 22
• Principal Repaid and Interest Paid .................................................................................................... 22
• Rescheduled Claims.......................................................................................................................... 22

Page 4
Table of Contents
4) Bilateral Debt Reduction FY 1990-2008 .......................................................................................................... 22 5) U.S. Government Insurance of Private Loans to Sovereign Governments and Foreign Official Entities ................................................................................................................................... 22
D. U.S. Government Private Loans, Guarantees of Private Debt, and Insurance .................................................................. 23 1) Private Foreign Credit Exposure....................................................................................................................... 23
• By Country........................................................................................................................................ 23
• By Region ......................................................................................................................................... 23
• By Agency ........................................................................................................................................ 23 2) U.S. Government Direct Loans to Foreign Private Entities .............................................................................. 24
• Direct Loan Principal Outstanding.................................................................................................... 24
• Scheduled Principal and Interest payments....................................................................................... 24
• Arrears of Principal and Interest ....................................................................................................... 24
• Principal Repaid................................................................................................................................ 24 3) U.S. Government Guarantees of Private Loans to Foreign Private Entities...................................................... 25
• Guaranteed Loans Principal Outstanding.......................................................................................... 25
• Scheduled Principal and Interest Payments....................................................................................... 25
• Claims Outstanding........................................................................................................................... 25
• Principal and Interest Paid ................................................................................................................ 25 4) U.S. Government Insurance of Private Loans to and Investments in Foreign Private Entities.......................... 25
E. Amounts Due the U.S. Government ................................................................................................................................. 27 1) Amounts due from Sovereign and Other Official Foreign Entities ................................................................... 27 2) Amounts due from Private Foreign Entities...................................................................................................... 30 3) World War I Indebtedness of Sovereign Governments to the U.S. Government .............................................. 32
a) Indebtedness of Foreign Governments to the United States Arising from World War I as of 12/31/2007........................................................................................................... 33 b) Status of German World War I Indebtedness as of 12/31/2007 ........................................................ 34
4) Short-term Insurance and Guarantees ............................................................................................................... 34
F. Description of Data........................................................................................................................................................... 35 G. Glossary of Terms ............................................................................................................................................................ 36 H. Legislative Authority ........................................................................................................................................................ 39 G. Appendix .......................................................................................................................................................................... 41
Part II – Regional, Country, and Dependency Tables
Notes U.S. Government Sovereign Loans and Guarantees of Sovereign and Other Foreign Official Debt

Page 5
Table of Contents
List of Figures U.S. Government Foreign Credit Exposure:
1. By Category of Transaction, 12/31/2007...........................................................................................................................10
2. By Category of Transaction at Year-end, 2003 - 2007 ......................................................................................................10
3. By Type of Foreign Entity, 12/31/2007.............................................................................................................................11
4. By Type of Foreign Entity at Year-end, 12/31/2007 .........................................................................................................11
5. Sovereign by Category of Transaction, 12/31/2007...........................................................................................................12
6. Sovereign by Category of Transaction, 2003 - 2007 .........................................................................................................12
7. Private by Category of Transaction, 12/31/2007 ...............................................................................................................12
8. Private by Category of Transaction at Year-end, 2003 - 2007...........................................................................................13
9. Foreign Credit Exposure by Region-12/31/2007 ...............................................................................................................14
10. Sovereign by Agency and ICRAS Rating, 12/31/2007......................................................................................................15
11. Sovereign by ICRAS Rating, 2003-2007...........................................................................................................................16
12. Private by Agency and ICRAS Rating, 12/31/2007...........................................................................................................17
13. Private by ICRAS Rating 12/31/2007................................................................................................................................18
Sovereign Exposure 14. Largest Sovereign Borrowers ............................................................................................................................................19
15. Sovereign Exposure by Region..........................................................................................................................................19
16. Sovereign Exposure by Agency.........................................................................................................................................19
Sovereign Loans: 17. Sovereign Principal Outstanding, 12/31/2007 ...................................................................................................................20
18. Sovereign Payments, 2003 - 2007 .....................................................................................................................................21
Sovereign Guaranteed Loans: 19. Sovereign Guarantees Principal Outstanding, 12/31/2007.................................................................................................21 Private Exposure: 20. Private Exposure by Country……………………………………………………………………………………….……. 23 21. Private Exposure by Region……………………………………………………………………………………………….23 22. Private Exposure by Agency………………………………………………………………………………………………23 Private Loans: 23. Private Loans Principal Outstanding, 12/31/2007………………………………………………………………………...24 Guaranteed Private Loans: 24. Private Guarantees Principal Outstanding, 12/31/2007 .....................................................................................................25
25. Private Guaranteed Loans Principal and Interest Paid, 2003-2007 ....................................................................................26

Page 6
Table of Contents
List of Tables 1. Largest Sovereign Loan Arrears as of 12/31/2007.............................................................................................................20
2. Largest Sovereign Guarantee Claims Outstanding as of 12/31/2007.................................................................................21
3. Largest Private Loan Arrears as of 12/31/2007 .................................................................................................................24
4. Largest Private Guarantee Claims Outstanding as of 12/31/2007......................................................................................25
5. Amounts Due the U.S. Government From Sovereign and
Other Foreign Official Obligors as of 12/31/2007.............................................................................................................27
6. Amounts Due the U.S. Government from Foreign Private Obligors as of 12/31/2007......................................................30
7. Indebtedness of Foreign Governments to the United States Arising from World War I as of 12/31/2007 ........................33
8. Status of German World War I Indebtedness as of 12/31/2007.........................................................................................34
Appendix A Tables
A1 U.S. Government Foreign Credit Exposure to Regional Programs..................................................................................42
A2 U.S. Government Sovereign Foreign Credit Exposure by Region and Country ..............................................................43
A3 U.S. Government Direct Loans to Sovereign Obligors and Other Official Obligors
Outstanding Principal Amounts as of 12/31/2007 ...........................................................................................................47
A4 U.S. Government Loan Guarantees to Sovereign Obligors Principal Outstanding as of 12/31/2007 ..............................51
A5 U.S. Bilateral Debt Reduction, FY 1990 - 2008 ..............................................................................................................53
A6 Maximum Contingent Liability (Unadjusted) and Claims Outstanding on U.S. Government
Insurance Contracts Covering Private Transactions with Sovereign and Other
Foreign Official Obligors as of 12/31/2007.....................................................................................................................56
A7 U.S. Government Private Foreign Credit Exposure by Region and Country ...................................................................57
A8 U.S. Government Direct Loans to Private Foreign Entities
Outstanding Principal Amounts as of 12/31/2007 ...........................................................................................................62
A9 U.S. Government Loan Guarantees to Private Foreign Entities as of 12/31/2007 ...........................................................65
A10 Maximum Contingent Liability (Unadjusted) and Claims Outstanding on U.S. Government Insurance Contracts
Covering Private Transactions with and Investments in Foreign Private Entities............................................................68
A11 Maximum Contingent Liability and Claims Outstanding on U.S. Government Short-term
Insurance Contracts and Loan Guarantees.......................................................................................................................72

Page 7
A. Introduction
U.S. Government Foreign Credit Exposure as of December 31, 2007 Part I: Summary Analysis A. Introduction 1) Background This edition of U.S. Government Foreign Credit Exposure (December 31, 2007) was compiled under the authority of section 114 of the Budget and Accounting Procedures Act of 1950. The first publication in this series was launched by Conference Report 101-344, dated November 11, 1989, which requested that the Department of the Treasury and the Office of Management and Budget report on payments made and owed by foreign governments on outstanding credits. The report became a regular publication of the U.S. Treasury when the House Committee on Appropriations report on the 1992 Foreign Operations, Export Financing, and Related Programs Appropriations Bill directed that the information be submitted annually. This report also provides information requested under 22 USC 2656h(b). 2) Overview Foreign credit exposure is defined as the maximum financial amount which the U.S. Government has at risk as a consequence of U.S. Government agencies’ long-term foreign loan and loan guarantee programs, insurance of U.S. private lending and investment abroad, and other financial commitments involving foreign governments, other foreign official entities, and foreign private entities. Foreign credit exposure is measured as the sum of the amounts of principal outstanding, interest and fees in arrears one day or more on direct loans, claims outstanding one day or more arising from payments under guarantee and insurance contracts, contingent liability on guarantee contracts, and maximum contingent liability on insurance contracts. The United States Government’s credit exposure to foreign countries is a result of agency programs that have for-eign clients. These agencies include: Commodity Credit Corporation of the Department of Agriculture, the De-partment of Defense, the Export-Import Bank of the United States, the Department of Transportation, the Agency for International Development, the Financial Management Service of the Department of the Treasury, and the Overseas Private Investment Corporation. a) Agency programs resulting in financial exposure. The Commodity Credit Corporation (CCC) is a government-owned and operated entity that was created to sta-bilize, support, and protect farm income and prices. CCC also helps maintain balanced and adequate supplies of agricultural commodities and aids in their orderly distribution through the PL-480 program. In terms of foreign assistance, the CCC sells agricultural commodities to foreign governments and oversees the donation of food to domestic, foreign, or international relief agencies. It also assists in the development of new domestic and foreign markets and marketing facilities for agricultural commodities and provides direct loans and guarantees.

Page 8
A. Introduction
The Defense Security Cooperation Agency (DSCA) is an agency of the Department of Defense (DOD) that leads, directs and manages security cooperation programs. It strengthens America's alliances and partnerships through: 1) transfer of Defense capabilities, 2) international military education, and 3) humanitarian assistance and mine action. Its financial programs consist of DSCA and the Defense Export Loan Guarantee program (DELG). The DSCA provides direct loans for security assistance programs, while the DELG provides loan guarantees. Both programs facilitate the export of U.S. defense articles, including implements of war and military manufacturing equipment. Assistance is lim-ited to select countries, such as NATO members and major non-NATO allies. The Export-Import Bank of the United States (EXIM) provides guarantees of working capital loans for U.S. export-ers, and guarantees the repayment of loans or makes loans to foreign purchasers of U.S. goods and services. EXIM also provides credit insurance against non-payment by foreign buyers thereby reducing political or commercial risk of official or private transactions. The Bank is a government-held corporation but is not an aid or development agency. The Maritime Administration (MARAD) of the Department of Transportation (DOT) was created to promote the development and maintenance of a modern and efficient United States merchant marine. MARAD provides loan guar-antees to both foreign and domestic companies that construct vessels in the United States under its Title XI financing program. The program is also available to help finance modernization of U.S. shipyards. Through the Title XI pro-gram, MARAD is able to enhance the U.S. shipbuilding industry's capacity to facilitate commerce and serve as an aux-iliary in time of war or national emergency. The Agency for International Development (AID) is an independent federal government agency that receives overall foreign policy guidance from the Secretary of State. The agency provides direct loans and guarantees to support long-term and equitable economic growth and to advance U.S. foreign policy objectives by supporting economic growth, agriculture, trade, and global health. It also provides democracy, conflict, and humanitarian assistance. The Develop-ment Credit Authority (DCA) is the legislative authority that permits AID to issue partial loan guarantees to private lenders to achieve the economic development objectives in the Foreign Assistance Act of 1961 (FAA), as amended. DCA is not used for loans or guarantees to sovereign entities. However, a few DCA guarantees have covered debt is-sued by autonomous institutions as described in the OECD definition of "Official Sector" and are included with Sover-eign and Other Foreign Official Entities in this publication. The Financial Management Service (FMS) provides centralized debt collection services to most federal agencies and provides government-wide accounting and reporting. FMS takes over responsibility for reporting and collecting debts that are delinquent by 180 days or more and older debts, such as those arising from World War II. The Overseas Private Investment Corporation (OPIC) mobilizes and facilitates the participation of United States private capital and skills in the economic and social development of less developed countries and regions, and countries in transition from non-market to market economies. It does this by insuring overseas investments against political risks; financing business overseas through loans and guarantees; financing private investment funds that provide equity to businesses overseas; and advocating the interests of the American business community overseas. b) Exposure occurs when Agencies lend, guarantee, or insure against risk. A direct loan is an obligation created when the Government agrees to disburse funds or goods to, and contracts with, the debtor for repayment over a period of time, with or without interest. A guarantee of a loan is a legally binding agreement to pay part or all of the amount due on a debt instrument extended by a lender in the event of nonpayment by the borrower. Insurance is a legally binding agreement to insure exporters, investors, and lenders against specific risks during speci-fied periods. EXIM insurance covers the commercial and political risks of nonpayment of export obligations. OPIC insurance covers transfer and political risks associated with foreign investments.

Page 9
A. Introduction
c) Key Figures
• As of 12/31/2007 U.S. Government foreign credit exposure stood at $97.7 billion, down nearly $23.7 billion from the high point at the end of 2004. About one-quarter of the exposure reduction—$5.7 bil-lion—took place in 2005. A little more than one-half —$13.2 billion—occurred in 2006. The remaining $4.9 billion came off in 2007 (see Figure 2, p. 10).
• The overall decline in foreign credit exposure in 2007 is more than explained by a $6.1 billion drop in the
official component. A $1.3 billion increase in private exposure offset part of the official runoff and in-creased the private sector share of total exposure by three percentage points. (see Figure 4, p. 11).
• During 2007, insurance and guarantees (I and G) further increased their importance as the main sources of
U.S. Government foreign credit exposure. they reached the 75 percent mark by the end of the year. I and G are the preferred types of contract for transactions with private entities. They account for 94 percent of private exposure (see Figure 7, p. 12) but only 63 percent of sovereign exposure (see Figure 5, p. 12)
• The Middle-East and North Africa was the region with the largest U.S. Government foreign credit expo-
sure, accounting for approximately 31 percent of the total (see Figure 9, p. 14). Exposure to Official Obligors
• The ten largest sovereign borrowers account for over 67 percent of total U.S. Government sovereign for-eign credit exposure (see Figure 14, p. 19) at the end of 2007.
• Less than a quarter (23 percent) of U.S. Government sovereign foreign credit exposure results from con-
cessional (below market) lending programs (see Table A2, p. 43). • AID is the largest agency source of sovereign foreign credit exposure but only by a small amount. EXIM
and AID are each responsible for about 39 percent of sovereign exposure. (see Figure 16, p. 19). • Official obligors benefited from $24.9 billion in bilateral debt reductions from FY 1990 to FY 2007. Of
this amount, about $4.8 billion was under Debt Reduction for the Poorest, Heavily Indebted Poor Coun-tries (HIPC), and Enhanced HIPC terms (see Table A5, p. 53).
Exposure to Private Obligors
• Private entities accounted for $37.8 billion or about 39 percent of total U.S. Government foreign credit exposure. Private exposure was geographically concentrated with 47 percent associated with ten coun-tries (see Figure 20, p. 23).
• Over 99 percent of U.S. Government foreign credit exposure to private entities is non-concessional.
EXIM and OPIC are the most important agencies with this kind of business; they respectively account for 63 percent and 29 percent of total U.S. Government private foreign credit exposure (see Table A7, p. 59).
• EXIM and OPIC also insure against risk arising from transactions with or investments in private entities
OPIC’s political risk program comprises more than 76 percent of the $4.7 billion private insurance maxi-mum contingent liability total (see Table A10, p. 70).
Page 10
B. U.S. Government Foreign Credit Exposure
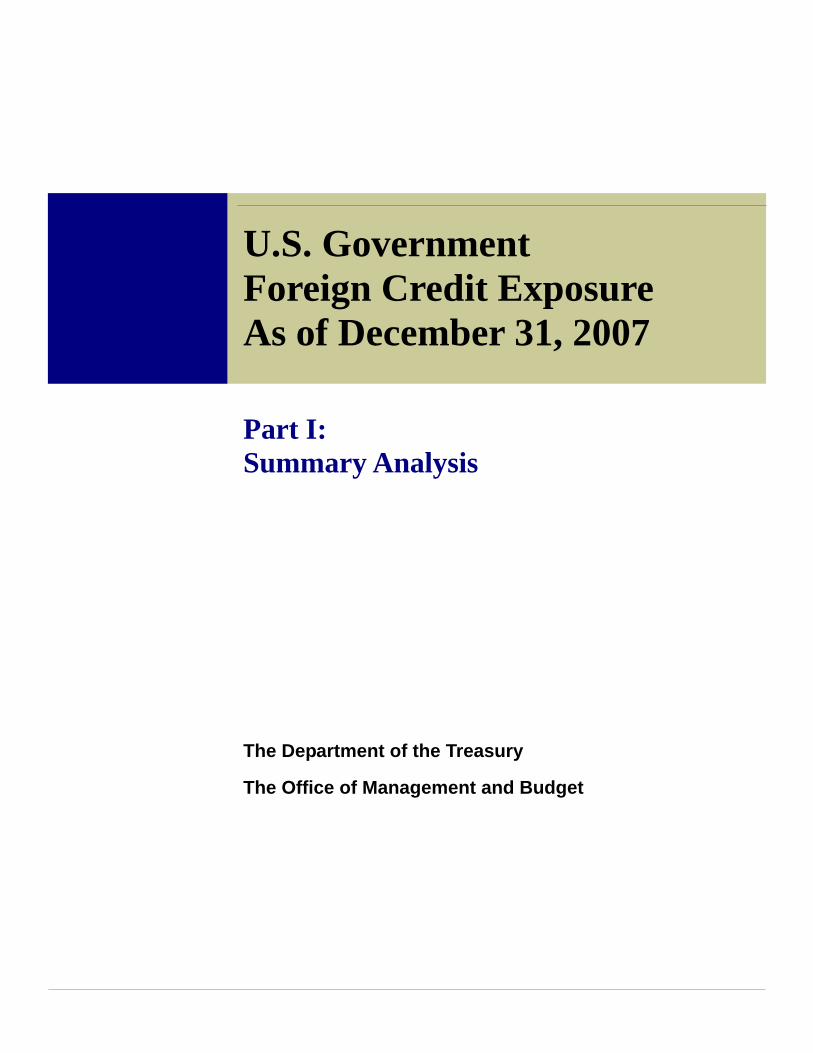
B. U.S. Government Foreign Credit Exposure 1) Foreign Credit Exposure by Category U.S. Government foreign credit exposure passed a kind of milestone in 2007 by dropping below $100 billion for the first time in recent memory. At the end of the year, total foreign exposure was $97.7 billion, down about $4.9 billion from the end of 2006.
The main source of the change was $3.4 billion net repayment of direct loans but the other categories of exposure also contributed. Insurance dropped $673 million. Guarantees pulled back $796 million. Figure 1 shows that guarantees were the largest con-tractual category as measured by contribution to ex-posure at the end of 2007. Guarantee exposure (including claims) totaled $68.4 billion or about 70
percent of total. Direct Loans and related items was the second largest contractual category, amounting to $24.6 billion or 25 percent of total exposure. The smallest category consisted of insurance related prod-ucts. These added $4.7 billion or about 5 percent of total exposure. Although only the three largest categories of exposure are explicitly identified in Figure 1, the charts in fact include all the small categories that enter our expo-sure calculation. The loan amount shown in figures 1 and 2 includes interest and fees in arrears; the guaran-tee amount includes claims arising from guarantee programs, and insurance exposure includes claims arising from insurance. Taking a slightly longer view, Figure 2 shows that total exposure has been trending downward since 2004. Direct loan exposure has come down nearly $16 billion from more than $40 billion to a little less than $24 billion. Exposure related to insurance in force also contributed to the decline, dropping from nearly $10 billion to $4 billion. Guarantees rose in 2003 and 2004 but have been approximately flat for the past two years. The decline in loan exposure over the past few years is partly explained by official skepticism regarding the effectiveness of development lending. As a conse-quence, only a small number of disbursements oc-curred and were undertaken for other purposes. Some reflected US participation in a Paris Club debt re-schedule and some handled residual amounts of loans otherwise treatable under the Tropical Forest Conservation Act (TFCA). Small amounts of addi-tional lending took the form of import support ($2
—————————————————————-
* Note: World War I indebtedness is reported separately in Section E (3). Short-term indebtedness is also reported separately in Section E (4).
Figure 1U.S. Government Foreign Credit Exposure
by Category of Transaction12/31/2007
$97.7 billion
Loans$24.6 billion
(25%)
Insurance$4.7 billion
(5%)
Guarantees$68.4 billion
(70%)
Individual values may not sum to total due to independent rounding.
Figure 2U.S. Government Foreign Credit Exposure
at Year-end 2003-2007 by Category of Transaction
0
20
40
60
80
100
120
140
2003 2004 2005 2006 2007
Year-end
Billi
ons of
U.S
. Dol
lars
LoansInsuranceGuaranteesTotal Exposure
Page 11
B. U.S. Government Foreign Credit Exposure
million); food aid ($3.5 million); Air transport ($17.4 million); and military assistance ($207 mil-lion). Accelerated debt repayment also reduced loan ex-posure over the past several years. Ordinary repay-ment were augmented by flows related to debt re-duction, debt reschedule, and prepayment transac-tions. The first item, Debt reduction, augmented the $3 billion repayment stream by $87 million. Prepayment by two countries, Peru and Macedonia added $482 million to the 2007 repayment stream.
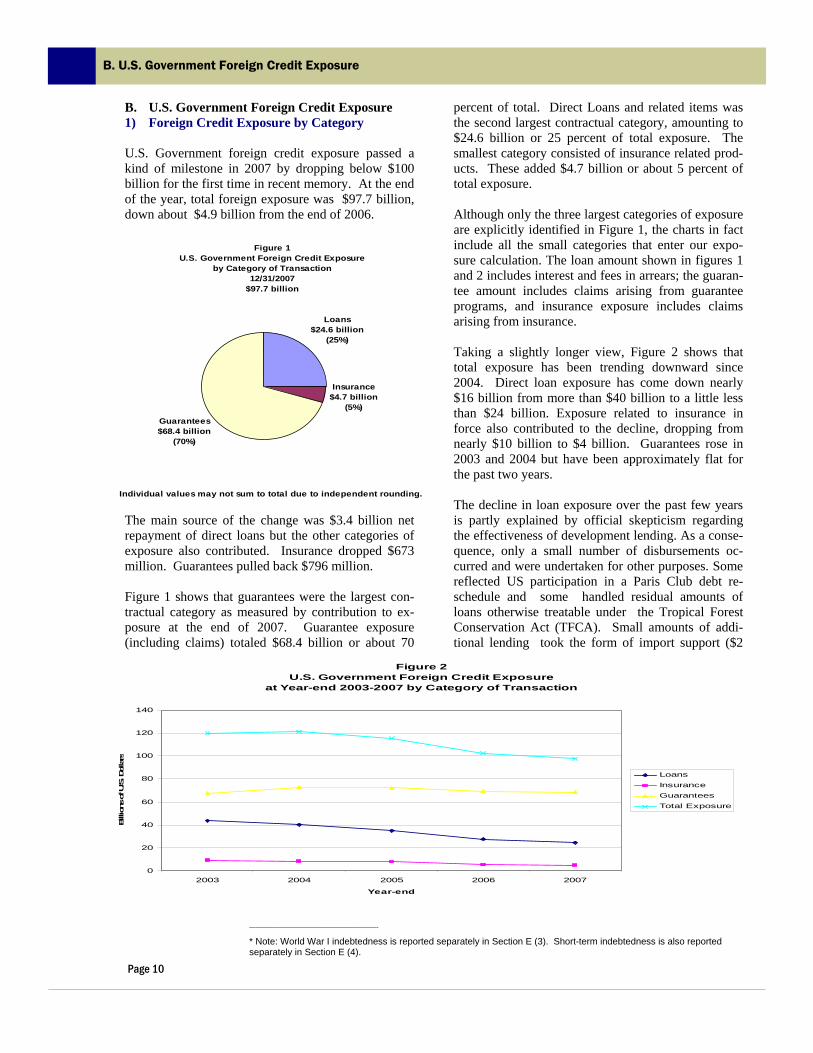
Finally payments associated with a reschedule raised the repayment total by a little more than $283 million but also raised disbursements by a comparable amount. Falling direct loan exposure shown in Figure 2 had a significant impact on overall exposure for some agencies but not all. Loan and total exposure re-ported by the USDA fell more than 50 percent be-tween 2003 and 2007. For EXIM, however, the fall in loan exposure was offset by an increase in exposure related to guarantees. AID had a large exposure based on lending but much of this expo-sure still existed at the end of 2007 because AID loans are concessional. Concessional loans are rarely paid down in advance of maturity. One other distinction based on type of customer affected the guarantee portfolio of USG agencies. Namely, agencies with programs aimed at private obligors grew while those aimed at official obligors generally declined. This difference is sufficient to explain guarantee growth at EXIM and OPIC and program declines at AID, DOD, MARAD, and USDA. It is easy to find examples that illustrate this proposition. AID programs designed to pro-mote housing; assist Israel, and implement develop-ment credit contracted by $790 million. DOD guar-antees to implement military assistance dropped $359 million; USDA reduced CCC guarantees by $262 million.
Figure 3U.S. Government Foreign Credit Exposure
by Type of Foreign Entity12/31/2007
$97.7 billion
Private Obligor
$37.8 billion (39%)
Official Obligor
$59.9 billion (61%)
Individual values may not sum to total due to independent rounding.
Figure 4U.S. Government Foreign Credit Exposure
at Year-end 2003-2007 by Type of Foreign Entity
0
10
20
30
40
50
60
70
80
90
2003 2004 2005 2006 2007
Billi
ons
of U
.S. D
olla
rs
Private Sovereign
Page 12
B. U.S. Government Foreign Credit Exposure
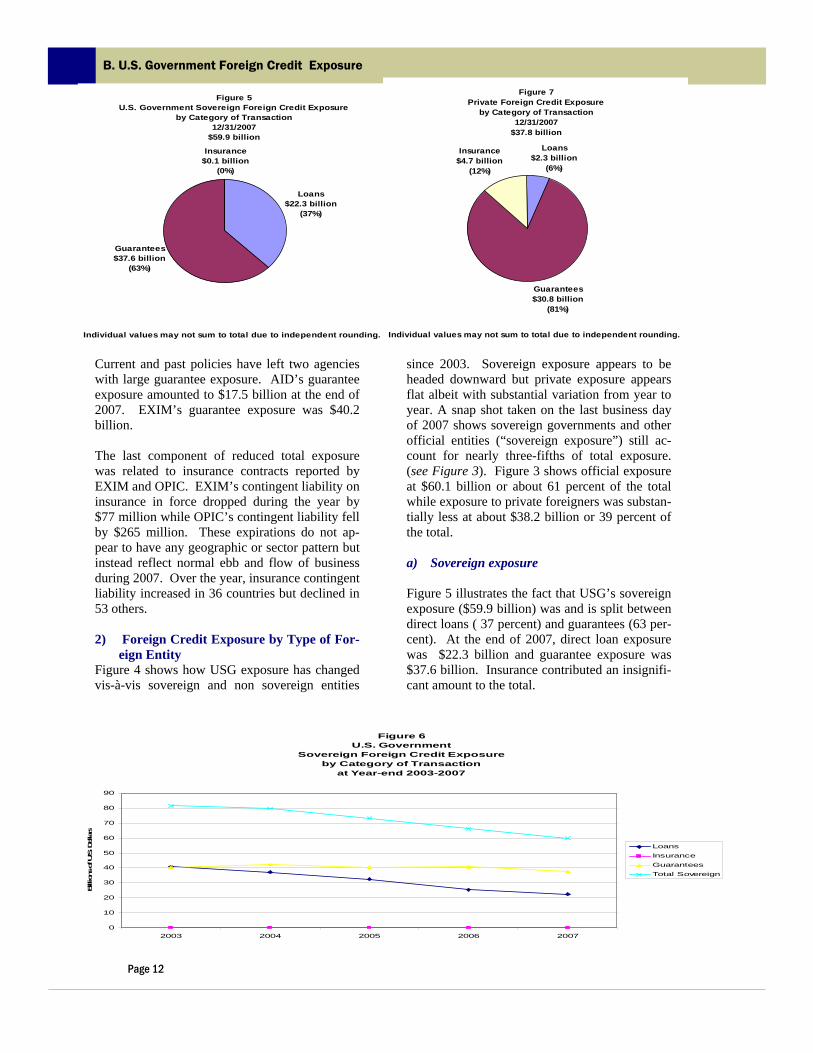
Current and past policies have left two agencies with large guarantee exposure. AID’s guarantee exposure amounted to $17.5 billion at the end of 2007. EXIM’s guarantee exposure was $40.2 billion. The last component of reduced total exposure was related to insurance contracts reported by EXIM and OPIC. EXIM’s contingent liability on insurance in force dropped during the year by $77 million while OPIC’s contingent liability fell by $265 million. These expirations do not ap-pear to have any geographic or sector pattern but instead reflect normal ebb and flow of business during 2007. Over the year, insurance contingent liability increased in 36 countries but declined in 53 others. 2) Foreign Credit Exposure by Type of For-
eign Entity Figure 4 shows how USG exposure has changed vis-à-vis sovereign and non sovereign entities
since 2003. Sovereign exposure appears to be headed downward but private exposure appears flat albeit with substantial variation from year to year. A snap shot taken on the last business day of 2007 shows sovereign governments and other official entities (“sovereign exposure”) still ac-count for nearly three-fifths of total exposure. (see Figure 3). Figure 3 shows official exposure at $60.1 billion or about 61 percent of the total while exposure to private foreigners was substan-tially less at about $38.2 billion or 39 percent of the total. a) Sovereign exposure Figure 5 illustrates the fact that USG’s sovereign exposure ($59.9 billion) was and is split between direct loans ( 37 percent) and guarantees (63 per-cent). At the end of 2007, direct loan exposure was $22.3 billion and guarantee exposure was $37.6 billion. Insurance contributed an insignifi-cant amount to the total.
Figure 5U.S. Government Sovereign Foreign Credit Exposure
by Category of Transaction12/31/2007
$59.9 billion
Loans$22.3 billion
(37%)
Guarantees$37.6 billion
(63%)
Insurance$0.1 billion
(0%)
Individual values may not sum to total due to independent rounding.
Figure 6U.S. Government
Sovereign Foreign Credit Exposureby Category of Transaction
at Year-end 2003-2007
0
10
20
30
40
50
60
70
80
90
2003 2004 2005 2006 2007
Billion
s of U
.S. D
ollars
LoansInsuranceGuaranteesTotal Sovereign
Figure 7Private Foreign Credit Exposure
by Category of Transaction12/31/2007
$37.8 billion
Loans$2.3 billion
(6%)
Guarantees$30.8 billion
(81%)
Insurance$4.7 billion
(12%)
Individual values may not sum to total due to independent rounding.

Page 13
B. U.S. Government Foreign Credit Exposure
Figure 6 shows that sovereign exposure has been falling in recent years. Focusing on the latest year, exposure dropped from about $66.0 billion in 2006 to $59.9 billion in 2007 with much of the change connected to the aging direct loan compo-nent. The age distribution of the debt stock sug-gests that debt stock is quite old. Only $4.9 bil-lion dates from post 2000 period while $7.9 bil-lion dates from the 1990s and $6.1 billion from the 1980s. Small disbursements and relatively large repay-ments were the main but not the only facts ex-plaining shrinking exposure in 2007. In addition to the imbalance between sovereign loan dis-bursements of $584 million and repayments of $3.3 billion, loan reductions cut principal out-standing by an additional $101 million. Advance repayments of $482 million are included in the repayment figure. As direct loans are paid down, guarantees have become a growing percentage of sovereign expo-sure. This has occurred despite the fact that level of activity appears flat and the outstanding amount of guarantees at the end of 2007 turns out to be $3.2 billion less than the $40.8 billion aver-age of year-ends 2003 to 2006 (see Figure 6). In contrast to direct lending programs, guarantee programs remain very active in USG agencies.
AID, EXIM, and USDA guaranteed more than $3.1 billion in new loans during 2007. However, exposure related to guarantees failed to grow be-cause repayments of underlying credits were even larger, reaching almost $3.8 billion. EXIM was by far the most aggressive guarantor with contracts for large amounts in India, Pakistan, UAE, and Mexico, AID also made several significant guar-antees. USDA was the smallest of the active guar-antors. b) Private Exposure The USG’s private exposure is mainly based on guarantees extended to non-sovereign foreign entities. At the end of 2007, 81 percent of the total consisted of credit guarantees. 12 percent had to do with insurance. About 6 percent was related to direct loans. (see Figure 7, p.12) The three agencies that extend private guarantees had significant private exposure at the end of 2007. EXIM had a $23.8 billion exposure; OPIC had a $10.8 billion exposure; and USDA had a $2.1 billion exposure. Private exposure has shown some volatility year to year but the five year summary ending in 2007 does not show any strong trend. (see Figure 8, p.13) The volatility results from the existence of some very large contracts. When a $2 billion
Figure 8U.S. Government
Private Foreign Credit Exposureby Category of Transaction
at Year-end 2003-2007
0
5
10
15
20
25
30
35
40
45
2003 2004 2005 2006 2007
Year-end
Billi
ons
of U
.S. D
olla
rs
LoansInsuranceGuaranteesTotal Private

Page 14
B. U.S. Government Foreign Credit Exposure
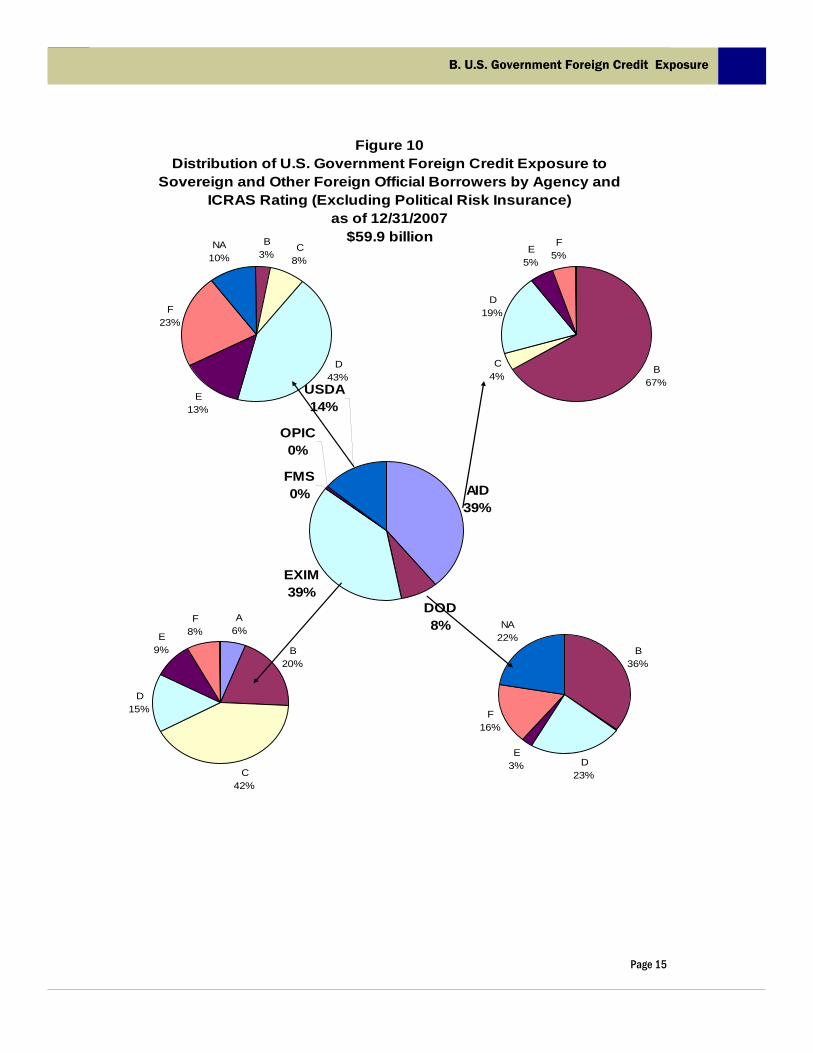
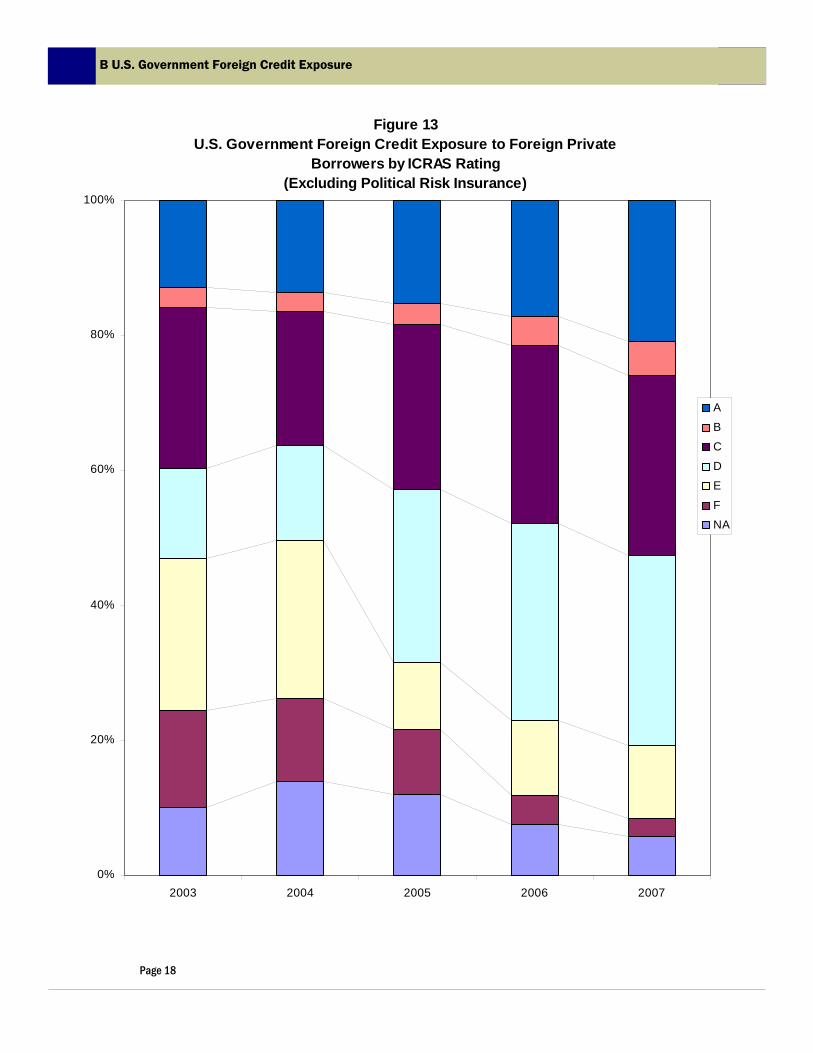
guarantee commitment expires as one did in 2006, or a large insurance coverage is cancelled in that same year, total private exposure drops. In other years, such as 2007, there are not big events and the result represents the sum of numerous small agreements. Agreements of this kind allowed pri-vate exposure to rise by $1.5 billion in 2007. 2007 saw an upward drift in guarantees that was offset by downward movement in insurance and loans. EXIM and OPIC increased the amount of guarantees in force by $3.1 billion and $425 mil-lion respectively partly offset by decline at AID (-$489 million), DOT (-$46 million), and USDA (-$674 million). Looking at data for 2002 and before suggest that there may be longer trends affecting guarantees and insurance. For example, one might discern a trend in guarantees if the $25 billion observation for 2002 is taken into account. Likewise a down-ward trend for insurance might be identified if the year-end insurance outstanding of $11.4 billion were taken into account. 3) Foreign Credit Exposure by Region USG credit remained broadly distributed by geo-graphic region at the end of 2007. The region with the largest share was the Middle East and North Africa ($29.9 billion or 31 percent). Figure 9 also shows substantial additional exposure in the West-ern Hemisphere and in East Asia and the Pacific. 4) Foreign Credit Exposure by Credit Rating The Interagency Country Risk Assessment System (ICRAS) was created to fulfill a requirement under the Federal Credit Reform Act of 1990 that man-dates all U.S. government agencies and programs providing cross-border loans, guarantees, or insur-ance to adopt a common standard for assessing country risk and estimating program costs. The ICRAS system is implemented by assigning one of six broad credit rating categories: A, B, C, D, E, or F to sovereign and non-sovereign borrow-ers in each country for which a credit decision is required. Each letter corresponds to a different credit rating. Letter A corresponds to the highest credit rating a country can achieve and letter F corresponds to the lowest credit rating. Countries, dependencies, and regional groupings which have not been rated are included in a N/A category.
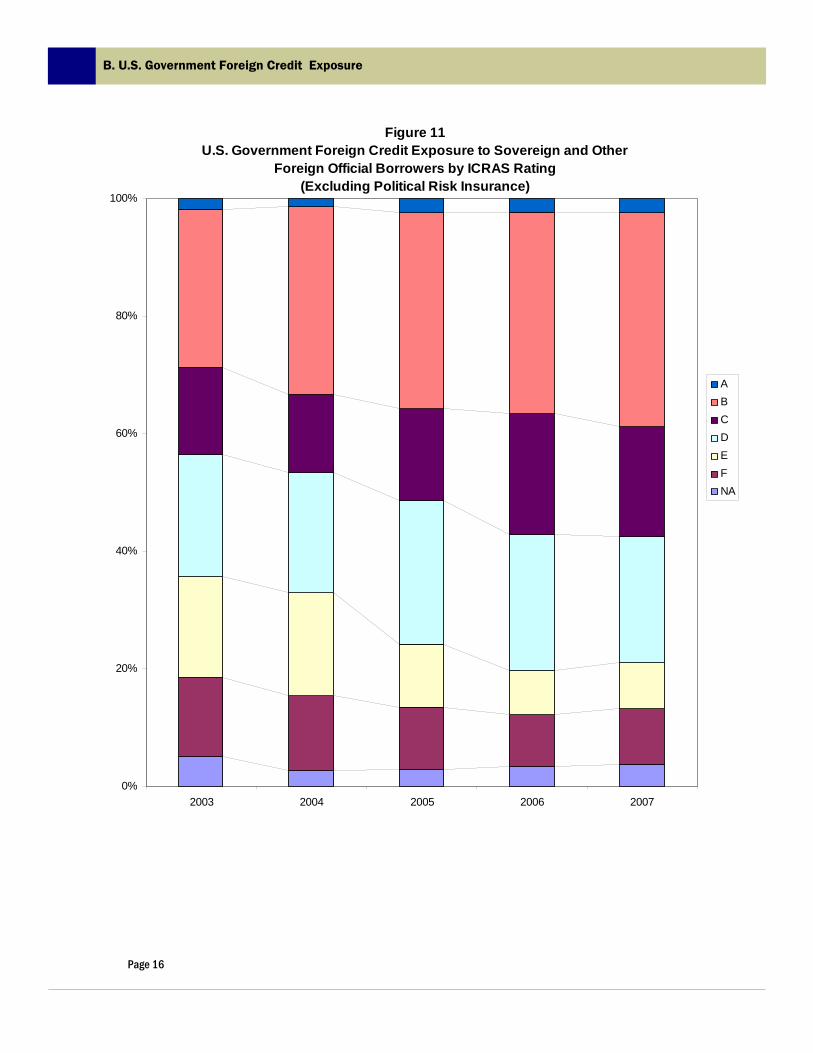
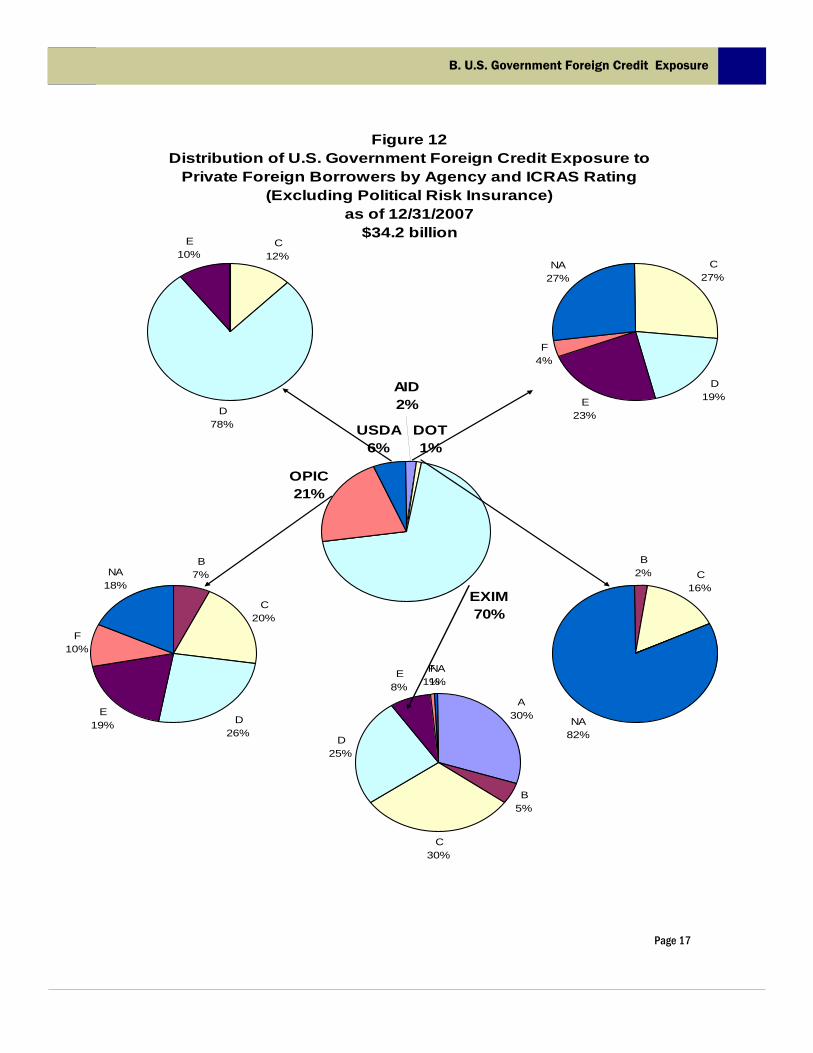
Figures 10 and 12 show the composition of the USG’s official and private risk exposure, classified first by lending agency and then risk category for the end of 2007. The center pie in each figure shows the distribution of exposure by agency. The surrounding pies show risk distribution for a given agency. Focusing on Figure 10, official foreign credit exposure is borne by AID, DOD, EXIM, FMS, and USDA. EXIM is the only agency to re-port exposure to A– rated sovereign borrowers. FMS is heavily exposed to un-rated sovereign bor-rowers. Figure 12 shows private foreign credit exposure is borne by AID, EXIM, OPIC, DOT, and USDA. 25 percent of EXIM’s exposure is rated A or B. Figures 11 and 13 show the change in composition of official and private foreign credit exposure, re-spectively, by ICRAS rating for year-end 2003 through 2007. The graphs illustrate the fact that the composition of exposure is subject to change over time. Sources of change include (1) new cus-tomers or programs, (2) changes in disbursement or repayment rates, (3) forgiveness of existing ob-ligations, and (4) changes in ICRAS ratings. Despite the government wide application of ICRAS, the system is not used to evaluate all pro-grams that contribute to USG exposure. ICRAS ratings are applied to all lending and guarantee programs but political risk insurance designed to protect against specific political events is excluded from coverage.
Figure 9U.S. Government Total Foreign Credit Exposure
by Region12/31/2007
$97.7 billion
Africa$8.9 billion
(9%)
East Asia and the Pacific
$17.3 billion (18%)
Europe$13.5 billion
(14%)
Intl Orgs or Not
Specified$0.7 billion
(1%)
Middle East and North
Africa$29.9 billion
(31%)
South Asia$7.8 billion
(8%)
Western Hemisphere$19.5 billion
(20%)
Individual values may not sum to total due to independent rounding.
Page 15
B. U.S. Gover nment Foreign Credit Exposur e
B. U.S. Government Foreign Credit Exposure
Figure 10Distribution of U.S. Government Foreign Credit Exposure to
Sovereign and Other Foreign Official Borrowers by Agency andICRAS Rating (Excluding Political Risk Insurance)
as of 12/31/2007$59.9 billion
USDA14%
OPIC0%
FMS0%
EXIM39%
DOD8%
AID39%
B67%
C4%
D19%
E5%
F5%
B36%
D23%
E3%
F16%
NA22%
A6%
B20%
C42%
D15%
E9%
F8%
B3%
C8%
D43%
E13%
F23%
NA10%
Page 16
B. U.S. Gover nment Foreign Credit Exposur e
B. U.S. Government Foreign Credit Exposure
Figure 11U.S. Government Foreign Credit Exposure to Sovereign and Other
Foreign Official Borrowers by ICRAS Rating(Excluding Political Risk Insurance)
0%
20%
40%
60%
80%
100%
2003 2004 2005 2006 2007
ABCDEFNA
Page 17
B. U.S. Gover nment Foreign Credit Exposur e
B. U.S. Government Foreign Credit Exposure
Figure 12Distribution of U.S. Government Foreign Credit Exposure to
Private Foreign Borrowers by Agency and ICRAS Rating(Excluding Political Risk Insurance)
as of 12/31/2007$34.2 billion
USDA6%
OPIC21%
EXIM70%
DOT1%
AID2%
C27%
D19%E
23%
F4%
NA27%
B2% C
16%
NA82%
A30%
B5%
C30%
D25%
E8%
F1%
NA1%
B7%
C20%
D26%
E19%
F10%
NA18%
C12%
D78%
E10%
Page 18
B. U.S. Gover nment Foreign Credit Exposur e
B U.S. Government Foreign Credit Exposure
Figure 13U.S. Government Foreign Credit Exposure to Foreign Private
Borrowers by ICRAS Rating(Excluding Political Risk Insurance)
0%
20%
40%
60%
80%
100%
2003 2004 2005 2006 2007
AB
C
DE
F
NA
Page 19
C. U.S. Government Sovereign Loans, Guarantees of Sovereign Debt, and Insurance
Since ICRAS ratings are not available for political risk insurance programs, the exposure related to these programs is not depicted in Figures 10 to 13. In order to create a complete measure of exposure, the maximum contingent liability related to politi-cal risk exposure must be added to our other meas-ures of credit exposure. This information is pro-vided in table A6 and A10. C. U.S. Government Sovereign Loans, Guar-
antees of Sovereign Debt, and Insurance 1) Sovereign Foreign Credit by Country, Re-
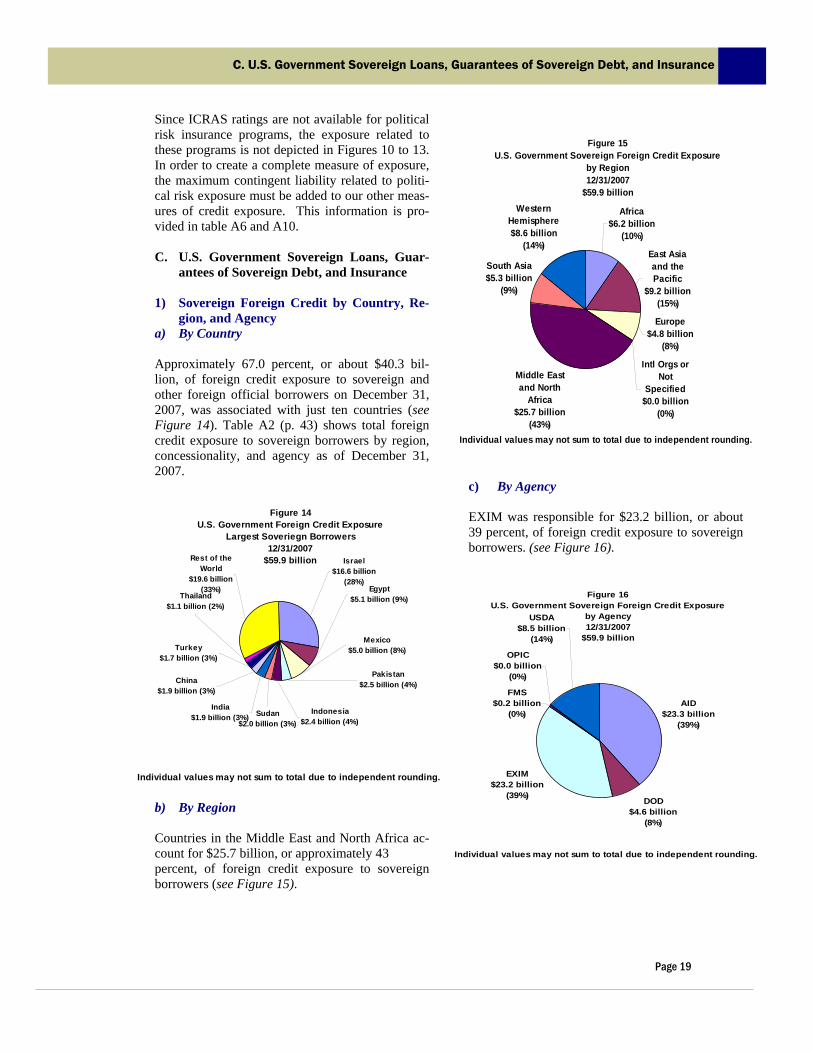
gion, and Agency a) By Country Approximately 67.0 percent, or about $40.3 bil-lion, of foreign credit exposure to sovereign and other foreign official borrowers on December 31, 2007, was associated with just ten countries (see Figure 14). Table A2 (p. 43) shows total foreign credit exposure to sovereign borrowers by region, concessionality, and agency as of December 31, 2007.
b) By Region Countries in the Middle East and North Africa ac-count for $25.7 billion, or approximately 43 percent, of foreign credit exposure to sovereign borrowers (see Figure 15).
c) By Agency EXIM was responsible for $23.2 billion, or about 39 percent, of foreign credit exposure to sovereign borrowers. (see Figure 16).
Figure 14U.S. Government Foreign Credit Exposure
Largest Soveriegn Borrowers12/31/2007
$59.9 billion Israel$16.6 billion
(28%)
Rest of the World
$19.6 billion (33%)
Sudan$2.0 billion (3%)
Indonesia$2.4 billion (4%)
Turkey$1.7 billion (3%)
Thailand$1.1 billion (2%)
Pakistan$2.5 billion (4%)
Mexico$5.0 billion (8%)
Egypt$5.1 billion (9%)
India$1.9 billion (3%)
China$1.9 billion (3%)
Individual values may not sum to total due to independent rounding.
Figure 15U.S. Government Sovereign Foreign Credit Exposure
by Region12/31/2007
$59.9 billion
Africa$6.2 billion
(10%)
East Asia and the Pacific
$9.2 billion (15%)
Europe$4.8 billion
(8%)
Intl Orgs or Not
Specified$0.0 billion
(0%)
Middle East and North
Africa$25.7 billion
(43%)
South Asia$5.3 billion
(9%)
Western Hemisphere$8.6 billion
(14%)
Individual values may not sum to total due to independent rounding.
Figure 16U.S. Government Sovereign Foreign Credit Exposure
by Agency12/31/2007
$59.9 billion
USDA$8.5 billion
(14%)
OPIC$0.0 billion
(0%)
FMS$0.2 billion
(0%)
EXIM$23.2 billion
(39%)DOD
$4.6 billion (8%)
AID$23.3 billion
(39%)
Individual values may not sum to total due to independent rounding.

Page 20
C. U.S. Government Sovereign Loans, Guarantees of Sovereign Debt, and Insurance
2) U.S. Government Direct Loans to Sover-eign Governments and Foreign Official Entities
The principal outstanding on direct loans to sover-eign obligors declined in 2007 from $22.6 billion at the end of 2006 to $19.5 billion at the end of 2007. The less indebted countries in the Rest of World category in Figure 17 accounted for $2.0
billion of the net repayment. The remaining $1.1 billion repayment came from the more heavily indebted countries identified individually. One consequence of this payment pattern was an increase in the geographical concentration of in-debtedness. The share owed by the top 10 coun-tries rose from 61 to 65 percent while the share owed by the rest of the world dropped to 35 per-cent. Sri Lanka replaced Peru on the list of the top 10 countries most heavily indebted to the United States. Only Sudan among the top 10 countries failed to reduce its indebtedness during 2007. Occasionally, a country that has borrowed from the USG will encounter financial conditions that interfere with its ability to repay debt. When a country fails to pay the amount due in full and on time, U.S. law requires that agencies record the unpaid amount as in arrears. The arrears remain until the debt is paid, rescheduled or reduced. On December 31, 2007, the amount of principal arrears related to sovereign loans was $1.7 billion
or 8.9 percent of sovereign loans outstanding. On the same date, $2.7 billion of interest and fees were also in arrears by at least one day. Total arrears were down about $30 million from the level reported in 2006.
Table 1 shows the ten sovereign borrowers with the largest arrears to the U.S. They had principal arrears of $1.5 billion, or 88 percent of principal arrears due from all sovereign obligors. Generally however, repayment of direct loans has occurred in full and on time. During 2003-2007, sovereign obligors repaid $21.3 billion of principal on USG direct loans (see Figure 18). In addition, $7.5 billion in interest and fees was paid. Although the principal outstanding associated with sovereign lending is moving down, some exposure of this kind will likely persist for many years. With that said, the amount that is expected to re-main on the books is not large by current stan-dards. Scheduled principal payments for 2008 are expected to be $1.8 billion (9 percent of loans to sovereign obligors outstanding on December 31, 2007). By 2012, we expect that $7.4 billion or about 37.9 percent of the $19.4 billion in direct sovereign loans will have been repaid. Over that same time period the USG is expected to collect $3.9 billion in interest.
Individual values may not sum to totals due to independent rounding. 1 Arrears are shown as reported to the Foreign Credit Reporting by the agencies. The Arrears amounts for some countries have been cleared in principle by the Paris Club actions, but the reorganization and posting process was not completed by December 31, 2007
Table 1 Largest Sovereign Loan Arrears
As of 12/31/2007
Country Principal In
Arrears
Interest and Fees in
Arrears Total in Arrears
Sudan 392.4 1343.2. 1735.6 Somalia 169.7 463.9 633.5
Cambodia 145.1 228.4 373.5
Liberia 178.7 186.5 365.2 Argentina 259.3 104.7 363.9 Syria 153.4 184.0 337.3 Congo, Dem. Rep. of 102.7 63.5 166.2 Cote d’Ivoire 76.2 63.0 139.2
Guinea 21.5 17.3 38.8
Cuba 36.3 0.0 36.3
Ten country Total 1535.1 2654.4 4189.5
Figure 17Sovereign Loans Principal Outstanding
12/31/2007$19.5 billion
Rest of the World
$6.8 billion (35%)
Egypt$3.8 billion
(20%)
Indonesia$2.1 billion
(11%)
Pakistan$1.5 billion
(8%)
Sudan$0.6 billion
(3%)Congo,
Democratic Republic of
the$1.0 billion
(5%)
Brazil$1.0 billion
(5%)Israel
$0.9 billion (4%)
China$0.8 billion
(4%)
India$0.5 billion
(3%)
Sri Lanka$0.5 billion
(2%)
Individual values may not sum to total due to independent rounding.

Page 21
C. U.S. Government Sovereign Loans, Guarantees of Sovereign Debt, and Insurance
Table A3 (p. 48) shows the year-end 2007 break-down of outstanding principal on USG direct loans to sovereign obligors by region, concession-ality, and agency. The table indicates that non-concessional loans were down to $6.8 billion or about 35 percent of total sovereign loans by the end of 2007. The falling percentage mainly re-flects a difference in the rate of repayment. Re-payment of Non-concessional loans was $1.8 billion compared to $1.3 billion for concessional. 3) U.S. Government Guarantees of Private
Loans to Sovereign Governments and For-eign Official Entities
Sovereign exposure under USG guarantee pro-
grams begins as soon as funds are committed. This means that exposure is based on undisbursed as well as disbursed amounts of guaranteed loans. Claims only enter the picture in cases of default; they take the place of disbursed amounts which the accounts show as paid down in order to avoid double counting. All three forms of exposure are included in the $40.2 billion total that appears in section 2a (p. 12). Undisbursed loans only account for a small amount (about $3.2 billion in 2007) of sovereign exposure because loans do not typically remain committed but undisbursed for an extended pe-riod. Disbursed loans are much more important
Table 2 Largest Sovereign Guarantee Claims
Outstanding As of 12/31/2007
Country Name Claims Outstanding
Zimbabwe 61.2
Indonesia 50.5
Yugoslavia (Former) 28.7
Cote d'Ivoire 26.4 India 6.4 Ghana 4.7 Cameroon 4.0 Bosnia and Herzegovina 3.5 Rwanda 0.7 Grenada 0.6
Ten Country Total 186.7
Figure 18Sovereign Loan Payments
During Calendar Years 2003-2007
0
1
2
3
4
5
6
7
8
2003 2004 2005 2006 2007
Calendar Year
Bill
ions
of U
.S. D
olla
rs
Principal Paid in Billions Interest and Fees Paid in Billions
Figure 19Sovereign Guarantees Principal Outstanding
12/31/2007$34.3 billion
India$1.2 billion (3%)
Thailand$1.1 billion (3%)
Singapore$0.9 billion (3%)
China$1.1 billion (3%)
Turkey$1.5 billion (4%)Egypt
$1.3 billion (4%)
Mexico$4.6 billion
(13%)
Israel$14.1 billion
(41%)
Rest of the World
$7.0 billion (20%)
Pakistan$0.8 billion (2%)
Saudi Arabia$0.8 billion (2%)
Individual values may not sum to total due to independent rounding.

Page 22
C. U.S. Government Sovereign Loans, Guarantees of Sovereign Debt, and Insurance
and contribute $35.2 billion to exposure. Figure 19 shows the ten countries with the largest amounts of principal outstanding on sovereign guarantees, and Table A4 (p. 52) shows sovereign guarantee princi-pal and claims outstanding amounts broken down by region, agency, and program. Claims, as mentioned above, arise under a guarantee when the USG (guarantor) pays a lender for a de-faulted payment, and in consequence obtains the right to claim payment from the borrower. In 2007, claims added $188 million to exposure. Table 2 shows that the ten countries (with the greatest amounts of guarantee claims outstanding) accounted for almost the entire amount (99 percent) of all claims outstanding. Once these claims arise, they tend to persist. They can only be eliminated by re-covery, reduction, or rescheduling. With the exception of the ten countries listed in table 2 (and a few others too small to show) sovereign borrowers are repaying guaranteed credits on time and in full. In 2007, principal payments on guaran-teed sovereign credits totaled $4.3 billion or 12.0 percent of outstanding amounts on December 31, 2006. Between 2008 and 2012, borrowers are ex-pected to repay $15.9 billion of principal, roughly equivalent to 45 percent of the loan amount out-standing at the end of 2007. Table A4 (p. 52) shows the distribution of guaran-teed sovereign loans by geographic region, agency, and program. More than 94 percent of sovereign loan guarantees were made by AID and EXIM. 4) Bilateral Debt Reduction FY 1990-2008 Since FY 1990, $24.9 billion of foreign sovereign indebtedness has been reduced through various leg-islative measures and U.S. bilateral negotiations under the authority of the U.S. Congress (see Table A5, p. 53). The debt reduction information in Table A5 is on a fiscal year basis, rather than the calendar year basis used in the remainder of the publication, and indi-cates the entire nominal commitment made during the indicated fiscal year to reduce the debt of the specified countries. Although the budgetary obliga-tion is committed when the Paris Club Agreed Min-ute is signed, in some cases actual agency imple-mentation may occur over a period of years accord-ing to provisions of the Paris Club agreement.
Perhaps it should be noted that the Paris Club is con-cerned exclusively with the kind of sovereign in-debtedness that arises from direct and guaranteed loans. Insurance claims are not treated in the Paris Club or other international fora. 5) U.S. Government Insurance against commer-
cial and political risk In the international area, two USG agencies: EXIM and OPIC sell insurance against political and com-mercial risk. The Export-Import Bank (EXIM) spe-cializes in insurance that has some connection to foreign trade and U.S. exports. OPIC provides in-surance needed by US investors who have overseas interests subject to political risk. In this context, political risks are those arising from events beyond investor’s control such as: political violence (war); government intervention or expropriation; cancella-tion of an export or import license; transfer risk; or inconvertibility risk (the inability to purchase U.S. dollars in a legal market). OPIC reported almost all of the USG’s contingent liability related to political risk in 2007. Some of the risk was related to private transactions with sover-eign entities ($45 million) but the bulk ($3.6 billion) was entirely private in nature. (see Table A10, p. 69). In contrast, EXIM reported just two small contingent liabilities. One involved an official entity in Mexico amounting to $0.1 million (see table 6, p.57) and the other covered a strictly private transaction in Israel amounting to $1.2 million. Commercial risk insurance covers the risk of non-payment by an official buyer or borrower arising from default, insolvency, and/or failure to take deliv-ery of goods that have been shipped according to the supply contract At the end of 2007 the USG’s con-tingent liability related to commercial risk was broadly spread across sovereign entities and totaled $91.2 million (see Table A6, p. 56). Only two coun-tries posed particularly large contingent liabilities. EXIM had a contingent liability of $20.4 million in Mexico and $12.7 million in Russia.

Page 23
D. U.S. Government Private Loans, Guarantees of Private Debt, and Insurance
D. U.S. Government Private Loans, Guaran-tees of Private Debt, and Insurance
1) Private Foreign Credit Exposure by Coun-
try, Region, and Agency a) By Country Table A7 (p. 59) shows total private foreign credit exposure by region, country, concessionality, and agency as of December 31, 2007. About 47% percent, or $17.9 billion, of private foreign credit exposure on December 31, 2007, was concen-trated in ten countries (see Figure 20).
b) By Region Private exposure was broadly distributed by re-gion. Approximately $10.9 billion, or about 29 percent, of the world total private foreign credit exposure reflected contracts with countries in the Western Hemisphere, and an additional $8.7 bil-lion, or about 23 percent, corresponded to private exposure to Europe (see Figure 21).
c) By Agency Sixty-three percent, or $23.8 billion, of USG for-eign credit exposure to private entities was held by EXIM (see Figure 22)
Figure 20U.S. Government Foreign Credit Exposure
To Private Entities by Country12/31/2007
$37.8 billion
Rest of the World
$19.9 billion (53%)
Turkey$2.1 billion
(5%)
Ireland$2.1 billion
(6%)
Canada$1.9 billion
(5%)Russia
$1.6 billion (4%)
Brazil$1.5 billion
(4%)
Indonesia$1.2 billion
(3%)
Chile$1.1 billion
(3%)
Mexico$1.9 billion
(5%)
India$2.1 billion
(6%)Korea,
Republic of$2.3 billion
(6%)
Individual values may not sum to total due to independent rounding.
Figure 21U.S. Government Foreign Credit Exposure
To Private Entities by Region12/31/2007
$37.8 billion
Africa$2.8 billion
(7%)
East Asia and the Pacific
$8.0 billion (21%)
Western Hemisphere$10.9 billion
(29%)
Europe$8.7 billion
(23%)Intl Orgs or
Not Specified
$0.7 billion (2%)
South Asia$2.5 billion
(7%)
Middle East and North
Africa$4.2 billion
(11%)Individual values may not sum to total due to independent rounding.
Figure 22U.S. Government Foreign Credit Exposure
To Private Entities by Agency12/31/2007
$37.8 billion
OPIC$10.8 billion
(29%)
AID$0.6 billion
(2%) DOT$0.4 billion
(1%)
USDA$2.1 billion
(6%)
EXIM$23.8 billion
(63%)
Individual values may not sum to total due to independent rounding.

Page 24
2) U.S. Government Direct Loans to Foreign Private Entities The total amount of principal outstanding on direct loans to private obligors slipped from $2.6 billion at the end of 2006 to $2.3 billion at the end of 2007. EXIM’s portfolio of loans to pri-vate entities dropped by a little more than $300 million. AID and USDA reduced their portfolios by $17.7 and $6.1 million respectively. Only OPIC made a substantial addition to its private loan portfolio — about $81 million. The agency with the largest private loan portfolio remained EXIM with $1.6 billion outstanding on December 31. OPIC was the next largest lender with a growing portfolio that amounted to $744 million at the end of 2007. USDA and AID, al-though active in the past, had reduced their hold-ings to $193 million and $81 million respectively by year end. All evidence suggests that USG loans to private foreign entities will continue to decline over the next five years. AID did not lend to the private sector in 2007 and USDA and EXIM reported new loans amounting to $63 million and $17 million respectively. All these amounts are in-sufficient to maintain the portfolio at a constant level given projected repayments. Only OPIC increased the amount of principal outstanding,
lending $88 million net of repayments. Three of the four USG entities that make loans to foreign private entities (the exception being OPIC) also report information on their expected repayment schedules. The reports indicate that loans to private entities are of relatively short duration. In total, about 85 percent of principal outstanding will be repaid by 2012. The reports also show that AID loans on average have a longer duration than EXIM or USDA loans. Only 62 percent of AID loans will be repaid within 6 years while 86 percent of EXIM and 80 percent of USDA loans will be paid down in the same period. Despite other changes in 2007, geographical concentration of loans outstanding was only slightly affected. At the end of the year, the share of principal outstanding accounted for by the debtor countries with the largest amount of private loans remained at 77 percent. (see Fig-ure 23) Two measures of the risk associated with private lending programs are the amounts of (1) princi-pal and (2) interest and fees in arrears. On De-cember 31, 2007, these amounts were $42.5 mil-lion and $31.9 million respectively. The amount of private principal in arrears was not large; it was equivalent to about 2 percent of private obli-
Individual values may not sum to totals due to independent rounding.
Table 3 Largest Private Arrears
As of 12/31/2007
Country Principal in Arrears
Interest and Fees in Arrears Total Arrears
Indonesia 16.6 4.9 21.5
Brazil 7.6 1.8 9.4
Papua New Guinea 9.0 0.0 9.0
Ghana 4.7 3.2 7.9
Afghanistan 2.7 1.1 3.8
Mozambique 0.9 2.3 3.2
India 2.1 0.7 2.9
Mexico 1.9 0.7 2.6
Somalia 0.8 0.9 1.8
Russia 0.9 0.5 1.4
Ten Country Total 47.2 16.3 63.4
D. U.S. Government Sovereign Loans, Guarantees of Private Debt, and Insurance
Figure 23Private Loans Principal Outstanding
12/31/2007$2.3 billion
Venezuela$80.9 million
(4%)
Colombia$62.9 million
(3%)
Russia$55.3 million
(2%)
Hong Kong$58.6 million
(3%)
Papua New Guinea
$71.5 million (3%)
Argentina$130.0
million (6%)
Morocco$102.9
million (5%)
South Africa$250.1
million (11%)
Brazil$341.0
million (15%)
Indonesia$613.6
million (27%)
Rest of the World$518.5
million (23%)
Individual values may not sum to total due to independent rounding.

Page 25
D. U.S. Government Private Loans, Guarantees of Private Debt, and Insurance
gors’ principal outstanding. However it was con-centrated geographically. Ten countries ac-counted for $47.2 million or 90 percent of all pri-vate principal arrears (see Table 3) In contrast to sovereign credit programs, principal reductions on behalf of private borrowers totaled just $1.3 mil-lion and had minimal impact on any measure of performance. Additional information about private lending ap-pears in the Appendix. Table A8 (p.62) shows outstanding principal on USG direct loans to pri-vate foreign entities by geographic region, con-cessionality, and program. 3) U.S. Government Guarantees of Private Loans to Foreign Private Entities. At the end of 2007, USG agencies had guarantees in place covering $25.0 billion of financial sector loans to private foreigners (see Table A9), up from $24.5 billion one year earlier. Five USG agencies have programs that result in these guar-antees but three agencies account for almost all of the outstanding amount. The Export Import Bank guarantees loans so that international buyers of large capital items produced in the U.S. can ob-tain competitive term financing. The USDA uses its guarantee program to help finance exports of agricultural commodities.
OPIC provides guarantees (as well as direct loans) to support medium and long-term U.S. investment in foreign countries. .
USG agencies extend guarantees with coverage periods related to the purpose of the loan and eco-nomic lifetime of the secured items. For exam-ple, 100 percent of credit guaranteed by USDA is scheduled to be repaid by the end of 2012. This is appropriate because financing of agricultural items tends to be short to medium term. By con-trast, just 70 percent of the credit guaranteed by EXIM is scheduled for repayment by that same date. This is appropriate because the secured items have a longer economic lifetime. The risk implicit in loan guarantee programs is managed by the lending agencies with prudent policies that assure a high probability of repay-ment and a fee structure that offsets unavoidable losses. 2007 was a good year from this point of view.
Individual values may not sum to totals due to independent rounding.
Table 4 Largest Private Guarantee Claims Outstanding
As of 12/31/2007
Country Claims Outstanding Indonesia 134.0 Mexico 103.3 Philippines 79.2 Argentina 71.1 Brazil 70.5 Turkey 50.0 Ghana 34.4 India 26.6 Dominican Republic 24.1 Russia 16.1
Ten Country Total 609.3
Figure 24Private Guarantees Principal Outstanding
12/31/2007$24.6 billion
Australia$0.9 billion
(4%)
Rest of the World
$9.9 billion (40%)
Russia$0.9 billion
(4%)Chile
$1.1 billion (4%)
Taiwan$1.1 billion
(4%)
Turkey$1.8 billion
(7%)
Canada$1.8 billion
(7%)
India$1.9 billion
(8%)
Ireland$2.0 billion
(8%)
Korea, Republic of$2.3 billion
(10%)
Mexico$0.8 billion
(3%)
Individual values may not sum to total due to independent rounding.

EXIM had the largest positive cash flow in 2007 amounting to just over $156.8 million but AID and USDA also collected enough in fees and re-coveries to more than offset new claims paid. When guaranteed loans go into default, claims are an initial measure of loss. They arise when a guar-anteed loan is not repaid promptly but leave the USG with a subrogated claim. Lenders typically seek reimbursement from the USG and the USG acquires a claim on the foreign obligor. As of December 31, 2007, the USG held $776 million in such claims (see Table A9, p. 67). Table 4 (p. 25) shows the ten countries with the largest amounts of claims arising from private guarantees.
Page 26
4) U.S. Government Insurance of Private Loans to and Investment in Foreign Private Entities
USG agencies insure over $4.7 billion of private transactions with and investments in foreign private entities. The majority of this insurance, in the amount of $3.6 billion or 76 percent of the total, covers political risks. About two-fifths of this amount covers risk associated with trans-actions and investments located in the Western Hemisphere. Table A10 (p. 70) shows the breakdown of private insurance by country and region, including claims outstanding amounts.
D. U.S. Government Sovereign Loans, Guarantees of Private Debt, and Insurance
Figure 25Private Guaranteed Loans
Principal and Interest Paid 2003-2007
3.8
4
4.2
4.4
4.6
4.8
5
5.2
2003 2004 2005 2006 2007
Calendar Year
Bill
ions
of U
.S. D
olla
rs
Principal Paid in Billions Interest Paid in Billions

E. Amounts due the U.S. Government 1) Amounts due from Sovereign and Other Official Foreign Entities While total exposure to foreign official entities was $59.9 billion at the end of 2007, the amount actually due from these obligors was substantially less. The total amount due the USG from sovereign and other foreign official obli-gors as of December 31, 2007 was $22.4 billion, down about $3.1 billion from the amount due at year-end 2006. Table 5 makes explicit that amounts guaranteed or insured by the USG remain a contingent liability of the U.S. with no current corresponding claim unless and until (1) the borrower defaults on a guaranteed or insured party; (2) the USG pays out to said party; and (3) the borrower does not fully repay the USG. The following table also breaks out country exposure into (1) loan principal outstanding, including principal arrears; (2) interest and fees in arrears; and (3) guarantee and insurance claims outstanding.
Regions, Countries, and Dependencies Total Due U.S
Government Principal Out-
standing Interest and Fees in
Arrears Claims Out-
standing World Total 22447.2 19,483.7 2768.1 195.4 Africa Angola 35.6 35.6 0.0 Botswana 0.0 0.0 0.0 0.0 Cameroon 4.0 0.0 4.0 Central African Republic 11.3 8.7 2.6 Congo, Democratic Republic of the 1,013.7 950.3 63.5 Congo, Republic of the 41.2 39.9 1.3 Cote d'Ivoire 397.0 307.6 63.0 26.4 Eritrea 28.5 28.0 0.5 Gabon 51.2 50.1 1.0 Ghana 7.5 1.8 5.7 Guinea 135.2 117.9 17.3 Kenya 64.6 64.6 0.0 Liberia 402.4 215.9 186.5 Nigeria 0.0 0.0 0.0 0.0 Rwanda 0.7 0.0 0.0 0.7 Sierra Leone 45.6 44.1 1.5 Somalia 713.2 249.4 463.9 0.0
Sudan 1,978.8 635.6 1,343.2 Swaziland 5.1 5.1 Togo 0.0 0.0 Zambia 0.0 0.0 Zimbabwe 134.6 57.5 15.8 61.3 Africa - Total 5,070.2 2,812.0 2,160.0 98.1
Individual values may not sum to totals due to independent rounding. 0.0 denotes figures too small to appear when rounded to the first decimal place. Source: U.S. Department of the Treasury Foreign Credit Reporting System
Table 5 Amounts Due the U.S. Government from Sovereign and Other Foreign Official
Obligors as of 12/31/2007 (In Millions of Dollars)
Page 27
E. Amounts Due the U.S. Government

Page 28
E. Amounts due the U.S. Government
Table 5 (continued) Amounts Due the U.S. Government from Sovereign and Other Foreign
Official Obligors as of 12/31/2007(In Millions of Dollars)
Individual values may not sum to totals due to independent rounding. 0.0 denotes figures too small to appear when rounded to the first decimal place. Source: U.S. Department of the Treasury Foreign Credit Reporting System
Regions, Countries, and Dependencies Total Due to
U.S.Government Principal Out-
standing
Interest and Fees
in Arrears Claims Out-
standing East Asia and the Pacific Cambodia 429.2 200.8 228.4 China 754.1 753.9 0.0 0.2 China (Unspecified) 191.2 116.1 75.1 Indonesia 2,137.0 2,082.3 0.0 54.7 Korea, Republic of 244.3 244.3 0.0 0.0 Malaysia 0.0 0.0 0.0 0.0 Nauru 0.0 0.0 Philippines 427.5 427.5
Thailand 51.5 51.5 Vietnam 97.2 97.2 East Asia and the Pacific - Total 4,332.1 3,973.6 303.6 54.9
Europe Armenia 34.5 34.5 Belarus 59.1 59.1 Bosnia and Herzegovina 28.9 25.4 0.0 3.5 Croatia 33.0 31.5 1.5 Georgia 39.8 39.8 0.0 Greece 456.1 456.1 Latvia 5.8 5.8 Macedonia, Former Yugoslav Rep. of 4.5 4.5 0.0 0.0 Malta 1.8 1.8 Moldova 56.8 55.3 1.5 Poland 8.8 8.8 Romania 19.6 19.3 0.3 Russia 75.8 75.8 Serbia and Montenegro 9.5 9.3 0.2 Slovenia 2.8 1.9 1.0 Spain 0.0 0.0 Tajikistan 15.3 15.3 Turkey 194.1 194.1 Turkmenistan 32.7 32.2 0.5 Ukraine 154.4 154.4 Uzbekistan 56.4 55.8 0.6 Yugoslavia (Former) 239.9 210.9 28.9 Europe - Total 1,529.6 1,491.7 5.4 32.5 Middle East and North Africa Algeria 105.3 105.3 Egypt 3829.2 3828.7 0.5 Iran 1.9 1.9 Israel 861.1 861.1 Jordan 478.7 478.5 0.2 Lebanon 0.0 0.0 Morocco 248.6 248.2 0.4 Oman 0.0 0.0 Syria 421.7 237.8 184.0 Tunisia 26.6 26.6 Yemen 99.0 98.8 0.2 Middle East and North Africa - Total 6,072.1 5,886.9 184.8 0.5

Page 29
E. Amounts Due the U.S. Gov ernment
Table 5 (continued) Amounts Due the U.S. Government from Sovereign and Other Foreign Official
Obligors as of 12/31/2007 (In Millions of Dollars)
Individual values may not sum to totals due to independent rounding. 0.0 denotes figures too small to appear when rounded to the first decimal place. Source: U.S. Department of the Treasury Foreign Credit Reporting System
Regions, Countries, and Dependencies Total Due to
U.S.Government Principal Out-
standing Interest and Fees in
Arrears Claims Out-
standing South Asia Afghanistan 119.7 117.2 2.5 Bangladesh 220.9 218.9 2.0 India 541.1 534.7 0.0 6.4 Maldives 1.6 1.6 Pakistan 1545.8 1545.8 Sri Lanka 485.7 485.7 South Asia —Total 2914.9 2904.1 4.5 6.4 Western Hemisphere
Antigua and Barbuda 5.1 4.8 0.2 Argentina 387.8 283.2 104.7 Belize 2.1 2.1 Bolivia 0.0 0,0 Brazil 995.8 995.8 Caribbean Development Bank 0.4 0.4 Chile 1.7 1.7 Colombia 2.4 2.4 Costa Rica 73.3 73.0 0.3 Cuba 36.3 36.3 Dominican Republic 279.6 275.2 4.4 0.0 Ecuador 77.9 77.9 El Salvador 146.5 146.5 Granada 2.6 1.5 1.1 Guatemala 75.2 75.2 Guyana 1.1 1.1 Haiti 13.7 13.7 Honduras 0.0 0.0 Jamaica 205.7 205.6 0.1 Mexico 52.9 51.5 1.4 Nicaragua 0.0 0.0 Panama 14.0 14.0 Paraguay 0.6 0.6 Peru 122.2 121.7 0.5 St. Kitts and Nevis 5.5 5.5 St. Vincent and the Grenadines 0.8 0.8
Suriname 8.4 8.4 Trinidad and Tobago 2.0 2.0 Venezuela 0.0 0.0 Western Hemisphere Regional 4.3 4.3 Western Hemisphere unspecified 10.3 10.3 Western Hemisphere—Total 2,528.3 2,415.5 109.8 3.0 World Total 22,447.2 19,483.7 2,768.1 195.4
E. Amounts due t he U.S. Gov ernment
E. Amounts due the U.S. Government

Page 30
E. Amounts Due the U.S. Gov ernment
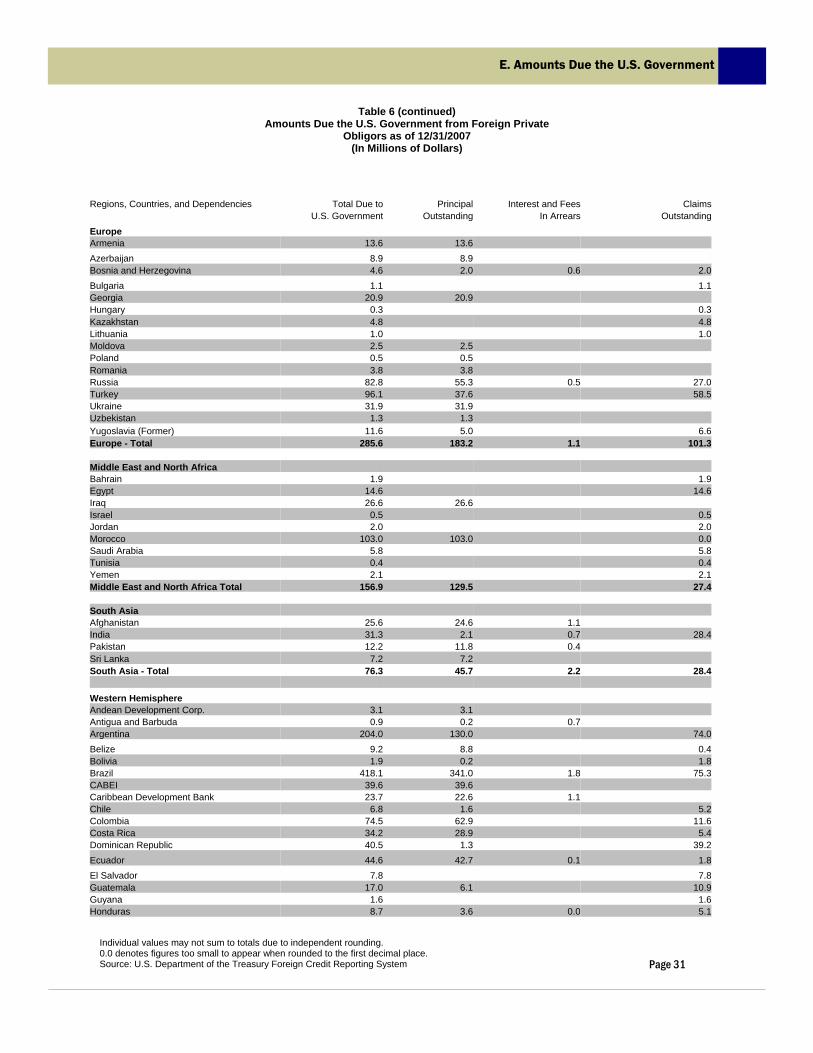
Table 6 Amounts Due the U.S. Government from Foreign Private
Obligors as of 12/31/2007 (In Millions of Dollars)
Individual values may not sum to totals due to independent rounding. 0.0 denotes figures too small to appear when rounded to the first decimal place. Source: U.S. Department of the Treasury Foreign Credit Reporting System
Regions, Countries, and Dependencies Total Due to
U.S Government Principal
Outstanding Interest and Fees
in Arrears Claims
Outstanding
World Total 3,494.3 2,285.3 24.6 1,184.4 Africa African Regional 9.2 6.9 2.3 Angola 0.3 0.3 Benin 0.2 0.2 Botswana 1.9 1.9 Burkina Faso 1.8 1.8 Cameroon 12.9 0.7 12.3 Congo, Democratic Republic of the 0.6 0.5 Cote d'Ivoire 4.0 4.0 Ethiopia 0.4 0.3 0.1 Gabon 1.8 1.8 0.0 Ghana 62.2 23.1 3.2 35.8 Guinea-Bissau 1.2 0.9 0.3 Kenya 4.6 3.9 0.3 0.5 Liberia 3.1 1.7 1.4 Malawi 7.4 6.5 0.9 Mali 11.7 0.8 0.2 10.7 Mauritius 0.9 0.9 Mozambique 17.7 15.4 2.3 Nigeria 12.8 4.0 8.8 Senegal 9.8 9.8 Somalia 1.8 0.8 0.9 South Africa 250.2 250.1 0.1 Uganda 5.0 5.0 Zambia 1.7 1.7 Africa—Total 423.3 322.2 10.9 90.3 East Asia and the Pacific Asia Regional 1.5 1.0 0.5
Hong Kong 58.6 58.6 Indonesia 754.0 613.6 4.9 135.5 Korea, Dem. Peoples Rep. of 0.8 0.8 Korea, Republic of 1.2 1.2 0.1 Malaysia 3.2 3.2 Mongolia 0.2 0.2 0.0 Papua New Guinea 71.5 71.5 Philippines 116.1 0.7 0.1 115.3 Singapore 5.9 5.9 Taiwan 0.6 0.6 Thailand 4.9 2.9 0.1 2.0 Vietnam 0.0 East Asia and the Pacific—Total 1018.7 749.8 5.6 263.3
E. Amounts due t he U.S. Gov ernment
E. Amounts due the U.S. Government
Page 31
E. Amounts Due the U.S. Government
Table 6 (continued) Amounts Due the U.S. Government from Foreign Private
Obligors as of 12/31/2007 (In Millions of Dollars)
Individual values may not sum to totals due to independent rounding. 0.0 denotes figures too small to appear when rounded to the first decimal place. Source: U.S. Department of the Treasury Foreign Credit Reporting System
Regions, Countries, and Dependencies Total Due to Principal Interest and Fees Claims U.S. Government Outstanding In Arrears Outstanding Europe Armenia 13.6 13.6 Azerbaijan 8.9 8.9 Bosnia and Herzegovina 4.6 2.0 0.6 2.0 Bulgaria 1.1 1.1 Georgia 20.9 20.9 Hungary 0.3 0.3 Kazakhstan 4.8 4.8 Lithuania 1.0 1.0 Moldova 2.5 2.5 Poland 0.5 0.5 Romania 3.8 3.8 Russia 82.8 55.3 0.5 27.0 Turkey 96.1 37.6 58.5 Ukraine 31.9 31.9 Uzbekistan 1.3 1.3 Yugoslavia (Former) 11.6 5.0 6.6 Europe - Total 285.6 183.2 1.1 101.3 Middle East and North Africa Bahrain 1.9 1.9 Egypt 14.6 14.6 Iraq 26.6 26.6 Israel 0.5 0.5 Jordan 2.0 2.0 Morocco 103.0 103.0 0.0 Saudi Arabia 5.8 5.8 Tunisia 0.4 0.4 Yemen 2.1 2.1 Middle East and North Africa Total 156.9 129.5 27.4 South Asia Afghanistan 25.6 24.6 1.1 India 31.3 2.1 0.7 28.4 Pakistan 12.2 11.8 0.4 Sri Lanka 7.2 7.2 South Asia - Total 76.3 45.7 2.2 28.4 Western Hemisphere Andean Development Corp. 3.1 3.1 Antigua and Barbuda 0.9 0.2 0.7 Argentina 204.0 130.0 74.0 Belize 9.2 8.8 0.4 Bolivia 1.9 0.2 1.8 Brazil 418.1 341.0 1.8 75.3 CABEI 39.6 39.6 Caribbean Development Bank 23.7 22.6 1.1 Chile 6.8 1.6 5.2 Colombia 74.5 62.9 11.6 Costa Rica 34.2 28.9 5.4 Dominican Republic 40.5 1.3 39.2 Ecuador 44.6 42.7 0.1 1.8 El Salvador 7.8 7.8 Guatemala 17.0 6.1 10.9 Guyana 1.6 1.6 Honduras 8.7 3.6 0.0 5.1

3) World War I Indebtedness of Sovereign Governments to the U.S. Government World War I indebtedness totaled $39.9 billion as of December 31, 2007. Many of the countries listed in Tables 7 and 8 have not made principal and interest payments on these debts since the 1930s. All the loans and credits represent legally valid and out-standing obligations of foreign governments, and the USG has not waived or renounced its rights with respect to any of them. All such loans and credits remain due and payable. However, as noted in the 1981 Annual Report of the National Advisory Council on International Monetary and Financial Policies:
“As a practical matter, however, repayment of the debts is inextricably linked to the problem of German repara-tions and intra-European debts generated during World War I. Many European countries are net creditors on World War I accounts, with Germany owing more to them than they, in turn, owe to other countries. Since the early 1930’s these countries have steadfastly maintained that they would resume payments on their war debts to the United States only when the issue of Germany’s World War I reparations has been satisfactorily resolved. While the United States has never recognized any legal connection between World War I debt obligations owed to this country and reparation claims on Germany, there is a linkage in reality.” 1
In addition, the 1953 London Agreement on German External Debts, Article 5, Claims excluded from the Agreement, states:
“(1) Consideration of governmental claims against Germany arising out of the First World War shall be deferred until a final general settlement of this matter.”
To date, a final general settlement of this matter has not been reached. Table 7 reports the debts owed by foreign governments and Table 8 shows the status of the indebtedness of the German Government. These data are on an accrual basis and, therefore, differ from the cash basis shown in the remainder of the report. The column “Accrued Interest Not Yet Due” records the interest accrued through the report date since the most recent payment due date.
Table 6 (continued) Amounts Due the U.S. Government from Foreign Private Obligors as of
12/31/2007
Individual values may not sum to totals due to independent rounding. 0.0 denotes figures too small to appear when rounded to the first decimal place Source: U.S. Department of the Treasury Foreign Credit Reporting System
E. Amounts Due the U.S. Government
—————————————————————-
1 The National Advisory Council on International Monetary and Financial Policies, Annual Report to the President and to the Congress for Fiscal Year 1981, U.S. Government Printing Office, Washington, D.C., August 12, 1982, p.68.
Page 32
Regions, Countries, and Dependencies Total Due to
U.S. Government Principal
Outstanding Interest and Fees
in Arrears Claims
Outstanding Jamaica 0.3 0.1 0.2 Mexico 378.8 22.1 0.7 356.0 Nicaragua 25.4 5.1 0.0 20.3 Panama 2.0 0.4 1.7 Peru 18.8 2.2 0.3 16.3 St. Kitts and Nevis 0.3 0.3 Suriname 14.5 14.5 Trinidad and Tobago 3.6 3.6 Uruguay 0.7 0.4 0.2 Venezuela 101.7 80.9 20.9 Western Hemisphere Regional 0.0 0.0 Western Hemisphere Unspecified 0.1 0.1
Western Hemisphere—Total 1482.4 803.9 4.8 673.7
Worldwide Unspecified 51.0 51.0 World Total 3,494.3 2,285.3 24.6 1,184.4

Page 33
E. Amounts Due the U.S. Government
Table 7 Indebtedness of Foreign Governments to the U.S. Arising from WWI
As of 12/31/2007 (In US Dollars)
1/ Includes capitalized interest. 5/ Interest payment from December 15, 1932, to Department of the Treasury
2/ The Federal Republic of Germany has recognized June 15, 1937, was paid in pengo equivalent. Financial Management Service
liability for securities falling due between 6/ The indebtedness of Nicaragua was canceled pursuant Financial Accounting and March 12, 1938, and May 8, 1945. to the agreement of April 14, 1938. Services Division 3/ $8,480,090 has been made available for 7/ After deduction of claim allowance of $1,813,429. Credit Accounting Branch educational exchange programs with Finland 8/ Excludes payment of $100,000 on June 14, 1940, as a (202)874-8740 pursuant to 22 U.S.C. 2455(e). token of good faith. 4/ $13,155,921 refunded by the agreement of 9/ Includes proceeds from liquidation of Russian assets May 28, 1964, which was ratified by Congress in the United States. November 5, 1966. 10/ Includes donation of James Bertram's estate of $2,131,134.49 in 2002.
Interest accrued Accrued
Through Cumulative payments Total Unmatured interest Principal
obligation 1/ 12/31/,2007 Principal Interest Principal Interest outstanding principal not yet due due & unpaid
- -
Armenia 11,959,917 52,800,546 32 0 0 0 64,760,431 0 301,455 64,458,977
Austria 2/ 26,843,149 22,353,288 862,668 0 0 0 48,333,768 0 366,867 47,966,902
Belgium 423,587,630 674,143,606 19,157,630 33,033,643 0 0 1,045,539,963 0 378,477 1,045,161,487
Cuba 10,000,000 2,286,752 10,000,000 2,286,752 0 0 0 0 0 0
Czechoslovakia 185,071,023 351,091,966 19,829,914 304,178 0 0 516,028,897 0 254,178 515,774,719
Estonia 16,958,373 46,241,916 11 1,248,432 0 0 61,951,846 0 26,150 61,925,696
Finland 9,000,000 12,661,578 9,000,000 /3 12,661,578 0 0 0 0 0 0
France 4,128,326,088 8,801,988,445 226,039,588 260,036,303 0 0 12,444,238,643 0 5,998,029 12,438,240,614
Great Britain 4,933,701,642 13,445,944,853 434,181,642 1,592,803,791 /10 0 0 16,352,661,062 0 6,938,301 16,345,722,760
Greece (I) 21,163,923 3,796,437 983,923 3,143,133 0 0 20,833,304 0 4,436 20,828,868
Greece (II) 4/ 13,155,921 9,388,159 4,118,461 9,366,431 145,243 183,654 9,059,188 9,037,458 21,729 1
Hungary 5/ 2,051,898 3,665,641 2,051,898 3,665,641 0 0 0 0 0 0
Italy 2,044,870,444 1,719,372,465 37,464,319 63,365,561 0 0 3,663,413,029 0 1,772,811 3,661,640,218
Latvia 7,094,654 19,432,884 9,200 752,349 0 0 25,765,989 0 10,926 25,755,064
Liberia 26,000 10,472 26,000 10,472 0 0 0 0 0 0
Lithuania 6,618,395 17,783,984 234,783 1,003,174 0 0 23,164,423 0 9,843 23,154,579
Nicaragua 6/ 141,950 26,625 141,950 26,625 0 0 0 0 0 0
Poland 213,506,132 /7 584,403,375 1,287,297 21,359,000 0 0 775,263,209 0 327,237 774,935,972
Rumania 68,359,192 153,910,290 4,498,632 /8 292,375 0 0 217,478,475 0 98,153 217,380,322
Russia 192,601,297 866,021,560 0 8,750,312 /9 0 0 1,049,872,546 0 3,435,151 1,046,437,395
Yugoslavia 63,577,713 113,252,549 1,952,713 636,059 0 0 174,241,490 0 94,548 174,146,942
TOTAL 12,378,615,343 26,900,577,391 771,840,662 2,014,745,809 145,243 183,654 36,492,606,262 9,037,458 20,038,290 36,463,530,514
Payments received
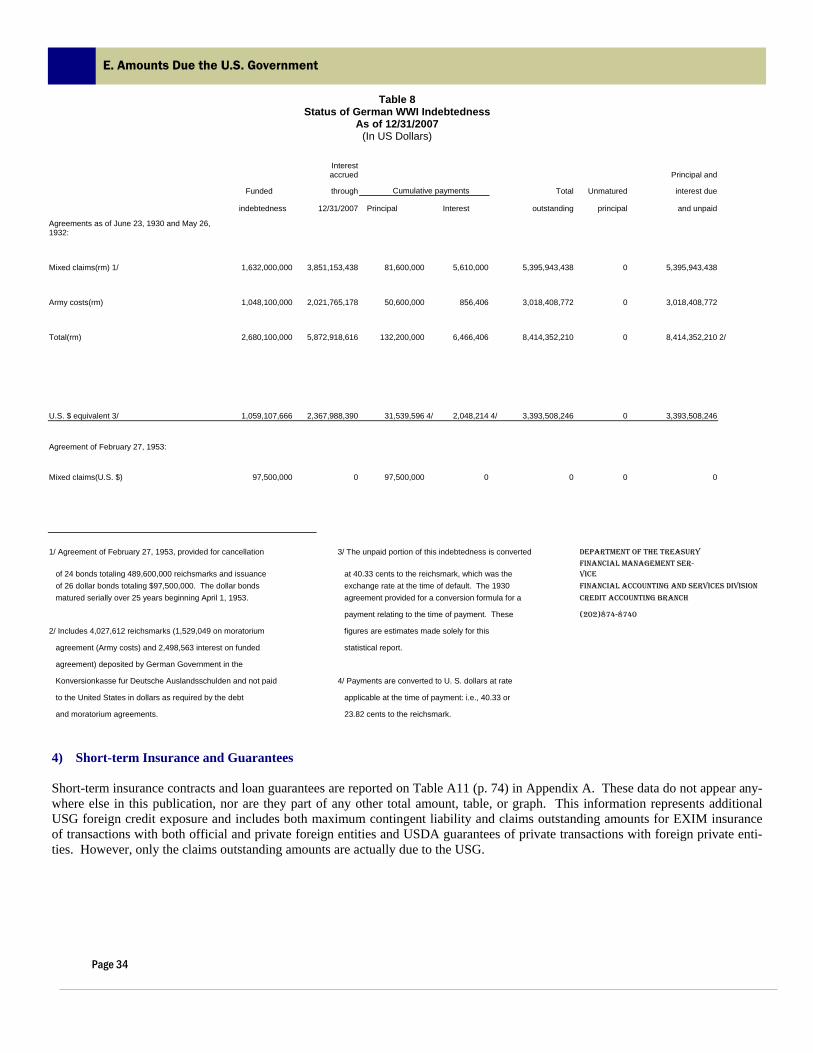
Page 34
E. Amounts Due the U.S. Government
4) Short-term Insurance and Guarantees Short-term insurance contracts and loan guarantees are reported on Table A11 (p. 74) in Appendix A. These data do not appear any-where else in this publication, nor are they part of any other total amount, table, or graph. This information represents additional USG foreign credit exposure and includes both maximum contingent liability and claims outstanding amounts for EXIM insurance of transactions with both official and private foreign entities and USDA guarantees of private transactions with foreign private enti-ties. However, only the claims outstanding amounts are actually due to the USG.
Table 8 Status of German WWI Indebtedness
As of 12/31/2007 (In US Dollars)
Interest accrued Principal and
Funded through Cumulative payments Total Unmatured interest due
indebtedness 12/31/2007 Principal Interest outstanding principal and unpaid
Agreements as of June 23, 1930 and May 26, 1932:
Mixed claims(rm) 1/ 1,632,000,000 3,851,153,438 81,600,000 5,610,000 5,395,943,438 0 5,395,943,438
Army costs(rm) 1,048,100,000 2,021,765,178 50,600,000 856,406 3,018,408,772 0 3,018,408,772
Total(rm) 2,680,100,000 5,872,918,616 132,200,000 6,466,406 8,414,352,210 0 8,414,352,210 2/
U.S. $ equivalent 3/ 1,059,107,666 2,367,988,390 31,539,596 4/ 2,048,214 4/ 3,393,508,246 0 3,393,508,246
Agreement of February 27, 1953:
Mixed claims(U.S. $) 97,500,000 0 97,500,000 0 0 0 0
1/ Agreement of February 27, 1953, provided for cancellation 3/ The unpaid portion of this indebtedness is converted DEPARTMENT OF THE TREASURY
of 24 bonds totaling 489,600,000 reichsmarks and issuance at 40.33 cents to the reichsmark, which was the FINANCIAL MANAGEMENT SER-VICE
of 26 dollar bonds totaling $97,500,000. The dollar bonds exchange rate at the time of default. The 1930 FINANCIAL ACCOUNTING AND SERVICES DIVISION
matured serially over 25 years beginning April 1, 1953. agreement provided for a conversion formula for a CREDIT ACCOUNTING BRANCH
payment relating to the time of payment. These (202)874-8740
2/ Includes 4,027,612 reichsmarks (1,529,049 on moratorium figures are estimates made solely for this agreement (Army costs) and 2,498,563 interest on funded statistical report. agreement) deposited by German Government in the Konversionkasse fur Deutsche Auslandsschulden and not paid 4/ Payments are converted to U. S. dollars at rate to the United States in dollars as required by the debt applicable at the time of payment: i.e., 40.33 or and moratorium agreements.
23.82 cents to the reichsmark.

Page 35
F. Description of Data
F. Description of Data The statistics presented focus on USG international exposure arising from USG agencies’ long-term direct lending programs, guarantees and insurance of private lending, investment, and other transactions with foreign govern-ments and private foreign entities payable either in dollars or in foreign currencies as of December 31, 2007. This report contains information on USG loans to foreign governments and private foreign entities by major pro-gram and country, including:
• Amounts of principal and interest (including fees) that was paid, rescheduled, and/or reduced (pursuant to legislative authority) during calendar years 2003 through 2007;
• Amounts of principal either undisbursed or disbursed and still outstanding as of December 31, 2007; • Arrears of principal and interest outstanding one day or more as of December 31, 2007; and • Scheduled principal and interest payments for calendar years 2008 through 2012.
This report also contains the following information on USG guarantees of private lending to, investment in, and other transactions with foreign governments and private foreign entities by major program and country:
• Amounts of fees and premiums received during calendar years 2003 through 2007; • Amounts of principal and interest repaid to private lenders on loans and transactions covered by guaran-
tees during calendar years 2003 through 2007; • Amounts of claims paid by the agencies under guarantees during calendar years 2003 through 2007; • Amounts recovered by the agencies from foreign sources during calendar years 2003 through 2007; • Amounts of claims rescheduled or reorganized during calendar years 2003 through 2007; • Amounts of principal undisbursed and/or outstanding on guaranteed credits as of December 31, 2007; • Amounts of claims outstanding one day or more on guarantees as of December 31, 2007; and • Scheduled principal and interest payments on guaranteed credits for calendar years 2007 through 2012
This report also contains the following information on USG insurance of private lending to, investment in, and other transactions with foreign governments and private foreign entities by major program and country:
• Amounts of claims paid and still outstanding one day or more by the agencies for insured risks during calendar years 2003 through 2007; and
• Amounts of insurance outstanding as of December 31, 2007.

Page 36
G. Glossary of Terms
G. Glossary of Terms Arrears/Overdue -- represents the failure of a borrower to pay an obligation by the payment due date. Generally applies to due and unpaid amounts of principal and interest, late interest charges, and late fees for direct loans and claim payments. Claim -- is an assertion of a right to payment. A lender may file a claim to assert its right to that portion of the unpaid balance due on a defaulted loan which is guaranteed or insured by the Government or to the remaining por-tion of a guarantee not already recovered by a lender. Claims Outstanding -- Claims paid to lenders in accordance with guarantee or insurance agreements which have not been recovered. Commercial Risk -- is the risk of nonpayment by a non-sovereign or private sector buyer or borrower arising from default, insolvency, and/or failure to take delivery of goods that have been shipped according to the supply con-tract. Credit -- any amount for which there exists a specific obligation for repayment. Includes loan and other transfer agreements which give rise to specific obligations to repay over a period of time, usually with interest. May in-clude grants, but only where reference is to "tied aid credits," as defined by the OECD Arrangement on Officially Supported Export Credits. Creditor/Lender -- is one who provides money or resources and to whom payment is owed, including the U.S. Government, Federal agencies, or private financial institutions, under a specific credit agreement. Debt -- refers to an amount of money or property that has been determined to be owed to the U.S. Government from any person, organization, or entity, other than another Federal agency. It includes amounts owed on direct and guaranteed loans, and all other amounts due the U.S. from fees, duties, leases, rents, royalties, services, sales of goods or services, overpayments, fines, penalties, damages, interest, taxes, forfeitures, and other sources. Debt Reorganization or Relief -- is any action by a creditor that officially alters established terms for repayment. Debt reorganization includes forgiveness, rescheduling, rephasing, and refinancing. Debt Service
Actual -- is the set of repayments actually made to satisfy a debt, including principal, interest, and late fees (income stream).
Scheduled -- is the set of repayments which is contractually required to be made through the life of the debt, including principal and interest.
Default -- is the failure to meet any obligation or term of a credit agreement, grant or contract. A payment that is overdue or in arrears is technically "in default," since, by virtue of non-payment, the borrower has failed to abide by the terms and conditions of the credit. In practical terms, when a guaranteed loan or credit is considered "in default" will vary by agency. Direct Loan -- is an obligation created when: the Government agrees to disburse funds to and contracts with the debtor for repayment, with or without interest; a Federal agency purchases non-Federal loans through secondary market operations; or an agency sells assets on credit terms. Disbursement -- occurs when a creditor places resources, such as goods or funds, at the disposal of a borrower

Page 37
G. Glossary of Terms
through a cash payment or creation of a line-of-credit and the borrower draws upon it. The term "utilized" may be used when credit extended is other than currency. "Expended" and "disbursed" can be used interchangeably Dollar Equivalent -- is the unit of valuation for transfers occurring or balances existing in currencies other than U.S. dollars. Foreign Credit Exposure – The maximum financial amount which the U.S. Government has at risk as a conse-quence of U.S. Government agencies’ long-term foreign loan and loan guarantee programs, insurance of U.S. pri-vate lending and investment abroad, and other financial commitments involving foreign governments, other for-eign official entities, and foreign private entities. Foreign credit exposure is measured as the sum of the amounts of principal outstanding and interest and fees in arrears one day or more on direct loans, claims outstanding one day or more arising from payments under guarantee and insurance contracts, contingent liability on guarantee con-tracts, and maximum contingent liability on insurance contracts. Guarantee of a Loan -- is a legally binding agreement to pay part or all the amount due on a debt instrument ex-tended by a lender in event of nonpayment by the borrower. Insurance -- is a legally binding agreement to insure exporters, investors, and lenders against specific risks during specified periods. Export-Import Bank insurance covers commercial and political risks of nonpayment of export obligations. Overseas Private Investment Corporation insurance covers transfer and political risks associated with foreign investments. Interest/Fees Outstanding -- interest in arrears, penalties, fines, and administrative charges associated with an original amount classified as "principal outstanding". It does not include normal interest coming due during the life of the loan. Loan -- is a legally binding document that obligates a specific value of funds available for disbursement. The amount of funds disbursed is to be repaid (with or without interest and late fees) in accordance with the terms of a promissory note and/or repayment schedule. Long-term -- refers to loans, guarantees, or insurance contracts with an original or extended maturity of more than one year. Official or Private Obligor -- obligors must be classified as to "official" or "private" according to the principles stated in the following section:
a) Official obligors (borrowers) or guarantors are:
• Central governments or their departments (ministries). • Political subdivisions such as states, provinces, departments, and municipalities. • Foreign central banks. • Autonomous institutions (such as corporations, development banks, railways, utilities, etc.) where:
i. the budget of the institution is subject to the approval of the government of the recipient country; ii. the government owns more than 50 percent of the voting stock or more than half of the members
of the board of directors are government representatives; iii. in the case of default the government or central bank would become liable for the debt of the
institution.

Page 38
G. Glossary of Terms
• Any official multinational organization. b) Private obligors (borrowers) or guarantors are defined as obligors other than official.
Official Development Assistance (ODA) -- flows to developing countries and multilateral institutions provided by official agencies, including state and local governments, or by their executive agencies, each transaction of which meets the following tests:
• it is administered with the promotion of the economic development and welfare of developing countries as
its main objective and • it is concessional in character and conveys a grant element of at least 25 percent.
Political Risk -- is the risk of nonpayment by a non-sovereign or private sector buyer or borrower arising from events beyond the control of the buyer, caused by government action, such as: political violence, i.e. war; govern-ment intervention; cancellation of an export or import license; transfer or inconvertibility risk, i.e. the inability to purchase U.S. dollars in a legal market. Principal Outstanding -- Amount disbursed and not repaid which includes principal amount in arrears. Repayment Agreement -- between borrower and lender, establishes the terms and conditions governing the recov-ery of a debt. Rephase -- is changing the terms of credit/repayment (extending maturing period), where the creditor and bor-rower develop a revised repayment schedule for interest and principal and where each credit retains its identity while the creditor remains unchanged. Reschedule -- FCRS term for extinguishing debt owed under all or part of existing credits and the creation of new and separate credit or credits that are normally equal in value to the debt being extinguished. Rescheduling normally is done in connection with facilitating repayment, although it is not required. Multiple rescheduling occurs whenever debt owed under all or part of more than one existing credit is extinguished under a single rescheduling action, whether or not a single new credit results. In the context of the Paris Club, reschedule refers to a form of debt reorganization in which scheduled debt service payments falling due in a specific interval are consolidated, resulting in a new credit with a new payment schedule. Reductions -- amounts forgiven under legislative authorization or international treaty. Includes total amounts for-given or written-off, not merely associated subsidy amounts.
Short-term -- refers to loans, guarantees, or insurance contracts with an original maturity of one year or less.
Sovereign -- Sovereign transactions are obligations entered into by the state. They may carry the "full faith and credit" of the central government. These often include transactions guaranteed by the Central Bank, Treasury, or Ministry of Finance. On a country by country basis, other institutions may also be designated, by law or by cus-tom, as sovereign institutions, acting as on behalf of the state.
Write-off -- occurs when an authorized official determines that a debt will not be repaid. Statutory authority may be required to write off debts owed by foreign governments. (See Forgive and Reductions.)
Page 39
H. Legislative Authority
H. Legislative Authority The indebtedness reported, except that arising out of World War I, originated under the authority of the following legislation, as amended, and international agreements:
• Foreign Assistance Act of 1961 (Public Law 87-195, as amended) and legislation for predecessor pro-
grams (an excellent synopsis of the legislative history of the predecessor programs is contained in Status of Loan Agreements, U.S. Agency for International Development, report number W-224, various dates.)
• Arms Export Control Act (Public Law 90-629). All military sales, beginning with fiscal year 1969, have
been extended under the Arms Export Control Act (formerly, the Foreign Military Sales Act). Previous foreign military sales were extended under the Foreign Assistance Act of 1961.
• Mutual Education and Cultural Exchange Act of 1961 (Public Law 87-256). • Agricultural Trade Development and Assistance Act of 1954 (Public Law 83-480). • Commodity Credit Corporation Charter Act (Public Law 80-806). • Export-Import Bank Act of 1945 (Public Law 79-173). • Title XI of the Merchant Marine Act of 1936, 46 App. U.S.C. sections 1271-1279. • An Act to promote Defense of the United States (“Lend-lease Act of 1941”) (Public Law 77-11) and re-
lated legislation. • Surplus Property Act of 1944 (Public Law 78-457) and related legislation. • The National Defense Authorization Act of Fiscal Year 1996 and the Defense Appropriations Act of
1996. • Special legislation enacted for particular transactions, such as the Anglo-American Loan of 1945 and
loans to the United Nations. • Legislation granting general and specific operational authority to government agencies and corporations.
Debt reductions reported in this document were authorized by the following legislation:
• Section 572 of the Foreign Operations, Export Financing and Related Programs Appropriations Act for Fiscal Year 1989 (Public Law 100-461).
• Section 411 of the Agricultural Trade Development and Assistance Act of 1954 (Public Law 83-480; 7
U.S.C. sec. 1736e). • Enterprise for the Americas Act of 1992 (EAI) (Public Law 102-549, adding Part IV, sections 701 et seq.,
to the Foreign Assistance Act of 1961, Enterprise for the Americas Act of 1992 (EAI) (Public Law 102-549, adding Part IV, sections 701 et seq., to the Foreign Assistance Act of 1961, and Public Law 102-429, adding section 12 to the Export-Import Bank Act of 1945, 22 U.S.C. 2430 and 12 U.S.C. 635i-6

Page 40
H. Legislative Authority
• Tropical Forest Conservation Act of 1998 (TFCA) (Public Law 105-214, adding Part V, sections 801 et seq., to the Foreign Assistance Act of 1961).
• Special Debt Relief for the Poorest (contained in annual Foreign Operations, Export Financing and Re-
lated Programs Appropriations Acts since 1994). • International Debt Relief (HIPC) (Title V of H.R. 3425 as enacted into law by section 1000(a)(5) of Pub-
lic Law 106-113). • Support for East European Democracy (SEED) Act of 1989 (Public Law 101-179, 22 U.S.C. 5401 et seq.)

Page 41
I. Appendix A
I. APPENDIX A

0.0 denotes values too small to appear when rounded to first decimal place. Source: U.S. Department of Treasury
Individual values may not sum to totals due to independent rounding. Foreign Credit Reporting System 1 Amounts are included in other tables and figures. 2 Central American Bank for Economic Integration.
42
Table A1
U.S. Government Foreign Credit Exposure to Regional Programs, Including International Organizations As of 12/31/2007
(in Millions of U.S. Dollars)
Concessional Non-concessional
AID
AID EXIM FMS OPIC
Total Concessional
& Non-concessional
Sub-total Concessional
Official Obligor
Private Obligor
Sub-Total Non-
concessional Official Obligor
Private Obligor
Official Obligor
Private Obligor
Official Obligor
Private Obligor
Total Regional and Organizational 1,698.7 74.6 8.2 66.4 1,624.2 40.8 102.2 155.6 6.8 1,318.7 Africa African Regional 410.4 410.4 1.0 70.1 339.2 Africa – Total 410.4 410.4 1.0 70.1 339.2 East Asia and the Pacific Asia Regional 146.7 146.7 146.7 East Asia and the Pacific - Total 146.7 146.7 146.7 Europe Central Europe Regional 90.0 90.0 90.0 Newly Independent States-FSU Reg. 121.3 121.3 121.3 Europe - Total 211.3 211.3 211.3 Intl Orgs or Not Specified Worldwide Unspecified 723.8 723.8 0.0 96.8 85.5 541.5 Intl Orgs or Not Specified - Total 723.8 723.8 0.0 96.8 85.5 541.5 Western Hemisphere Andean Development Corp. 3.1 3.1 3.1 CABEI 80.4 39.6 39.6 40.8 40.8 Caribbean Development Bank 24.1 24.1 0.4 23.7 Western Hemisphere Regional 88.8 4.3 4.3 84.5 4.5 80.0 Western Hemisphere Unspecified 10.3 3.5 3.5 6.8 6.8 Western Hemisphere - Total 206.6 74.6 8.2 66.4 132.1 40.8 4.5 6.8 80.0 Total Regional and Organizational 1,698.7 74.6 8.2 66.4 1,624.2 40.8 102.2 155.6 6.8 1,318.7

0.0 denotes values too small to appear when rounded to first decimal place. Source: U.S. Department of Treasury
Individual values may not sum to totals due to independent rounding. Foreign Credit Reporting System 1 Amounts are included in other tables and figures. 2 Central American Bank for Economic Integration.
43
Table A2
U.S. Government Foreign Credit Exposure on Loans, Guarantees, and Insurance Contracts to Sovereign and Other Official Obligors as of 12/31/2007 by Region and Country
(In Millions of U.S. Dollars or Dollar Equivalents)
Concessional
Non-concessional
Regions, Countries, and Dependencies
Total Sovereign Exposure
Sub-total Concessional
AID USDA Sub-Total Non-concessional
AID DOD EXIM FMS USDA
World Total 59,890.7 13,603.5 5,903.4 7,700.0 46,287.3 17,406.7 4,641.5 23,184.4 212.5 840.8 Africa Angola 351.1 35.6 35.6 315.4 315.4 Botswana 2.8 2.8 2.8 Cameroon 5.6 5.6 0.0 5.6 Central African Republic 11.3 11.3 11.3 Congo, Democratic Republic of the 1,013.7 561.1 161.1 399.9 452.7 24.1 209.2 206.7 12.6 Congo, Republic of the 41.2 24.2 24.2 17.0 17.0 Cote d’Ivoire 403.8 115.8 0.6 115.2 288.0 120.4 167.6 Eritrea 28.5 28.5 28.5 Ethiopia 256.8 256.8 256.8 Gabon 51.2 51.2 3.9 47.2 Ghana 176.9 176.9 176.9 Guinea 135.2 126.6 17.1 109.5 8.6 8.6 Kenya 86.8 34.6 34.6 52.2 31.2 0.1 20.9 Liberia 402.4 286.2 130.8 155.4 116.1 93.7 9.7 12.7 Mauritius 1.6 1.6 1.6 Nigeria 11.1 11.1 11.1 Rwanda 0.7 0.7 0.7 Senegal 34.8 34.8 34.8 Sierra Leone 45.6 45.6 45.6 Somalia 713.2 260.1 16.0 244.1 453.1 453.1 South Africa 235.2 235.2 93.3 141.9 Sudan 1,978.8 647.1 17.2 629.9 1,331.7 1,038.8 46.4 246.5 Swaziland 5.1 5.1 5.1 Togo 0.0 0.0 0.0 Zimbabwe 190.1 73.3 3.8 69.5 116.8 116.7 0.1 Africa - Total 6,183.5 2,243.8 386.5 1,857.4 3,939.6 390.1 1,799.0 1,478.8 12.7 259.1 East Asia and the Pacific Cambodia 429.2 429.2 429.2 China 1,890.7 1,890.7 1,890.7

0.0 denotes values too small to appear when rounded to first decimal place. Source: U.S. Department of Treasury
Individual values may not sum to totals due to independent rounding. Foreign Credit Reporting System
44
Table A2 U.S. Government Foreign Credit Exposure on Loans, Guarantees, and Insurance Contracts
to Sovereign and Other Official Obligors as of 12/31/2007 by Region and Country (In Millions of U.S. Dollars or Dollar Equivalents)
Concessional
Non-concessional
Regions, Countries, and Dependencies
Total Sovereign Exposure
Sub-total Concessional
AID USDA Sub-Total Non-concessional
AID DOD EXIM FMS USDA
China (Unspecified) 191.2 191.2 191.2 Indonesia 2,371.4 1,127.8 559.4 568.4 1,243.6 219.5 13.6 1,010.5 Korea, Republic of 570.4 244.3 45.7 198.6 326.2 0.0 266.2 60.0 Malaysia 584.7 584.7 584.7 New Zealand 219.8 219.8 219.8 Philippines 534.8 427.5 122.3 305.2 107.3 41.1 7.0 0.0 59.2 Singapore 915.6 915.6 915.6 Thailand 1,132.3 51.5 48.9 2.6 1,080.7 3.0 1,077.7 Vietnam 398.3 97.2 75.3 22.0 301.1 301.1 East Asia and the Pacific - Total 9,238.5 2,377.6 851.5 1,526.1 6,860.9 263.6 13.6 6,273.3 191.2 119.2 Europe Armenia 34.5 34.5 34.5 Azerbaijan 55.6 55.6 55.6 Belarus 59.1 59.1 59.1 Bosnia and Herzegovina 28.9 1.6 1.6 27.3 27.3 Bulgaria 45.8 45.8 45.8 Croatia 215.0 11.2 5.0 6.3 203.7 203.7 Czech Republic 121.4 121.4 22.8 98.6 Georgia 39.8 39.8 39.8 Germany 1.1 1.1 1.1 Greece 480.8 480.8 480.8 Italy 299.0 299.0 299.0 Kazakhstan 178.0 178.0 178.0 Latvia 5.8 5.8 5.8 Macedonia, Former Yugoslav Rep. of 4.5 4.5 4.5 0.0 0.0 Malta 1.8 1.8 1.8 Moldova 56.8 56.8 56.8 Poland 10.6 8.8 8.8 1.8 1.8 Portugal 11.9 11.9 11.9 Romania 449.8 19.6 19.6 430.2 430.2 Russia 200.0 75.8 75.8 124.2 124.2 Serbia and Montenegro 9.5 5.8 5.8 3.7 3.7 Slovenia 2.8 2.8 2.8 Tajikistan 15.3 15.3 15.3 Turkey 1,689.8 41.6 35.0 6.5 1,648.3 723.8 906.1 18.3 Turkmenistan 32.7 32.7 32.7
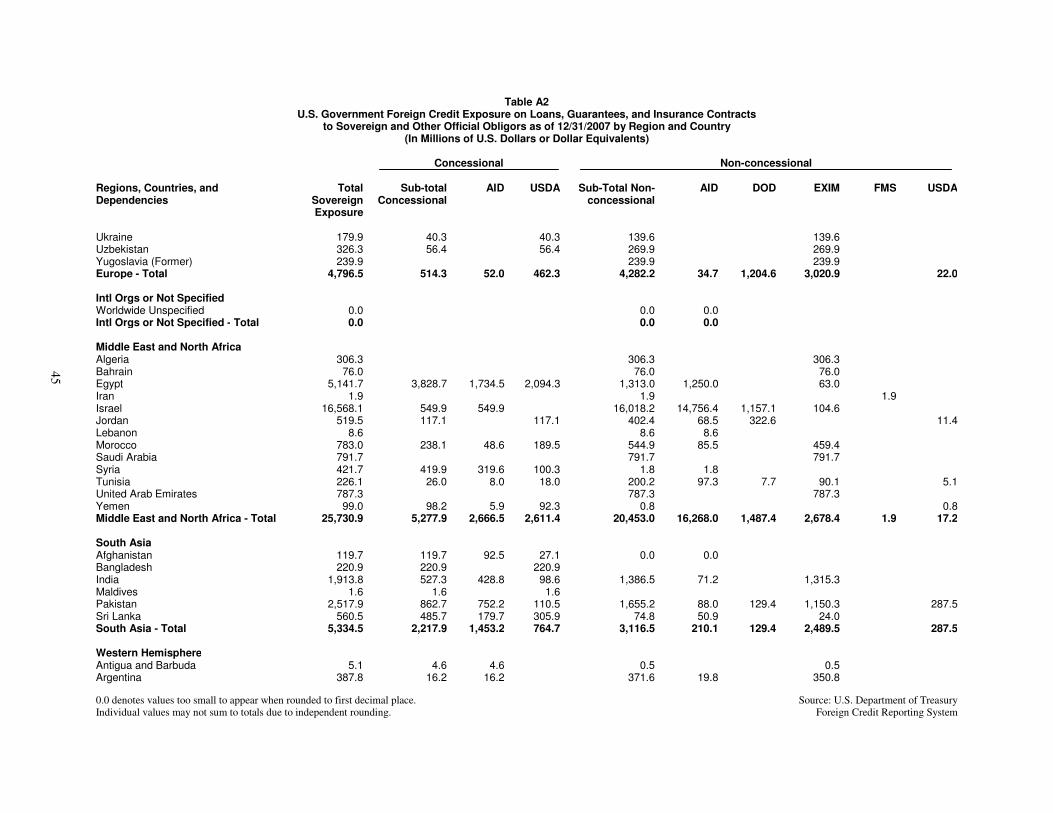
0.0 denotes values too small to appear when rounded to first decimal place. Source: U.S. Department of Treasury
Individual values may not sum to totals due to independent rounding. Foreign Credit Reporting System
45
Table A2 U.S. Government Foreign Credit Exposure on Loans, Guarantees, and Insurance Contracts
to Sovereign and Other Official Obligors as of 12/31/2007 by Region and Country (In Millions of U.S. Dollars or Dollar Equivalents)
Concessional
Non-concessional
Regions, Countries, and Dependencies
Total Sovereign Exposure
Sub-total Concessional
AID USDA Sub-Total Non-concessional
AID DOD EXIM FMS USDA
Ukraine 179.9 40.3 40.3 139.6 139.6 Uzbekistan 326.3 56.4 56.4 269.9 269.9 Yugoslavia (Former) 239.9 239.9 239.9 Europe - Total 4,796.5 514.3 52.0 462.3 4,282.2 34.7 1,204.6 3,020.9 22.0 Intl Orgs or Not Specified Worldwide Unspecified 0.0 0.0 0.0 Intl Orgs or Not Specified - Total 0.0 0.0 0.0 Middle East and North Africa Algeria 306.3 306.3 306.3 Bahrain 76.0 76.0 76.0 Egypt 5,141.7 3,828.7 1,734.5 2,094.3 1,313.0 1,250.0 63.0 Iran 1.9 1.9 1.9 Israel 16,568.1 549.9 549.9 16,018.2 14,756.4 1,157.1 104.6 Jordan 519.5 117.1 117.1 402.4 68.5 322.6 11.4 Lebanon 8.6 8.6 8.6 Morocco 783.0 238.1 48.6 189.5 544.9 85.5 459.4 Saudi Arabia 791.7 791.7 791.7 Syria 421.7 419.9 319.6 100.3 1.8 1.8 Tunisia 226.1 26.0 8.0 18.0 200.2 97.3 7.7 90.1 5.1 United Arab Emirates 787.3 787.3 787.3 Yemen 99.0 98.2 5.9 92.3 0.8 0.8 Middle East and North Africa - Total 25,730.9 5,277.9 2,666.5 2,611.4 20,453.0 16,268.0 1,487.4 2,678.4 1.9 17.2 South Asia Afghanistan 119.7 119.7 92.5 27.1 0.0 0.0 Bangladesh 220.9 220.9 220.9 India 1,913.8 527.3 428.8 98.6 1,386.5 71.2 1,315.3 Maldives 1.6 1.6 1.6 Pakistan 2,517.9 862.7 752.2 110.5 1,655.2 88.0 129.4 1,150.3 287.5 Sri Lanka 560.5 485.7 179.7 305.9 74.8 50.9 24.0 South Asia - Total 5,334.5 2,217.9 1,453.2 764.7 3,116.5 210.1 129.4 2,489.5 287.5 Western Hemisphere Antigua and Barbuda 5.1 4.6 4.6 0.5 0.5 Argentina 387.8 16.2 16.2 371.6 19.8 350.8

0.0 denotes values too small to appear when rounded to first decimal place. Source: U.S. Department of Treasury
Individual values may not sum to totals due to independent rounding. Foreign Credit Reporting System
46
Table A2 U.S. Government Foreign Credit Exposure on Loans, Guarantees, and Insurance Contracts
to Sovereign and Other Official Obligors as of 12/31/2007 by Region and Country (In Millions of U.S. Dollars or Dollar Equivalents)
Concessional
Non-concessional
Regions, Countries, and Dependencies
Total Sovereign Exposure
Sub-total Concessional
AID USDA Sub-Total Non-concessional
AID DOD EXIM FMS USDA
Barbados 2.8 2.8 2.4 0.4 Belize 6.9 2.1 2.1 4.7 0.6 4.1 Bolivia 6.6 6.6 6.6 Brazil 1,075.1 59.2 59.2 1,015.9 1,015.9 CABEI 40.8 40.8 40.8 Caribbean Development Bank 0.4 0.4 0.4 Chile 2.0 1.7 1.7 0.4 0.4 Colombia 141.3 2.4 2.4 138.9 72.5 66.5 Costa Rica 90.0 73.3 62.9 10.5 16.7 16.4 0.3 Cuba 36.3 36.3 36.3 Dominican Republic 656.8 173.4 117.3 56.0 483.4 2.2 2.6 415.9 62.7 Ecuador 93.1 53.9 43.9 10.0 39.2 22.2 4.5 12.5 El Salvador 146.5 146.5 146.5 0.0 0.0 Grenada 2.6 2.6 2.6 Guatemala 76.7 74.9 34.4 40.5 1.7 1.4 Guyana 1.1 1.1 1.1 Haiti 13.7 10.0 10.0 3.8 0.2 3.6 Honduras 42.5 42.5 42.0 0.4 Jamaica 284.1 196.3 94.4 101.9 87.9 41.8 0.2 42.7 3.1 Mexico 5,046.0 5,046.0 5,042.6 3.5 Nicaragua 0.0 0.0 0.0 Panama 49.1 14.0 14.0 35.0 34.3 0.8 Paraguay 0.6 0.6 0.6 Peru 140.9 119.0 15.5 103.4 21.9 11.0 10.9 St. Kitts and Nevis 5.5 5.5 5.5 St. Vincent and the Grenadines 0.8 0.8 0.8 Suriname 8.4 8.4 8.4 Trinidad and Tobago 14.3 14.3 14.3 Uruguay 47.3 47.3 47.3 Venezuela 167.4 167.4 167.4 Western Hemisphere Regional 4.3 4.3 4.3 Western Hemisphere Unspecified 10.3 3.5 3.5 6.8 6.8 Western Hemisphere - Total 8,606.9 971.9 493.7 478.3 7,635.0 240.1 7.5 7,243.5 6.8 135.8 World Total 59,890.7 13,603.5 5,903.4 7,700.0 46,287.3 17,406.7 4,641.5 23,184.4 212.5 840.8
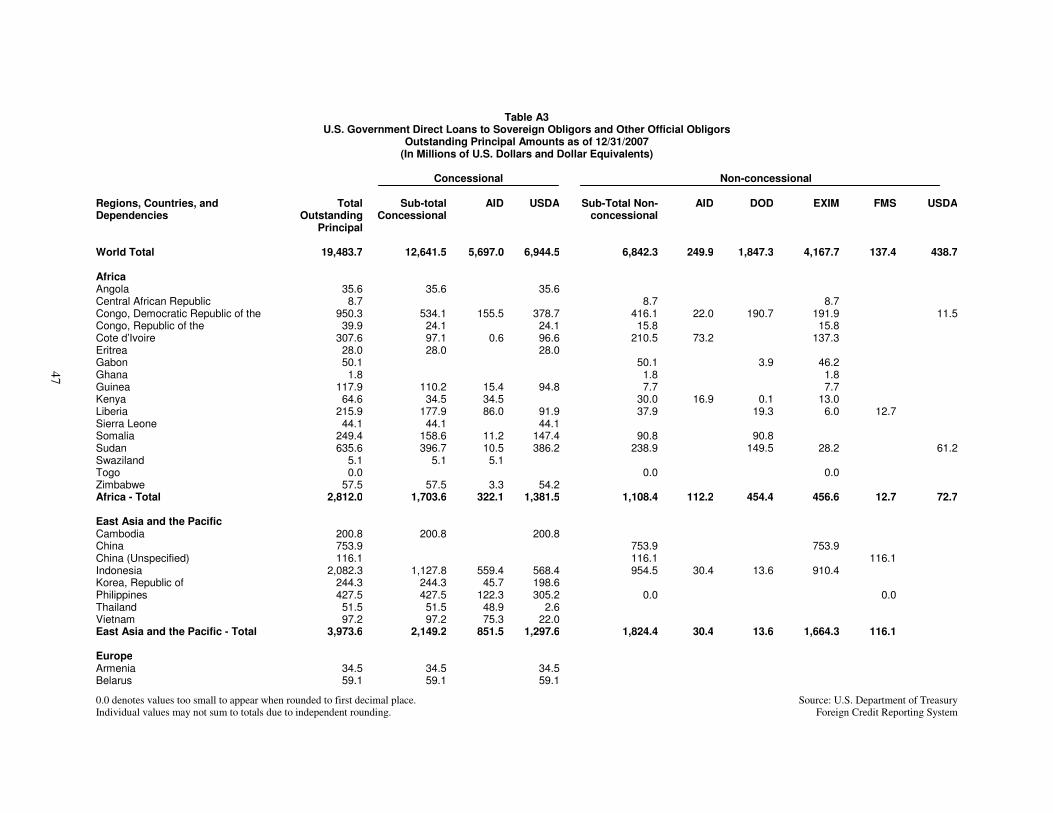
0.0 denotes values too small to appear when rounded to first decimal place. Source: U.S. Department of Treasury
Individual values may not sum to totals due to independent rounding. Foreign Credit Reporting System
47
Table A3
U.S. Government Direct Loans to Sovereign Obligors and Other Official Obligors Outstanding Principal Amounts as of 12/31/2007
(In Millions of U.S. Dollars and Dollar Equivalents)
Concessional
Non-concessional
Regions, Countries, and Dependencies
Total Outstanding
Principal
Sub-total Concessional
AID USDA Sub-Total Non-concessional
AID DOD EXIM FMS USDA
World Total 19,483.7 12,641.5 5,697.0 6,944.5 6,842.3 249.9 1,847.3 4,167.7 137.4 438.7 Africa Angola 35.6 35.6 35.6 Central African Republic 8.7 8.7 8.7 Congo, Democratic Republic of the 950.3 534.1 155.5 378.7 416.1 22.0 190.7 191.9 11.5 Congo, Republic of the 39.9 24.1 24.1 15.8 15.8 Cote d’Ivoire 307.6 97.1 0.6 96.6 210.5 73.2 137.3 Eritrea 28.0 28.0 28.0 Gabon 50.1 50.1 3.9 46.2 Ghana 1.8 1.8 1.8 Guinea 117.9 110.2 15.4 94.8 7.7 7.7 Kenya 64.6 34.5 34.5 30.0 16.9 0.1 13.0 Liberia 215.9 177.9 86.0 91.9 37.9 19.3 6.0 12.7 Sierra Leone 44.1 44.1 44.1 Somalia 249.4 158.6 11.2 147.4 90.8 90.8 Sudan 635.6 396.7 10.5 386.2 238.9 149.5 28.2 61.2 Swaziland 5.1 5.1 5.1 Togo 0.0 0.0 0.0 Zimbabwe 57.5 57.5 3.3 54.2 Africa - Total 2,812.0 1,703.6 322.1 1,381.5 1,108.4 112.2 454.4 456.6 12.7 72.7 East Asia and the Pacific Cambodia 200.8 200.8 200.8 China 753.9 753.9 753.9 China (Unspecified) 116.1 116.1 116.1 Indonesia 2,082.3 1,127.8 559.4 568.4 954.5 30.4 13.6 910.4 Korea, Republic of 244.3 244.3 45.7 198.6 Philippines 427.5 427.5 122.3 305.2 0.0 0.0 Thailand 51.5 51.5 48.9 2.6 Vietnam 97.2 97.2 75.3 22.0 East Asia and the Pacific - Total 3,973.6 2,149.2 851.5 1,297.6 1,824.4 30.4 13.6 1,664.3 116.1 Europe Armenia 34.5 34.5 34.5 Belarus 59.1 59.1 59.1

0.0 denotes values too small to appear when rounded to first decimal place. Source: U.S. Department of Treasury
Individual values may not sum to totals due to independent rounding. Foreign Credit Reporting System
48
Table A3 U.S. Government Direct Loans to Sovereign Obligors and Other Official Obligors
Outstanding Principal Amounts as of 12/31/2007 (In Millions of U.S. Dollars and Dollar Equivalents)
Concessional
Non-concessional
Regions, Countries, and Dependencies
Total Outstanding
Principal
Sub-total Concessional
AID USDA Sub-Total Non-concessional
AID DOD EXIM FMS USDA
Bosnia and Herzegovina 25.4 1.6 1.6 23.8 23.8 Croatia 31.5 9.7 3.5 6.3 21.8 21.8 Georgia 39.8 39.8 39.8 Greece 456.1 456.1 456.1 Latvia 5.8 5.8 5.8 Macedonia, Former Yugoslav Rep. of 4.5 4.5 4.5 Malta 1.8 1.8 1.8 Moldova 55.3 55.3 55.3 Poland 8.8 8.8 8.8 Romania 19.3 19.3 19.3 Russia 75.8 75.8 75.8 Serbia and Montenegro 9.3 5.8 5.8 3.5 3.5 Slovenia 1.9 1.9 1.9 Tajikistan 15.3 15.3 15.3 Turkey 194.1 41.6 35.0 6.5 152.5 152.5 Turkmenistan 32.2 32.2 32.2 Ukraine 154.4 40.3 40.3 114.0 114.0 Uzbekistan 55.8 55.8 55.8 Yugoslavia (Former) 210.9 210.9 210.9 Europe - Total 1,491.7 509.0 49.6 459.5 982.7 608.6 370.5 3.5 Intl Orgs or Not Specified Worldwide Unspecified 0.0 0.0 0.0 Intl Orgs or Not Specified - Total 0.0 0.0 0.0 Middle East and North Africa Algeria 105.3 105.3 105.3 Egypt 3,828.7 3,828.7 1,734.5 2,094.3 Iran 1.9 1.9 1.9 Israel 861.1 549.9 549.9 311.2 311.2 Jordan 478.5 117.1 117.1 361.4 27.5 322.6 11.3 Morocco 248.2 238.1 48.6 189.5 10.1 0.3 9.7 Syria 237.8 237.0 183.0 54.1 0.7 0.7 Tunisia 26.6 26.0 8.0 18.0 0.7 0.7 Yemen 98.8 98.0 5.9 92.1 0.8 0.8 Middle East and North Africa - Total 5,886.9 5,094.8 2,529.8 2,565.0 792.0 29.2 633.8 115.0 1.9 12.1
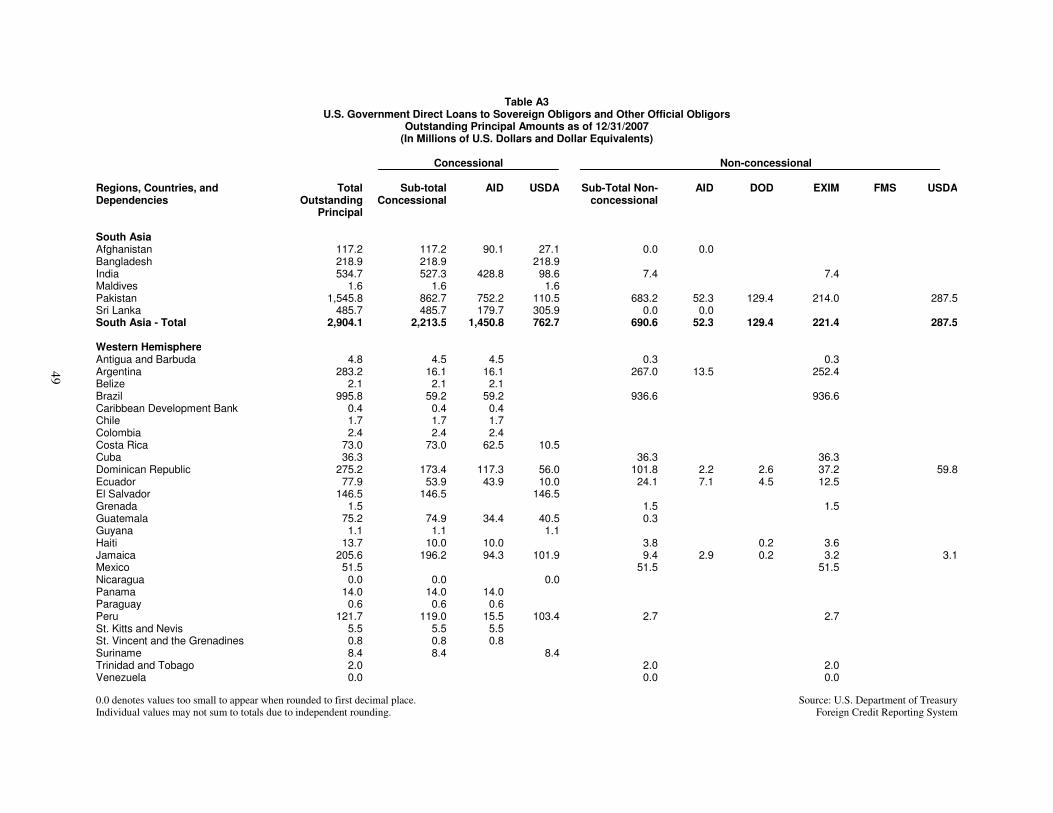
0.0 denotes values too small to appear when rounded to first decimal place. Source: U.S. Department of Treasury
Individual values may not sum to totals due to independent rounding. Foreign Credit Reporting System
49
Table A3 U.S. Government Direct Loans to Sovereign Obligors and Other Official Obligors
Outstanding Principal Amounts as of 12/31/2007 (In Millions of U.S. Dollars and Dollar Equivalents)
Concessional
Non-concessional
Regions, Countries, and Dependencies
Total Outstanding
Principal
Sub-total Concessional
AID USDA Sub-Total Non-concessional
AID DOD EXIM FMS USDA
South Asia Afghanistan 117.2 117.2 90.1 27.1 0.0 0.0 Bangladesh 218.9 218.9 218.9 India 534.7 527.3 428.8 98.6 7.4 7.4 Maldives 1.6 1.6 1.6 Pakistan 1,545.8 862.7 752.2 110.5 683.2 52.3 129.4 214.0 287.5 Sri Lanka 485.7 485.7 179.7 305.9 0.0 0.0 South Asia - Total 2,904.1 2,213.5 1,450.8 762.7 690.6 52.3 129.4 221.4 287.5 Western Hemisphere Antigua and Barbuda 4.8 4.5 4.5 0.3 0.3 Argentina 283.2 16.1 16.1 267.0 13.5 252.4 Belize 2.1 2.1 2.1 Brazil 995.8 59.2 59.2 936.6 936.6 Caribbean Development Bank 0.4 0.4 0.4 Chile 1.7 1.7 1.7 Colombia 2.4 2.4 2.4 Costa Rica 73.0 73.0 62.5 10.5 Cuba 36.3 36.3 36.3 Dominican Republic 275.2 173.4 117.3 56.0 101.8 2.2 2.6 37.2 59.8 Ecuador 77.9 53.9 43.9 10.0 24.1 7.1 4.5 12.5 El Salvador 146.5 146.5 146.5 Grenada 1.5 1.5 1.5 Guatemala 75.2 74.9 34.4 40.5 0.3 Guyana 1.1 1.1 1.1 Haiti 13.7 10.0 10.0 3.8 0.2 3.6 Jamaica 205.6 196.2 94.3 101.9 9.4 2.9 0.2 3.2 3.1 Mexico 51.5 51.5 51.5 Nicaragua 0.0 0.0 0.0 Panama 14.0 14.0 14.0 Paraguay 0.6 0.6 0.6 Peru 121.7 119.0 15.5 103.4 2.7 2.7 St. Kitts and Nevis 5.5 5.5 5.5 St. Vincent and the Grenadines 0.8 0.8 0.8 Suriname 8.4 8.4 8.4 Trinidad and Tobago 2.0 2.0 2.0 Venezuela 0.0 0.0 0.0

0.0 denotes values too small to appear when rounded to first decimal place. Source: U.S. Department of Treasury
Individual values may not sum to totals due to independent rounding. Foreign Credit Reporting System
50
Table A3 U.S. Government Direct Loans to Sovereign Obligors and Other Official Obligors
Outstanding Principal Amounts as of 12/31/2007 (In Millions of U.S. Dollars and Dollar Equivalents)
Concessional
Non-concessional
Regions, Countries, and Dependencies
Total Outstanding
Principal
Sub-total Concessional
AID USDA Sub-Total Non-concessional
AID DOD EXIM FMS USDA
Western Hemisphere Regional 4.3 4.3 4.3 Western Hemisphere Unspecified 10.3 3.5 3.5 6.8 6.8 Western Hemisphere - Total 2,415.5 971.4 493.1 478.3 1,444.1 25.7 7.5 1,340.0 6.8 62.8 World Total 19,483.7 12,641.5 5,697.0 6,944.5 6,842.3 249.9 1,847.3 4,167.7 137.4 438.7

0.0 denotes values too small to appear when rounded to first decimal place. Source: U.S. Department of Treasury
Individual values may not sum to totals due to independent rounding. Foreign Credit Reporting System
51
Table A4
U.S. Government Loan Guarantees to Sovereign Obligors Principal Outstanding as of 12/31/2007
(In Millions of U.S. Dollars)
Total
AID
AID
DOD
EXIM
USDA
Housing and Other
Guarantees Loan Guarantees to Israel
Regions, Countries and Dependencies
Principal and Claims
Outstanding
Principal Outstanding
Claims Outstanding
Principal Outstanding
Claims Outstanding
Principal Outstanding
Claims Outstanding
Principal Outstanding
Claims Outstanding
Principal Outstanding
Claims Outstanding
Principal Outstanding
Claims Outstanding
World Total 34,528.5 34,340.6 187.9 2,600.1 78.0 12,686.0 1,610.7 17,236.1 109.9 207.7 Africa Angola 297.9 297.9 297.9 Botswana 2.8 2.8 2.8 Cameroon 4.0 4.0 4.0 Cote d’Ivoire 33.2 6.8 26.4 6.8 16.3 10.2 Ethiopia 256.8 256.8 256.8 Ghana 64.6 59.9 4.7 59.9 4.7 Kenya 21.7 21.7 14.3 7.4 Mauritius 1.6 1.6 1.6 Nigeria 1.3 1.3 1.3 Rwanda 0.7 0.7 0.7 Senegal 34.8 34.8 34.8 South Africa 222.7 222.7 80.8 141.9 Zimbabwe 116.7 55.5 61.2 55.5 61.2 Africa - Total 1,058.8 961.7 97.1 161.7 77.5 800.1 19.6 East Asia and the Pacific China 1,123.8 1,123.6 0.2 1,123.6 0.2 Indonesia 284.9 234.4 50.5 189.1 45.4 50.5 Korea, Republic of 322.9 322.9 0.0 0.0 266.2 56.7 Malaysia 584.7 584.7 584.7 New Zealand 219.8 219.8 219.8 Philippines 98.5 98.5 39.3 59.1 Singapore 870.8 870.8 870.8 Thailand 1,080.7 1,080.7 3.0 1,077.7 Vietnam 301.1 301.1 301.1 East Asia and the Pacific - Total 4,887.2 4,836.5 50.7 231.4 0.0 4,489.2 50.7 115.9 Europe Azerbaijan 48.3 48.3 48.3 Bosnia and Herzegovina 3.5 3.5 3.5 Bulgaria 41.8 41.8 41.8 Croatia 182.0 182.0 182.0 Czech Republic 121.4 121.4 22.8 98.6 Greece 27.4 27.4 27.4 Italy 299.0 299.0 299.0 Kazakhstan 124.4 124.4 124.4 Macedonia, Former Yugoslav Rep. of 0.0 0.0 0.0 Poland 1.8 1.8 1.8 Portugal 11.9 11.9 11.9 Romania 237.0 237.0 237.0 Russia 83.0 83.0 83.0 Turkey 1,491.2 1,491.2 634.8 838.3 18.1 Ukraine 12.3 12.3 12.3 Uzbekistan 269.9 269.9 269.9 Yugoslavia (Former) 28.7 28.7 28.7 Europe – Total 2,983.7 2,951.5 32.2 34.7 662.2 2,236.4 32.2 18.1

0.0 denotes values too small to appear when rounded to first decimal place. Source: U.S. Department of Treasury
Individual values may not sum to totals due to independent rounding. Foreign Credit Reporting System
52
Table A4 U.S. Government Loan Guarantees to Sovereign Obligors
Principal Outstanding as of 12/31/2007 (In Millions of U.S. Dollars)
Total
AID
AID
DOD
EXIM
USDA
Housing and Other
Guarantees Loan Guarantees to Israel
Regions, Countries and Dependencies
Principal and Claims
Outstanding
Principal Outstanding
Claims Outstanding
Principal Outstanding
Claims Outstanding
Principal Outstanding
Claims Outstanding
Principal Outstanding
Claims Outstanding
Principal Outstanding
Claims Outstanding
Principal Outstanding
Claims Outstanding
Middle East and North Africa Algeria 201.1 201.1 201.1 Bahrain 76.0 76.0 76.0 Egypt 1,307.1 1,306.7 0.5 1,250.0 56.7 0.5 Israel 14,079.7 14,079.7 349.2 12,686.0 939.9 104.6 Jordan 40.8 40.8 40.8 Lebanon 8.6 8.6 8.6 Morocco 533.6 533.6 85.2 448.4 Saudi Arabia 781.7 781.7 781.7 Tunisia 200.3 200.3 96.6 8.5 90.1 5.1 United Arab Emirates 768.9 768.9 768.9 Middle East and North Africa - Total
17,997.8 17,997.3 0.5 1,830.3 12,686.0 948.5 2,527.5 0.5 5.1
South Asia India 1,186.4 1,180.0 6.4 71.2 1,108.7 6.4 Pakistan 801.3 801.3 35.7 765.5 Sri Lanka 50.9 50.9 50.9 South Asia - Total 2,038.5 2,032.1 6.4 157.8 1,874.3 6.4 Western Hemisphere Barbados 2.8 2.8 2.4 0.4 Belize 3.9 3.9 0.6 3.2 Bolivia 6.6 6.6 6.6 Brazil 66.3 66.3 66.3 CABEI 40.8 40.8 40.8 Chile 0.4 0.4 0.4 Colombia 137.6 137.6 72.5 65.1 Costa Rica 16.4 16.4 16.4 Dominican Republic 335.6 335.6 335.6 Ecuador 15.1 15.1 15.1 Grenada 0.6 0.6 0.6 Honduras 21.0 21.0 21.0 Jamaica 53.7 53.7 38.9 14.8 Mexico 4,590.4 4,590.4 4,586.9 3.5 Panama 35.0 35.0 34.3 0.8 Peru 16.2 15.7 0.5 8.1 0.5 7.6 Trinidad and Tobago 9.2 9.2 9.2 Uruguay 47.3 47.3 47.3 Venezuela 163.6 163.6 163.6 Western Hemisphere - Total 5,562.5 5,561.5 1.0 184.3 0.5 5,308.7 0.6 68.6 World Total 34,528.5 34,340.6 187.9 2,600.1 78.0 12,686.0 1,610.7 17,236.1 109.9 207.7

0.0 denotes values too small to appear when rounded to first decimal place. Source: U.S. Department of Treasury
Individual values may not sum to totals due to independent rounding. Foreign Credit Reporting System
53
Table A5 U.S. Bilateral Debt Reduction FY 1990 – FY 2008
Actual and Anticipated Principal Reduction (in millions of U.S. Dollars)
Country Date of
Action 572
Debt1
411 Debt
2 EAI/TFCA
3
Concessional Special
Legislation Debt
Reduction for
Poorest4
Heavily Indebted
Poor Countries
(HIPC)4
Enhanced HIPC
5 Support for
East European Democracy (SEED Act)
6
Total
World Total 2,021.0 689.1 1,229.8 15,594.1 2,678.1 247.6 1,861.5 562.4 24,883.6
Europe & Middle East 0.0 0.0 0.0 14119.3 2.5 0.0 0.0 562.4 14,684.2
Bosnia 1999 24 24 Egypt 1990 6998.1 6,998.1 Iraq 2005 - - - 3914.2 - - - - 3,914.2 Jordan 1995 & 1997 698.4 698.4 Jordan 2008 43.9 43.9 Poland 1991 2464.7 2,464.7 Yemen 2001 2.5 2.5 Yugoslavia 2002 538.4 538.4
Latin America & Caribbean 1,009.3 272.9 1203.1 3.3 236.7 14.2 204.3 0.0 2,943.8
Argentina 1993 - - 3.8 - - - - - 3.8 Belize 2001 - - 11.3 - - - - - 11.3 Bolivia 1991 339.6 - 30.7 - - - - - 370.3 Bolivia 1996 - - - - 66.7 - - - 66.7 Bolivia 1999 - - - - - 12.3 - - 12.3 Bolivia 2001 - - - - - - 57 - 57 Bolivia 2002 2.5 2.5 Chile 1991 - - 30.6 - - - - - 30.6 Colombia 1992 - - 31.0 - - - - - 31 Colombia 2004 - - 10.0 - - - - - 10 Costa Rica 2007 26.1 26.1 El Salvador 1992 - - 463.9 - - - - - 463.9 El Salvador 2001 - - 20.9 - - - - - 20.9 Guatemala 2006 25.1 25.1 Guyana 1991 76.3 40.3 - - - - - - 116.6 Guyana 1996 - - - - 9.9 - - - 9.9 Guyana 1999 - - - - - 1.9 - - 1.9 Guyana 2004 - - - - - - 34.1 - 34.1 Haiti 1991 - 98.9 - - - - - - 98.9 Haiti 1995 - - - - 8.3 - - - 8.3 Haiti 2007 - - - - - - 14.4 - 14.4 Honduras 1991 333.9 108.9 - - - - - - 442.8 Honduras 1996 - - - - 68.5 - - - 68.5 Honduras 1999 - - - - 23.4 - - - 23.4 Honduras 2000 - - - - - - 54.1 - 54.1 Jamaica 1991 - - 310.8 - - - - - 310.8 Jamaica 2004 - - 16.0 - - - - - 16 Nicaragua 1991 259.5 24.8 - - - - - - 284.3 Nicaragua 1995 - - - 3.3 - - - - 3.3 Nicaragua 1998 - - - - 59.9 - - - 59.9 Nicaragua 2003 - - - - - - 42.2 - 42.2 Panama 2003 - - 10.0 - - - - - 10 Panama 2004 - - 10.9 - - - - - 10.9 Paraguay 2006 7.4 7.4 Peru 1998 - - 176.8 - - - - - 176.8 Peru 2001 14.1 14.1 Uruguay 1992 - - 3.7 - - - - - 3.7

0.0 denotes values too small to appear when rounded to first decimal place. Source: U.S. Department of Treasury
Individual values may not sum to totals due to independent rounding. Foreign Credit Reporting System
54
Table A5 U.S. Bilateral Debt Reduction FY 1990 – FY 2008
Actual and Anticipated Principal Reduction (in millions of U.S. Dollars)
Country Date of
Action 572
Debt1
411 Debt
2 EAI/TFCA
3
Concessional Special
Legislation Debt
Reduction for
Poorest4
Heavily Indebted
Poor Countries
(HIPC)4
Enhanced HIPC
5 Support for
East European Democracy (SEED Act)
6
Total
Africa 720.1 416.2 8.3 0.0 2438.9 233.4 1542.9 0.0 5359.8 Benin 1989 &1991 29.8 - - - - - - - 29.8 Botswana 2006 8.3 8.3 Burkina Faso 1991 2.4 - - - - - - - 2.4 Cameroon 1990 61.4 - - - - - - - 61.4 Cameroon 1998 - - - - 45.2 - - - 45.2 Cameroon 2001 - - - - - - 47.7 - 47.7 Central African Rep. 1995 - - - - 5.1 - - - 5.1 Central African Rep. 1998 - - - - 1.8 - - - 1.8 Central African Rep. 2007 4.1 4.1 Central African Rep. 2008 6.9 6.9 Congo, Rep. of 1996 - - - - 10.7 - - - 10.7 Congo, Rep. of 2006 - - - - - - 56.9 - 56.9 Congo, Dem. Rep. Of 1989 54.1 - - - - - - - 54.1 Congo, Dem. Rep. Of 2002 - - - - 1,538.80 - - - 1,538.80 Congo, Dem. Rep. Of 2005 - - - - - - 289.3 - 289.3 Congo, Dem. Rep. Of 2006 - - - - - - 4.5 - 4.5 Congo, Dem. Rep. Of 2008 - - - - - - 113.6 - 113.6 Cote d’Ivoire 1990 & 1991 17.9 - - - - - - - 17.9 Cote d’Ivoire 1998 - - - - - 220.4 - - 220.4 Ethiopia 2001 - - - - 1.4 - - - 1.4 Ethiopia 2002 64.6 64.6 Ghana 1989 83.7 95.8 - - - - - - 179.5 Ghana 2002 11.3 11.3 Guinea 1989 4.5 - - - - - - - 4.5 Guinea 1995 - - - - 4.3 - - - 4.3 Guinea 2001 - - - - - - 122.4 - 122.4 Kenya 1990 & 1991 85.9 102 - - - - - - 187.9 Liberia 2008 422.7 422.7 Madagascar 1990 & 1991 5.6 53.4 - - - - - - 59 Madagascar 2001 - - - - - - 8.5 - 8.5 Malawi 1989 & 1991 29.5 2.2 - - - - - - 31.7 Mali 1989 5.1 - - - - - - - 5.1 Mali 2003 - - - - - - 0 - 0 Mauritania 2000 - - - - - - 7.1 - 7.1 Mozambique 1991 - 52.9 - - - - - - 52.9 Mozambique 1997 - - - - 36.3 - - - 36.3 Mozambique 1998 - - - - - 6.9 - - 6.9 Mozambique 1999 - - - - - 5.4 - - 5.4 Mozambique 2002 - - - - - - 5 - 5 Niger 1990 & 1991 6.9 - - - - - - - 6.9 Niger 1994 - - - - 6.1 - - - 6.1 Niger 1996 - - - - 2.4 - - - 2.4 Niger 2001 - - - - - - 4.1 - 4.1 Nigeria 1989 64.8 - - - - - - - 64.8 Nigeria 2005 618.6 618.6 Rwanda 1998 - - - - 0.8 - - - 0.8 Rwanda 2001 - - - - - - 1.6 - 1.6 Senegal 1991 - 34.5 - - - - - - 34.5 Senegal 1994 - - - - 7.2 - - - 7.2

0.0 denotes values too small to appear when rounded to first decimal place. Source: U.S. Department of Treasury
Individual values may not sum to totals due to independent rounding. Foreign Credit Reporting System
55
Table A5 U.S. Bilateral Debt Reduction FY 1990 – FY 2008
Actual and Anticipated Principal Reduction (in millions of U.S. Dollars)
Country Date of
Action 572
Debt1
411 Debt
2 EAI/TFCA
3
Concessional Special
Legislation Debt
Reduction for
Poorest4
Heavily Indebted
Poor Countries
(HIPC)4
Enhanced HIPC
5 Support for
East European Democracy (SEED Act)
6
Total
Senegal 1995 - - - - 2.9 - - - 2.9 Senegal 2001 - - - - - - 8.6 - 8.6 Sierra Leone 2002 71.4 71.4 Tanzania 1990 & 1991 79.7 59.1 - - - - - - 138.8 Tanzania 1997 - - - - 18.9 - - - 18.9 Tanzania 2000 - - - - - - 7.6 - 7.6 Tanzania 2001 - - - - - - 8.6 - 8.6 Togo 1991 7.4 - - - - - - - 7.4 Uganda 1990 & 1991 8.6 16.3 - - - - - - 24.9 Uganda 1998 - - - - - 0.7 - - 0.7 Uganda 2000 - - - - - - 0.2 - 0.2 Zambia 1991 172.8 - - - - - - - 172.8 Zambia 1999 - - - - 134.3 - - - 134.3 Zambia 2001 - - - - - - 280.3 - 280.3 Asia 291.6 0.0 18.4 1,471.5 0.0 0.0 114.3 0.0 1,895.8
Afghanistan 2007 114.3 114.3
Bangladesh 1991 291.6 291.6 Bangladesh 2000 10.0 10.0 Pakistan 2003 - - - 1000.0 - - - - 1,000.00 Pakistan 2004 - - - 471.5 - - - - 471.5 Philippines 2002 - - 8.4 - - - - - 8.4
World Total 2,021.0 689.1 1,229.8 15,594.1 2,678.1 247.6 1,861.5 562.4 24,883.6
1 Section 572 of the Foreign Operations, Export Financing and Related Programs Appropriations Act for Fiscal Year 1989 (Public Law 100-461).
2 Section 411 of the Agricultural Trade Development and Assistance Act of 1954 (Public Law 83-480; 7 U.S.C. sec. 1736e).
3 Enterprise for the Americas Act of 1992 (EAI) (Public Law 102-549, adding Part IV, sections 701 et seq., to the Foreign Assistance Act of 1961,
and Public Law 102-429, adding section 12 to the Export-Import Bank Act of 1945, 22 U.S.C. 2430 and 12 U.S.C. 635i-6) Tropical Forest Conservation Act of 1998 (TFCA) (Public Law 105-214, adding Part V, sections 801 et seq., to the Foreign Assistance Act of 1961). TFCA figures may include both principal and interest reduction. 4 Special Debt Relief for the Poorest (contained in annual Foreign Operations, Export Financing and Related Programs Appropriations Acts since 1994).
5 International Debt Relief (HIPC) (Title V of H.R. 3425 as enacted into law by section 1000(a)(5) of Public Law 106-113).

56
Table A6
Maximum Contingent Liability (Unadjusted) and Claims Outstanding on U.S. Government Insurance Contracts Covering Private Transactions
with Sovereign and Other Foreign Official Obligors as of 12/31/2007
(in Millions of U.S. Dollars)
EXIM EXIM Sovereign Political Risks
Sovereign Commercial Risks
Regions, Countries, and Dependencies
Total Sovereign
Risks
Maximum Contingent
Liability
Claims Outstanding
Maximum Contingent
Liability
Claims Outstanding
World Total 52.0 0.1 44.5 7.5 Africa Ghana 1.0 1.0 Kenya 0.5 0.5 Zimbabwe 0.1 0.1 Africa - Total 1.5 0.5 1.0 East Asia and the Pacific Indonesia 4.2 4.2 East Asia and the Pacific - Total 4.2 4.2 Europe Romania 1.6 1.6 Russia 0.4 0.4 Turkey 0.3 0.3 Yugoslavia (Former) 0.3 0.3 Europe - Total 2.6 2.3 0.3 Western Hemisphere Costa Rica 0.3 0.3 Dominican Republic 3.9 3.9 Grenada 0.5 0.5 Guatemala 0.4 0.4 Honduras 0.4 0.4 Jamaica 13.4 13.4 Mexico 17.9 0.1 16.4 1.4 Trinidad and Tobago 3.0 3.0 Venezuela 3.8 3.8 Western Hemisphere - Total 43.7 0.1 41.7 2.0 World Total 52.0 0.1 44.5 7.5
Individual values may not sum to totals due to independent rounding. Source: U.S. Department of Treasury
0.0 denotes values too small to appear when rounded to first decimal place. Foreign Credit Reporting System
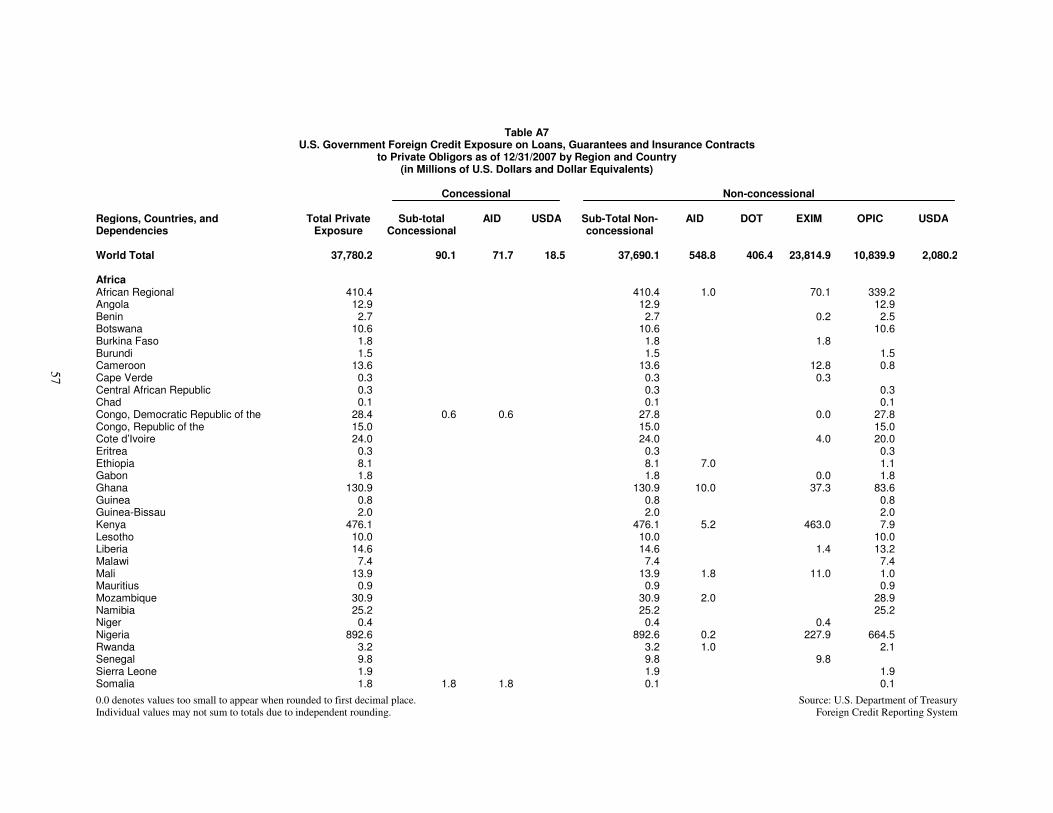
0.0 denotes values too small to appear when rounded to first decimal place. Source: U.S. Department of Treasury
Individual values may not sum to totals due to independent rounding. Foreign Credit Reporting System
57
Table A7 U.S. Government Foreign Credit Exposure on Loans, Guarantees and Insurance Contracts
to Private Obligors as of 12/31/2007 by Region and Country (in Millions of U.S. Dollars and Dollar Equivalents)
Concessional
Non-concessional
Regions, Countries, and Dependencies
Total Private Exposure
Sub-total Concessional
AID USDA Sub-Total Non-concessional
AID DOT EXIM OPIC USDA
World Total 37,780.2 90.1 71.7 18.5 37,690.1 548.8 406.4 23,814.9 10,839.9 2,080.2 Africa African Regional 410.4 410.4 1.0 70.1 339.2 Angola 12.9 12.9 12.9 Benin 2.7 2.7 0.2 2.5 Botswana 10.6 10.6 10.6 Burkina Faso 1.8 1.8 1.8 Burundi 1.5 1.5 1.5 Cameroon 13.6 13.6 12.8 0.8 Cape Verde 0.3 0.3 0.3 Central African Republic 0.3 0.3 0.3 Chad 0.1 0.1 0.1 Congo, Democratic Republic of the 28.4 0.6 0.6 27.8 0.0 27.8 Congo, Republic of the 15.0 15.0 15.0 Cote d’Ivoire 24.0 24.0 4.0 20.0 Eritrea 0.3 0.3 0.3 Ethiopia 8.1 8.1 7.0 1.1 Gabon 1.8 1.8 0.0 1.8 Ghana 130.9 130.9 10.0 37.3 83.6 Guinea 0.8 0.8 0.8 Guinea-Bissau 2.0 2.0 2.0 Kenya 476.1 476.1 5.2 463.0 7.9 Lesotho 10.0 10.0 10.0 Liberia 14.6 14.6 1.4 13.2 Malawi 7.4 7.4 7.4 Mali 13.9 13.9 1.8 11.0 1.0 Mauritius 0.9 0.9 0.9 Mozambique 30.9 30.9 2.0 28.9 Namibia 25.2 25.2 25.2 Niger 0.4 0.4 0.4 Nigeria 892.6 892.6 0.2 227.9 664.5 Rwanda 3.2 3.2 1.0 2.1 Senegal 9.8 9.8 9.8 Sierra Leone 1.9 1.9 1.9 Somalia 1.8 1.8 1.8 0.1 0.1
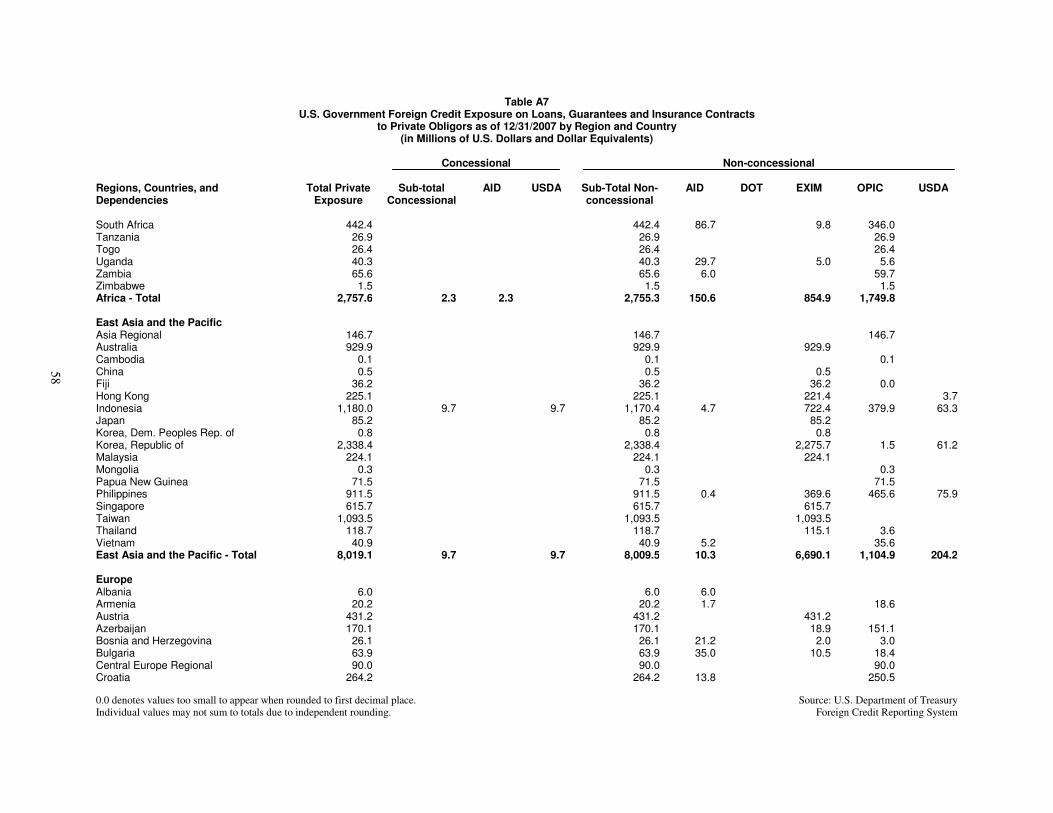
0.0 denotes values too small to appear when rounded to first decimal place. Source: U.S. Department of Treasury
Individual values may not sum to totals due to independent rounding. Foreign Credit Reporting System
58
Table A7 U.S. Government Foreign Credit Exposure on Loans, Guarantees and Insurance Contracts
to Private Obligors as of 12/31/2007 by Region and Country (in Millions of U.S. Dollars and Dollar Equivalents)
Concessional
Non-concessional
Regions, Countries, and Dependencies
Total Private Exposure
Sub-total Concessional
AID USDA Sub-Total Non-concessional
AID DOT EXIM OPIC USDA
South Africa 442.4 442.4 86.7 9.8 346.0 Tanzania 26.9 26.9 26.9 Togo 26.4 26.4 26.4 Uganda 40.3 40.3 29.7 5.0 5.6 Zambia 65.6 65.6 6.0 59.7 Zimbabwe 1.5 1.5 1.5 Africa - Total 2,757.6 2.3 2.3 2,755.3 150.6 854.9 1,749.8 East Asia and the Pacific Asia Regional 146.7 146.7 146.7 Australia 929.9 929.9 929.9 Cambodia 0.1 0.1 0.1 China 0.5 0.5 0.5 Fiji 36.2 36.2 36.2 0.0 Hong Kong 225.1 225.1 221.4 3.7 Indonesia 1,180.0 9.7 9.7 1,170.4 4.7 722.4 379.9 63.3 Japan 85.2 85.2 85.2 Korea, Dem. Peoples Rep. of 0.8 0.8 0.8 Korea, Republic of 2,338.4 2,338.4 2,275.7 1.5 61.2 Malaysia 224.1 224.1 224.1 Mongolia 0.3 0.3 0.3 Papua New Guinea 71.5 71.5 71.5 Philippines 911.5 911.5 0.4 369.6 465.6 75.9 Singapore 615.7 615.7 615.7 Taiwan 1,093.5 1,093.5 1,093.5 Thailand 118.7 118.7 115.1 3.6 Vietnam 40.9 40.9 5.2 35.6 East Asia and the Pacific - Total 8,019.1 9.7 9.7 8,009.5 10.3 6,690.1 1,104.9 204.2 Europe Albania 6.0 6.0 6.0 Armenia 20.2 20.2 1.7 18.6 Austria 431.2 431.2 431.2 Azerbaijan 170.1 170.1 18.9 151.1 Bosnia and Herzegovina 26.1 26.1 21.2 2.0 3.0 Bulgaria 63.9 63.9 35.0 10.5 18.4 Central Europe Regional 90.0 90.0 90.0 Croatia 264.2 264.2 13.8 250.5

0.0 denotes values too small to appear when rounded to first decimal place. Source: U.S. Department of Treasury
Individual values may not sum to totals due to independent rounding. Foreign Credit Reporting System
59
Table A7 U.S. Government Foreign Credit Exposure on Loans, Guarantees and Insurance Contracts
to Private Obligors as of 12/31/2007 by Region and Country (in Millions of U.S. Dollars and Dollar Equivalents)
Concessional
Non-concessional
Regions, Countries, and Dependencies
Total Private Exposure
Sub-total Concessional
AID USDA Sub-Total Non-concessional
AID DOT EXIM OPIC USDA
Cyprus 11.5 11.5 11.5 Georgia 40.4 40.4 1.5 38.9 Germany 156.9 156.9 156.9 Hungary 0.3 0.3 0.3 0.0 Ireland 2,096.0 2,096.0 2,096.0 Kazakhstan 590.3 590.3 7.5 343.7 181.9 57.2 Kyrgyzstan 31.2 31.2 0.5 30.7 Lithuania 7.0 7.0 7.0 Luxembourg 151.0 151.0 151.0 Moldova 25.8 25.8 13.5 12.2 Netherlands 517.7 517.7 517.7 Newly Independent States-FSU Reg. 121.3 121.3 121.3 Poland 5.5 5.5 5.0 0.5 Romania 43.0 43.0 3.5 29.5 8.8 1.2 Russia 1,557.4 1,557.4 13.4 227.4 976.5 340.1 Serbia and Montenegro 17.3 17.3 5.5 11.8 Spain 0.3 0.3 0.3 Switzerland 1.1 1.1 1.1 Tajikistan 0.1 0.1 0.1 Turkey 2,064.8 2,064.8 1,048.5 541.3 475.0 Ukraine 185.0 185.0 3.0 77.9 58.9 45.2 United Kingdom 6.8 6.8 6.8 Uzbekistan 4.0 4.0 4.0 Yugoslavia (Former) 12.6 12.6 6.6 6.0 Europe - Total 8,718.9 8,718.9 131.0 5,144.7 2,524.5 918.7 Intl Orgs or Not Specified Worldwide Unspecified 723.7 723.7 96.8 85.5 541.5 Intl Orgs or Not Specified - Total 723.7 723.7 96.8 85.5 541.5 Middle East and North Africa Algeria 200.0 200.0 200.0 Bahrain 1.9 1.9 1.9 Egypt 574.8 574.8 25.0 249.8 300.0 Gaza Strip 160.9 160.9 2.8 158.2 Iraq 103.6 103.6 103.6 Israel 568.9 568.9 248.9 320.0 Jordan 193.8 193.8 2.5 54.9 136.3

0.0 denotes values too small to appear when rounded to first decimal place. Source: U.S. Department of Treasury
Individual values may not sum to totals due to independent rounding. Foreign Credit Reporting System
60
Table A7 U.S. Government Foreign Credit Exposure on Loans, Guarantees and Insurance Contracts
to Private Obligors as of 12/31/2007 by Region and Country (in Millions of U.S. Dollars and Dollar Equivalents)
Concessional
Non-concessional
Regions, Countries, and Dependencies
Total Private Exposure
Sub-total Concessional
AID USDA Sub-Total Non-concessional
AID DOT EXIM OPIC USDA
Kuwait 201.3 201.3 1.3 200.0 Lebanon 211.8 211.8 4.0 205.1 2.7 Morocco 154.7 154.7 19.5 103.0 32.2 Oman 53.7 53.7 53.7 Qatar 1,014.8 1,014.8 1,014.8 Saudi Arabia 741.2 741.2 741.2 Tunisia 13.5 13.5 0.7 12.8 United Arab Emirates 1.3 1.3 1.3 West Bank 0.1 0.1 0.1 Yemen 2.1 2.1 2.1 Middle East and North Africa - Total 4,198.4 4,198.4 49.8 2,475.6 1,668.2 4.8 South Asia Afghanistan 47.7 47.7 47.7 Bangladesh 69.8 69.8 1.6 68.2 India 2,109.0 2,109.0 20.7 2,079.7 8.6 Nepal 0.2 0.2 0.2 Pakistan 233.0 233.0 88.3 144.8 Sri Lanka 14.1 7.2 7.2 6.8 0.2 6.6 South Asia - Total 2,473.8 7.2 7.2 2,466.6 22.3 2,168.2 276.1 Western Hemisphere Andean Development Corp. 3.1 3.1 3.1 Antigua and Barbuda 1.6 0.9 0.9 0.7 0.7 Argentina 227.5 227.5 133.9 16.7 76.9 Bahamas, The 14.2 14.2 9.7 0.6 3.9 Barbados 1.3 1.3 1.3 Belize 21.0 21.0 12.2 8.8 Bermuda 0.4 0.4 0.4 Bolivia 57.9 57.9 2.4 55.4 Brazil 1,532.6 1,532.6 3.0 1,019.7 236.4 273.5 CABEI 39.6 39.6 39.6 Canada 1,931.9 1,931.9 1,931.9 Caribbean Development Bank 23.7 23.7 23.7 Cayman Islands 75.5 75.5 75.5 Chile 1,095.8 1,095.8 894.2 201.6 Colombia 806.2 806.2 97.4 638.3 70.5 Costa Rica 184.5 0.4 0.4 184.1 0.0 25.8 144.6 13.6

0.0 denotes values too small to appear when rounded to first decimal place. Source: U.S. Department of Treasury
Individual values may not sum to totals due to independent rounding. Foreign Credit Reporting System
61
Table A7 U.S. Government Foreign Credit Exposure on Loans, Guarantees and Insurance Contracts
to Private Obligors as of 12/31/2007 by Region and Country (in Millions of U.S. Dollars and Dollar Equivalents)
Concessional
Non-concessional
Regions, Countries, and Dependencies
Total Private Exposure
Sub-total Concessional
AID USDA Sub-Total Non-concessional
AID DOT EXIM OPIC USDA
Dominica 3.0 3.0 3.0 Dominican Republic 84.0 1.3 1.3 82.7 82.7 Ecuador 298.8 298.8 8.2 44.0 246.6 El Salvador 49.4 49.4 6.0 19.5 3.2 20.8 Grenada 22.2 22.2 2.0 20.2 Guatemala 149.6 1.6 1.6 148.1 15.0 28.4 76.8 27.9 Guyana 2.1 2.1 2.1 Haiti 18.7 18.7 2.5 16.2 Honduras 121.2 121.2 3.5 9.2 108.5 Jamaica 28.4 28.4 9.4 4.5 1.5 13.1 Mexico 1,940.1 1,940.1 1.8 63.6 1,462.4 408.7 3.6 Nicaragua 66.8 66.8 16.5 22.6 27.6 Panama 727.3 0.4 0.4 726.9 2.5 406.8 9.6 308.0 Paraguay 3.0 3.0 3.0 Peru 416.2 416.2 13.3 65.8 317.2 20.0 St. Kitts and Nevis 0.6 0.6 0.3 0.3 St. Lucia 0.0 0.0 0.0 St. Vincent and the Grenadines 0.4 0.4 0.4 Suriname 14.5 14.5 14.5 Trinidad and Tobago 116.7 116.7 12.8 103.8 Turks and Caicos Islands 5.7 5.7 1.4 4.3 Uruguay 6.2 6.2 3.3 2.9 Venezuela 455.0 455.0 106.7 345.8 2.5 Virgin Islands, British 257.6 257.6 257.6 Western Hemisphere Regional 84.5 84.5 4.5 80.0 Western Hemisphere - Total 10,888.6 70.9 69.3 1.6 10,817.7 88.1 406.4 6,395.9 2,974.9 952.5 World Total 37,780.2 90.1 71.7 18.5 37,690.1 548.8 406.4 23,814.9 10,839.9 2,080.2

0.0 denotes values too small to appear when rounded to first decimal place. Source: U.S. Department of Treasury
Individual values may not sum to totals due to independent rounding. Foreign Credit Reporting System
62
Table A8
U.S. Government Direct Loans to Private Foreign Entities Outstanding Principal Amounts as of 12/31/2007
(in Millions of U.S. Dollars and Dollar Equivalents)
Concessional
Non-concessional
AID USDA AID EXIM OPIC
USDA
Regions, Countries, and Dependencies
Total Private Loans
Sub-total Concessional
Public Law 480
Sub-Total Non-
concessional
Currency Loans to
Intermediary Financial Inst.
Investment Support
Regional Investment
Funds
Commodity Credit
Corporation
World Total 2,285.3 87.2 68.9 18.3 2,198.0 0.2 1,277.0 775.1 6.9 138.9 Africa African Regional 6.9 6.9 6.9 Angola 0.3 0.3 0.3 Botswana 1.9 1.9 1.9 Cameroon 0.7 0.7 0.7 Congo, Democratic Republic of the
0.5 0.5 0.5
Ethiopia 0.3 0.3 0.3 Gabon 1.8 1.8 1.8 Ghana 23.1 23.1 23.1 Guinea-Bissau 0.9 0.9 0.9 Kenya 3.9 3.9 3.9 Liberia 1.7 1.7 1.7 Malawi 6.5 6.5 6.5 Mali 0.8 0.8 0.8 Mauritius 0.9 0.9 0.9 Mozambique 15.4 15.4 15.4 Nigeria 4.0 4.0 1.1 2.9 Somalia 0.8 0.8 0.8 South Africa 250.1 250.1 250.1 Zambia 1.7 1.7 1.7 Africa - Total 322.2 1.4 1.4 320.8 1.1 312.8 6.9 East Asia and the Pacific Asia Regional 1.0 1.0 1.0 Hong Kong 58.6 58.6 58.6 Indonesia 613.6 9.5 9.5 604.1 540.5 3.2 60.4 Korea, Republic of 1.2 1.2 1.2 Mongolia 0.2 0.2 0.2 Papua New Guinea 71.5 71.5 71.5 Philippines 0.7 0.7 0.7

0.0 denotes values too small to appear when rounded to first decimal place. Source: U.S. Department of Treasury
Individual values may not sum to totals due to independent rounding. Foreign Credit Reporting System
63
Table A8 U.S. Government Direct Loans to Private Foreign Entities
Outstanding Principal Amounts as of 12/31/2007 (in Millions of U.S. Dollars and Dollar Equivalents)
Concessional
Non-concessional
AID USDA AID EXIM OPIC
USDA
Regions, Countries, and Dependencies
Total Private Loans
Sub-total Concessional
Public Law 480
Sub-Total Non-
concessional
Currency Loans to
Intermediary Financial Inst.
Investment Support
Regional Investment
Funds
Commodity Credit
Corporation
Thailand 2.9 2.9 1.4 1.5 East Asia and the Pacific - Total 749.8 9.5 9.5 740.2 600.5 79.3 60.4 Europe Armenia 13.6 13.6 13.6 Azerbaijan 8.9 8.9 8.9 Bosnia and Herzegovina 2.0 2.0 2.0 Georgia 20.9 20.9 20.9 Moldova 2.5 2.5 2.5 Poland 0.5 0.5 0.5 Romania 3.8 3.8 3.8 Russia 55.3 55.3 55.3 Turkey 37.6 37.6 25.0 12.6 Ukraine 31.9 31.9 31.9 Uzbekistan 1.3 1.3 1.3 Yugoslavia (Former) 5.0 5.0 5.0 Europe - Total 183.2 183.2 25.0 158.2 Intl Orgs or Not Specified Worldwide Unspecified 51.0 51.0 51.0 Intl Orgs or Not Specified - Total
51.0 51.0 51.0
Middle East and North Africa Iraq 26.6 26.6 26.6 Morocco 102.9 102.9 102.9 Middle East and North Africa - Total
129.5 129.5 102.9 26.6
South Asia Afghanistan 24.6 24.6 24.6 India 2.1 2.1 2.1 Pakistan 11.8 11.8 11.8 Sri Lanka 7.2 7.2 7.2

0.0 denotes values too small to appear when rounded to first decimal place. Source: U.S. Department of Treasury
Individual values may not sum to totals due to independent rounding. Foreign Credit Reporting System
64
Table A8 U.S. Government Direct Loans to Private Foreign Entities
Outstanding Principal Amounts as of 12/31/2007 (in Millions of U.S. Dollars and Dollar Equivalents)
Concessional
Non-concessional
AID USDA AID EXIM OPIC
USDA
Regions, Countries, and Dependencies
Total Private Loans
Sub-total Concessional
Public Law 480
Sub-Total Non-
concessional
Currency Loans to
Intermediary Financial Inst.
Investment Support
Regional Investment
Funds
Commodity Credit
Corporation
South Asia - Total 45.7 7.2 7.2 38.5 2.1 36.3 Western Hemisphere Andean Development Corp. 3.1 3.1 3.1 Antigua and Barbuda 0.2 0.2 0.2 Argentina 130.0 130.0 52.0 1.2 76.9 Belize 8.8 8.8 8.8 Bolivia 0.2 0.2 0.2 Brazil 341.0 341.0 328.2 12.8 CABEI 39.6 39.6 39.6 Caribbean Development Bank 22.6 22.6 22.6 Chile 1.6 1.6 1.6 Colombia 62.9 62.9 44.0 18.9 Costa Rica 28.9 0.4 0.4 28.5 0.0 28.4 Dominican Republic 1.3 1.3 1.3 Ecuador 42.7 42.7 42.2 0.4 Guatemala 6.1 1.6 1.6 4.5 4.5 Honduras 3.6 3.6 3.6 Jamaica 0.1 0.1 0.1 Mexico 22.1 22.1 21.8 0.4 Nicaragua 5.1 5.1 5.1 Panama 0.4 0.4 0.4 Peru 2.2 2.2 0.9 1.3 St. Kitts and Nevis 0.3 0.3 0.3 Uruguay 0.4 0.4 0.4 Venezuela 80.9 80.9 78.9 1.9 Western Hemisphere - Total 803.9 69.1 67.5 1.6 734.8 0.2 545.3 110.8 78.5 World Total 2,285.3 87.2 68.9 18.3 2,198.0 0.2 1,277.0 775.1 6.9 138.9

0.0 denotes values too small to appear when rounded to first decimal place. Source: U.S. Department of Treasury
Individual values may not sum to totals due to independent rounding. Foreign Credit Reporting System
65
Table A9
U.S. Government Loan Guarantees to Private Foreign Entities As of 12/31/2007
(in Millions of U.S. Dollar Equivalents)
Total
DOT
EXIM
OPIC
USDA
AID
Regions, Countries and Dependencies
Principal and Claims
Outstanding
Principal Outstanding
Claims Outstanding
Principal Outstanding
Claims Outstanding
Principal Outstanding
Claims Outstanding
Principal Outstanding
Claims Outstanding
Principal Outstanding
Claims Outstanding
Principal Outstanding
Claims Outstanding
World Total 25,332.4 24,556.3 776.2 406.4 17,758.5 739.4 4,457.9 1,714.9 36.8 218.6 Africa African Regional 228.2 228.2 70.1 158.0 0.1 Botswana 7.4 7.4 7.4 Burkina Faso 1.8 1.8 1.8 Cameroon 7.6 0.5 7.1 0.5 7.1 Cape Verde 0.3 0.3 0.3 Congo, Democratic Republic of the 0.0 0.0 0.0 Cote d’Ivoire 1.0 1.0 1.0 Ethiopia 5.3 5.3 5.3 Gabon 0.0 0.0 0.0 Ghana 49.0 14.7 34.4 1.0 34.4 11.2 2.4 Kenya 463.8 463.8 462.5 1.4 Liberia 1.4 1.4 1.4 Mali 11.8 1.2 10.7 10.7 1.2 Mozambique 0.0 0.0 0.0 Nigeria 447.4 440.0 7.4 114.7 7.4 325.0 0.3 Rwanda 0.7 0.7 0.7 Senegal 9.5 9.5 9.5 South Africa 15.7 15.7 8.7 7.0 Tanzania 18.3 18.3 18.3 Uganda 15.2 10.2 5.0 5.0 4.2 6.0 Zambia 2.2 2.2 2.2 Africa - Total 1,286.7 1,208.5 78.2 649.1 78.2 532.9 26.5 East Asia and the Pacific Asia Regional 93.0 93.0 93.0 Australia 929.9 929.9 929.9 Fiji 36.2 36.2 36.2 Hong Kong 166.4 166.4 162.7 3.7 Indonesia 293.6 159.6 134.0 44.5 134.0 107.7 7.4 Japan 85.2 85.2 85.2 Korea, Dem. Peoples Rep. of 0.8 0.8 0.8 Korea, Republic of 2,333.8 2,333.8 2,275.7 58.1 Malaysia 176.3 173.0 3.2 173.0 3.2 Philippines 408.3 329.0 79.2 251.6 79.2 1.6 75.9 0.0 Singapore 5.9 5.9 5.9 Taiwan 1,092.9 1,092.9 1,092.9 Thailand 112.6 110.7 2.0 110.7 2.0 Vietnam 3.6 3.6 3.6 East Asia and the Pacific - Total 5,738.6 5,513.4 225.2 5,162.4 225.2 202.3 137.8 10.9 Europe Albania 1.7 1.7 1.7 Armenia 0.5 0.5 0.5 Austria 431.2 431.2 431.2 Bosnia and Herzegovina 17.4 15.4 2.0 2.0 15.4 Bulgaria 44.8 43.7 1.1 0.3 1.1 18.4 25.0 Central Europe Regional 22.5 22.5 22.5 Croatia 254.5 254.5 250.0 4.5 Cyprus 0.2 0.2 0.2

0.0 denotes values too small to appear when rounded to first decimal place. Source: U.S. Department of Treasury
Individual values may not sum to totals due to independent rounding. Foreign Credit Reporting System
66
Table A9 U.S. Government Loan Guarantees to Private Foreign Entities
As of 12/31/2007 (in Millions of U.S. Dollar Equivalents)
Total
DOT
EXIM
OPIC
USDA
AID
Regions, Countries and Dependencies
Principal and Claims
Outstanding
Principal Outstanding
Claims Outstanding
Principal Outstanding
Claims Outstanding
Principal Outstanding
Claims Outstanding
Principal Outstanding
Claims Outstanding
Principal Outstanding
Claims Outstanding
Principal Outstanding
Claims Outstanding
Georgia 15.2 15.2 14.8 0.5 Germany 156.9 156.9 156.9 Hungary 0.3 0.3 0.3 Ireland 2,017.2 2,017.2 2,017.2 Kazakhstan 412.1 412.1 219.0 142.5 50.6 Kyrgyzstan 0.0 0.0 0.0 Lithuania 5.1 5.1 5.1 Luxembourg 151.0 151.0 151.0 Moldova 14.7 14.7 9.2 5.5 Netherlands 517.7 517.7 517.7 Newly Independent States-FSU Reg. 43.2 43.2 43.2 Romania 30.7 30.7 29.5 1.2 Russia 906.2 890.1 16.1 92.1 12.0 543.0 254.7 4.1 0.3 Serbia and Montenegro 5.7 5.7 5.7 Spain 0.3 0.3 0.3 Turkey 1,826.2 1,776.2 50.0 869.7 50.0 449.0 457.6 Ukraine 102.9 102.9 56.8 7.7 38.0 0.3 Yugoslavia (Former) 6.5 6.5 6.5 Europe - Total 6,984.5 6,908.5 76.0 4,546.8 71.9 1,500.3 802.1 4.1 59.3 Intl Orgs or Not Specified Worldwide Unspecified 308.4 308.4 85.5 185.0 37.8 Intl Orgs or Not Specified - Total 308.4 308.4 85.5 185.0 37.8 Middle East and North Africa Algeria 196.1 196.1 196.1 Bahrain 1.9 1.9 1.9 Egypt 159.3 148.4 10.9 147.2 10.9 1.2 Gaza Strip 0.4 0.4 0.4 Iraq 55.3 55.3 55.3 Israel 465.5 465.5 242.7 222.8 Jordan 90.5 88.5 2.0 52.9 2.0 33.8 1.8 Lebanon 144.8 144.8 4.0 138.0 2.7 Morocco 49.3 49.3 0.0 0.0 32.2 17.0 Oman 53.7 53.7 53.7 Qatar 504.9 504.9 504.9 Saudi Arabia 149.9 147.5 2.4 147.5 2.4 Tunisia 3.4 3.0 0.4 0.3 0.4 2.7 Yemen 2.1 2.1 2.1 Middle East and North Africa - Total
1,877.1 1,857.4 19.7 1,153.4 17.6 680.9 2.7 2.1 20.4
South Asia Bangladesh 51.2 51.2 51.1 0.2 India 1,969.8 1,943.1 26.6 1,903.5 26.6 7.1 32.5 Pakistan 120.4 120.4 71.5 48.9 Sri Lanka 5.5 5.5 5.5 South Asia - Total 2,146.9 2,120.3 26.6 1,975.0 26.6 112.6 32.7 Western Hemisphere Argentina 73.9 2.8 71.1 71.1 2.8 Bahamas, The 13.6 13.6 9.7 3.9 Barbados 0.3 0.3 0.3

0.0 denotes values too small to appear when rounded to first decimal place. Source: U.S. Department of Treasury
Individual values may not sum to totals due to independent rounding. Foreign Credit Reporting System
67
Table A9 U.S. Government Loan Guarantees to Private Foreign Entities
As of 12/31/2007 (in Millions of U.S. Dollar Equivalents)
Total
DOT
EXIM
OPIC
USDA
AID
Regions, Countries and Dependencies
Principal and Claims
Outstanding
Principal Outstanding
Claims Outstanding
Principal Outstanding
Claims Outstanding
Principal Outstanding
Claims Outstanding
Principal Outstanding
Claims Outstanding
Principal Outstanding
Claims Outstanding
Principal Outstanding
Claims Outstanding
Belize 6.0 5.5 0.4 5.5 0.4 Bolivia 1.4 1.4 1.4 Brazil 809.8 739.3 70.5 404.2 61.6 90.4 244.6 9.0 Canada 1,821.6 1,821.6 1,821.6 Cayman Islands 75.5 75.5 75.5 Chile 1,087.5 1,082.3 5.2 882.3 5.2 200.0 Colombia 418.9 409.6 9.3 7.2 8.9 332.3 70.1 0.4 Costa Rica 42.7 39.3 3.4 5.3 3.4 20.4 13.6 Dominican Republic 28.5 4.3 24.1 4.3 24.1 Ecuador 84.0 82.8 1.2 1.2 77.6 5.2 El Salvador 26.5 24.8 1.6 0.1 1.6 2.1 19.5 3.1 Grenada 1.5 1.5 1.5 Guatemala 82.6 78.0 4.5 5.2 4.5 45.0 27.9 Haiti 0.9 0.9 0.9 Honduras 87.7 87.0 0.7 0.3 0.7 85.3 1.4 Jamaica 18.6 18.5 0.0 0.0 13.1 5.5 Mexico 867.3 764.0 103.3 63.6 610.5 103.3 86.8 3.2 Nicaragua 16.6 10.0 6.6 1.0 6.6 9.0 Panama 688.9 688.1 0.8 398.9 0.8 289.1 0.1 Peru 82.7 68.1 14.7 30.1 10.5 21.0 14.5 4.2 2.5 Suriname 14.5 14.5 14.5 Trinidad and Tobago 76.7 73.1 3.6 0.3 3.6 72.8 Uruguay 0.2 0.2 0.2 Venezuela 287.7 274.4 13.3 9.3 10.8 265.1 2.5 Virgin Islands, British 257.6 257.6 257.6 Western Hemisphere Regional 16.7 16.7 15.0 1.7 Western Hemisphere - Total 6,990.2 6,639.8 350.5 406.4 4,186.3 319.9 1,243.9 772.3 30.6 30.9 World Total 25,332.4 24,556.3 776.2 406.4 17,758.5 739.4 4,457.9 1,714.9 36.8 218.6
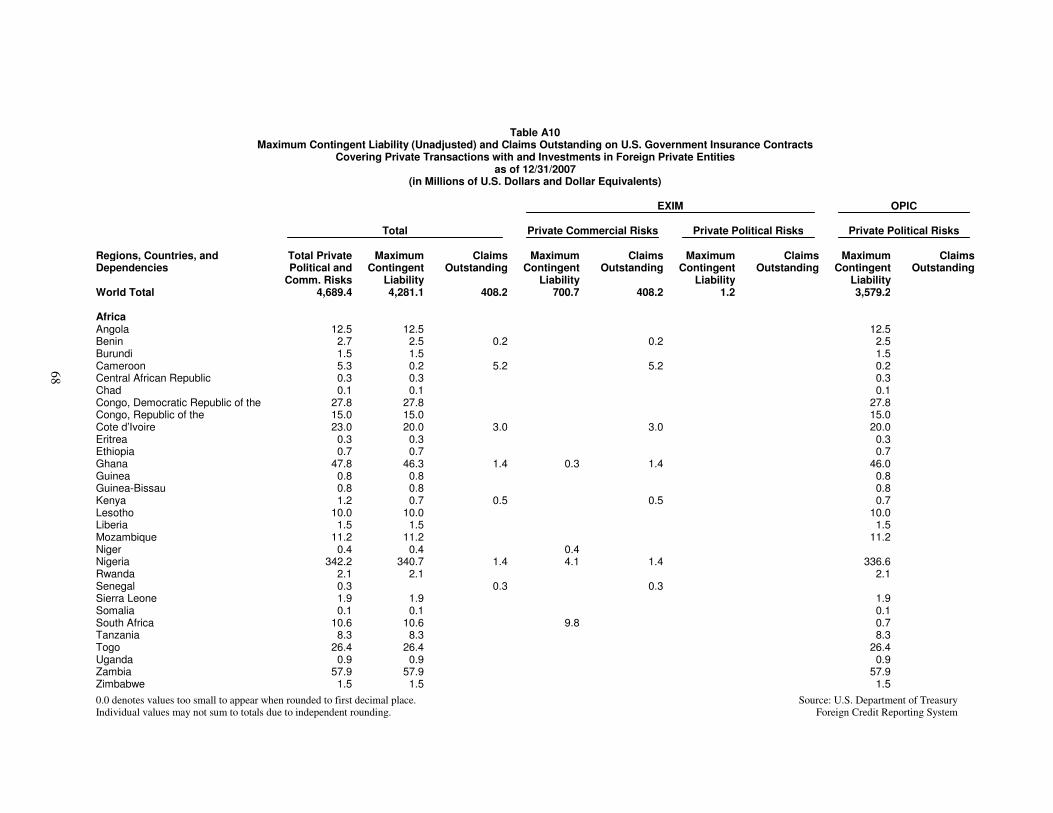
0.0 denotes values too small to appear when rounded to first decimal place. Source: U.S. Department of Treasury
Individual values may not sum to totals due to independent rounding. Foreign Credit Reporting System
68
Table A10 Maximum Contingent Liability (Unadjusted) and Claims Outstanding on U.S. Government Insurance Contracts
Covering Private Transactions with and Investments in Foreign Private Entities as of 12/31/2007
(in Millions of U.S. Dollars and Dollar Equivalents)
EXIM
OPIC
Total
Private Commercial Risks
Private Political Risks
Private Political Risks
Regions, Countries, and Dependencies
Total Private Political and
Comm. Risks
Maximum Contingent
Liability
Claims Outstanding
Maximum Contingent
Liability
Claims Outstanding
Maximum Contingent
Liability
Claims Outstanding
Maximum Contingent
Liability
Claims Outstanding
World Total 4,689.4 4,281.1 408.2 700.7 408.2 1.2 3,579.2 Africa Angola 12.5 12.5 12.5 Benin 2.7 2.5 0.2 0.2 2.5 Burundi 1.5 1.5 1.5 Cameroon 5.3 0.2 5.2 5.2 0.2 Central African Republic 0.3 0.3 0.3 Chad 0.1 0.1 0.1 Congo, Democratic Republic of the 27.8 27.8 27.8 Congo, Republic of the 15.0 15.0 15.0 Cote d’Ivoire 23.0 20.0 3.0 3.0 20.0 Eritrea 0.3 0.3 0.3 Ethiopia 0.7 0.7 0.7 Ghana 47.8 46.3 1.4 0.3 1.4 46.0 Guinea 0.8 0.8 0.8 Guinea-Bissau 0.8 0.8 0.8 Kenya 1.2 0.7 0.5 0.5 0.7 Lesotho 10.0 10.0 10.0 Liberia 1.5 1.5 1.5 Mozambique 11.2 11.2 11.2 Niger 0.4 0.4 0.4 Nigeria 342.2 340.7 1.4 4.1 1.4 336.6 Rwanda 2.1 2.1 2.1 Senegal 0.3 0.3 0.3 Sierra Leone 1.9 1.9 1.9 Somalia 0.1 0.1 0.1 South Africa 10.6 10.6 9.8 0.7 Tanzania 8.3 8.3 8.3 Togo 26.4 26.4 26.4 Uganda 0.9 0.9 0.9 Zambia 57.9 57.9 57.9 Zimbabwe 1.5 1.5 1.5

0.0 denotes values too small to appear when rounded to first decimal place. Source: U.S. Department of Treasury
Individual values may not sum to totals due to independent rounding. Foreign Credit Reporting System
69
Table A10 Maximum Contingent Liability (Unadjusted) and Claims Outstanding on U.S. Government Insurance Contracts
Covering Private Transactions with and Investments in Foreign Private Entities as of 12/31/2007
(in Millions of U.S. Dollars and Dollar Equivalents)
EXIM
OPIC
Total
Private Commercial Risks
Private Political Risks
Private Political Risks
Regions, Countries, and Dependencies
Total Private Political and
Comm. Risks
Maximum Contingent
Liability
Claims Outstanding
Maximum Contingent
Liability
Claims Outstanding
Maximum Contingent
Liability
Claims Outstanding
Maximum Contingent
Liability
Claims Outstanding
Africa - Total 615.2 603.2 12.0 14.6 12.0 588.6 East Asia and the Pacific Asia Regional 0.2 0.2 0.2 Cambodia 0.1 0.1 0.1 China 0.5 0.5 0.5 Fiji 0.0 0.0 0.0 Indonesia 270.6 269.1 1.5 0.0 1.5 269.0 Korea, Republic of 0.3 0.3 0.3 Mongolia 0.1 0.1 0.1 Philippines 502.0 465.9 36.0 2.7 36.0 463.2 Taiwan 0.6 0.6 0.6 Thailand 3.2 3.2 1.1 2.1 Vietnam 35.6 35.6 35.6 East Asia and the Pacific - Total 813.1 775.0 38.2 4.3 38.2 770.6 Europe Armenia 5.0 5.0 5.0 Azerbaijan 161.2 161.2 18.9 142.3 Bosnia and Herzegovina 0.4 0.4 0.4 Bulgaria 9.1 9.1 9.1 Croatia 0.5 0.5 0.5 Cyprus 11.4 11.4 11.4 Georgia 1.0 1.0 1.0 Hungary 0.0 0.0 0.0 Kazakhstan 11.4 6.7 4.8 6.7 4.8 Kyrgyzstan 30.7 30.7 30.7 Lithuania 1.9 0.9 1.0 0.9 1.0 Romania 5.1 5.1 0.1 5.0 Russia 240.5 229.6 10.9 72.9 10.9 156.6 Serbia and Montenegro 11.8 11.8 11.8 Switzerland 1.1 1.1 1.1 Tajikistan 0.1 0.1 0.1 Turkey 112.7 104.2 8.5 27.0 8.5 77.2 Ukraine 22.8 22.8 3.4 19.3

0.0 denotes values too small to appear when rounded to first decimal place. Source: U.S. Department of Treasury
Individual values may not sum to totals due to independent rounding. Foreign Credit Reporting System
70
Table A10 Maximum Contingent Liability (Unadjusted) and Claims Outstanding on U.S. Government Insurance Contracts
Covering Private Transactions with and Investments in Foreign Private Entities as of 12/31/2007
(in Millions of U.S. Dollars and Dollar Equivalents)
EXIM
OPIC
Total
Private Commercial Risks
Private Political Risks
Private Political Risks
Regions, Countries, and Dependencies
Total Private Political and
Comm. Risks
Maximum Contingent
Liability
Claims Outstanding
Maximum Contingent
Liability
Claims Outstanding
Maximum Contingent
Liability
Claims Outstanding
Maximum Contingent
Liability
Claims Outstanding
United Kingdom 6.8 6.8 6.8 Uzbekistan 2.7 2.7 2.7 Yugoslavia (Former) 1.1 1.0 0.1 0.1 1.0 Europe - Total 637.1 611.8 25.3 158.2 25.3 453.6 Middle East and North Africa Egypt 304.2 300.4 3.7 0.4 3.7 300.0 Gaza Strip 48.2 48.2 48.2 Iraq 21.7 21.7 21.7 Israel 6.2 5.7 0.5 4.5 0.5 1.2 Jordan 0.1 0.1 0.1 Kuwait 201.3 201.3 1.3 200.0 Lebanon 44.1 44.1 44.1 Saudi Arabia 4.7 1.2 3.4 1.2 3.4 Tunisia 10.1 10.1 10.1 United Arab Emirates 1.3 1.3 1.3 West Bank 0.1 0.1 0.1 Middle East and North Africa - Total
641.8 634.1 7.7 8.7 7.7 1.2 624.2
South Asia Afghanistan 22.0 22.0 22.0 Bangladesh 0.5 0.5 0.5 India 11.3 9.5 1.8 8.1 1.8 1.4 Nepal 0.2 0.2 0.2 Pakistan 58.5 58.5 58.5 Sri Lanka 0.5 0.5 0.2 0.3 South Asia - Total 93.0 91.2 1.8 8.3 1.8 82.8 Western Hemisphere Antigua and Barbuda 0.7 0.7 0.7 Argentina 23.5 20.7 2.9 8.0 2.9 12.7 Bahamas, The 0.6 0.6 0.6 Barbados 1.0 1.0 1.0 Belize 0.0 0.0 0.0
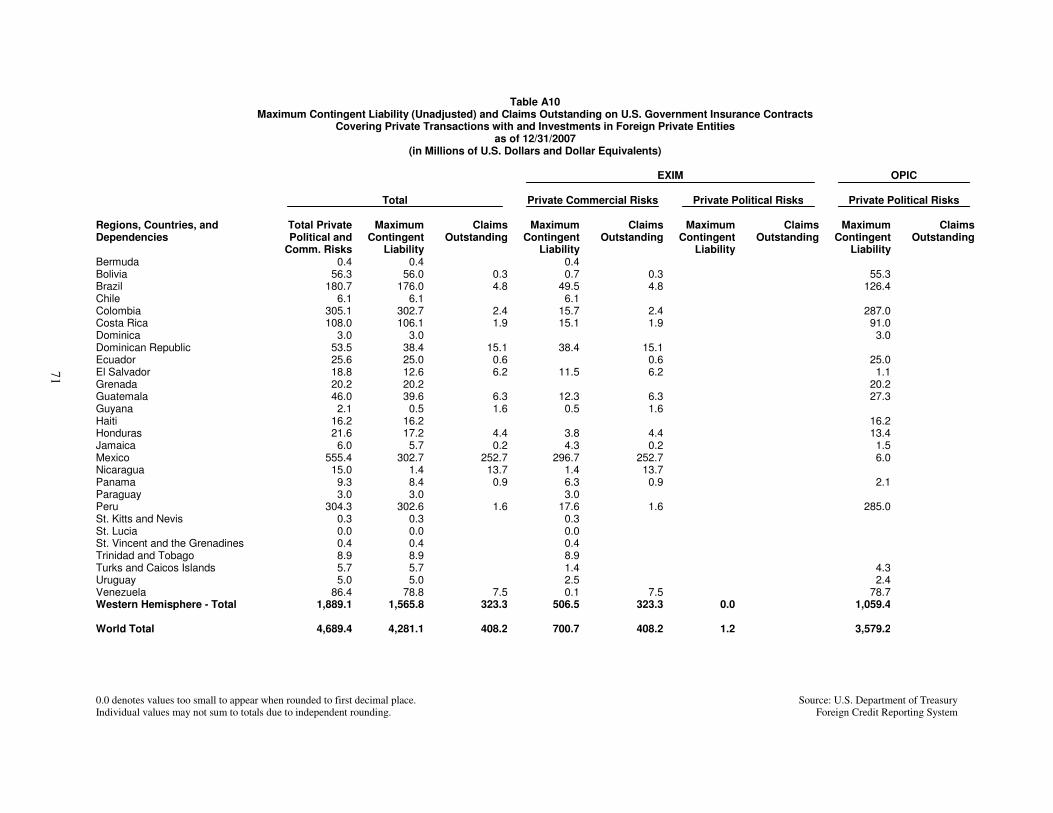
0.0 denotes values too small to appear when rounded to first decimal place. Source: U.S. Department of Treasury
Individual values may not sum to totals due to independent rounding. Foreign Credit Reporting System
71
Table A10 Maximum Contingent Liability (Unadjusted) and Claims Outstanding on U.S. Government Insurance Contracts
Covering Private Transactions with and Investments in Foreign Private Entities as of 12/31/2007
(in Millions of U.S. Dollars and Dollar Equivalents)
EXIM
OPIC
Total
Private Commercial Risks
Private Political Risks
Private Political Risks
Regions, Countries, and Dependencies
Total Private Political and
Comm. Risks
Maximum Contingent
Liability
Claims Outstanding
Maximum Contingent
Liability
Claims Outstanding
Maximum Contingent
Liability
Claims Outstanding
Maximum Contingent
Liability
Claims Outstanding
Bermuda 0.4 0.4 0.4 Bolivia 56.3 56.0 0.3 0.7 0.3 55.3 Brazil 180.7 176.0 4.8 49.5 4.8 126.4 Chile 6.1 6.1 6.1 Colombia 305.1 302.7 2.4 15.7 2.4 287.0 Costa Rica 108.0 106.1 1.9 15.1 1.9 91.0 Dominica 3.0 3.0 3.0 Dominican Republic 53.5 38.4 15.1 38.4 15.1 Ecuador 25.6 25.0 0.6 0.6 25.0 El Salvador 18.8 12.6 6.2 11.5 6.2 1.1 Grenada 20.2 20.2 20.2 Guatemala 46.0 39.6 6.3 12.3 6.3 27.3 Guyana 2.1 0.5 1.6 0.5 1.6 Haiti 16.2 16.2 16.2 Honduras 21.6 17.2 4.4 3.8 4.4 13.4 Jamaica 6.0 5.7 0.2 4.3 0.2 1.5 Mexico 555.4 302.7 252.7 296.7 252.7 6.0 Nicaragua 15.0 1.4 13.7 1.4 13.7 Panama 9.3 8.4 0.9 6.3 0.9 2.1 Paraguay 3.0 3.0 3.0 Peru 304.3 302.6 1.6 17.6 1.6 285.0 St. Kitts and Nevis 0.3 0.3 0.3 St. Lucia 0.0 0.0 0.0 St. Vincent and the Grenadines 0.4 0.4 0.4 Trinidad and Tobago 8.9 8.9 8.9 Turks and Caicos Islands 5.7 5.7 1.4 4.3 Uruguay 5.0 5.0 2.5 2.4 Venezuela 86.4 78.8 7.5 0.1 7.5 78.7 Western Hemisphere - Total 1,889.1 1,565.8 323.3 506.5 323.3 0.0 1,059.4 World Total 4,689.4 4,281.1 408.2 700.7 408.2 1.2 3,579.2

0.0 denotes values too small to appear when rounded to first decimal place. Source: U.S. Department of Treasury
Individual values may not sum to totals due to independent rounding. Foreign Credit Reporting System
72
Table A11
Short-Term Insurance and Guarantees as of 12/31/2007 (Original Maturities of One Year or Less)
(In Millions of U.S. Dollars)
EXIM USDA
Export-Import Bank Insurance Commodity Credit Corporation
Total Official Obligor Private Obligor Official Obligor Private Obligor
Regions, Countries, and Dependencies
Maximum Contingent
Liability and Guarantees
Outstanding Claims
Outstanding
Maximum Contingent
Liability and Guarantees
Outstanding Claims
Outstanding
Maximum Contingent
Liability and Guarantees
Outstanding Claims
Outstanding
Guarantees Outstanding
Amount Claims
Outstanding
Guarantees Outstanding
Amount Claims
Outstanding World Total 1,407.0 329.2 1,369.4 153.3 37.6 175.9 Africa Benin 0.0 0.0 0.0 0.0 Burkina Faso 0.2 0.2 Cameroon 2.3 2.2 2.3 2.2 Cape Verde 0.0 0.0 Chad 0.1 0.1 Congo, Republic of the 0.0 0.0 Cote d’Ivoire 0.2 0.2 Equatorial Guinea 0.1 0.1 Ethiopia 0.0 0.0 Gabon 0.0 0.0 Ghana 5.6 3.9 5.6 2.6 1.3 Kenya 0.2 0.2 Mali 0.3 0.3 Mauritania 0.2 0.2 0.2 0.2 Mauritius 0.1 0.1 Mozambique 0.1 0.1 Niger 0.0 0.0 0.0 0.0 Nigeria 24.9 15.4 24.9 12.6 2.8 Reunion 0.0 0.0 Senegal 0.0 0.0 0.0 0.0 South Africa 5.1 5.1 St. Helena 0.0 0.0 Swaziland 0.0 0.0 Tanzania 2.1 2.1 Uganda 0.0 12.2 0.0 0.0 12.1 Zambia 0.1 0.1 Africa - Total 41.7 33.9 41.7 17.7 16.2 East Asia and the Pacific Australia 29.6 0.4 29.6 0.4 Brunei 0.0 0.0

0.0 denotes values too small to appear when rounded to first decimal place. Source: U.S. Department of Treasury
Individual values may not sum to totals due to independent rounding. Foreign Credit Reporting System
73
Table A11 Short-Term Insurance and Guarantees as of 12/31/2007
(Original Maturities of One Year or Less) (In Millions of U.S. Dollars)
EXIM USDA
Export-Import Bank Insurance Commodity Credit Corporation
Total Official Obligor Private Obligor Official Obligor Private Obligor
Regions, Countries, and Dependencies
Maximum Contingent
Liability and Guarantees
Outstanding Claims
Outstanding
Maximum Contingent
Liability and Guarantees
Outstanding Claims
Outstanding
Maximum Contingent
Liability and Guarantees
Outstanding Claims
Outstanding
Guarantees Outstanding
Amount Claims
Outstanding
Guarantees Outstanding
Amount Claims
Outstanding China 16.0 0.7 16.0 0.2 0.4 Cook Islands 0.0 0.0 Fiji 0.2 0.2 French Polynesia 0.0 0.0 Hong Kong 9.3 0.2 9.3 0.1 0.1 Indonesia 0.9 12.9 0.9 12.9 Japan 14.3 0.1 14.3 0.1 Korea, Republic of 27.5 1.4 15.5 0.5 12.0 0.9 Malaysia 6.3 6.3 Micronesia, Federated States of 0.1 0.0 0.1 0.0 Mongolia 0.0 0.0 New Caledonia 0.0 0.0 New Zealand 6.5 6.5 Papua New Guinea 0.5 0.5 Philippines 30.0 3.1 7.5 1.8 22.4 1.3 Singapore 8.7 0.0 8.7 0.0 Taiwan 14.2 0.0 14.2 0.0 Thailand 4.8 5.3 4.8 5.3 Tuvalu 0.0 0.0 Vietnam 3.0 3.0 East Asia and the Pacific - Total 171.9 24.2 137.4 3.2 34.5 21.0 Europe Austria 1.1 0.1 1.1 0.1 Belgium 9.1 0.0 9.1 0.0 Bosnia and Herzegovina 0.0 0.0 Bulgaria 0.1 0.6 0.1 0.6 Croatia 0.3 0.3 Cyprus 1.5 1.5 Czech Republic 1.5 1.5 Denmark 3.8 0.1 3.8 0.1 Estonia 0.8 0.8 Finland 2.8 2.8 France 9.9 0.1 9.9 0.1 Georgia 0.1 0.1

0.0 denotes values too small to appear when rounded to first decimal place. Source: U.S. Department of Treasury
Individual values may not sum to totals due to independent rounding. Foreign Credit Reporting System
74
Table A11 Short-Term Insurance and Guarantees as of 12/31/2007
(Original Maturities of One Year or Less) (In Millions of U.S. Dollars)
EXIM USDA
Export-Import Bank Insurance Commodity Credit Corporation
Total Official Obligor Private Obligor Official Obligor Private Obligor
Regions, Countries, and Dependencies
Maximum Contingent
Liability and Guarantees
Outstanding Claims
Outstanding
Maximum Contingent
Liability and Guarantees
Outstanding Claims
Outstanding
Maximum Contingent
Liability and Guarantees
Outstanding Claims
Outstanding
Guarantees Outstanding
Amount Claims
Outstanding
Guarantees Outstanding
Amount Claims
Outstanding Germany 24.3 0.8 24.3 0.8 Greece 3.5 3.5 Hungary 1.0 1.0 Iceland 1.7 1.7 Ireland 7.8 0.1 7.8 0.1 Italy 17.3 0.4 17.3 0.4 Kazakhstan 70.8 70.8 Latvia 0.4 0.4 Liechtenstein 0.0 0.0 Lithuania 1.1 0.1 1.1 0.1 Luxembourg 0.3 0.3 Macedonia, Former Yugoslav Rep. of 0.0 0.0 Malta 0.1 0.1 Monaco 0.0 0.0 Netherlands 10.4 0.0 10.4 0.0 Norway 2.9 2.9 Poland 2.7 2.7 Portugal 1.3 0.2 1.3 0.2 Romania 1.2 0.0 1.2 0.0 Russia 151.0 17.7 151.0 7.5 10.2 Slovakia 0.2 0.2 Slovenia 0.1 0.1 Spain 16.6 0.1 16.6 0.1 Sweden 4.9 4.9 Switzerland 16.9 0.1 16.9 0.1 Turkey 7.2 3.6 7.2 1.3 2.3 Ukraine 8.3 8.3 United Kingdom 49.9 0.4 49.9 0.4 Yugoslavia (Former) 0.2 0.2 Europe - Total 433.0 24.3 433.0 11.1 0.1 13.2 Middle East and North Africa Algeria 1.6 1.6 Bahrain 1.9 0.4 1.9 0.4 Egypt 5.8 4.6 5.8 3.5 1.1

0.0 denotes values too small to appear when rounded to first decimal place. Source: U.S. Department of Treasury
Individual values may not sum to totals due to independent rounding. Foreign Credit Reporting System
75
Table A11 Short-Term Insurance and Guarantees as of 12/31/2007
(Original Maturities of One Year or Less) (In Millions of U.S. Dollars)
EXIM USDA
Export-Import Bank Insurance Commodity Credit Corporation
Total Official Obligor Private Obligor Official Obligor Private Obligor
Regions, Countries, and Dependencies
Maximum Contingent
Liability and Guarantees
Outstanding Claims
Outstanding
Maximum Contingent
Liability and Guarantees
Outstanding Claims
Outstanding
Maximum Contingent
Liability and Guarantees
Outstanding Claims
Outstanding
Guarantees Outstanding
Amount Claims
Outstanding
Guarantees Outstanding
Amount Claims
Outstanding Israel 8.2 0.1 8.2 0.1 Jordan 1.3 0.0 1.3 0.0 Kuwait 48.8 48.8 Lebanon 0.6 0.6 Morocco 6.4 6.4 Oman 0.7 0.7 Qatar 1.3 1.3 Saudi Arabia 14.7 1.9 14.7 1.9 Tunisia 0.1 0.1 United Arab Emirates 15.3 0.0 15.3 0.0 Yemen 0.1 0.1 Middle East and North Africa - Total 106.9 7.1 106.9 5.9 1.1 South Asia Bangladesh 0.5 0.5 India 8.2 2.3 8.2 1.4 0.0 0.9 Pakistan 0.2 0.2 Sri Lanka 0.3 0.0 0.3 0.0 South Asia - Total 9.2 2.3 9.2 1.4 0.0 0.9 Western Hemisphere Anguilla 0.1 0.1 Antigua and Barbuda 0.5 0.5 Argentina 9.8 8.2 9.8 8.2 Aruba 1.1 1.1 Bahamas, The 3.6 0.5 3.6 0.5 Barbados 0.5 0.5 Belize 1.2 0.3 1.2 0.3 Bermuda 0.4 0.4 Bolivia 0.6 0.6 0.6 0.6 Brazil 47.3 23.8 47.3 23.8 Canada 62.8 1.0 62.8 1.0 Cayman Islands 1.4 0.2 1.4 0.2 Chile 8.4 0.8 8.4 0.8 Colombia 20.2 1.8 20.2 1.8

0.0 denotes values too small to appear when rounded to first decimal place. Source: U.S. Department of Treasury
Individual values may not sum to totals due to independent rounding. Foreign Credit Reporting System
76
Table A11 Short-Term Insurance and Guarantees as of 12/31/2007
(Original Maturities of One Year or Less) (In Millions of U.S. Dollars)
EXIM USDA
Export-Import Bank Insurance Commodity Credit Corporation
Total Official Obligor Private Obligor Official Obligor Private Obligor
Regions, Countries, and Dependencies
Maximum Contingent
Liability and Guarantees
Outstanding Claims
Outstanding
Maximum Contingent
Liability and Guarantees
Outstanding Claims
Outstanding
Maximum Contingent
Liability and Guarantees
Outstanding Claims
Outstanding
Guarantees Outstanding
Amount Claims
Outstanding
Guarantees Outstanding
Amount Claims
Outstanding Costa Rica 15.5 0.4 15.5 0.4 Dominica 0.0 0.0 Dominican Republic 36.4 1.8 36.4 1.8 Ecuador 0.6 0.6 0.6 0.6 El Salvador 8.2 1.5 8.2 1.3 0.2 French Guiana 0.0 0.0 Grenada 0.0 0.0 Guatemala 19.2 2.7 18.3 2.0 0.9 0.7 Guyana 1.1 0.0 1.1 0.0 Honduras 10.5 1.5 10.5 1.5 Jamaica 8.3 1.5 6.2 0.3 2.1 1.2 Mexico 337.4 181.3 337.4 60.0 121.3 Montserrat 0.0 0.0 Netherlands Antilles 1.6 1.6 Nicaragua 11.4 4.4 11.4 4.4 Panama 9.3 0.5 9.3 0.5 Paraguay 3.4 0.0 3.4 0.0 Peru 11.6 0.7 11.6 0.7 St. Kitts and Nevis 0.1 0.0 0.1 0.0 St. Lucia 1.0 0.0 1.0 0.0 St. Vincent and the Grenadines 0.4 0.0 0.4 0.0 Suriname 0.1 0.1 Trinidad and Tobago 4.0 4.0 Turks and Caicos Islands 1.0 1.0 United States 0.7 0.7 0.7 0.7 Uruguay 1.4 1.4 Venezuela 2.5 2.5 2.5 2.5 Western Hemisphere Regional 0.5 0.0 0.5 0.0 Western Hemisphere - Total 644.3 237.4 641.3 113.9 3.0 123.5 World Total 1,407.0 329.2 1,369.4 153.3 37.6 175.9