Embed Size (px)
Citation preview
© 2021 Nielsen Consumer LLC. All Rights Reserved. 1© 2021 Nielsen Consumer LLC. All Rights Reserved.
Are consumers paying more?NielsenIQ advanced analytics
U.S. inflation tracker Q2, 2021
October 2021
© 2021 Nielsen Consumer LLC. All Rights Reserved. 2
Agenda
Grounding in previous thought leadership & key finding preview
Inflation tracker: Background, objectives & methodology
How much more are consumers paying?• What is “the number” (how much are prices increasing?)Are there patterns across products?• Departments, super-categories, benefits, national vs private brands• Focus on marketing & sales insights & implications
What now?
a
© 2021 Nielsen Consumer LLC. All Rights Reserved. 33
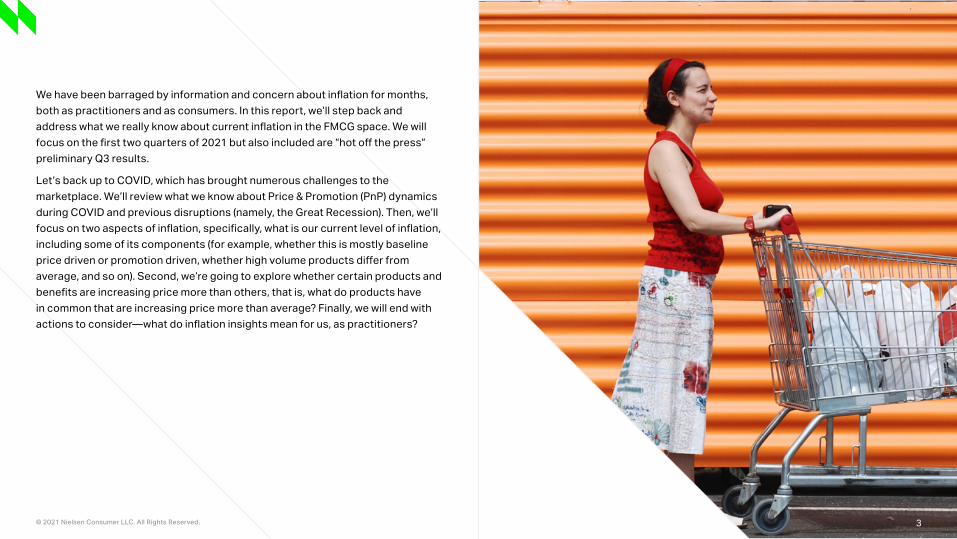
We have been barraged by information and concern about inflation for months, both as practitioners and as consumers. In this report, we’ll step back and address what we really know about current inflation in the FMCG space. We will focus on the first two quarters of 2021 but also included are “hot off the press” preliminary Q3 results.
Let’s back up to COVID, which has brought numerous challenges to the marketplace. We’ll review what we know about Price & Promotion (PnP) dynamics during COVID and previous disruptions (namely, the Great Recession). Then, we’ll focus on two aspects of inflation, specifically, what is our current level of inflation, including some of its components (for example, whether this is mostly baseline price driven or promotion driven, whether high volume products differ from average, and so on). Second, we’re going to explore whether certain products and benefits are increasing price more than others, that is, what do products have in common that are increasing price more than average? Finally, we will end with actions to consider—what do inflation insights mean for us, as practitioners?
© 2021 Nielsen Consumer LLC. All Rights Reserved. 4
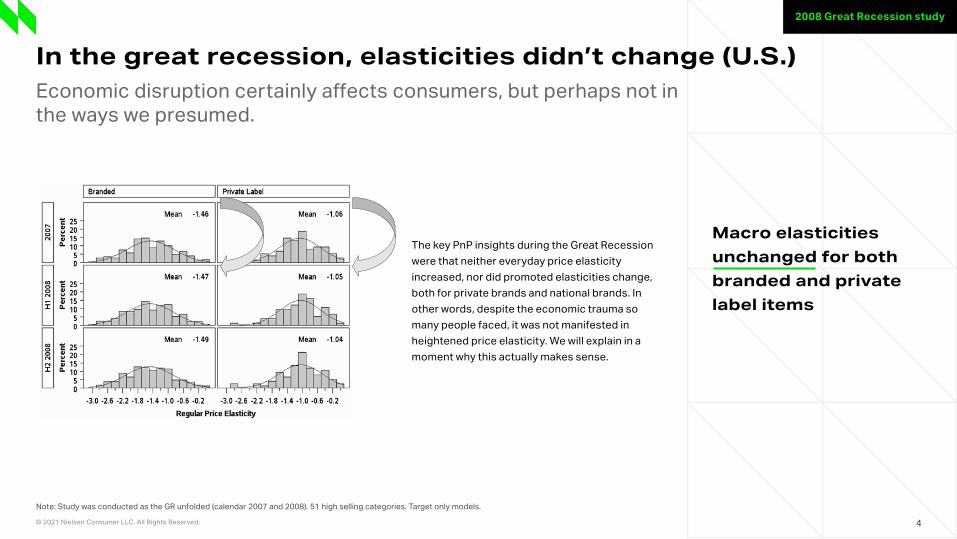
Macro elasticities unchanged for both branded and private label items
2008 Great Recession study
Note: Study was conducted as the GR unfolded (calendar 2007 and 2008). 51 high selling categories. Target only models.
In the great recession, elasticities didn’t change (U.S.)Economic disruption certainly affects consumers, but perhaps not in the ways we presumed.
The key PnP insights during the Great Recession were that neither everyday price elasticity increased, nor did promoted elasticities change, both for private brands and national brands. In other words, despite the economic trauma so many people faced, it was not manifested in heightened price elasticity. We will explain in a moment why this actually makes sense.
a
© 2021 Nielsen Consumer LLC. All Rights Reserved. 5
Our second piece of thought leadership was that during COVID, we uncovered three insights which dispelled three myths—these insights were that during COVID, everyday elasticities were comparable or lower than pre-COVID levels, promoted elasticities also were comparable or lower, and price gaps with competition didn’t increase. In common with the Great Recession, we expected economic hardship to translate into higher price elasticity. While this empirical reality initially seemed at odds with our intuition, upon further reflection, this pattern made sense. This is because COVID made other attributes more important, such as safety, quality and availability. This meant that price’s share of importance diminished. Additionally, consumers sought to be in and out of the store quickly, for safety reasons, so they paid less attention to price. Also, there is greater demand for many products, and this likely offsets price elasticity. Regarding promotions, consumers are in the store less frequently, and they spend less time in the store—this means consumers are exposed to fewer promotions. Shallower discounting also reduces price elasticity. Bottom line—there are several reasons that are consistent with the insight that price elasticities did not increase, despite economic turmoil.
5
a
© 2021 Nielsen Consumer LLC. All Rights Reserved. 6
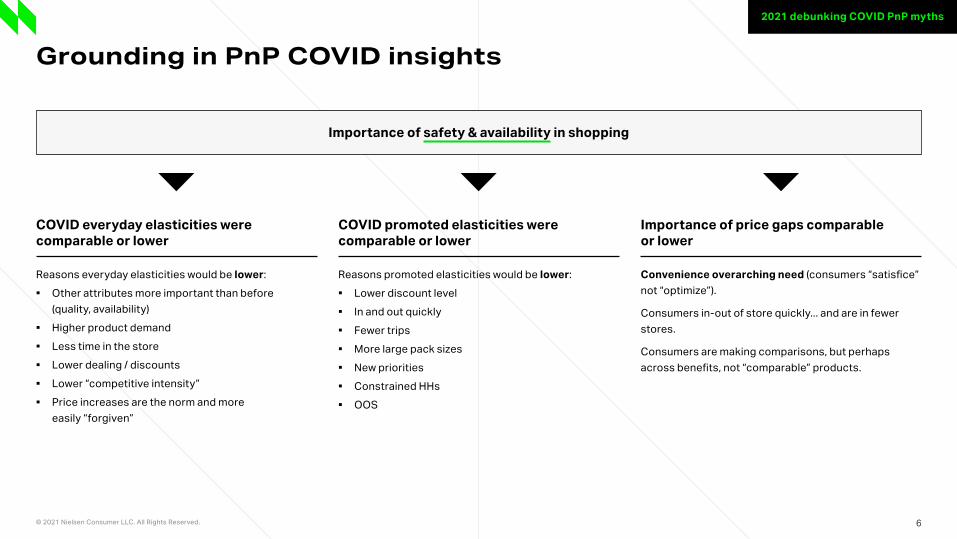
Grounding in PnP COVID insights
Reasons everyday elasticities would be lower: ▪ Other attributes more important than before
(quality, availability) ▪ Higher product demand ▪ Less time in the store ▪ Lower dealing / discounts ▪ Lower “competitive intensity” ▪ Price increases are the norm and more
easily “forgiven”
Reasons promoted elasticities would be lower: ▪ Lower discount level ▪ In and out quickly ▪ Fewer trips ▪ More large pack sizes ▪ New priorities ▪ Constrained HHs ▪ OOS
Convenience overarching need (consumers “satisfice” not “optimize”).
Consumers in-out of store quickly... and are in fewer stores.
Consumers are making comparisons, but perhaps across benefits, not “comparable” products.
COVID everyday elasticities were comparable or lower
COVID promoted elasticities were comparable or lower
Importance of price gaps comparable or lower
2021 debunking COVID PnP myths
Importance of safety & availability in shopping
a
© 2021 Nielsen Consumer LLC. All Rights Reserved. 7
Moreover, we’ve embedded this pattern of findings (that elasticities do not increase during economic struggles) into the broader context of behavioral economics, in which consumers make broad, strategic and simple changes to deal with information complexity and economic challenges. Restated, consumers seek to “satisfice” (as opposed to optimize) and apply simple rules of thumb, such as eating out less, buying store brands more, using coupons, bypassing purchasing their daily cup of coffee, trading down (buying hamburger and not steak), buying in value-price oriented stores, etc. Consumers adapt in these ways, to save dollars, rather than trying to adjust price elasticities, to save pennies. Trying to modify one’s elasticities to relatively small changes in price would require enormous cognitive resources and importantly, reap little benefit. Finally, and critically important, is that we differentiate between price elasticity, a relatively specific and narrow concept, and price sensitivity, a broad concept. Price sensitivity refers to a heightened concern about saving money, which certainly happens during financial hardship. Price elasticity is far more specific and refers to how much a product’s purchases change with a price change. In an e-commmerce study, we found multiple ways in which there is greater price sensitivity, including buying larger sizes, buying store brands and paying less for an item. If I shop in a dollar store to save money, that could have been motivated by price sensitivity but in no way affects my price elasticity. Price elasticity is not synonymous with price sensitivity—sometimes they go together (in the e-commmerce study, consumers were more price elastic as well) but often they are separate (as we saw in the Great Recession and in response to COVID).
7
a
© 2021 Nielsen Consumer LLC. All Rights Reserved. 8
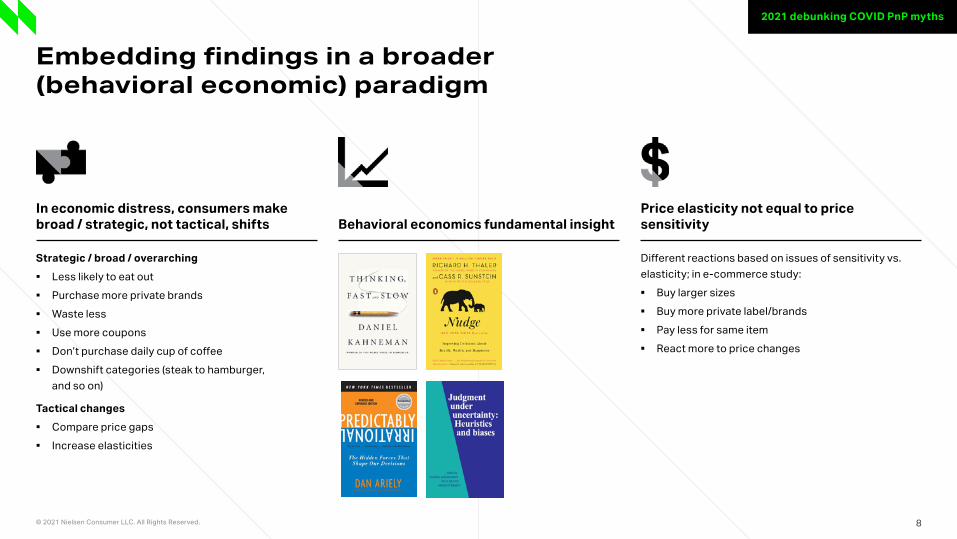
Embedding findings in a broader (behavioral economic) paradigm
Strategic / broad / overarching ▪ Less likely to eat out ▪ Purchase more private brands ▪ Waste less ▪ Use more coupons ▪ Don’t purchase daily cup of coffee ▪ Downshift categories (steak to hamburger,
and so on)
Tactical changes ▪ Compare price gaps ▪ Increase elasticities
Different reactions based on issues of sensitivity vs. elasticity; in e-commerce study: ▪ Buy larger sizes ▪ Buy more private label/brands ▪ Pay less for same item ▪ React more to price changes
In economic distress, consumers make broad / strategic, not tactical, shifts Behavioral economics fundamental insight
Price elasticity not equal to price sensitivity
2021 debunking COVID PnP myths
a
© 2021 Nielsen Consumer LLC. All Rights Reserved. 9
FMCG methodology overview
▪ Analysis: Test whether consumers are paying more for servings now than before; measure trend.
▪ Approach: Construct several (8) measures to converge on truth.
▪ Facts: Equivalized price change & base equivalized price change (based on eq volume, not units)—we will refer to this as “price per serving”.
▪ Channels: xAOC and food (subsequent versions will add super center & mass).
▪ Products: All departments (except general merchandise & floral: 2 views (top 5,000 SKUs stratified by department + weighted average sum of aggregated super-categories).
▪ Time periods: 18 quarters (14 year ago quarters).
▪ Composite change: 2 channels * 2 facts * 2 product sets = 8 measures—these will be averaged.
▪ Explanation: Can’t entirely eliminate “mix” changes but will as best as possible measure changes in prices paid per servings.
COVID brought on numerous challenges to health, institutions and even our supply chains. This is leading to inflation. Accurate estimation of the size of inflation was a key goal. We have eight key metrics—2 channels (xAOC (total) & food) times 2 measures (baseline EQ price change and EQ price change) times 2 sets of products (5,000 of the highest volume individual SKUs stratified by department size and “brandedness,” as well as department totals, which are weighted averages of composite categories). The 5k SKUs represented 29% of total $. To account for the rest of the volume, we also included aggregates or totals. Finally, we then combined all eight measures (2*2*2) for a highly stable measure—we will refer to this as the composite average.
a
© 2021 Nielsen Consumer LLC. All Rights Reserved. 10
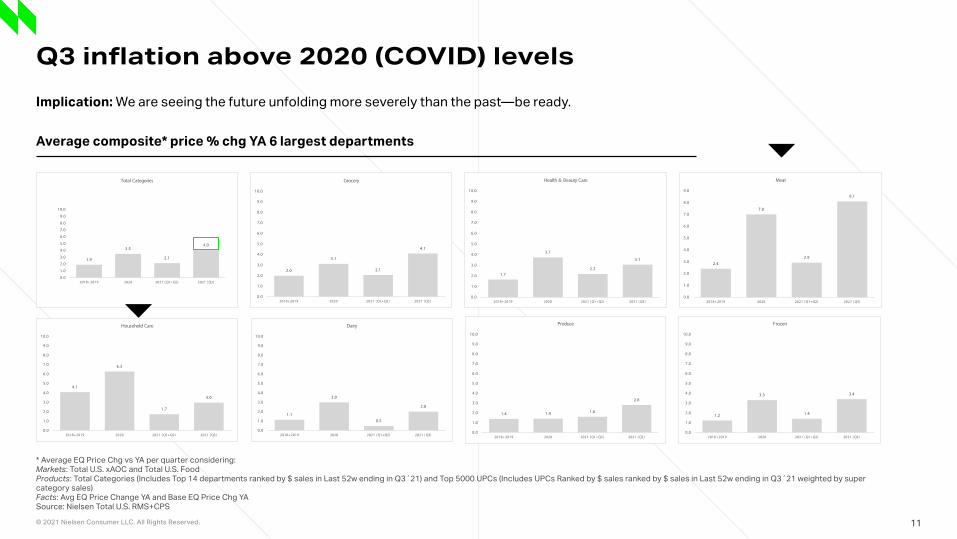
When examining the composite, we broke it out by time period and by department. On the upper left during the pre-COVID period, we see ~ 2 points of price increases (a benchmark of inflation), followed by a 3-4-point increase during COVID. Now we’re back to a 2-point change in the first half of 2021 (but realize that this is off the higher COVID base). Worrisome is that in the most recent quarter (Q3), we see prices increase up to 4%. Moreover, when breaking out departments, we see meat has increased the most, in the upper right, produce the least (lower middle), and dairy was the most variable. For meat, a key question is whether or how much these price increases hurt the department as COVID abates and going to restaurants increases. As we see in Q3, the first half of 2021 was not predictive of Q3—we believe that inflation likely will stay high, as there are structural and more long-term dynamics involved in current price increases.
10
a
© 2021 Nielsen Consumer LLC. All Rights Reserved. 11
Q3 inflation above 2020 (COVID) levelsImplication: We are seeing the future unfolding more severely than the past—be ready.
Average composite* price % chg YA 6 largest departments
* Average EQ Price Chg vs YA per quarter considering:Markets: Total U.S. xAOC and Total U.S. FoodProducts: Total Categories (Includes Top 14 departments ranked by $ sales in Last 52w ending in Q3´21) and Top 5000 UPCs (Includes UPCs Ranked by $ sales ranked by $ sales in Last 52w ending in Q3´21 weighted by super category sales)Facts: Avg EQ Price Change YA and Base EQ Price Chg YASource: Nielsen Total U.S. RMS+CPS
4.1
6.3
1.7
3.0
0.0
1.0
2.0
3.0
4.0
5.0
6.0
7.0
8.0
9.0
10.0
2018+2019 2020 2021 ( Q1+Q2) 2021 ( Q3)
Household Care
1.9
3.5
2.1
4.0
0.0
1.0
2.0
3.0
4.0
5.0
6.0
7.0
8.0
9.0
10.0
2018+2019 2020 2021 ( Q1+Q2) 2021 ( Q3)
Total Categories
2.0
3.1
2.1
4.1
0.0
1.0
2.0
3.0
4.0
5.0
6.0
7.0
8.0
9.0
10.0
2018+2019 2020 2021 ( Q1+Q2) 2021 ( Q3)
Grocery
1.7
3.7
2.2
3.1
0.0
1.0
2.0
3.0
4.0
5.0
6.0
7.0
8.0
9.0
10.0
2018+2019 2020 2021 ( Q1+Q2) 2021 ( Q3)
Health & Beauty Care
2.4
7.0
2.9
8.1
0.0
1.0
2.0
3.0
4.0
5.0
6.0
7.0
8.0
9.0
2018+2019 2020 2021 ( Q1+Q2) 2021 ( Q3)
Meat
1.1
3.0
0.5
2.0
0.0
1.0
2.0
3.0
4.0
5.0
6.0
7.0
8.0
9.0
10.0
2018+2019 2020 2021 ( Q1+Q2) 2021 ( Q3)
Dairy
1.4 1.4 1.6
2.8
0.0
1.0
2.0
3.0
4.0
5.0
6.0
7.0
8.0
9.0
10.0
2018+2019 2020 2021 ( Q1+Q2) 2021 ( Q3)
Produce
1.2
3.3
1.4
3.4
0.0
1.0
2.0
3.0
4.0
5.0
6.0
7.0
8.0
9.0
10.0
2018+2019 2020 2021 ( Q1+Q2) 2021 ( Q3)
Frozen
a
© 2021 Nielsen Consumer LLC. All Rights Reserved. 12
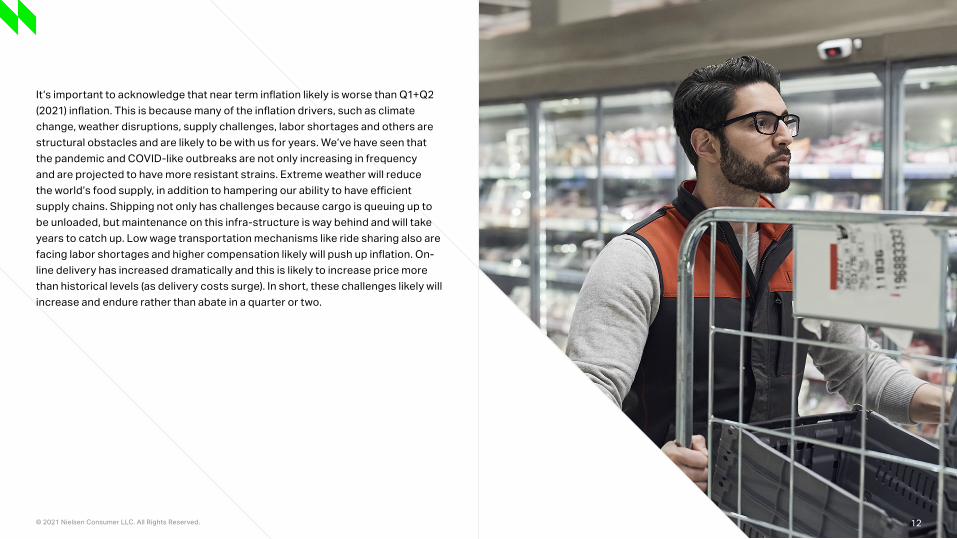
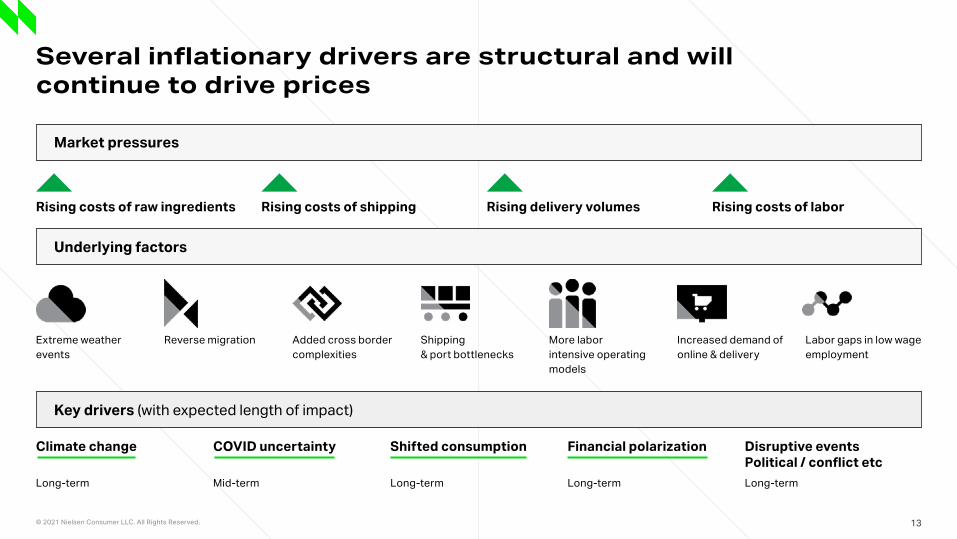
It’s important to acknowledge that near term inflation likely is worse than Q1+Q2 (2021) inflation. This is because many of the inflation drivers, such as climate change, weather disruptions, supply challenges, labor shortages and others are structural obstacles and are likely to be with us for years. We’ve have seen that the pandemic and COVID-like outbreaks are not only increasing in frequency and are projected to have more resistant strains. Extreme weather will reduce the world’s food supply, in addition to hampering our ability to have efficient supply chains. Shipping not only has challenges because cargo is queuing up to be unloaded, but maintenance on this infra-structure is way behind and will take years to catch up. Low wage transportation mechanisms like ride sharing also are facing labor shortages and higher compensation likely will push up inflation. On-line delivery has increased dramatically and this is likely to increase price more than historical levels (as delivery costs surge). In short, these challenges likely will increase and endure rather than abate in a quarter or two.
12
a
© 2021 Nielsen Consumer LLC. All Rights Reserved. 13
Several inflationary drivers are structural and will continue to drive prices
Rising costs of raw ingredients
Extreme weather events
Added cross border complexities
Increased demand of online & delivery
Reverse migration More labor intensive operatingmodels
Shipping & port bottlenecks
Labor gaps in low wage employment
Rising delivery volumesRising costs of shipping Rising costs of labor
Climate change
Long-term
Shifted consumption
Long-term
COVID uncertainty
Mid-term
Financial polarization
Long-term
Disruptive eventsPolitical / conflict etcLong-term
Market pressures
Underlying factors
Key drivers (with expected length of impact)
a
© 2021 Nielsen Consumer LLC. All Rights Reserved. 14
What’s driving inflation, everyday price increases and / or promotion dynamics. Note that EQ price change includes base EQ price + promotion, so if EQ changes more than base EQ, it means that promotion is contributing more than are base EQ drivers. And that’s what we see. This doesn’t tell us the drivers of promotion that are leading to price increases, as it could be amount of promotion (decreasing), mix of promotion levers (more TPRs and fewer ads+displays), depth of discount (could be lower), and/or a reduced consumer promoted elasticity. It is important to know that promotion is contributing disproportionately because when the COVID dividend lessens and top-line growth is harder, likely, it’s promotion that will be needed to regain momentum. If we lose our promotion effectiveness, it will be harder to get back to these recent levels of growth. Of course, if lower promotion is achieving desired business results then maybe it’s good that promotion changes are leading to higher price realization.
14
a
© 2021 Nielsen Consumer LLC. All Rights Reserved. 15
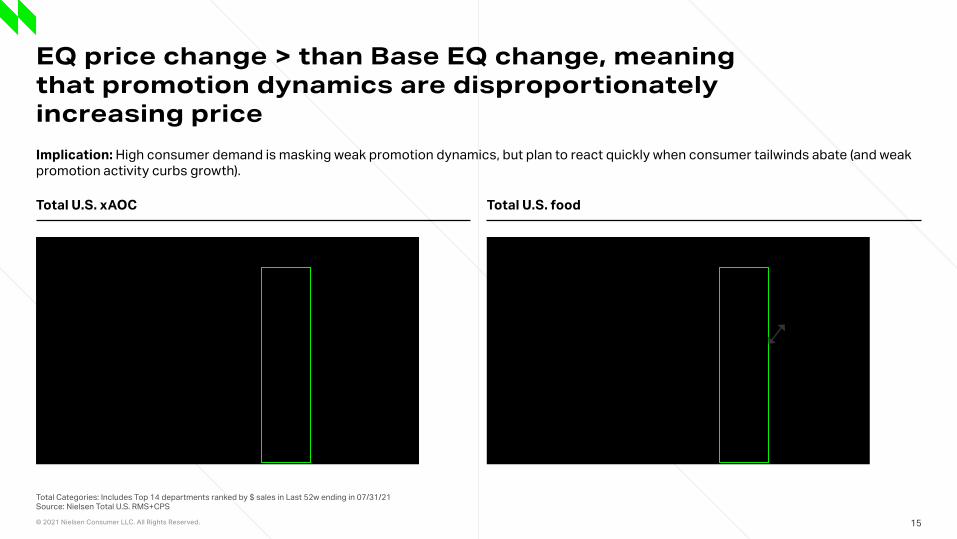
EQ price change > than Base EQ change, meaning that promotion dynamics are disproportionately increasing price Implication: High consumer demand is masking weak promotion dynamics, but plan to react quickly when consumer tailwinds abate (and weak promotion activity curbs growth).
Total Categories: Includes Top 14 departments ranked by $ sales in Last 52w ending in 07/31/21Source: Nielsen Total U.S. RMS+CPS
Total U.S. xAOC Total U.S. food
Covid lockdown
Covid lockdown
a
© 2021 Nielsen Consumer LLC. All Rights Reserved. 16
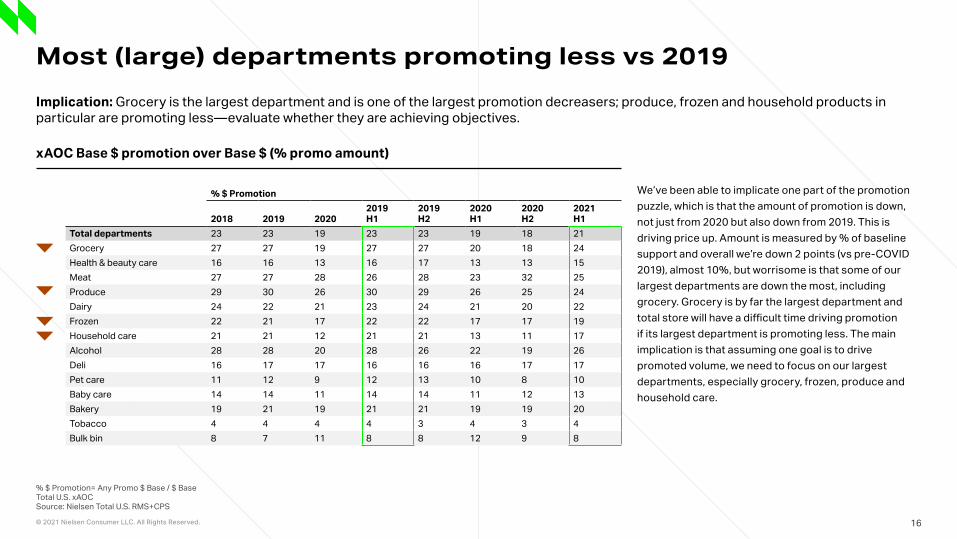
Most (large) departments promoting less vs 2019
% $ Promotion= Any Promo $ Base / $ BaseTotal U.S. xAOCSource: Nielsen Total U.S. RMS+CPS
We’ve been able to implicate one part of the promotion puzzle, which is that the amount of promotion is down, not just from 2020 but also down from 2019. This is driving price up. Amount is measured by % of baseline support and overall we’re down 2 points (vs pre-COVID 2019), almost 10%, but worrisome is that some of our largest departments are down the most, including grocery. Grocery is by far the largest department and total store will have a difficult time driving promotion if its largest department is promoting less. The main implication is that assuming one goal is to drive promoted volume, we need to focus on our largest departments, especially grocery, frozen, produce and household care.
Implication: Grocery is the largest department and is one of the largest promotion decreasers; produce, frozen and household products in particular are promoting less—evaluate whether they are achieving objectives.
xAOC Base $ promotion over Base $ (% promo amount)
% $ Promotion
2018 2019 20202019H1
2019H2
2020H1
2020H2
2021H1
Total departments 23 23 19 23 23 19 18 21Grocery 27 27 19 27 27 20 18 24Health & beauty care 16 16 13 16 17 13 13 15Meat 27 27 28 26 28 23 32 25Produce 29 30 26 30 29 26 25 24Dairy 24 22 21 23 24 21 20 22Frozen 22 21 17 22 22 17 17 19Household care 21 21 12 21 21 13 11 17Alcohol 28 28 20 28 26 22 19 26Deli 16 17 17 16 16 16 17 17Pet care 11 12 9 12 13 10 8 10Baby care 14 14 11 14 14 11 12 13Bakery 19 21 19 21 21 19 19 20Tobacco 4 4 4 4 3 4 3 4Bulk bin 8 7 11 8 8 12 9 8
a
© 2021 Nielsen Consumer LLC. All Rights Reserved. 17
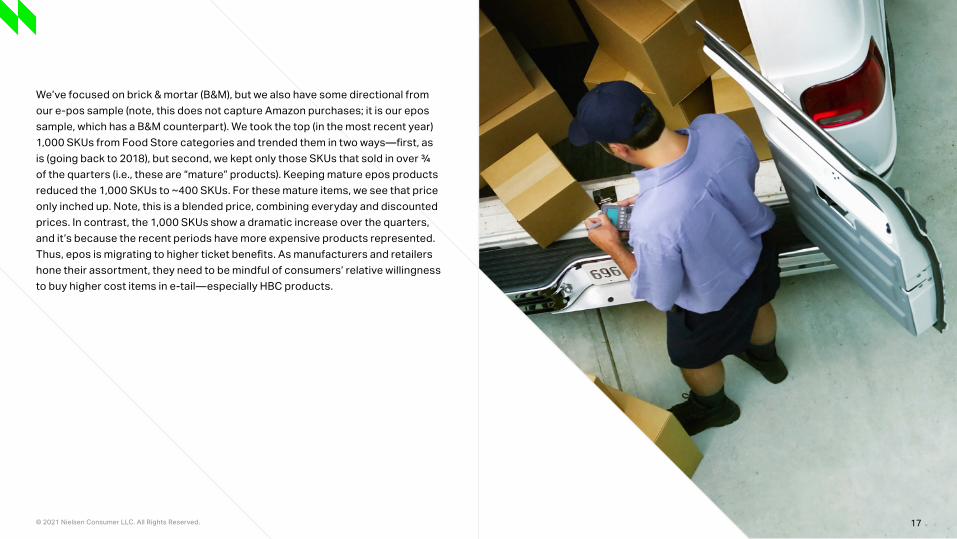
We’ve focused on brick & mortar (B&M), but we also have some directional from our e-pos sample (note, this does not capture Amazon purchases; it is our epos sample, which has a B&M counterpart). We took the top (in the most recent year) 1,000 SKUs from Food Store categories and trended them in two ways—first, as is (going back to 2018), but second, we kept only those SKUs that sold in over ¾ of the quarters (i.e., these are “mature” products). Keeping mature epos products reduced the 1,000 SKUs to ~400 SKUs. For these mature items, we see that price only inched up. Note, this is a blended price, combining everyday and discounted prices. In contrast, the 1,000 SKUs show a dramatic increase over the quarters, and it’s because the recent periods have more expensive products represented. Thus, epos is migrating to higher ticket benefits. As manufacturers and retailers hone their assortment, they need to be mindful of consumers’ relative willingness to buy higher cost items in e-tail—especially HBC products.
17
a
© 2021 Nielsen Consumer LLC. All Rights Reserved. 18
Exploratory e-commerce trends
E-commerce (EPOS) migrating to more expensive products, but longer term e-commerce products have modest increasesImplication: Product mix is a key ingredient to winning in e-commerce, with high consumer shopping engagement, ok to focus on more expensive products and those with special benefits.
Note: 460 of 918 items had volume in Q1´18Total U.S. E-PoS DataTop 50 Super Categories (excludes: General Merchandising and Produce) l Coverage: 50 top super categories -.-> 75% of Total Epos channel $ salesSource: Nielsen Connect
These are the 1,000 top sellers now
These are ~400 from the 1,000 that have been selling since 2018
a
© 2021 Nielsen Consumer LLC. All Rights Reserved. 19
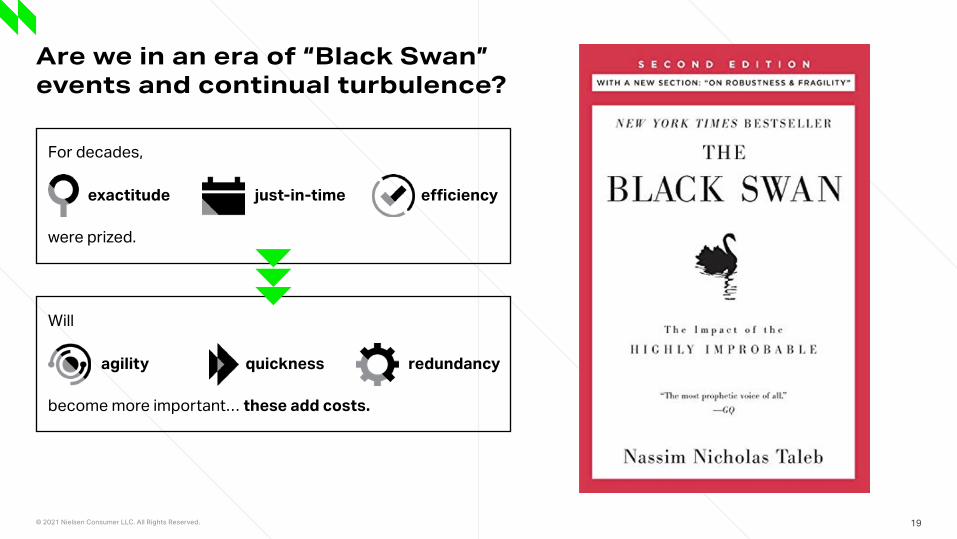
Are we in an era of “Black Swan” events and continual turbulence?
For decades,
Will
were prized.
become more important… these add costs.
exactitude
agility quickness redundancy
just-in-time efficiency
a
© 2021 Nielsen Consumer LLC. All Rights Reserved. 20
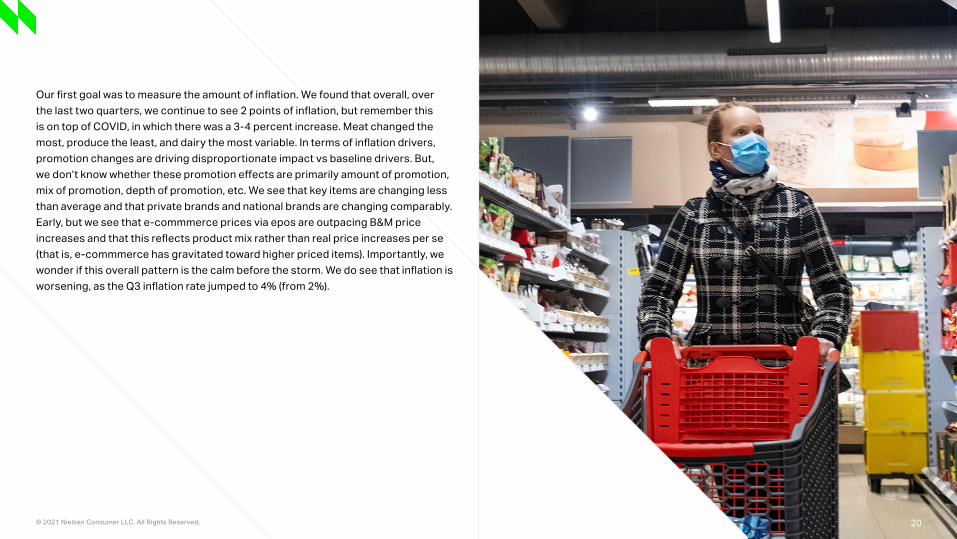
Our first goal was to measure the amount of inflation. We found that overall, over the last two quarters, we continue to see 2 points of inflation, but remember this is on top of COVID, in which there was a 3-4 percent increase. Meat changed the most, produce the least, and dairy the most variable. In terms of inflation drivers, promotion changes are driving disproportionate impact vs baseline drivers. But, we don’t know whether these promotion effects are primarily amount of promotion, mix of promotion, depth of promotion, etc. We see that key items are changing less than average and that private brands and national brands are changing comparably. Early, but we see that e-commmerce prices via epos are outpacing B&M price increases and that this reflects product mix rather than real price increases per se (that is, e-commmerce has gravitated toward higher priced items). Importantly, we wonder if this overall pattern is the calm before the storm. We do see that inflation is worsening, as the Q3 inflation rate jumped to 4% (from 2%).
20
© 2021 Nielsen Consumer LLC. All Rights Reserved. 21
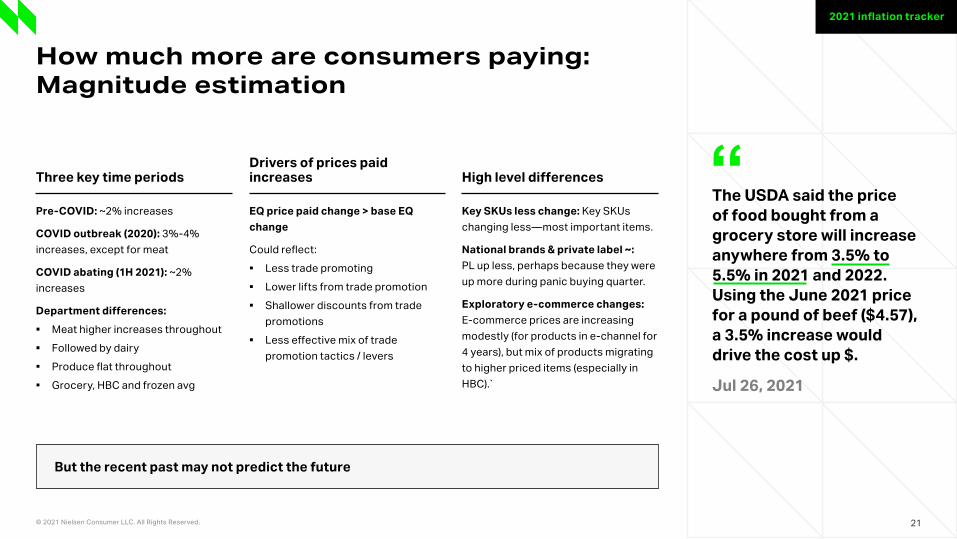
How much more are consumers paying: Magnitude estimation
2021 inflation tracker
The USDA said the price of food bought from a grocery store will increase anywhere from 3.5% to 5.5% in 2021 and 2022. Using the June 2021 price for a pound of beef ($4.57), a 3.5% increase would drive the cost up $.
Jul 26, 2021
“Three key time periodsDrivers of prices paid increases High level differences
Pre-COVID: ~2% increases
COVID outbreak (2020): 3%-4% increases, except for meat
COVID abating (1H 2021): ~2% increases
Department differences: ▪ Meat higher increases throughout ▪ Followed by dairy ▪ Produce flat throughout ▪ Grocery, HBC and frozen avg
EQ price paid change > base EQ change
Could reflect: ▪ Less trade promoting ▪ Lower lifts from trade promotion ▪ Shallower discounts from trade
promotions ▪ Less effective mix of trade
promotion tactics / levers
Key SKUs less change: Key SKUs changing less—most important items.
National brands & private label ~: PL up less, perhaps because they were up more during panic buying quarter.
Exploratory e-commerce changes: E-commerce prices are increasing modestly (for products in e-channel for 4 years), but mix of products migrating to higher priced items (especially in HBC).̀
But the recent past may not predict the future
a
© 2021 Nielsen Consumer LLC. All Rights Reserved. 22
Now, let’s try to understand which products are increasing prices the most. Starting with departments, we show in yellow where inflation is the largest (note that gray shaded departments are the largest $ size). We find that care and indulgence oriented departments, such as HBC, baby, alcohol, pet and tobacco, have the largest price increases versus year ago. The COVID malaise has taken a psychological toll on so many families, hence, they are just trying to regulate their pleasures. Now, let’s provide a summary of the largest departments to identify themes across products that are increasing price the most. We looked at three groups of categories—the 10 that increased price the most, the 10 that increased price the least and the 10 largest ones.
22
a
© 2021 Nielsen Consumer LLC. All Rights Reserved. 23
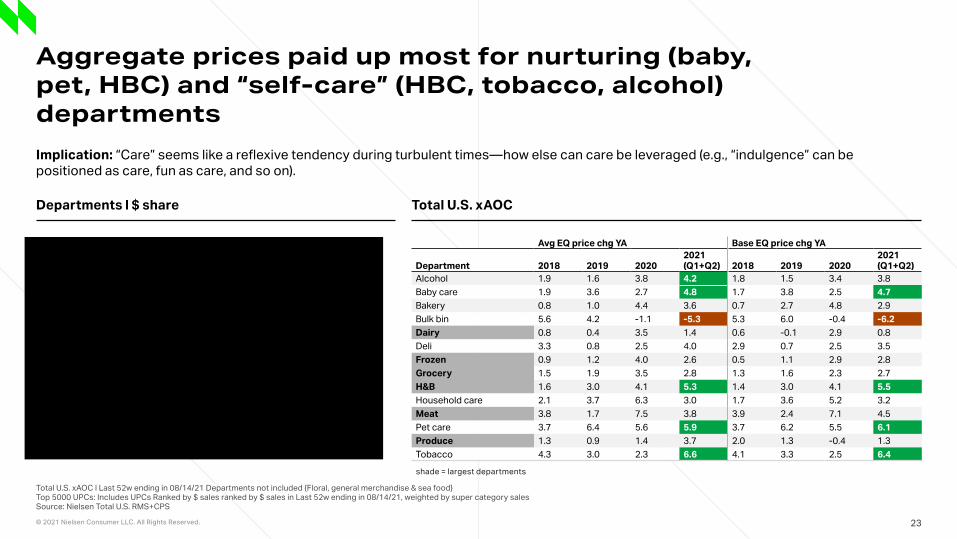
Aggregate prices paid up most for nurturing (baby, pet, HBC) and “self-care” (HBC, tobacco, alcohol) departmentsImplication: “Care” seems like a reflexive tendency during turbulent times—how else can care be leveraged (e.g., “indulgence” can be positioned as care, fun as care, and so on).
Total U.S. xAOC l Last 52w ending in 08/14/21 Departments not included {Floral, general merchandise & sea food}Top 5000 UPCs: Includes UPCs Ranked by $ sales ranked by $ sales in Last 52w ending in 08/14/21, weighted by super category salesSource: Nielsen Total U.S. RMS+CPS
Departments l $ share Total U.S. xAOC
Avg EQ price chg YA Base EQ price chg YA
Department 2018 2019 20202021 (Q1+Q2) 2018 2019 2020
2021 (Q1+Q2)
Alcohol 1.9 1.6 3.8 4.2 1.8 1.5 3.4 3.8Baby care 1.9 3.6 2.7 4.8 1.7 3.8 2.5 4.7Bakery 0.8 1.0 4.4 3.6 0.7 2.7 4.8 2.9Bulk bin 5.6 4.2 -1.1 -5.3 5.3 6.0 -0.4 -6.2Dairy 0.8 0.4 3.5 1.4 0.6 -0.1 2.9 0.8Deli 3.3 0.8 2.5 4.0 2.9 0.7 2.5 3.5Frozen 0.9 1.2 4.0 2.6 0.5 1.1 2.9 2.8Grocery 1.5 1.9 3.5 2.8 1.3 1.6 2.3 2.7H&B 1.6 3.0 4.1 5.3 1.4 3.0 4.1 5.5Household care 2.1 3.7 6.3 3.0 1.7 3.6 5.2 3.2Meat 3.8 1.7 7.5 3.8 3.9 2.4 7.1 4.5Pet care 3.7 6.4 5.6 5.9 3.7 6.2 5.5 6.1Produce 1.3 0.9 1.4 3.7 2.0 1.3 -0.4 1.3Tobacco 4.3 3.0 2.3 6.6 4.1 3.3 2.5 6.4
shade = largest departments
a
© 2021 Nielsen Consumer LLC. All Rights Reserved. 24
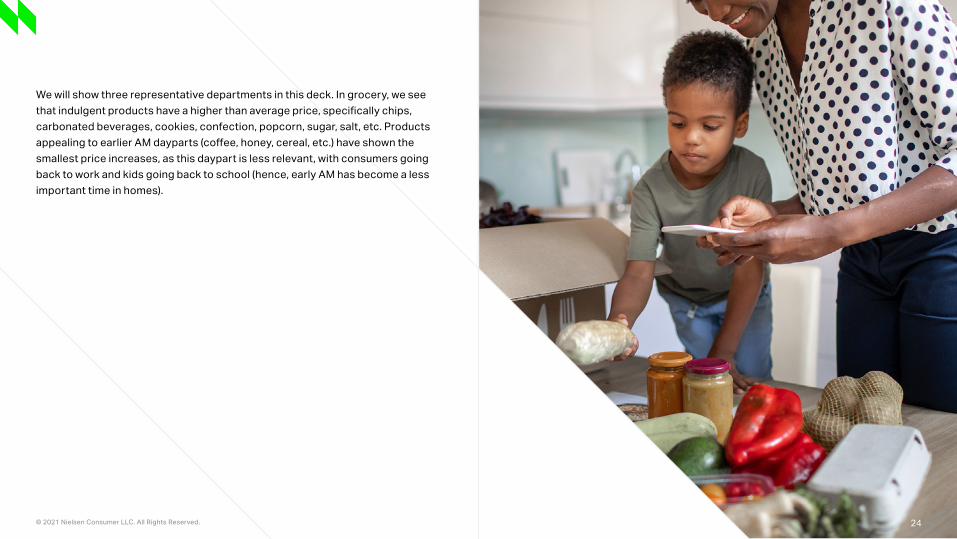
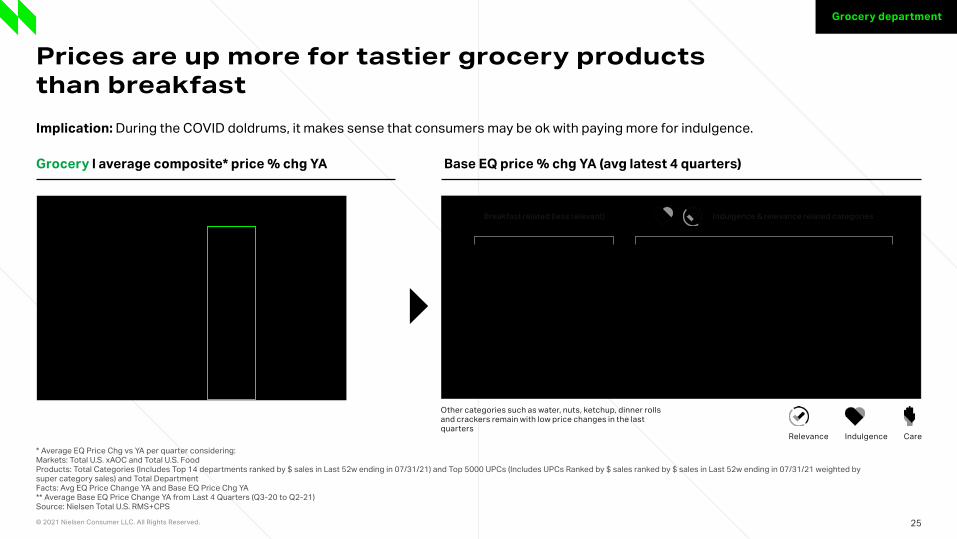
We will show three representative departments in this deck. In grocery, we see that indulgent products have a higher than average price, specifically chips, carbonated beverages, cookies, confection, popcorn, sugar, salt, etc. Products appealing to earlier AM dayparts (coffee, honey, cereal, etc.) have shown the smallest price increases, as this daypart is less relevant, with consumers going back to work and kids going back to school (hence, early AM has become a less important time in homes).
24
a
© 2021 Nielsen Consumer LLC. All Rights Reserved. 25
Prices are up more for tastier grocery products than breakfastImplication: During the COVID doldrums, it makes sense that consumers may be ok with paying more for indulgence.
* Average EQ Price Chg vs YA per quarter considering:Markets: Total U.S. xAOC and Total U.S. FoodProducts: Total Categories (Includes Top 14 departments ranked by $ sales in Last 52w ending in 07/31/21) and Top 5000 UPCs (Includes UPCs Ranked by $ sales ranked by $ sales in Last 52w ending in 07/31/21 weighted by super category sales) and Total DepartmentFacts: Avg EQ Price Change YA and Base EQ Price Chg YA** Average Base EQ Price Change YA from Last 4 Quarters (Q3-20 to Q2-21)Source: Nielsen Total U.S. RMS+CPS
Grocery l average composite* price % chg YA Base EQ price % chg YA (avg latest 4 quarters)
Grocery department
Other categories such as water, nuts, ketchup, dinner rolls and crackers remain with low price changes in the last quarters
Relevance Indulgence Care
Breakfast related (less relevant) Indulgence & relevance related categories
a
© 2021 Nielsen Consumer LLC. All Rights Reserved. 26
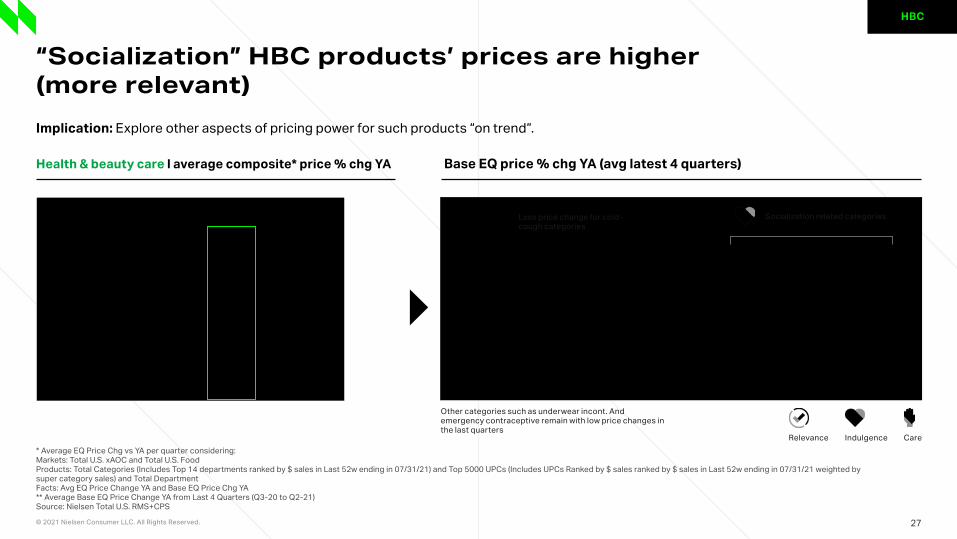
For HBC, people have more live contact than before, hence, it is not surprising that socialization oriented products, such as deodorant, nail polish, facial moisturizer, body wash, shampoo, conditioner, etc. have higher prices than nasal, cough, health monitors, sinus, acid relief, analgesics, etc. The former set is now more relevant.
26
a
© 2021 Nielsen Consumer LLC. All Rights Reserved. 27
“Socialization” HBC products’ prices are higher (more relevant)Implication: Explore other aspects of pricing power for such products “on trend”.
* Average EQ Price Chg vs YA per quarter considering:Markets: Total U.S. xAOC and Total U.S. FoodProducts: Total Categories (Includes Top 14 departments ranked by $ sales in Last 52w ending in 07/31/21) and Top 5000 UPCs (Includes UPCs Ranked by $ sales ranked by $ sales in Last 52w ending in 07/31/21 weighted by super category sales) and Total DepartmentFacts: Avg EQ Price Change YA and Base EQ Price Chg YA** Average Base EQ Price Change YA from Last 4 Quarters (Q3-20 to Q2-21)Source: Nielsen Total U.S. RMS+CPS
Health & beauty care l average composite* price % chg YA Base EQ price % chg YA (avg latest 4 quarters)
HBC
Other categories such as underwear incont. And emergency contraceptive remain with low price changes in the last quarters
Relevance Indulgence Care
Less price change for cold-cough categories
Socialization related categories
a
© 2021 Nielsen Consumer LLC. All Rights Reserved. 28
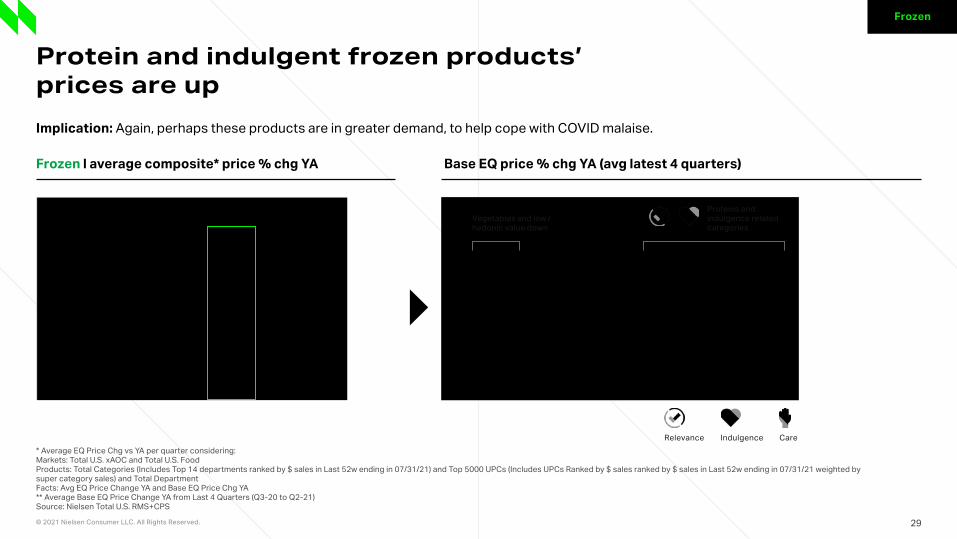
Frozen mirrors previous departments, in that indulgent products, such as ice cream, and novelties have increased more, as has beef and chicken (these two proteins have also increased price at an above average rate in the Meat department). Less indulgent products, such as frozen vegetables and broccoli and others have increased price less.
28
a
© 2021 Nielsen Consumer LLC. All Rights Reserved. 29
Protein and indulgent frozen products’ prices are upImplication: Again, perhaps these products are in greater demand, to help cope with COVID malaise.
* Average EQ Price Chg vs YA per quarter considering:Markets: Total U.S. xAOC and Total U.S. FoodProducts: Total Categories (Includes Top 14 departments ranked by $ sales in Last 52w ending in 07/31/21) and Top 5000 UPCs (Includes UPCs Ranked by $ sales ranked by $ sales in Last 52w ending in 07/31/21 weighted by super category sales) and Total DepartmentFacts: Avg EQ Price Change YA and Base EQ Price Chg YA** Average Base EQ Price Change YA from Last 4 Quarters (Q3-20 to Q2-21)Source: Nielsen Total U.S. RMS+CPS
Frozen
Frozen l average composite* price % chg YA Base EQ price % chg YA (avg latest 4 quarters)
Relevance Indulgence Care
Vegetables and low /hedonic value down
Proteins and indulgence related categories
a
© 2021 Nielsen Consumer LLC. All Rights Reserved. 30
Our second goal was to explore whether there are commonalities between products that changed a lot vs a little. Note, we aren’t presenting volume changes, so we’re not discussing changes in demand, just price. Qualitatively, there are three dimensions of products that are increasing more—those that have high hedonic value or are indulgent (chips, ice cream, carb bev), those that provide care (H&B, baby care, alcohol) and those that are more relevant (HBC socialization products, early AM products are less relevant, and so on). So, what have we learned—products whose prices have increased more, qualitatively, are care-oriented, are more relevant and are tasty/indulgent. This follows from the COVID doldrums that so many have experienced. Have retailers and manufacturers geared offerings to these need states, as they have increased in importance, since COVID.
30
a
© 2021 Nielsen Consumer LLC. All Rights Reserved. 31
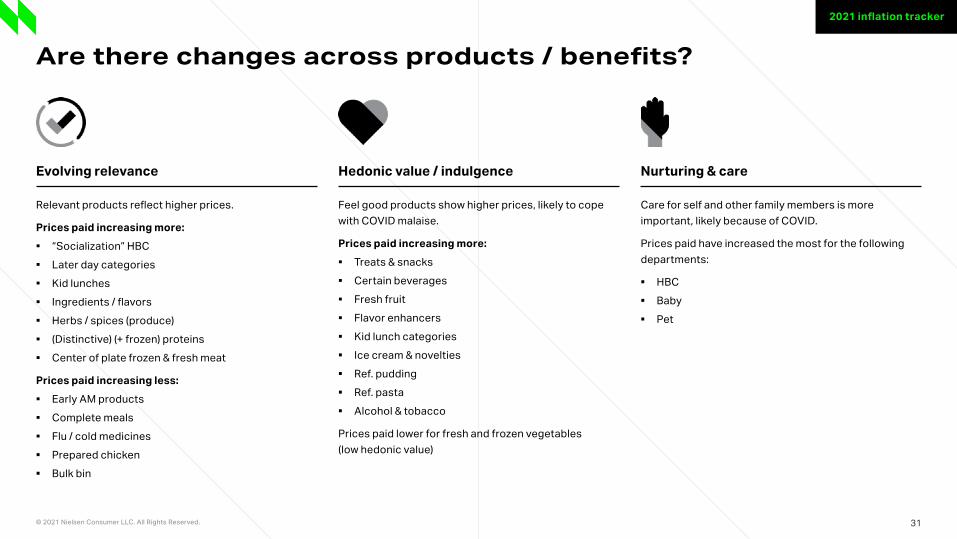
Are there changes across products / benefits?
2021 inflation tracker
Relevant products reflect higher prices.
Prices paid increasing more: ▪ “Socialization” HBC ▪ Later day categories ▪ Kid lunches ▪ Ingredients / flavors ▪ Herbs / spices (produce) ▪ (Distinctive) (+ frozen) proteins ▪ Center of plate frozen & fresh meat
Prices paid increasing less: ▪ Early AM products ▪ Complete meals ▪ Flu / cold medicines ▪ Prepared chicken ▪ Bulk bin
Feel good products show higher prices, likely to cope with COVID malaise.
Prices paid increasing more: ▪ Treats & snacks ▪ Certain beverages ▪ Fresh fruit ▪ Flavor enhancers ▪ Kid lunch categories ▪ Ice cream & novelties ▪ Ref. pudding ▪ Ref. pasta ▪ Alcohol & tobacco
Prices paid lower for fresh and frozen vegetables (low hedonic value)
Care for self and other family members is more important, likely because of COVID.
Prices paid have increased the most for the following departments:
▪ HBC ▪ Baby ▪ Pet
Evolving relevance Hedonic value / indulgence Nurturing & care
a
© 2021 Nielsen Consumer LLC. All Rights Reserved. 32
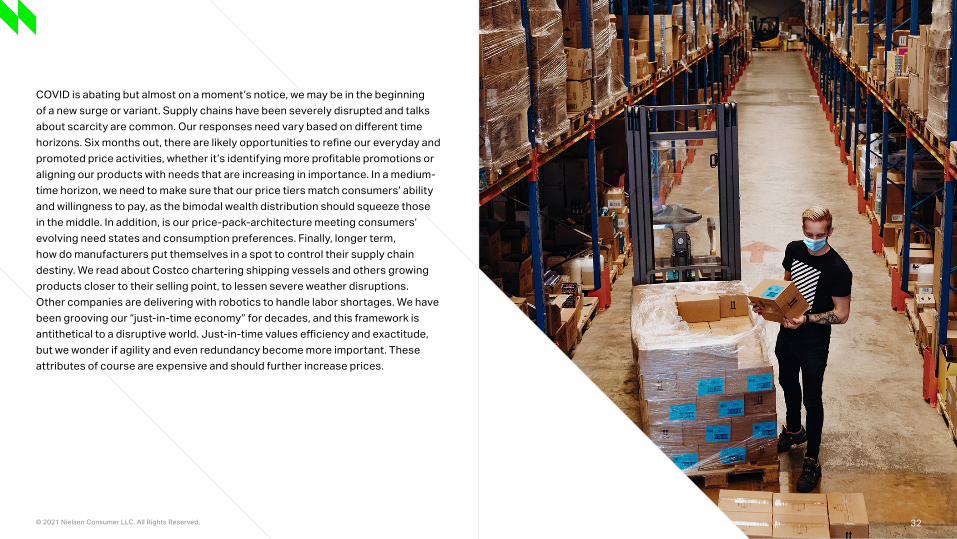
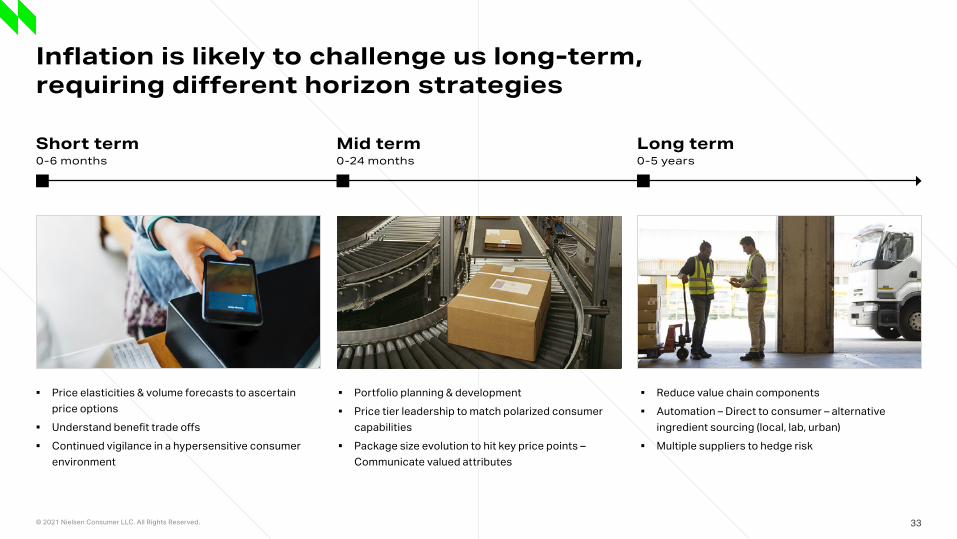
COVID is abating but almost on a moment’s notice, we may be in the beginning of a new surge or variant. Supply chains have been severely disrupted and talks about scarcity are common. Our responses need vary based on different time horizons. Six months out, there are likely opportunities to refine our everyday and promoted price activities, whether it’s identifying more profitable promotions or aligning our products with needs that are increasing in importance. In a medium-time horizon, we need to make sure that our price tiers match consumers’ ability and willingness to pay, as the bimodal wealth distribution should squeeze those in the middle. In addition, is our price-pack-architecture meeting consumers’ evolving need states and consumption preferences. Finally, longer term, how do manufacturers put themselves in a spot to control their supply chain destiny. We read about Costco chartering shipping vessels and others growing products closer to their selling point, to lessen severe weather disruptions. Other companies are delivering with robotics to handle labor shortages. We have been grooving our “just-in-time economy” for decades, and this framework is antithetical to a disruptive world. Just-in-time values efficiency and exactitude, but we wonder if agility and even redundancy become more important. These attributes of course are expensive and should further increase prices.
32
a
© 2021 Nielsen Consumer LLC. All Rights Reserved. 33
Inflation is likely to challenge us long-term, requiring different horizon strategies
Short term0-6 months
Mid term0-24 months
Long term0-5 years
▪ Price elasticities & volume forecasts to ascertain price options
▪ Understand benefit trade offs ▪ Continued vigilance in a hypersensitive consumer
environment
▪ Portfolio planning & development ▪ Price tier leadership to match polarized consumer
capabilities ▪ Package size evolution to hit key price points –
Communicate valued attributes
▪ Reduce value chain components ▪ Automation – Direct to consumer – alternative
ingredient sourcing (local, lab, urban) ▪ Multiple suppliers to hedge risk
a
© 2021 Nielsen Consumer LLC. All Rights Reserved. 34
What should we do? Our imperatives start with uncovering profit pools. Products and retail formats that appeal to financially secure consumers may have pricing power, in addition to products that have a reduced elasticity and products that fulfill on-trend needs. We discussed how retailers need to get more consumers in the store and keep them longer, perhaps it’s enticing them with specials that are only in-store. Imagine giving consumers free products for every $50 they spend in store (a free pound of bananas or free store-brand condensed soup for $50 spend, a free pound of strawberries or a free store-brand ready-to-serve soup for $100 spend, and so on). Finally, can we gear our products to need states that continue to increase in importance—to enhance consumers’ spirits, products that are indulgent and care oriented are particularly on-trend. Let’s explore some thought starters involving technology, with the goal of increasing store traffic.
34
© 2021 Nielsen Consumer LLC. All Rights Reserved. 35
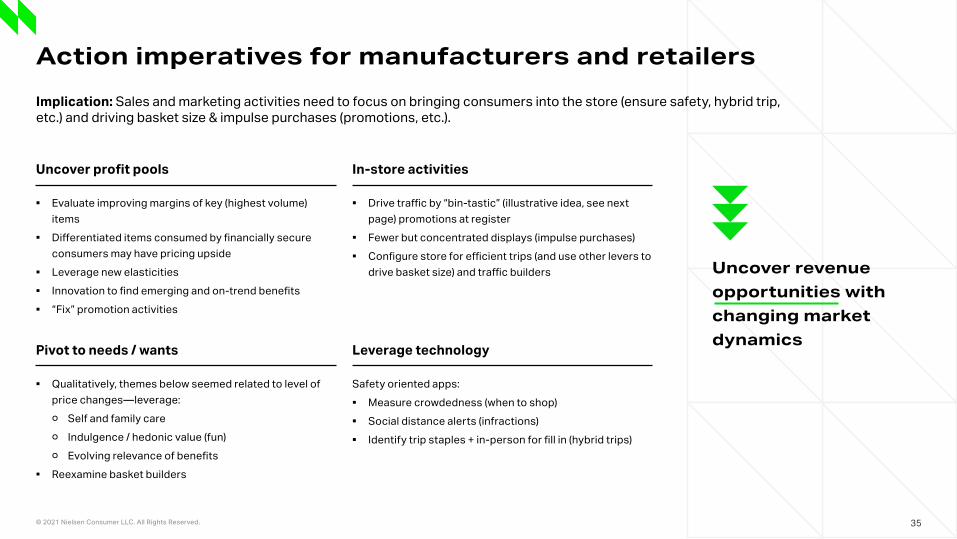
Action imperatives for manufacturers and retailers
Uncover profit pools
Pivot to needs / wants
In-store activities
Leverage technology
▪ Evaluate improving margins of key (highest volume) items
▪ Differentiated items consumed by financially secure consumers may have pricing upside
▪ Leverage new elasticities ▪ Innovation to find emerging and on-trend benefits ▪ “Fix” promotion activities
▪ Qualitatively, themes below seemed related to level of price changes—leverage:
○ Self and family care ○ Indulgence / hedonic value (fun) ○ Evolving relevance of benefits
▪ Reexamine basket builders
▪ Drive traffic by “bin-tastic” (illustrative idea, see next page) promotions at register
▪ Fewer but concentrated displays (impulse purchases) ▪ Configure store for efficient trips (and use other levers to
drive basket size) and traffic builders
Safety oriented apps: ▪ Measure crowdedness (when to shop) ▪ Social distance alerts (infractions) ▪ Identify trip staples + in-person for fill in (hybrid trips)
Uncover revenue opportunities with changing market dynamics
Implication: Sales and marketing activities need to focus on bringing consumers into the store (ensure safety, hybrid trip, etc.) and driving basket size & impulse purchases (promotions, etc.).
a
© 2021 Nielsen Consumer LLC. All Rights Reserved. 36
Thought starters and illustrative ideas
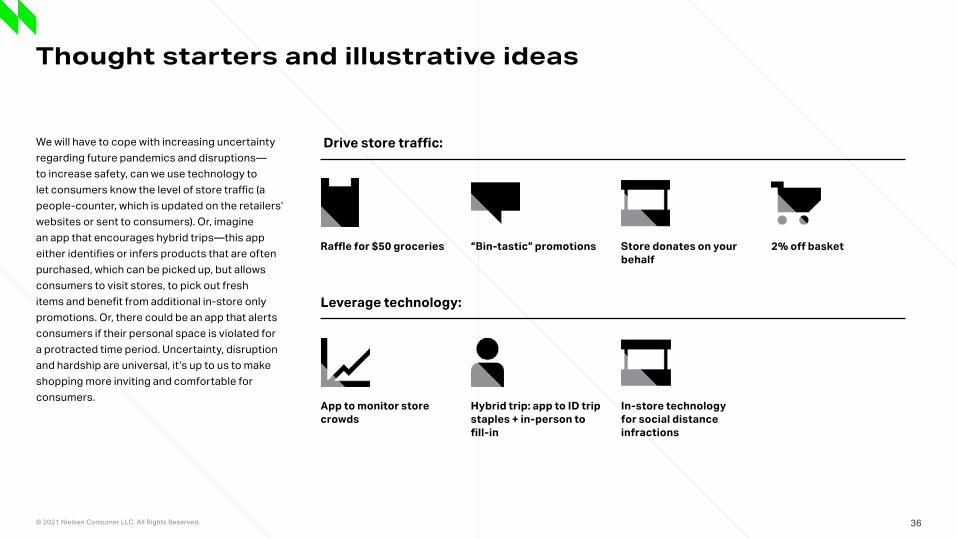
We will have to cope with increasing uncertainty regarding future pandemics and disruptions—to increase safety, can we use technology to let consumers know the level of store traffic (a people-counter, which is updated on the retailers’ websites or sent to consumers). Or, imagine an app that encourages hybrid trips—this app either identifies or infers products that are often purchased, which can be picked up, but allows consumers to visit stores, to pick out fresh items and benefit from additional in-store only promotions. Or, there could be an app that alerts consumers if their personal space is violated for a protracted time period. Uncertainty, disruption and hardship are universal, it’s up to us to make shopping more inviting and comfortable for consumers.
Drive store traffic:
Leverage technology:
Raffle for $50 groceries
App to monitor store crowds
Store donates on your behalf
In-store technology for social distance infractions
“Bin-tastic” promotions
Hybrid trip: app to ID trip staples + in-person to fill-in
2% off basket

© 2021 Nielsen Consumer LLC. All Rights Reserved.
About NielsenIQArthur C. Nielsen, who founded Nielsen in 1923, is the original name in consumer intelligence. After decades of helping companies look to the future, we are setting the foundation for our future by becoming NielsenIQ. We continue to be the undisputed industry leaders as evidenced by our experience and unmatched integrity. As we move forward, we are focused on providing the best retail and consumer data platform, enabling better innovation, faster delivery, and bolder decision-making. We are unwavering in our commitment to these ideals and passionate about helping clients achieve success. For more information, visit: niq.com.