Embed Size (px)
Citation preview

80%
40%
U.S. Mobile Benchmark Report ADOBE DIGITAL INDEX | 2014

Report based on aggregate and anonymous data across retail, media, entertainment, !nancial service, and travel websites.
Behavioral data from Adobe Marketing Cloud solutions; website traffic trends via Adobe Analytics and mobile app usage pa#erns from Adobe Mobile Services. • 18+ billion visits to U.S. consumer facing websites in June, 2014.
• More than 1 trillion visits since 2008.
• 700 million mobile app use sessions.
• 10,000+ US websites and apps under measurement.
Survey (Sentiment) Data: • Over 3000 mobile users spread across US, Canada, UK, France & Germany.
• Over 100 mobile marketers working for US companies.
ADOBE DIGITAL INDEX | U.S. Mobile Benchmark Report - 2014
©2014 Adobe Systems Incorporated. All rights reserved. Adobe and the Adobe logo are either registered trademarks or trademarks of Adobe Systems Incorporated in the United States and/or other countries. Android is a trademark of Google Inc. Windows is either a registered trademark or a trademark of Microso$ Corporation in the United States and/or other countries. iOS and iPhone are trademarks of Apple Inc, registered in the US and other countries. All other trademarks are the property of their respective owners.
Methodology

1. iPhone screen size has to increase: Without the introduction of a larger phone, Apple’s browser share will decline further. Consumers prefer to browse on phones with 5” or larger screens. Browsing on 4” devices fell by 11% YoY.
2. Pinterest is the most mobile social network: Outpacing Facebook, Pinterest is the most mobile social network with 64% of its referred traffic coming from mobile browsers. Tumblr referrals produce the highest revenue per visit (RPV) from mobile devices – well ahead of Facebook.
3. iMessage sharing up 259%: Users of digital magazine apps use person-to-person article sharing via text messaging twice as o$en as sharing via Social. While iMessage sharing is up, sharing via Facebook is down 43%.
4. Cellular networks on decline: For the !rst time, more than 50% of web browsing via smartphones and 93% of browsing via tablets come from wi-!.
5. Bounce rates high on mobile: Bounce rates for referrals from social networks are much higher on mobile devices than desktops – 61% vs. 53%. Marketers are cautioned to track mobile ad bounce rates.
ADOBE DIGITAL INDEX | U.S. Mobile Benchmark Report - 2014
Key !ndings

BROWSING SHARE BY PHONE SIZE (MAY 2013 - MAY 2014)
< 4 INCHES_ > 4 INCHES
BROWSING SHARE PAGE VIEWS(JUNE 2007 - JUNE 2014)
PHONE
15%
10%
65%
TABLET
MOBILE WEB
Screen size and browsing share Without larger screen phone, Apple’s browser share will further decline. • Phones with larger screens (>4”) drive higher web traffic
than ever before.
• Browsing on smaller phones (≤4”) down over 11% YoY.
Tablet browsing has &a#ened. • A year ago, tablet browsing surpassed smartphones and
was expected to continue to outpace smartphones.
• Consumers choose to browse more on bigger screen phones now than tablets.
ADOBE DIGITAL INDEX | U.S. Mobile Benchmark Report - 2014

MOBILE WEB
Mobile browsers Chrome has grown at the expense of Safari and Android Browser. • Chrome’s share up 5.7%.
• Safari’s share fell by 2.6%.
• Android Browser’s share fell 0.9%.
Safari still drives more traffic than all other mobile browsers combined.
ADOBE DIGITAL INDEX | U.S. Mobile Benchmark Report - 2014
30%
60%
10%
SAFARI ANDROID CHROME OTHEROPERA INTERNET EXPLORER
MOBILE BROWSER SHARE(DECEMBER 2013 - MAY 2014)
MOBILE BROWSER SHARE(APRIL 2014) 2.6%
SAFARI
5.7%CHROME
+
-
59.1%
14.3%
20.3%
1.8%2.8%
1.8%

SIORHEOT
DEVICE USE BY OS
DEVICE USE BY MANUFACTURER
80%TABLET
54%SMARTPHONE
IOSANDROID ANDROID OTHER
APPLE SAMSUNG LG HTCNOKIA ZTE
MOTOROLAAMAZON GOOGLE OTHER
40% 40%
SMARTPHONE TABLET
54% 80%
24%
7%5%
6%
1%
5%
3%
2%
5%2%
6%
MOBILE WEB
Browsing share by device manufacturer Apple still drives the majority of mobile visits to U.S. websites. • iPhone drives 54% of smartphone traffic.
• iPad drives 80% of tablet traffic.
Samsung is #2 for both smartphone and tablets. • Besides Apple, Samsung users browse more than all other
smartphone users combined.
3rd place is up for grabs. • Amazon tablets are the third most popular with 5% of visits.
• For Smartphones, LG follows Apple and Samsung.
ADOBE DIGITAL INDEX | U.S. Mobile Benchmark Report - 2014
MOBILE WEB
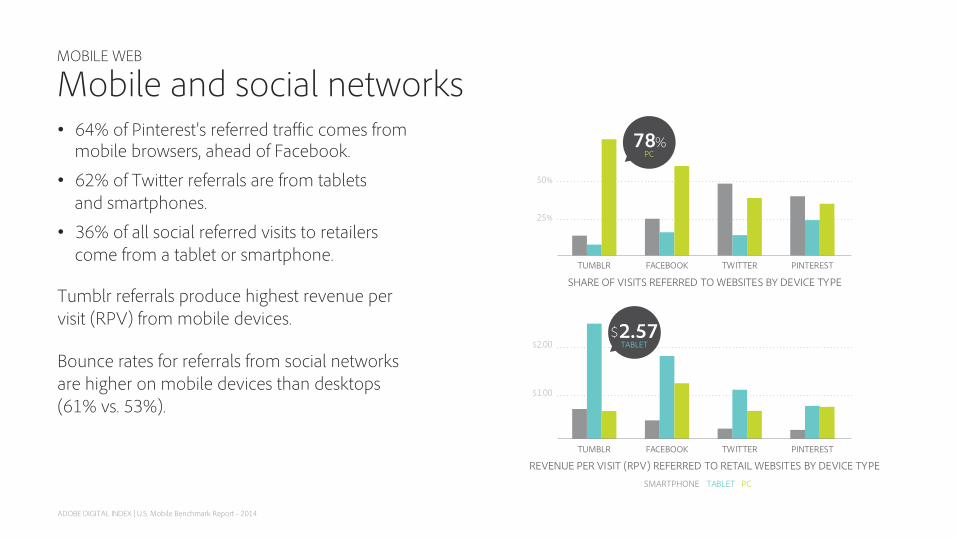
Mobile and social networks • 64% of Pinterest’s referred traffic comes from
mobile browsers, ahead of Facebook.
• 62% of Twi#er referrals are from tablets and smartphones.
• 36% of all social referred visits to retailers come from a tablet or smartphone.
Tumblr referrals produce highest revenue per visit (RPV) from mobile devices.
Bounce rates for referrals from social networks are higher on mobile devices than desktops (61% vs. 53%).
ADOBE DIGITAL INDEX | U.S. Mobile Benchmark Report - 2014
TESPINTER
50%
25%
$1.00
$2.00
SHARE OF VISITS REFERRED TO WEBSITES BY DEVICE TYPE
REVENUE PER VISIT (RPV) REFERRED TO RETAIL WEBSITES BY DEVICE TYPESMARTPHONE TABLET PC
TUMBLR FACEBOOK TWITTER PINTEREST
TUMBLR FACEBOOK TWITTE
78%PC
2.57TABLET
$
R

MOBILE APPS
Content sharing Personalized content sharing (text messaging, email) is more popular than group sharing via Social – 70% vs. 30%. • iMessage sharing up 259%.
• Pinterest sharing up 131%.
• Email sharing up 5.2%.
• Facebook sharing down 42.6%.
• URL link sharing down 26.8%.
• Twi#er sharing down 22.6%.
ADOBE DIGITAL INDEX | U.S. Mobile Benchmark Report - 2014
50%
30%
70%
25%
EMAIL iMESSAGE LINK (URL) FACEBOOK PINTEREST TWITTER
DIGITAL MAGAZINE SOCIAL SHARING ME THODS
Q3 201 4 2013 Q1 201 2 2014
PERSONALIZED MESSAGE GROUP MESSAGE
Q3 201 4 2013 Q1 201 2 2014
259%iMESSAGE
Sharing behavior is progress towards a
more personalized experience.
Q Q
3
3
4
4

MOBILE WEB
Cellular vs. wi-! As cell data charges increase, more consumers choose to browse via wi-!. • Over 50% of smartphone browsing now comes from wi-!.
• 93% of tablet browsing uses wi-! rather than cellular data.
ADOBE DIGITAL INDEX | U.S. Mobile Benchmark Report - 2014
SMARTPHONE TABLET
93%
50%
40%
JANUARY 2013
JUNE 2014
PHONE BROWSING BY CONNECTION TYPE (JANUARY 2013 - JUNE 2014)
CELL WIFI
7%43%
57%

MOBILE SURVEY
Mobile geo targeting trends iBeacons and Geo targeting are becoming mainstream. • iBeacons: 18% of mobile marketers already use Apple
iBeacons (Expected to double in ’15 to 36%).
• Geo targeting (GPS): 49% of marketers already use device position to deliver content (37% plan to add it over next 12 months).
“Mobile Elite” user trends. • 22% used mobile wallets in last 3 months (14% of average
mobile users).
• 13% used apps with augmented reality in last 3 months (9% of average mobile users).
• 36% used mobile assisted in-store shopping (33% of average mobile users).
ADOBE DIGITAL INDEX | U.S. Mobile Benchmark Report - 2014
of marketers already use device position to
deliver content.
REQUEST GPS LOACTION DATA USE OF iBEACON TECHNOLOGY
NO, AND NO PLANS TO USE IN NEXT 12 MONTHS NOT SURECURRENTLY USING NO, BUT PLAN TO USE IN NEXT 12 MONTHS
36%
28%
49%
37%
8%
7%
18%
17%
49%

10%
CURRENTLY AVAILABLE FOR DOWNLOAD PER ORGANIZATION(n=103, mean:*19)
NONE 1-10 APPS 11-20 APPS 21-40 APPS 41-60 APPS >60 APPS
53%1-10 APPS
MOBILE SURVEY
Mobile app publishing trends • 53% of companies have 1-10 mobile apps (17% have 40+
mobile apps for download).
• iOS apps lead with 67% of respondents publishing to the Apple App Store (Google Play 61%).
• Only 3% of companies admit to only refreshing mobile apps annually or less o$en.
On average, mobile marketers spend: • $5.5 million/year on mobile app.
• $4.9 million/year on mobile websites.
ADOBE DIGITAL INDEX | U.S. Mobile Benchmark Report - 2014