Embed Size (px)
Citation preview

2017 1Q Sponsored by
US PE Middle Market
ReportIn partnership with
Built solid.Communicate. Commit. Deliver.®
Since 2001, our record speaks for itself...
billion of net commitments new transactions private equity sponsors
of transactions closed as Administrative Agent, Sole Lender or Co-Agent since 2012
MANUFACTURING | DISTRIBUTION | SERVICES | CONSUMER PRODUCTS | HEALTHCARE | INSURANCE/FINANCIAL SERVICES | AEROSPACE & DEFENSE | TECHNOLOGY SERVICES
Madison Capital Funding LLC is a subsidiary of New York Life Insurance Company. MCF-1732377© 2017 New York Life Investment Management LLC. All rights reserved.
* As of March 31, 2017
170-year commitment
exceptional success for ourselves and our partners.

Credits & ContactPitchBook Data, Inc.
JOHN GABBERT Founder, CEO
ADLEY BOWDEN Vice President,
Market Development & Analysis
Content
DYLAN E. COX Analyst
BRYAN HANSON Data Analyst
NIZAR TARHUNI Analysis Manager
GARRETT JAMES BLACK Publisher
JENNIFER SAM Senior Graphic Designer
Contact PitchBook pitchbook.com
RESEARCH
EDITORIAL
SALES
COPYRIGHT © 2017 by PitchBook Data, Inc. All rights reserved. No part of this publication may be reproduced in any form or by any means—graphic, electronic, or mechanical, including photocopying, recording, taping, and information storage and retrieval systems—without the express written permission of PitchBook Data, Inc. Contents are based on information from sources believed to be reliable, but accuracy and completeness cannot be guaranteed. Nothing herein should be construed as any past, current or future recommendation to buy or sell any security or an offer to sell, or a solicitation of an offer to buy any security. This material does not purport to contain all of the information that a prospective investor may wish to consider and is not to be relied upon as such or used in substitution for the exercise of independent judgment.
Methodology 4
Introduction 5
Overview 6-7
Deals by Middle-Market Segment 8
Company Inventory 9
Exits 10
Fundraising 11
League Tables 12
CONTENTS
The PitchBook PlatformThe data in this report comes from the PitchBook Platform–our
data software for VC, PE and M&A. Contact [email protected]
to request a free trial.
IN PARTNERSHIP WITH
CO-SPONSOR3 PITCHBOOK 1Q 2017 US PE MIDDLE MARKET REPORT

METHODOLOGY
Madison Capital, founded in 2001, and headquartered in Chicago, Illinois, is a premier finance company focused exclusively on the corporate financing needs of middle market private equity firms. Madison Capital has closed transactions with over 255 different private equity firms and provides enterprise-value
leveraged financing for leveraged buyouts, management buyouts, add-on acquisitions and recapitalizations. Madison Capital Funding LLC is a subsidiary of New York Life Insurance Company. Additional information may be found at: www.mcfllc.com
IN PARTNERSHIP WITH
CO-SPONSOR4 PITCHBOOK 1Q 2017 US PE MIDDLE MARKET REPORT
MIDDLE MARKET DEFINITIONFor this report, the middle market (MM) is defined as US-based companies acquired through buyout transactions between $25 million and $1 billion. Note that minority deals are not included. The middle market is further broken down into the lower middle market (LMM; $25 million to $100 million), the core middle market (CMM; $100 million to $500 million) and the upper middle market (UMM; $500 million to $1 billion). The lower bound of each range is inclusive of deals that are that exact amount, e.g. a transaction that is $100 million in size will be bucketed into the CMM rather than the LMM. This report covers only US-based middle-market companies that have received some type of private equity investment.
TOTAL CAPITAL INVESTED/DEAL VALUETotal amount of equity and debt used in the private equity investment
Ex. $10 million of equity and $20 million of debt = $30 million of total capital investment
PitchBook’s total capital invested figures include deal amounts that were not collected by PitchBook but have been estimated using a multidimensional estimation matrix, which takes into account year of investment, deal type, platform v. add-on, industry and sector. Some datasets will include these extrapolated numbers while others will be compiled using only data collected directly by PitchBook; this explains any potential discrepancies that may be noticed.
EXITSThe report includes both full and partial exits of middle-market companies via corporate acquisition, secondary private equity buyout and initial public offering (IPO). PitchBook has utilized its multidimensional substitution and estimation matrix to estimate transaction sizes where the deal amount is unknown. For the MM company inventory, we included companies that are expected to exit between $25 million and $1 billion.
FUNDRAISINGPitchBook defines middle-market funds as PE investment vehicles with between $100 million and $5 billion in capital commitments. The report only includes PE funds that have held their final close. Funds-of-funds and LP secondary funds are not included.
LEAGUE TABLESAll league tables are compiled using deal counts for middle-market leveraged buyouts only to better reflect the other datasets within the report, with only the Lenders table also including all PitchBook debt round types in order to capture all debt provided to facilitate buyouts. For example, the Most Active Advisors league table shows the number of US-based middle-market buyouts that a firm advised on during the fourth quarter of 2016. Deals on which a firm advised multiple parties will only be counted once for that firm.

INTRODUCTION
Look up a company.
And its cap table.
And its investors.
And its EBITDA
multiples.
And its board
members.
In seconds.
The PitchBook Platform
has the data you need
to close your next deal.
Learn more at
pitchbook.com
Key takeaways
» Concerns surrounding trade policy and poor earnings performance
hampered middle-market private equity deal flow in the B2C sector last
quarter.
» IT companies comprised one-fifth of all middle-market PE deals. IT is now
the second most common industry behind B2B.
» PE firms recorded a second consecutive quarter of strong fundraising
performance, totaling $34.95 billion across 40 vehicles.
» Exit activity was at its lowest level in nearly four years, though the IPO
avenue returned to prominence.
In 2016, PE firms flocked toward the lower middle market to find suitable add-
ons and buyouts at relatively lower valuations. However, the first quarter of this
year was marked by larger middle-market deals as firms sought to deploy newly
raised capital in larger chunks. Though multiples remain high and quality targets
sparse, discerning investors are finding ways to complete deals and limited
partners are nothing but exuberant when it comes to fundraising.
We hope this report is useful in your practice. As always, feel free to send any
questions or comments to [email protected].
DYLAN E. COX
Analyst
IN PARTNERSHIP WITH
CO-SPONSOR
5 PITCHBOOK 1Q 2017 US PE MIDDLE MARKET REPORT

MACRO PUSHES PE TO THE MIDDLE MARKETOverview
Dry powder drives larger deals
Middle-market-focused PE firms
exhibited a penchant for making
larger deals in the first quarter. After
two consecutive years of decreases,
median deal size soared to $238.5
million in 1Q 2017. The shift is driven
in part by the larger funds raised over
the last few years, particularly in 2015,
when the average size of middle-
market buyout funds reached $790.2
million, the highest in six years. These
larger funds have led to heightened
levels of dry powder, which stood at
a record $552.6 billion in the US as of
3Q 2016. With well-stocked coffers
and influenced by the guise of an
improved economic outlook, MM PE
firms are chasing larger targets to
deploy more capital across a similar
number of deals. Concurrently, the
Immediately following a temporary resurgence, activity decisively slides
US PE middle-market activity
Source: PitchBook
$47
$52
$53
$85
$67
$67
$66
$75
$70
$70
$70
$107
$71
$59
$81
$89
$115
$104
$115
$113
$94
$102
$100
$104
$89
$96
$85
$87
$91
541
422
1Q 2Q 3Q 4Q 1Q 2Q 3Q 4Q 1Q 2Q 3Q 4Q 1Q 2Q 3Q 4Q 1Q 2Q 3Q 4Q 1Q 2Q 3Q 4Q 1Q 2Q 3Q 4Q 1Q
2010 2011 2012 2013 2014 2015 2016 2017
Deal Value ($B)
# of Closed Deals
Driven by sample size and dry powder, median deal size surges
Median US PE middle-market transaction size ($M)
$128.3
$238.5
$0
$50
$100
$150
$200
$250
$300
2006 2007 2008 2009 2010 2011 2012 2013 2014 2015 2016 2017*2017*
Source: PitchBook. *As of 3/31/2017
already high multiples across M&A are
prying larger equity checks out of PE
funds’ hands—a trend we believe could
negatively affect future returns.
IN PARTNERSHIP WITH
CO-SPONSOR6 PITCHBOOK 1Q 2017 US PE MIDDLE MARKET REPORT

IT deals boom on strong mid-market
earnings
Further contributing to the increase
in deal size in the first quarter was
PE’s interest in the tech sector. 20.1%
of all MM PE deals so far this year
have involved companies in the IT
industry, which have been historically
larger than those in the B2C, B2B or
healthcare sectors (all of which saw
quarter-over-quarter decreases in
PE deal flow). Software companies,
many of which have developed stable
annual recurring revenue via SaaS
models, have become popular targets
for PE lately and accounted for 15.4%
of all middle-market PE transactions
in the first quarter. The increase in
activity is due in part to strong recent
performance by the sector, reassuring
PE firms that they’re not investing
in risky moonshots. Middle-market
IT companies experienced 11.06%
earnings growth during the first two
months of the year, according to the
Golub Capital Altman Index (GCAI). In
addition, the IT sector has penetrated
a larger portion of the economy
overall, as more goods and especially
services can be provided with new
technologies. Thus, we’ve witnessed
the development of an entire financial
ecosystem specializing in IT, including
investors, lenders, diligence firms and
other service providers.
Meanwhile, B2C recedes amidst
trade uncertainty, poor earnings
performance
PE deal flow in the consumer sector
has been hampered by concerns
about a possible border-adjustment
tax or other trade policies that
would reduce unit economics in the
industry. Compounding these worries,
the industry is already struggling
with changing consumer tastes and
rising costs, which have compressed
margins. Middle-market consumer
companies experienced an 8.45%
decrease in earnings during the first
two months of the year, despite high
consumer confidence indicators,
according to the GCAI. Just 79
PE deals totaling $12.1 billion were
completed in the first quarter—32.6%
and 36.2% behind last year’s pace,
respectively.
After robust years, a slower start to 2017
US PE middle-market activity
Source: PitchBook. *As of 3/31/2017
$275
$336
$194
$93
$237
$276
$316
$300
$447
$399
$357
$91
1,464
1,842
1,292
710
1,292 1,477
1,891
1,709
2,186 2,180 2,123
422
2006 2007 2008 2009 2010 2011 2012 2013 2014 2015 2016 2017*
Deal Value ($B) # of Deals Closed
US PE MM deals (#) by sector US PE MM deals ($) by sector
0%
10%
20%
30%
40%
50%
60%
70%
80%
90%
100%
2010 2011 2012 2013 2014 2015 2016 2017*
Materials &Resources
IT
Healthcare
FinancialServices
Energy
B2C
B2B
0%
10%
20%
30%
40%
50%
60%
70%
80%
90%
100%
2010 2011 2012 2013 2014 2015 2016 2017*
Materials &Resources
IT
Healthcare
FinancialServices
Energy
B2C
B2B
Source: PitchBook. *As of 3/31/2017
Source: PitchBook. *As of 3/31/2017
IN PARTNERSHIP WITH
CO-SPONSOR7 PITCHBOOK 1Q 2017 US PE MIDDLE MARKET REPORT

Plenty of accessible capital and competition push up prices
US PE UMM deal flow
Source: PitchBook. Transactions sized between $25 million and
$100 million comprise the lower middle market.
AN UPPER END SURGEDeals by middle-market segment
UMM investment rises, spurred by pricing pressures and cyclicality.
Select US UMM PE deals in 1Q 2017
Company Investor(s)Deal Size ($M)
SunGard Public Sector
Vista Equity Partners
$850
SM Energy (Non-operated Eagle Ford Assets)
EnCap Investments, KKR, Riverstone Holdings
$800
DeVilbiss Healthcare
Clayton, Dubilier & Rice
$800
Surgical Specialties
Vivo Capital, ZQ Capital
$505
Blue NileBain Capital, Bow Street, Adama Partners
$500
Source: PitchBook
A contested middle ground subject to volatility
US PE CMM activity
A decline partially due to pricing pressures
US PE LMM activity
$10.
5
$7.1
$6.2
$7.2
$8.2
$9.5
$6.3
$5.9
$13.
5
$8.1
$9.1
$5.2
$5.3
220
177 174 162 174
235
186 165
272
206 186
177
147
1Q 2Q 3Q 4Q 1Q 2Q 3Q 4Q 1Q 2Q 3Q 4Q 1Q
2014 2015 2016 2017
Deal Value ($B) # of Deals Closed
$59
$52
$46
$63
$54
$37
$45
$37
$44
$44
$41
$38
$34
306
268
274 282 277
197
282 275
227
262
218
266
165
1Q 2Q 3Q 4Q 1Q 2Q 3Q 4Q 1Q 2Q 3Q 4Q 1Q
2014 2015 2016 2017
Deal Value ($B) # of Deals Closed
Source: PitchBook. Transactions sized between $100 million and
$500 million comprise the lower middle market.
$37
$19
$32
$32
$45
$44
$63
$43
$31
$55
$48
$60
$31
$43
$35
$44
$51
69
31
57 6169 74
118
63
51
106
103
131
60
85
64
98110
1Q 2Q 3Q 4Q 1Q 2Q 3Q 4Q 1Q 2Q 3Q 4Q 1Q 2Q 3Q 4Q 1Q
2013 2014 2015 2016 2017
Deal Value ($B)
# of Deals Closed
Source: PitchBook. Transactions sized between $500 million
and $1 billion comprise the upper middle market.
IN PARTNERSHIP WITH
CO-SPONSOR8 PITCHBOOK 1Q 2017 US PE MIDDLE MARKET REPORT
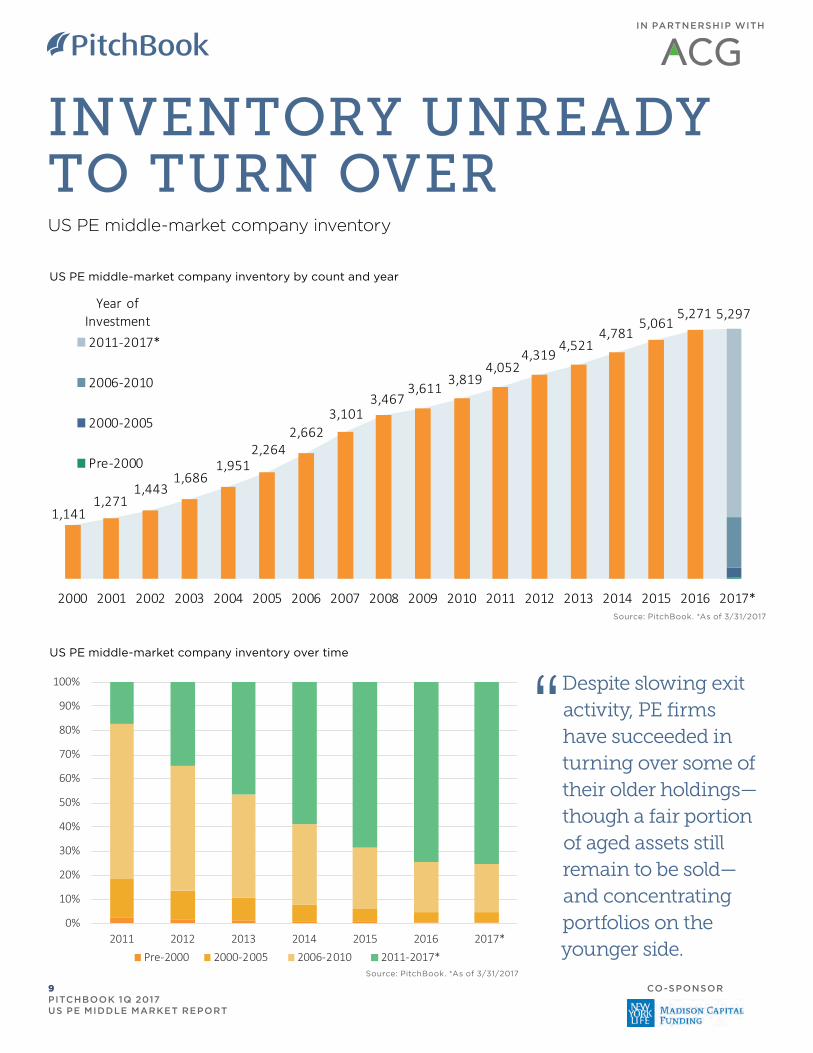
INVENTORY UNREADY TO TURN OVERUS PE middle-market company inventory
US PE middle-market company inventory by count and year
Despite slowing exit activity, PE firms have succeeded in turning over some of their older holdings—though a fair portion of aged assets still remain to be sold—and concentrating portfolios on the younger side.
1,1411,271
1,4431,686
1,9512,264
2,6623,101
3,4673,611
3,8194,052
4,3194,521
4,7815,061
5,271 5,297
2000 2001 2002 2003 2004 2005 2006 2007 2008 2009 2010 2011 2012 2013 2014 2015 2016 2017*
2011-2017*
2006-2010
2000-2005
Pre-2000
Year of Investment
Source: PitchBook. *As of 3/31/2017
US PE middle-market company inventory over time
0%
10%
20%
30%
40%
50%
60%
70%
80%
90%
100%
2011 2012 2013 2014 2015 2016 2017*Pre-2000 2000-2005 2006-2010 2011-2017*
Source: PitchBook. *As of 3/31/2017
IN PARTNERSHIP WITH
CO-SPONSOR9 PITCHBOOK 1Q 2017 US PE MIDDLE MARKET REPORT

A COMING DROUGHT?US PE-backed middle-market exits
Early stages of a drought, IPOs bounce
back
In the first quarter of the year, middle-
market PE experienced its slowest
quarter of exits in nearly four years.
Most investments made prior to 2008
have already been exited and the bulk
of inventory purchased between 2014
and 2016 is not yet ready for a sale.
Thus, the PE exit environment has
hit the early stages of a drought. The
median hold time for a MM company
in 2016 was 5.2 years, which means
the faucet will likely be restricted to
its current trickle for the next one to
two years. This lack of PE-backed
companies coming to market could
pose problems for MM firms who
have recently raised a fund and tend
to source their deals via secondary
buyout.
SBOs continue to predominate by count
US PE-backed MM exits (#) by type
2014 and 2015 were boom years, 2016 slowed, is 2017 set for a drought?
US PE-backed middle-market exits
PE buyers reap value from all avenues
US PE-backed MM exits ($B) by type
$73
$88
$45
$28
$77
$81
$92
$75
$122
$111
$87
$15
616
748
495
296
670752
906
830
1,089 1,075
927
180
2006 2007 2008 2009 2010 2011 2012 2013 2014 2015 2016 2017*
Exit Value ($B)
# of Exits
Source: PitchBook. *As of 3/31/2017
$0
$50
$100
$150
$200
$250
$300
1Q 2Q 3Q 4Q 1Q 2Q 3Q 4Q 1Q 2Q
2014 2015 2016
Corporate Acquisi�on IPO Secondary Buyout
0
50
100
150
200
250
300
350
1Q 2Q 3Q 4Q 1Q 2Q 3Q 4Q 1Q 2Q 3Q 4Q 1Q
2014 2015 2016 17*
Corporate Acquisi�on IPO Secondary Buyout
Source: PitchBook. *As of 3/31/2017
$0
$5
$10
$15
$20
$25
$30
$35
1Q 2Q 3Q 4Q 1Q 2Q 3Q 4Q 1Q 2Q 3Q 4Q 1Q
2014 2015 2016 17*
Corporate Acquisi�on IPO Secondary Buyout
Source: PitchBook. *As of 3/31/2017
Though the market overall may be
dry, PE investors rode a wave of IPO
activity through the first quarter.
Fueled by a backlog of companies that
had postponed their initial offerings in
a rocky first half of 2016, 12 PE-backed
IPOs of middle-market businesses were
completed in 1Q, the highest since 2Q
2015.
IN PARTNERSHIP WITH
CO-SPONSOR10 PITCHBOOK 1Q 2017 US PE MIDDLE MARKET REPORT

Four straight years of substantial fundraising do not show signs of
slowing yet
US PE middle-market fundraising by year
Much of capital raised was attributable to a surge of
mammoth funds
US MM funds ($) by size
After a steady trend upward in nascent sponsors, a
slow start to 2017
US first-time MM funds
Fundraising growth on the horizon
Mid-market PE firms turned in a
second consecutive quarter of strong
fundraising performance in the first
quarter. Limited partners committed
$34.95 billion across 40 pools, the
fourth-highest dollar value of any
quarter since the financial crisis. After
consistent growth from 2010 to 2014,
interest in new MM vehicles plateaued
for the last two years, but is now poised
for another period of growth. As more
capital funnels into the asset class
overall, MM firms will benefit not only
from LPs who specifically want MM
exposure, but also overflow capital
from institutional investors who do
not receive their desired allocations
from larger, oversubscribed funds.
Extrapolating first quarter data, capital
commitments are on track for a 19.3%
year-over-year increase.
$119
$121
$113
$76
$52
$87
$87
$106
$135
$120
$117
$35
169
193
172
98 95
118 118
169 177
166
174
40
2006 2007 2008 2009 2010 2011 2012 2013 2014 2015 2016 2017*
Capital Raised ($B) # of Funds Closed
$17
$19
$7 $10
$4 $8 $4 $2 $5 $5 $8
$1
27
35
2624
11
16
119
1517
23
3
2006 2007 2008 2009 2010 2011 2012 2013 2014 2015 2016 2017*
Capital Raised ($B)
# of Funds Closed
Source: PitchBook. *As of 3/31/2017
Source: PitchBook. *As of 3/31/2017
Source: PitchBook. *As of 3/31/2017
0%
10%
20%
30%
40%
50%
60%
70%
80%
90%
100%
2008 2009 2010 2011 2012 2013 2014 2015 2016 2017*
$100M-$250M $250M-$500M $500M-$1B $1B-$5B
INVESTORS STILL WANT EXPOSUREUS PE middle-market fundraising
IN PARTNERSHIP WITH
CO-SPONSOR11 PITCHBOOK 1Q 2017 US PE MIDDLE MARKET REPORT

MIDDLE MARKET
LEAGUE TABLES1Q 2017
HarbourVest Partners 12
Audax Group 11
ABRY Partners 10
CI Capital Partners 9
Genstar Capital 7
Maranon Capital 7
TA Associates Management 7
The Carlyle Group 7
American Securities 6
GTCR 6
Hellman & Friedman 6
Providence Equity Partners 6
AlpInvest Partners 5
Altamir 5
Apax Partners 5
Bain Capital 5
Blue Point Capital Partners 5
H.I.G. Capital 5
InTandem Capital Partners 5
Kohlberg Kravis Roberts 5
Littlejohn & Company 5
Most active investors by deal count
Source: PitchBook
Antares Capital 18
Madison Capital Funding 10
Golub Capital 7
Twin Brook Capital Partners 7
Monroe Capital 5
NXT Capital 5
Bank of America 4
Franklin Synergy Bank 4
Citizens Bank 3
Crescent Capital 3
Fifth Street 3
J.P. Morgan 3
Most active lenders by deal count
Source: PitchBook
Madison Dearborn Partners 5
Shore Capital Partners 5
The Blackstone Group 5
The Riverside Company 5
The Sterling Group 5
Warburg Pincus 5
Webster Capital 5
Most active investors, ctd.
Find out more
at pitchbook.com
This report sums up the big trends.
Dig into the details on the PitchBook Platform.
IN PARTNERSHIP WITH
CO-SPONSOR
12 PITCHBOOK 1Q 2017 US PE MIDDLE MARKET REPORT

See how the PitchBook Platform can
help your private equity firm close your
next deal.
We do EBITDA multiples,private comps,valuations,market trends,growth metrics.
You build a better portfolio.