Embed Size (px)
Citation preview
JPMorgan Healthcare Conference
January 13, 2015
Lupin Limited Transforming into a Global Major
Safe Harbor Statement
Materials and information provided during this presentation may contain ‘forward-looking
statements’. These statements are based on current expectations, forecasts and
assumptions that are subject to risks and uncertainties which could cause actual outcomes
and results to differ materially from these statements.
Risks and uncertainties include general industry and market conditions, and general
domestic and international economic conditions such as interest rate and currency exchange
fluctuations. Risks and uncertainties particularly apply with respect to product-related
forward-looking statements. Product risks and uncertainties include, but are not limited to,
technological advances and patents obtained by competitors. Challenges inherent in new
product development, including completion of clinical trials; claims and concerns about
product safety and efficacy; obtaining regulatory approvals; domestic and foreign healthcare
reforms; trends toward managed care and healthcare cost containment; and governmental
laws and regulations affecting domestic and foreign operations.
Also, for products that are approved, there are manufacturing and marketing risks and
uncertainties, which include, but are not limited to, inability to build production capacity to
meet demand, unavailability of raw materials, and failure to gain market acceptance.
The Company disclaims any intention or obligation to update or revise any forward-looking
statements whether as a result of new information, future events, or otherwise.
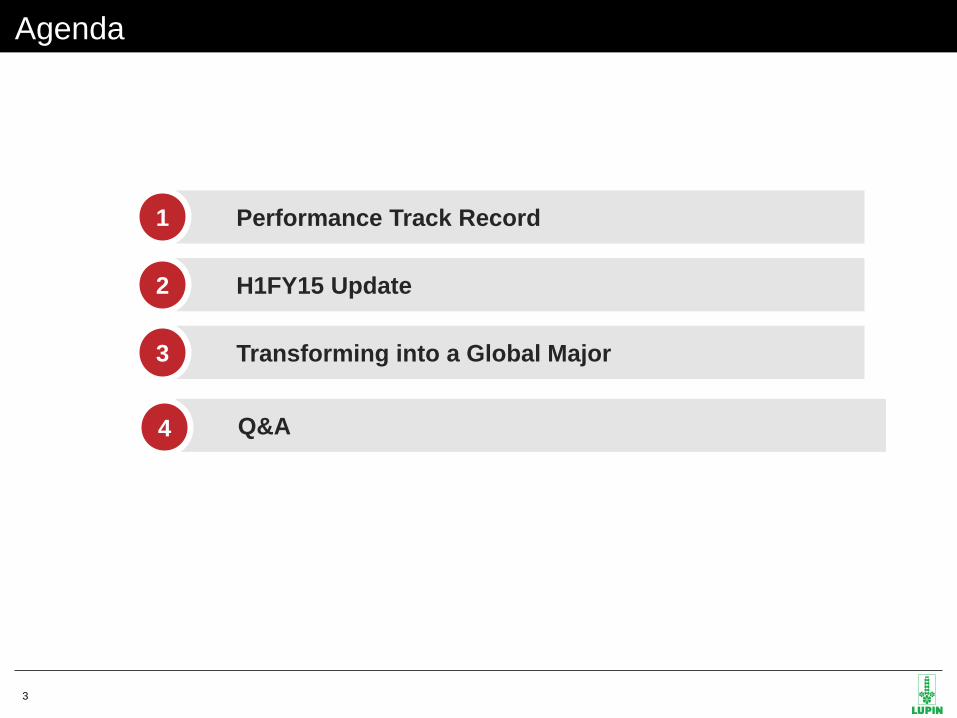
Agenda
Performance Track Record 1
Transforming into a Global Major 3
H1FY15 Update 2
Q&A 4
3

SECTION 1
PERFORMANCE TRACK
RECORD
4
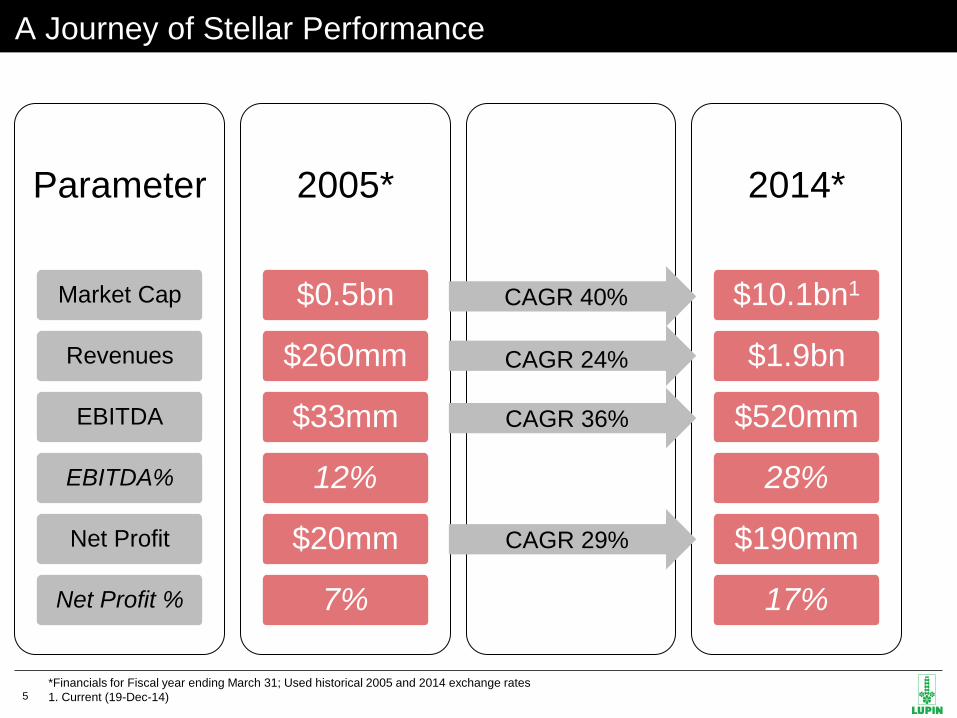
Parameter
Market Cap
Revenues
EBITDA
EBITDA%
Net Profit
Net Profit %
2005*
$0.5bn
$260mm
$33mm
12%
$20mm
7%
2014*
$10.1bn1
$1.9bn
$520mm
28%
$190mm
17%
A Journey of Stellar Performance
CAGR 40%
CAGR 24%
CAGR 36%
*Financials for Fiscal year ending March 31; Used historical 2005 and 2014 exchange rates
1. Current (19-Dec-14) 5
CAGR 29%
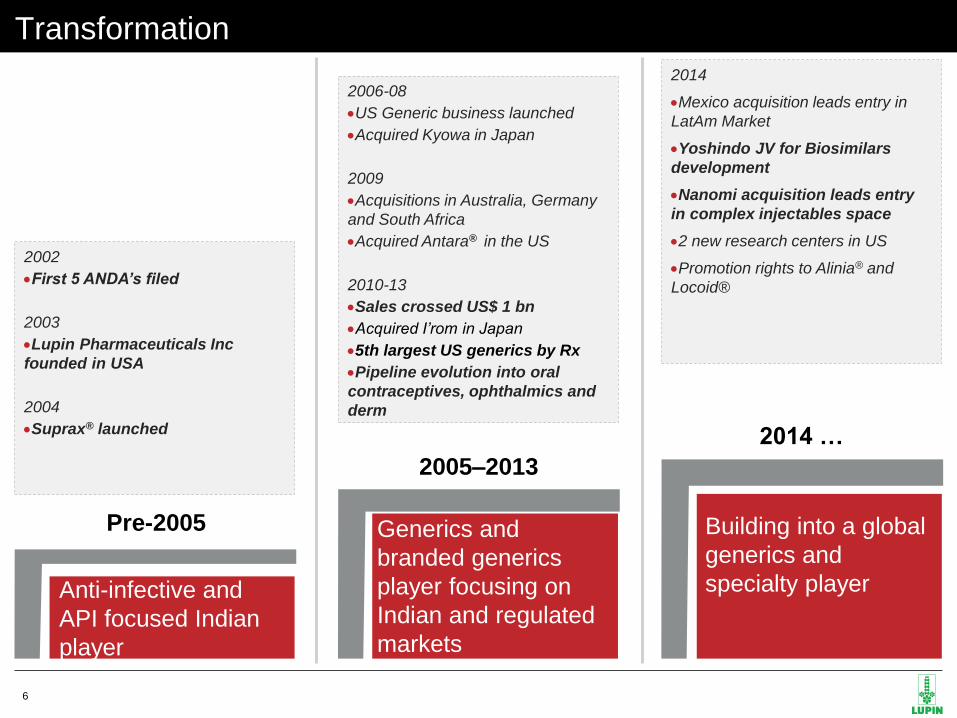
Transformation
Anti-infective and
API focused Indian
player
Pre-2005 Generics and
branded generics
player focusing on
Indian and regulated
markets
2005–2013
Building into a global
generics and
specialty player
2014 …
2002
First 5 ANDA’s filed
2003
Lupin Pharmaceuticals Inc
founded in USA
2004
Suprax® launched
2006-08
US Generic business launched
Acquired Kyowa in Japan
2009
Acquisitions in Australia, Germany
and South Africa
Acquired Antara® in the US
2010-13
Sales crossed US$ 1 bn
Acquired I’rom in Japan
5th largest US generics by Rx
Pipeline evolution into oral
contraceptives, ophthalmics and
derm
2014
Mexico acquisition leads entry in
LatAm Market
Yoshindo JV for Biosimilars
development
Nanomi acquisition leads entry
in complex injectables space
2 new research centers in US
Promotion rights to Alinia® and
Locoid®
6
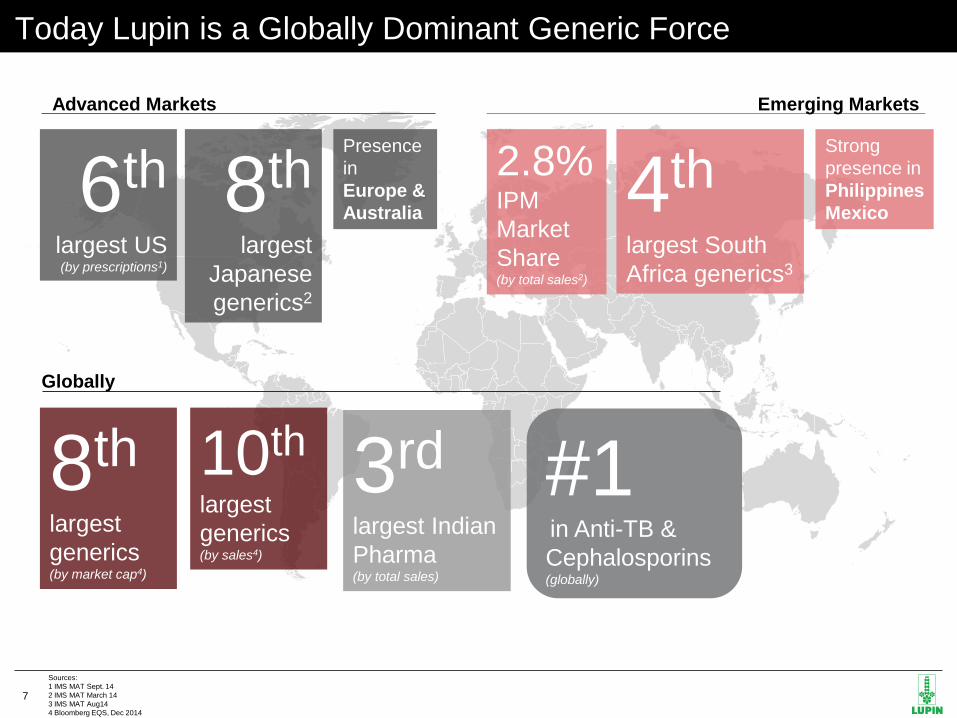
Today Lupin is a Globally Dominant Generic Force
8th
largest
generics (by market cap4)
3rd
largest Indian
Pharma (by total sales)
10th
largest
generics (by sales4)
Globally
2.8%
IPM
Market
Share (by total sales2)
4th
largest South
Africa generics3
Emerging Markets
6th
largest US (by prescriptions1)
8th
largest
Japanese
generics2
Advanced Markets
#1 in Anti-TB &
Cephalosporins (globally)
Sources:
1 IMS MAT Sept. 14
2 IMS MAT March 14
3 IMS MAT Aug14
4 Bloomberg EQS, Dec 2014
7
Presence
in
Europe &
Australia
Strong
presence in
Philippines
Mexico
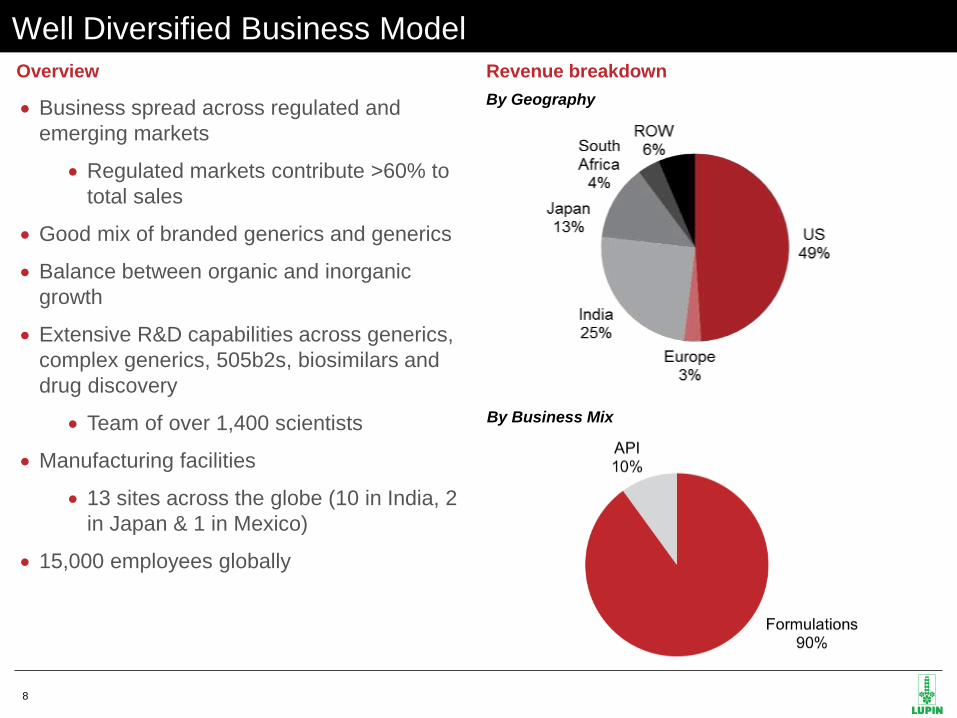
Well Diversified Business Model
Revenue breakdown
Business spread across regulated and
emerging markets
Regulated markets contribute >60% to
total sales
Good mix of branded generics and generics
Balance between organic and inorganic
growth
Extensive R&D capabilities across generics,
complex generics, 505b2s, biosimilars and
drug discovery
Team of over 1,400 scientists
Manufacturing facilities
13 sites across the globe (10 in India, 2
in Japan & 1 in Mexico)
15,000 employees globally
Overview
By Business Mix
By Geography
8
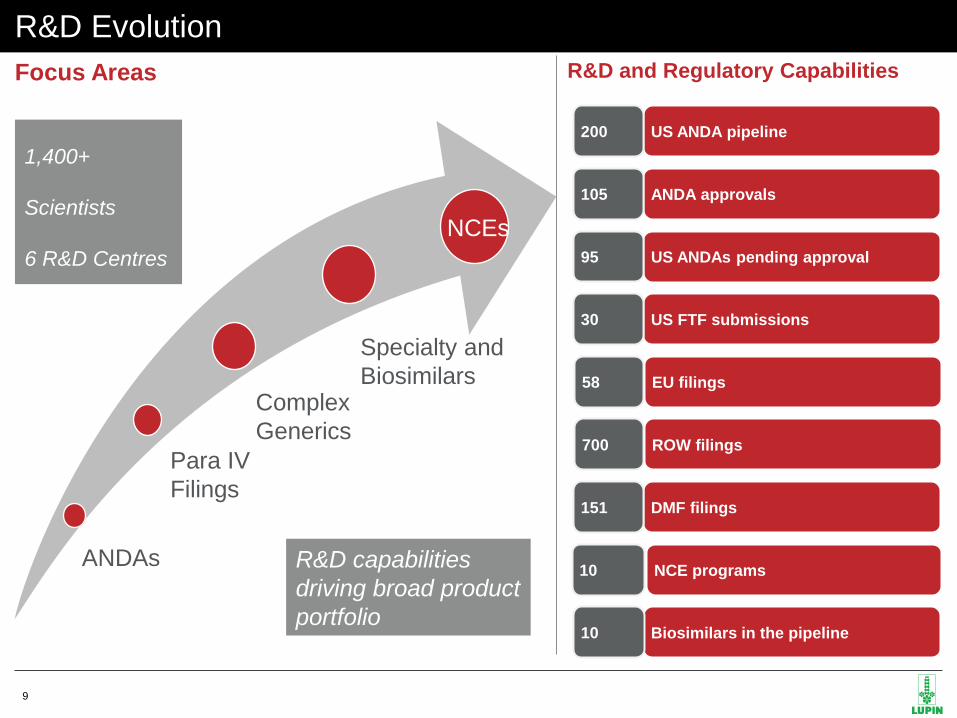
R&D Evolution
Focus Areas
NCE programs 10
US FTF submissions 30
R&D and Regulatory Capabilities
US ANDAs pending approval 95
US ANDA pipeline 200
ANDA approvals 105
ANDAs
Para IV
Filings
Complex
Generics
Specialty and
Biosimilars
NCEs
Biosimilars in the pipeline 10
DMF filings 151
1,400+
Scientists
6 R&D Centres
R&D capabilities
driving broad product
portfolio
EU filings 58
ROW filings 700
9

AD COMMENT: LET’S HAVE
ONLY H1 & NO Q2
H1FY15 UPDATE SECTION 2
10
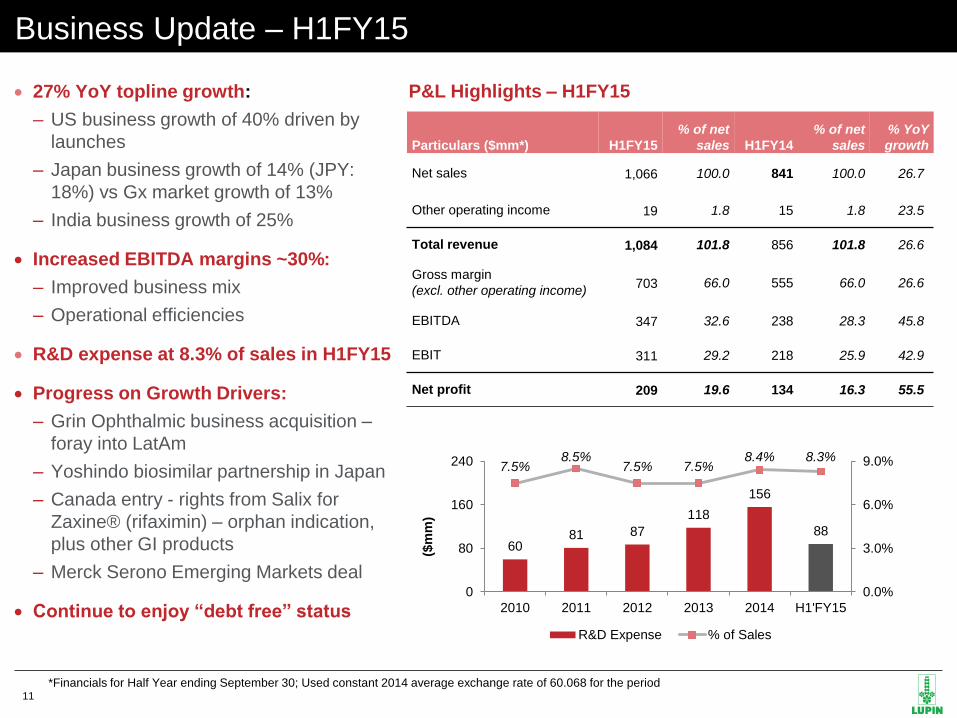
27% YoY topline growth:
– US business growth of 40% driven by
launches
– Japan business growth of 14% (JPY:
18%) vs Gx market growth of 13%
– India business growth of 25%
Increased EBITDA margins ~30%:
– Improved business mix
– Operational efficiencies
R&D expense at 8.3% of sales in H1FY15
Progress on Growth Drivers:
– Grin Ophthalmic business acquisition –
foray into LatAm
– Yoshindo biosimilar partnership in Japan
– Canada entry - rights from Salix for
Zaxine® (rifaximin) – orphan indication,
plus other GI products
– Merck Serono Emerging Markets deal
Continue to enjoy “debt free” status
Business Update – H1FY15
Particulars ($mm*) H1FY15
% of net
sales H1FY14
% of net
sales
% YoY
growth
Net sales 1,066 100.0 841 100.0 26.7
Other operating income 19 1.8 15 1.8 23.5
Total revenue 1,084 101.8 856 101.8 26.6
Gross margin
(excl. other operating income) 703 66.0 555 66.0 26.6
EBITDA 347 32.6 238 28.3 45.8
EBIT 311 29.2 218 25.9 42.9
Net profit 209 19.6 134 16.3 55.5
P&L Highlights – H1FY15
*Financials for Half Year ending September 30; Used constant 2014 average exchange rate of 60.068 for the period 11
60 81 87
118
156
88
7.5% 8.5%
7.5% 7.5% 8.4% 8.3%
0.0%
3.0%
6.0%
9.0%
0
80
160
240
2010 2011 2012 2013 2014 H1'FY15
($m
m)
R&D Expense % of Sales

AD COMMENT: LET’S HAVE
ONLY H1 & NO Q2
TRANSFORMING INTO A
GLOBAL MAJOR SECTION 3
12
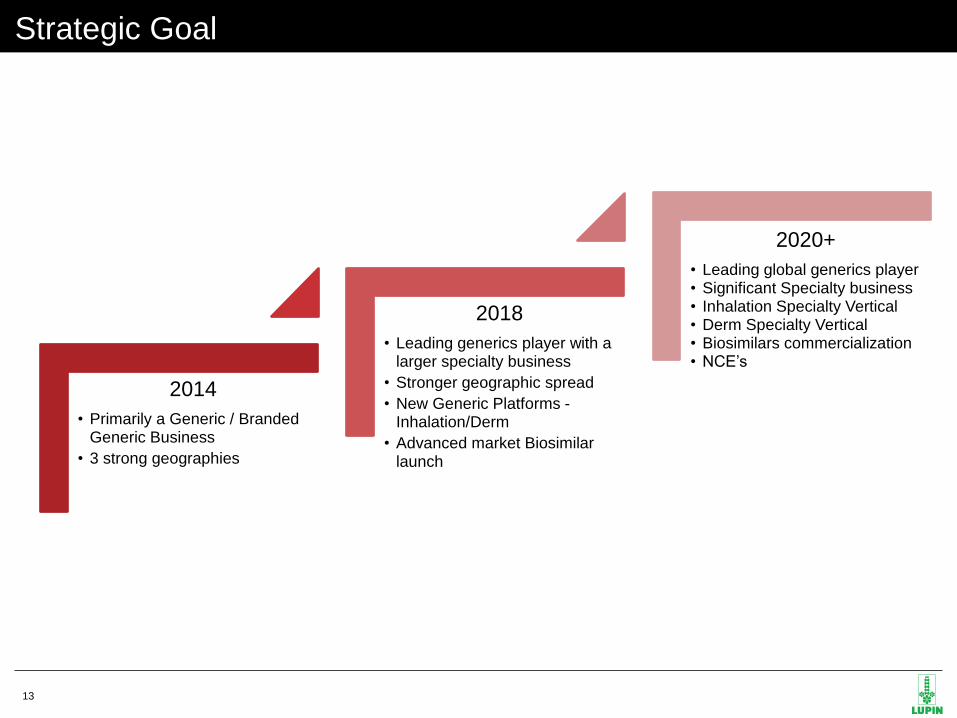
Strategic Goal
2014
• Primarily a Generic / Branded Generic Business
• 3 strong geographies
2018
• Leading generics player with a larger specialty business
• Stronger geographic spread
• New Generic Platforms - Inhalation/Derm
• Advanced market Biosimilar launch
2020+
• Leading global generics player • Significant Specialty business • Inhalation Specialty Vertical • Derm Specialty Vertical • Biosimilars commercialization • NCE’s
13
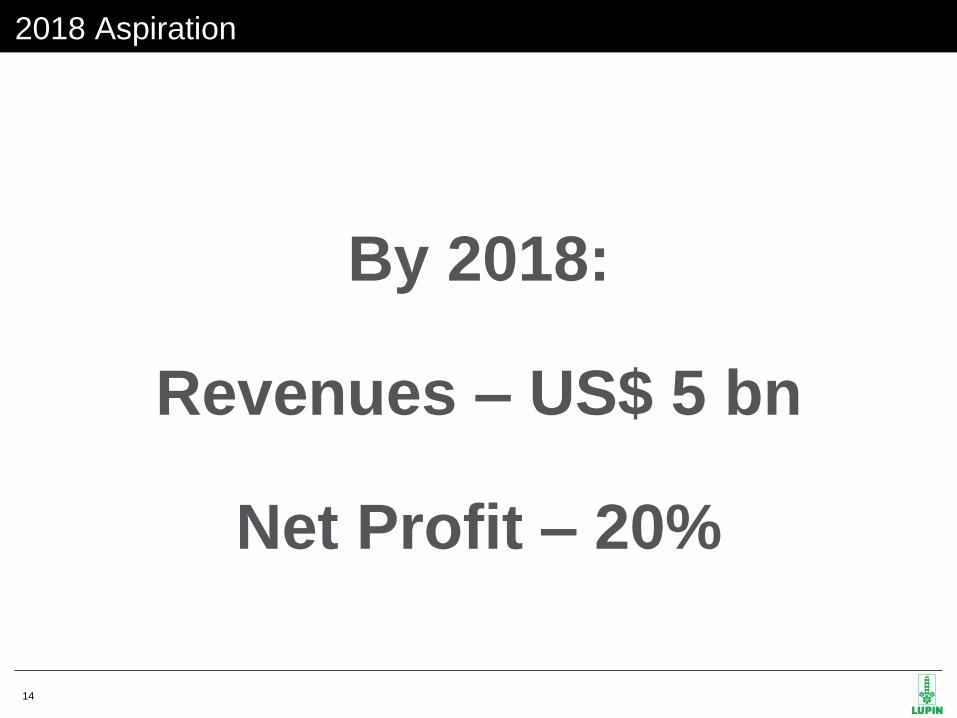
By 2018:
Revenues – US$ 5 bn
Net Profit – 20%
2018 Aspiration
14
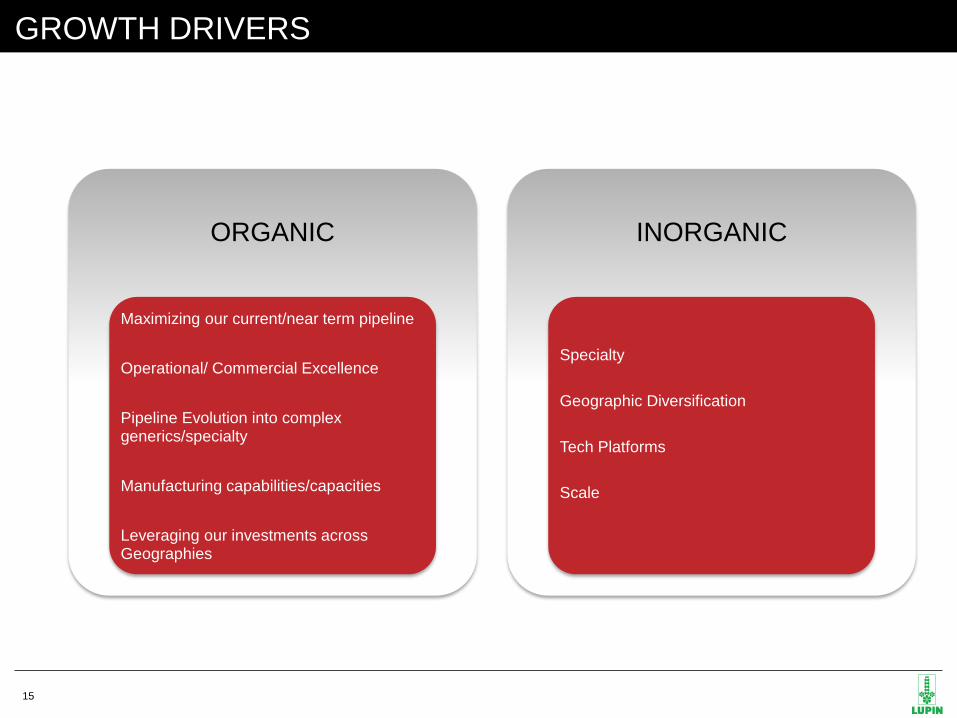
ORGANIC
Maximizing our current/near term pipeline
Operational/ Commercial Excellence
Pipeline Evolution into complex generics/specialty
Manufacturing capabilities/capacities
Leveraging our investments across Geographies
INORGANIC
Specialty
Geographic Diversification
Tech Platforms
Scale
GROWTH DRIVERS
15
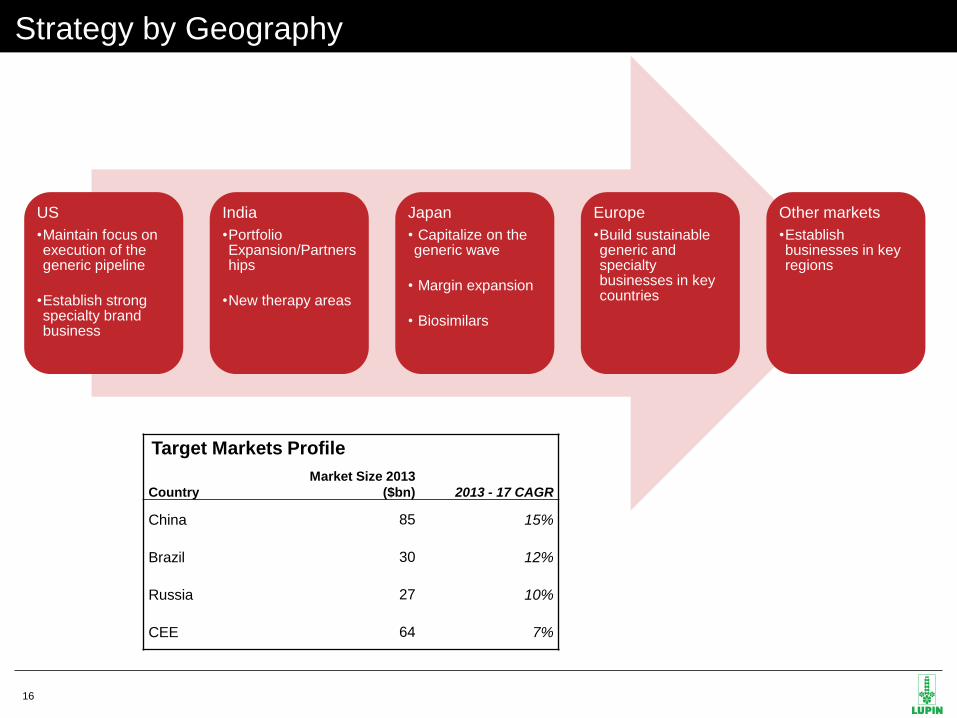
US
•Maintain focus on execution of the generic pipeline
•Establish strong specialty brand business
India
•Portfolio Expansion/Partnerships
•New therapy areas
Japan
• Capitalize on the generic wave
• Margin expansion
• Biosimilars
Europe
•Build sustainable generic and specialty businesses in key countries
Other markets
•Establish businesses in key regions
Strategy by Geography
16
Country
Market Size 2013
($bn) 2013 - 17 CAGR
China 85 15%
Brazil 30 12%
Russia 27 10%
CEE 64 7%
Target Markets Profile

AD COMMENT: LET’S HAVE
ONLY H1 & NO Q2
Q&A SECTION 5
17
Thank you


![[object XMLDocument]Lupin](https://img.pdfslide.net/doc/110x75/577cdafe1a28ab9e78a714d5/object-xmldocumentlupin.jpg)


