Embed Size (px)
Citation preview

�2
by Daniel S. Holik
Daniel S. Holik is an economist with the Special Studies Returns Analysis Section. This article was prepared under the direction of Chris Carson, Chief.
I n general, to qualify for the possessions tax credit, a corporation must be a domestic corpora-tion (organized under the laws of one of the 50
states), and have filed Form 5712, Election To Be Treated as a Possessions Corporation Under Section 936. Once filed, this election remains in effect for 10 years, unless the taxpayer obtains permission for a revocation from the Internal Revenue Service.
Two gross income tests must also be satisfied. First, the possessions corporation must have derived 80 percent or more of its gross income from sources in a U.S. possession for the corporation’s applicable period, which is generally the shorter of 36 months or the period when the corporation actively conduct-ed a trade or business in a U.S. possession. The sec-ond test requires the corporation to derive at least 75 percent of its gross income from the active conduct of a trade or business in a U.S. possession. If these gross income tests are satisfied, a U.S. possessions corporation may claim the possessions tax credit for that portion of income earned from qualified sources in U.S. possessions. For Tax Year 2005, U.S. posses-sions included Puerto Rico, Guam, American Samoa, the Commonwealth of the Northern Mariana Islands, and the U.S. Virgin Islands.
The United States taxes its citizens, residents, and corporations on their worldwide incomes. Be-cause possessions corporations are domestic corpo-rations, they are subject to U.S. taxation on income earned in U.S. possessions and other foreign tax ju-risdictions. For U.S. tax purposes, however, income earned in U.S. possessions is generally considered foreign-source income. Unlike the foreign tax credit, the possessions tax credit reduces and, in some cases, eliminates the U.S. tax liability on qualified pos-sessions income whether or not the possessions tax that income.1 U.S. possessions typically employ a
u.S. Possessions Corporation Returns, 2005
combination of modest statutory rates and tax holi-days, which together translate to fairly low effective tax rates.2 Thus, the income earned by possessions corporations from possessions sources tends to be subject to low total effective tax rates.
The Tax Year 2005 Statistics of Income (SOI) possessions tax credit study is the last planned SOI study of possessions corporation returns. Generally, the possessions credit was repealed for taxable years beginning after December 31, 2005.3 For Tax Year 2005, the number of U.S. corporations claiming the possessions tax credit (102) and the amount of the credit claimed ($0.9 billion) continued declines that began in the 1990s. These declines coincide with in-creased legislative restrictions on the use of the pos-sessions tax credit.
Most of the U.S. corporations claiming a posses-sions tax credit for 2005 did so with respect to their operations in Puerto Rico. These 94 corporations claimed more than 98 percent of the total possessions tax credit.
Manufacturers continued to claim virtually all (over 98 percent) of the possessions tax credit. As in prior years, pharmaceuticals and medicines manu-facturers accounted for the largest share of the credit. For 2005, 15 pharmaceuticals and medicines manu-facturers reported possessions tax credits of nearly $0.5 billion, approximately 55 percent of the total. Other industries with substantial amounts of posses-sions tax credits claimed included food manufactur-ing, computer and electric equipment, and medical equipment and supplies manufacturing.4
BackgroundSince 1921, Federal income tax laws have provided an incentive for U.S. corporations to conduct busi-ness in U.S. possessions. The original legislation provided an exemption from taxation for all income derived from sources outside the United States if certain conditions were met. Specifically, the corpo-ration had to derive 80 percent or more of its gross income from U.S. possessions and 50 percent or
1 Subject to numerous limitations, the foreign tax credit is available only for actual taxes paid or accrued, or deemed paid. For more information on the foreign tax credit, see “Foreign Tax Credit, 2004,” published in the Statistics of Income Bulletin, Summer 2008, Washington, D.C. 2008.2 For example, the Puerto Rican tax system is separate and independent from the U.S. tax system. Although it is modeled after the U.S. system, there are differences in law and tax rates. Puerto Rico provides various tax incentives for industries under the Tax Incentives Acts of 1987 and 1998 (see Note 13). 3 The Small Business Job Protection Act of 1996 generally repealed the credit for tax years beginning after December 31, 2005. See the Background section of this article for a more complete discussion of the legislative history of the U.S. Possessions Tax Credit. 4 Throughout this article, the North American Industry Classification System (NAICS) is used to categorize business activity of possessions corporations. See North American Industry Classification System, United States, 2002, Executive Office of the President, Office of Management and Budget for additional information about specific industrial groups. For example, the food manufacturing industrial group includes beverages and distilled spirits.
Spring 2009 SOI Bulletin.indb 92 5/29/2009 9:01:00 AM
U.S. Possessions Corporation Returns, 2005Statistics of Income Bulletin | Spring 2009
��
more of its gross income from the active conduct of a trade or business in the possessions. These tax provi-sions were enacted to help U.S. corporations compete with foreign companies operating in the Philippines, which was then a U.S. possession.
The Tax Reform Act of 1976 significantly changed the taxation of U.S. corporations operating in U.S. possessions, creating a new section 936 of the Internal Revenue Code. Rather than exempting all income derived from sources outside the United States for qualifying corporations, the new legislation allowed only a credit against taxes paid on income derived from the active conduct of a trade or business in a possession and “qualified possessions source investment income” (see the Explanation of Selected Terms section). The intent of this legislation was to encourage employment-producing investments by U.S. corporations in U.S. possessions.
The Tax Equity and Fiscal Responsibility Act of 1982 and the Tax Reform Act of 1986 further restricted tax benefits available under section 936 by modifying the tax treatment of income derived from intangible assets and passive investments. In general, the 1982 Act provided that a possessions corporation’s income from intangible assets, such as patents and copyrights, would be taxable to the U.S. shareholders (usually the U.S. parent corporation) of the possessions corporation.5 A possessions corpora-tion could elect out of this general rule if it demon-strated that it had a significant business presence in the possession in which it operated, by meeting either a direct labor test or a value added test with respect to a specific product or type of service.6 Electing corporations could then choose to allocate income at-tributable to that product or service between the U.S.
shareholders and the possessions corporation using either the cost-sharing or profit split method.7 The 1982 Act also increased the percentage of gross in-come that a possessions corporation must earn from the active conduct of a trade or business in U.S. pos-sessions to 65 percent. The 1986 Act increased this percentage to 75 percent.
Legislation introduced in the 1990s continued to restrict, and finally generally repeal, the possessions tax credit provisions. Congress, in the Omnibus Budget Reconciliation Act of 1993, required corpora-tions to separate their possessions income and credit computations into active and passive components. While qualified passive income (i.e., “qualified pos-sessions source investment income”) continued to receive unrestricted credit treatment, the possessions credit derived from active income was subject to a limitation computed under either the percentage limi-tation or economic-activity limitation methods (these methods are explained in the Highlights section).
The Small Business Job Protection Act of 1996 generally repealed the credit for tax years begin-ning after December 31, 1995. However, transition rules allowed an existing possessions corporation to claim credits, with certain restrictions, through tax-able years beginning before January 1, 2006. The Act eliminated the credit for qualified possessions source investment income received or accrued after June 31, 1996.8 Existing credit claimants could, however, continue to claim reduced credit amounts for active income using the percentage or economic-activity limitations.9 The Act also implemented a base period constraint that limits the taxable income eligible for the credit for claimants using the percent-
5 Prior to the passage of the Tax Equity and Fiscal Responsibility Act of 1982, U.S. parent corporations could deduct research and development costs relative to an intangible asset (for example, a patent) and transfer the intangible to a related possessions corporation where the resulting income would qualify for the possessions tax credit under section 936. For further information, see General Accounting Office, “Report to the Chairman, Committee on Finance, U.S. Senate: Tax Policy, Puerto Rico Economic Trends,” May 1997.6 U.S. possessions corporations file Form 5712-A, Election and Verification of the Cost Sharing or Profit Split Method Under Section 936(h)(5) to show under the direct labor or value added test that they have a significant business presence in a possession.7 Generally, the cost-sharing method allows a possessions corporation to earn income from intangible processes (that may have been developed by a parent and/or members of the affiliated group) in the production of a product provided that the possessions corporation makes a cost-sharing payment (for use of the intangible processes) to the affiliate(s). Generally, the profit split method allows a possessions corporation to report income equal to 50 percent of the combined taxable income of the affiliated group from the production and sale of a product (while the remaining 50 percent of combined taxable income is allocated to the affiliated group).8 For tax years beginning before January 1, 2006, the Act’s amendments with regard to both active and qualified possessions source investment income do not apply to existing credit claimants with respect to Guam, American Samoa, and the Commonwealth of the Northern Mariana Islands. These claimants figure the credit under rules in effect prior to the 1996 Act. 9 With the passage of the Small Business Job Protection Act of 1996, credit claimants operating in Puerto Rico that use the economic activity limitation figure their credit under the new section 30A. Generally, the provisions of section 936 apply when computing the credit under section 30A. See the Explanation of Selected Terms section for a definition of the term “existing credit claimant.”
Spring 2009 SOI Bulletin.indb 93 5/29/2009 9:01:00 AM

U.S. Possessions Corporation Returns, 2005Statistics of Income Bulletin | Spring 2009
��
age limitation method.10 This base period constraint is effective for tax years beginning after December 31, 1997.11
HighlightsAs shown in Figure A, the statistics for 2005 reflect a continuing trend of fewer U.S. possessions corpora-tions reporting smaller amounts of possessions tax
credits. For 2005, there were 157 active possessions corporations, a 22-percent decrease from the 201 active corporations for 2003.12 During this same pe-riod, the total possessions tax credit decreased from $1.1 billion to $0.9 billion.
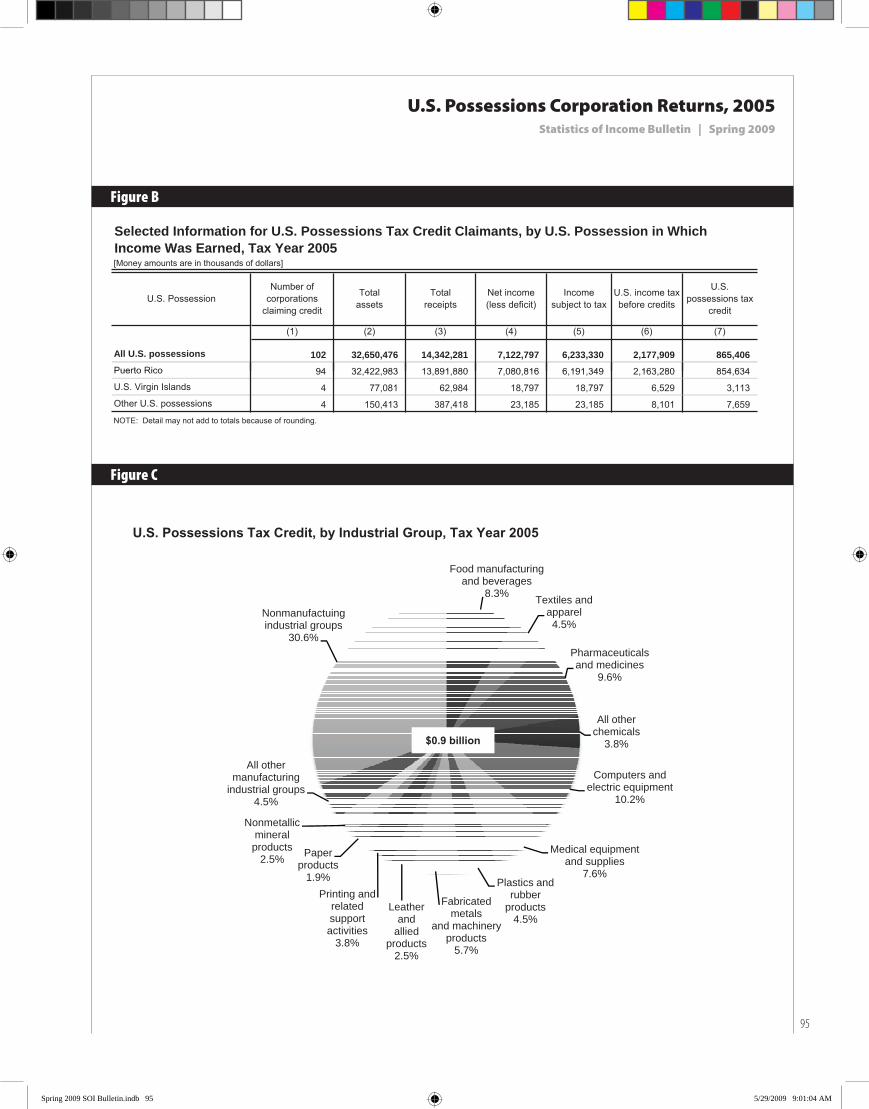
U.S. possessions corporations with operations in Puerto Rico continued to report virtually all of the possessions tax credits (Figure B). For 2005, 94 Puerto Rico-based possessions corporations claimed $0.85 billion of possessions tax credits. These cor-porations also accounted for nearly all of the assets, receipts, and net income of corporations claiming the credit.
As shown in Figure C, manufacturing corpora-tions claimed approximately 69 percent of the pos-sessions tax credit.13 For 2005, manufacturers of food, textiles and apparel, pharmaceuticals and medi-cines, computers and electric equipment, and medical equipment and supplies, combined, claimed more than 40 percent of the $0.9-billion total credit.
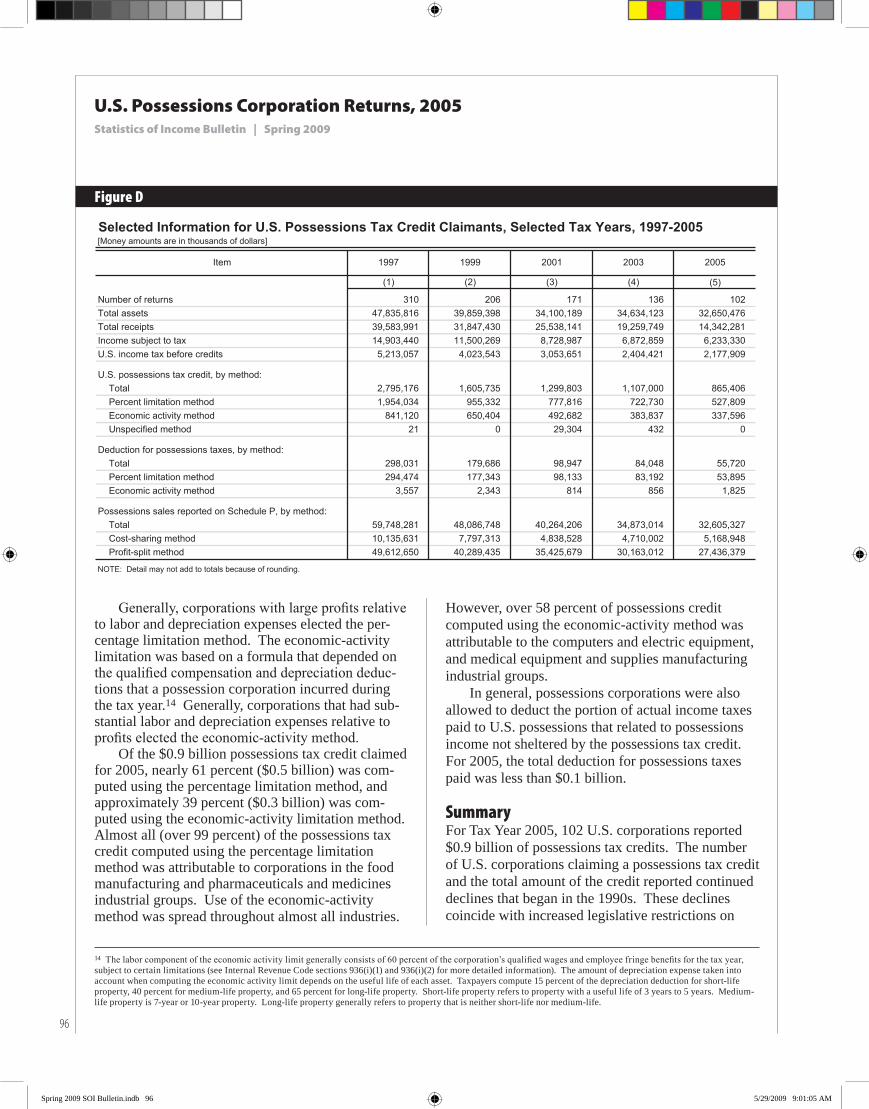
Figure D, which provides statistics for credit claimants for 1997, 1999, 2001, 2003, and 2005 highlights the extent of the decline in the use of the possessions tax credit provisions. The number of credit claimants in 2005 fell 25 percent to 102 from 2003. Assets reported for 2005 declined to $32.7 billion (a 6-percent decrease from 2003) and receipts dropped to $14.3 billion (a 26-percent decrease). For 2005, U.S. income tax before credits fell 9 percent to $2.2 billion, and the total amount of possessions sales fell 7 percent to $32.6 billion.
For 2005, possessions corporations were subject to a limitation on the possessions tax credit derived from their active business incomes. With certain re-strictions, corporations could elect to determine the possessions credit using either a percentage or eco-nomic-activity limitation computation. The percent-age limitation method required taxpayers to compute the possessions tax credit for active income as a per-centage of the credit that would have been allowed prior to Tax Year 1994. For 2005, the applicable per-centage was 40 percent.
10 A similar cap is effective for credit claimants using the economic-activity limitation for taxable years beginning after December 31, 2001.11 For more information on the legislative history, see Miller, Randy, “U.S. Possessions Corporations, 1995,” Statistics of Income Bulletin, Summer 1999, Volume 19, Number 1.12 For more information on the possessions tax credit for Tax Years 1997, 1999, 2001, and 2003, see: Nutter, Sarah E., “U.S. Possessions Corporation Returns, 1997 and 1999,” Statistics of Income Bulletin, Summer 2003, Volume 23, Number 1; Holik, Daniel S., “U.S. Possessions Corporations Returns, 2001,” Statistics of Income Bulletin, Fall 2005, Volume 25, Number 2; and Holik, Daniel S., “U.S. Possessions Corporations Returns, 2003,” Statistics of Income Bulletin, Summer 2006, Volume 26, Number 1.13 Puerto Rico has tax incentives that are primarily for companies in the manufacturing or export business. Nonmanufacturing companies generally pay the full Puerto Rican income tax and then claim the U.S. foreign tax credit. Thus, nonmanufacturing companies receive little reduction in U.S. income tax liabilities through use of the possessions tax credit. For additional information, see General Accounting Office, “Report to the Chairman, Committee on Finance, U.S. Senate: Tax Policy, Puerto Rican Economic Trends,” May 1997.
[Money amounts are in billions of dollars]
NumberU.S.
possessionstax credit
(1) (2) (3)
1983 625 553 2.0 1984 [2] n/a 536 2.0 1985 594 510 2.4 1986 [2] n/a 520 2.9 1987 516 452 2.8 1988 [2] n/a 458 2.3 1989 513 434 2.8 1990 [2] n/a 400 3.2 1991 [2] n/a 402 3.5 1992 [2] n/a 414 3.7 1993 474 395 4.6 1994 [2] n/a 390 3.8 1995 440 353 3.1 1996 [2] n/a 335 3.1 1997 378 310 2.8 1998 [2] n/a 260 2.4 1999 300 206 1.6 2000 [2] n/a 197 1.4 2001 246 171 1.3 2002 [2] n/a 147 1.2 2003 201 136 1.1 2004 [2] n/a 105 0.9 2005 157 102 0.9 n/a—Not available.
Corporations Claiming the U.S. Possessions Tax Credit, Tax Years, 1983-2005
[1] An active corporation is a corporation that has current income and/or deductions. A possessions corporation is a domestic corporation that has filed Form 5712, Election to be Treated as a Possessions Corporation under Section 936 .
[2] No U.S. Possessions study was conducted for these tax years. The number of credit claimants and possessions tax credits for these tax years were published in the Statistics of Income, Corporation Income Tax Returns, Publication 16 .
Corporations claiming credit Number of active
possessionscorporations [1]
Tax year
Figure A
Spring 2009 SOI Bulletin.indb 94 5/29/2009 9:01:00 AM
U.S. Possessions Corporation Returns, 2005Statistics of Income Bulletin | Spring 2009
��
Selected Information for U.S. Possessions Tax Credit Claimants, by U.S. Possession in Which Income Was Earned Tax Year 2005[Money amounts are in thousands of dollars]
U.S. PossessionNumber of
corporationsclaiming credit
Totalassets
Totalreceipts
Net income (less deficit)
Income subject to tax
U.S. income tax before credits
U.S. possessions tax
credit
(1) (2) (3) (4) (5) (6) (7)
All U.S. possessions 102 32,650,476 14,342,281 7,122,797 6,233,330 2,177,909 865,406 Puerto Rico 94 32 422 983 13 891 880 7 080 816 6 191 349 2 163 280 854 634
Income Was Earned, Tax Year 2005
Puerto Rico 94 32,422,983 13,891,880 7,080,816 6,191,349 2,163,280 854,634U.S. Virgin Islands 4 77,081 62,984 18,797 18,797 6,529 3,113 Other U.S. possessions 4 150,413 387,418 23,185 23,185 8,101 7,659
NOTE: Detail may not add to totals because of rounding.
Figure B
Food manufacturing and beverages
8.3% Textiles and apparel4.5%
Nonmanufactuingindustrial groups
30.6%
U.S. Possessions Tax Credit, by Industrial Group, Tax Year 2005
Pharmaceuticalsand medicines
9.6%
All other chemicals
3.8%
All other
$0.9 billion
Computers and electric equipment
10.2%
Medical equipment and supplies
7.6%Plastics and
bbP i ti d
Paperproducts
1.9%
Nonmetallicmineral
products2.5%
All othermanufacturing
industrial groups4.5%
rubberproducts
4.5%
Fabricatedmetals
and machinery products
5.7%
Leatherand
alliedproducts
2.5%
Printing andrelatedsupportactivities
3.8%
Figure C
Spring 2009 SOI Bulletin.indb 95 5/29/2009 9:01:04 AM
U.S. Possessions Corporation Returns, 2005Statistics of Income Bulletin | Spring 2009
��
Generally, corporations with large profits relative to labor and depreciation expenses elected the per-centage limitation method. The economic-activity limitation was based on a formula that depended on the qualified compensation and depreciation deduc-tions that a possession corporation incurred during the tax year.14 Generally, corporations that had sub-stantial labor and depreciation expenses relative to profits elected the economic-activity method.
Of the $0.9 billion possessions tax credit claimed for 2005, nearly 61 percent ($0.5 billion) was com-puted using the percentage limitation method, and approximately 39 percent ($0.3 billion) was com-puted using the economic-activity limitation method. Almost all (over 99 percent) of the possessions tax credit computed using the percentage limitation method was attributable to corporations in the food manufacturing and pharmaceuticals and medicines industrial groups. Use of the economic-activity method was spread throughout almost all industries.
However, over 58 percent of possessions credit computed using the economic-activity method was attributable to the computers and electric equipment, and medical equipment and supplies manufacturing industrial groups.
In general, possessions corporations were also allowed to deduct the portion of actual income taxes paid to U.S. possessions that related to possessions income not sheltered by the possessions tax credit. For 2005, the total deduction for possessions taxes paid was less than $0.1 billion.
SummaryFor Tax Year 2005, 102 U.S. corporations reported $0.9 billion of possessions tax credits. The number of U.S. corporations claiming a possessions tax credit and the total amount of the credit reported continued declines that began in the 1990s. These declines coincide with increased legislative restrictions on
Figure D
Selected Information for U.S. Possessions Tax Credit Claimants, Selected Tax Years, 1997-2005[Money amounts are in thousands of dollars]
Item 1997 1999 2001 2003 2005
(1) (2) (3) (4) (5)
Number of returns 310 206 171 136 102 Total assets 47,835,816 39,859,398 34,100,189 34,634,123 32,650,476 Total receipts 39,583,991 31,847,430 25,538,141 19,259,749 14,342,281 Income subject to tax 14,903,440 11,500,269 8,728,987 6,872,859 6,233,330 U.S. income tax before credits 5,213,057 4,023,543 3,053,651 2,404,421 2,177,909
U.S. possessions tax credit, by method:Total 2,795,176 1,605,735 1,299,803 1,107,000 865,406 Percent limitation method 1,954,034 955,332 777,816 722,730 527,809 Economic activity method 841,120 650,404 492,682 383,837 337,596 Unspecified method 21 0 29,304 432 0
Deduction for possessions taxes, by method:Total 298,031 179,686 98,947 84,048 55,720 Percent limitation method 294,474 177,343 98,133 83,192 53,895 Economic activity method 3,557 2,343 814 856 1,825
Possessions sales reported on Schedule P, by method:Total 59,748,281 48,086,748 40,264,206 34,873,014 32,605,327 Cost-sharing method 10,135,631 7,797,313 4,838,528 4,710,002 5,168,948 Profit-split method 49,612,650 40,289,435 35,425,679 30,163,012 27,436,379
NOTE: Detail may not add to totals because of rounding.
14 The labor component of the economic activity limit generally consists of 60 percent of the corporation’s qualified wages and employee fringe benefits for the tax year, subject to certain limitations (see Internal Revenue Code sections 936(i)(1) and 936(i)(2) for more detailed information). The amount of depreciation expense taken into account when computing the economic activity limit depends on the useful life of each asset. Taxpayers compute 15 percent of the depreciation deduction for short-life property, 40 percent for medium-life property, and 65 percent for long-life property. Short-life property refers to property with a useful life of 3 years to 5 years. Medium-life property is 7-year or 10-year property. Long-life property generally refers to property that is neither short-life nor medium-life.
Spring 2009 SOI Bulletin.indb 96 5/29/2009 9:01:05 AM
U.S. Possessions Corporation Returns, 2005Statistics of Income Bulletin | Spring 2009
��
the use of the possessions tax credit. The U.S. Pos-sessions Tax Credit was repealed for taxable years beginning after December 31, 2005.
As in prior years, pharmaceuticals and medicines manufacturers located in Puerto Rico reported the bulk of the possessions tax credit. The food manu-facturing, medical equipment and supplies, comput-ers and electric equipment, and textiles and apparel industries also claimed substantial amounts of pos-sessions tax credits.
Data Sources and limitationsThe 2005 statistics are based on data compiled from all returns filed by U.S. possessions corporations with accounting periods ending between July 2005 and June 2006. Consequently, the data are not sub-ject to sampling error.
The data may, however, contain nonsampling errors. Where possible, inconsistencies in the data were resolved to conform with provisions of the In-ternal Revenue Code. In cases where information re-ported was not logical, other data on the return were used to resolve errors.
Data were collected from Form 1120, U.S. Corporation Income Tax Return, for possessions corporations and supplemented by information col-lected from Form 5712, Election To Be Treated as a Possessions Corporation Under Section 936, Form 5735, Possessions Corporation Tax Credit (Under Sections 936 and 30A), and Schedule P (Form 5735), Allocation of Income and Expenses Under Section 936(h)(5). Due to processing differences, slight vari-ations exist between the data in this article and the more limited statistics published in Internal Revenue Service, Statistics of Income—2005, Corporation In-come Tax Returns, Washington, DC 2008.
explanation of Selected termsBusiness receipts—Business receipts were the
gross operating receipts of the corporation reduced by the cost of returned goods and allowances. Gen-erally, they represented all of a corporation’s receipts except investment and incidental income.
Distributions to stockholders—Distributions to stockholders represent cash and property (other than company stock) distributions to stockholders during the current year.
Existing credit claimant—A corporation was an existing credit claimant with respect to a posses-sion if the corporation: 1) was engaged in the active conduct of a trade or business within the possession on October 13, 1995; and 2) elected the benefits of the possessions credit effective for its taxable year that included October 13, 1995. A corporation that acquired all of the assets of a trade or business of an existing credit claimant qualified as an existing credit claimant.
Income subject to tax—This was generally the amount of income subject to tax at the corporate level. For most corporations, income subject to tax consisted of net income minus statutory special de-ductions (i.e., the net operating loss deduction and special deductions for dividends).
Intangible assets—Intangible assets represented the total gross value of goodwill, contracts, copy-rights, formulas, licenses, patents, registered trade-marks, franchises, covenants not to compete, and similar assets that were amortizable for tax purposes.
Passive activity—Passive activity generally in-cluded trade or business activity in which the corpo-ration did not materially participate for the tax year, and with exceptions, rental activities regardless of the corporation’s participation.
Spring 2009 SOI Bulletin.indb 97 5/29/2009 9:01:05 AM
U.S. Possessions Corporation Returns, 2005Statistics of Income Bulletin | Spring 2009
��
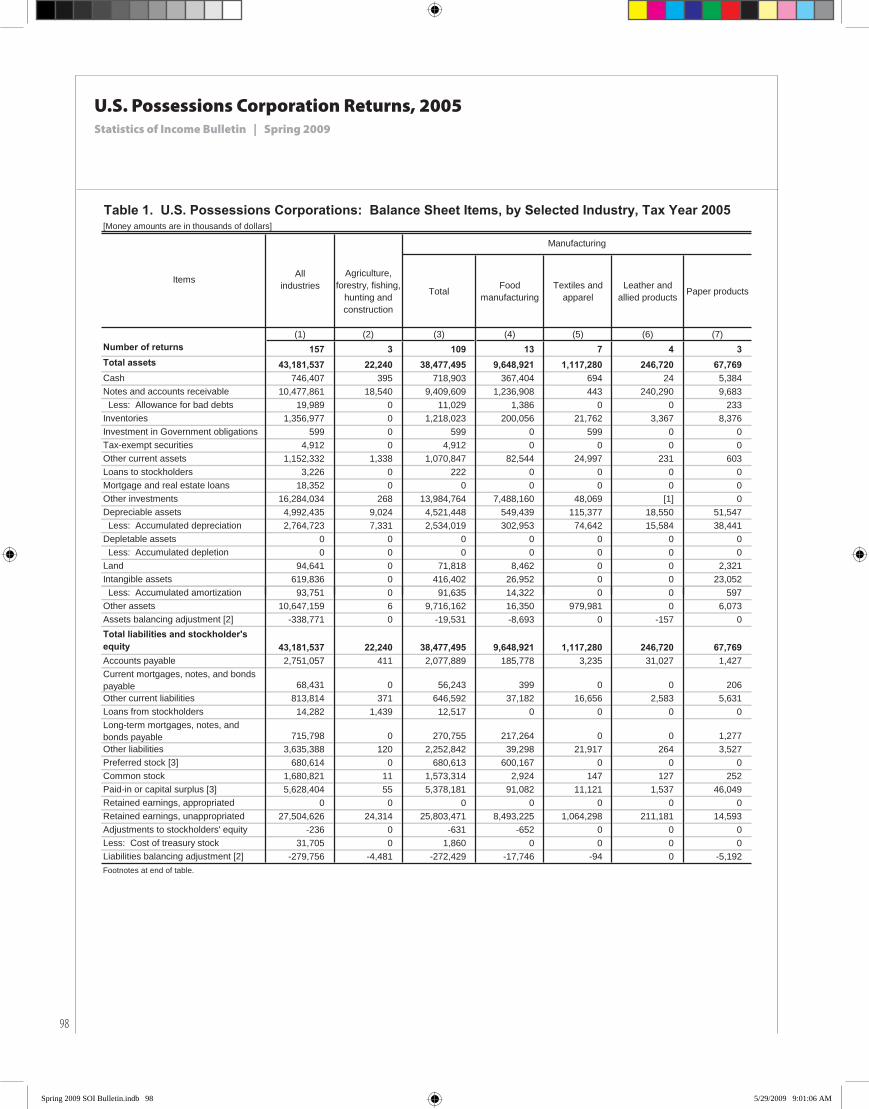
Table 1. U.S. Possessions Corporations: Balance Sheet Items, by Selected Industry, Tax Year 2005[Money amounts are in thousands of dollars]
Agriculture, forestry, fishing,
hunting and construction
Total Foodmanufacturing
Textiles and apparel
Leather and allied products Paper products
(1) (2) (3) (4) (5) (6) (7)Number of returns 157 3 109 13 7 4 3 Total assets 43,181,537 22,240 38,477,495 9,648,921 1,117,280 246,720 67,769 Cash 746,407 395 718,903 367,404 694 24 5,384 Notes and accounts receivable 10,477,861 18,540 9,409,609 1,236,908 443 240,290 9,683 Less: Allowance for bad debts 19,989 0 11,029 1,386 0 0 233 Inventories 1,356,977 0 1,218,023 200,056 21,762 3,367 8,376 Investment in Government obligations 599 0 599 0 599 0 0 Tax-exempt securities 4,912 0 4,912 0 0 0 0 Other current assets 1,152,332 1,338 1,070,847 82,544 24,997 231 603 Loans to stockholders 3,226 0 222 0 0 0 0 Mortgage and real estate loans 18,352 0 0 0 0 0 0 Other investments 16,284,034 268 13,984,764 7,488,160 48,069 [1] 0 Depreciable assets 4,992,435 9,024 4,521,448 549,439 115,377 18,550 51,547 Less: Accumulated depreciation 2,764,723 7,331 2,534,019 302,953 74,642 15,584 38,441 Depletable assets 0 0 0 0 0 0 0 Less: Accumulated depletion 0 0 0 0 0 0 0 Land 94,641 0 71,818 8,462 0 0 2,321 Intangible assets 619,836 0 416,402 26,952 0 0 23,052 Less: Accumulated amortization 93,751 0 91,635 14,322 0 0 597
AllindustriesItems
Manufacturing
Less: Accumulated amortization 93,751 0 91,635 14,322 0 0 597Other assets 10,647,159 6 9,716,162 16,350 979,981 0 6,073 Assets balancing adjustment [2] -338,771 0 -19,531 -8,693 0 -157 0 Total liabilities and stockholder's equity 43,181,537 22,240 38,477,495 9,648,921 1,117,280 246,720 67,769 Accounts payable 2,751,057 411 2,077,889 185,778 3,235 31,027 1,427 Current mortgages, notes, and bonds payable 68,431 0 56,243 399 0 0 206 Other current liabilities 813,814 371 646,592 37,182 16,656 2,583 5,631 Loans from stockholders 14,282 1,439 12,517 0 0 0 0 Long-term mortgages, notes, and bonds payable 715,798 0 270,755 217,264 0 0 1,277 Other liabilities 3,635,388 120 2,252,842 39,298 21,917 264 3,527 Preferred stock [3] 680,614 0 680,613 600,167 0 0 0 Common stock 1,680,821 11 1,573,314 2,924 147 127 252 Paid-in or capital surplus [3] 5,628,404 55 5,378,181 91,082 11,121 1,537 46,049 Retained earnings, appropriated 0 0 0 0 0 0 0 Retained earnings, unappropriated 27,504,626 24,314 25,803,471 8,493,225 1,064,298 211,181 14,593 Adjustments to stockholders' equity -236 0 -631 -652 0 0 0 Less: Cost of treasury stock 31,705 0 1,860 0 0 0 0 Liabilities balancing adjustment [2] -279,756 -4,481 -272,429 -17,746 -94 0 -5,192 Footnotes at end of table.
Spring 2009 SOI Bulletin.indb 98 5/29/2009 9:01:06 AM

U.S. Possessions Corporation Returns, 2005Statistics of Income Bulletin | Spring 2009
��
[Money amounts are in thousands of dollars]
Printing and related support
activities
Pharmaceuticals and medicines
All other chemicals
Plastics and rubber products
Nonmetallic mineral products
Primary and fabricated
metals
(8) (9) (10) (11) (12) (13)Number of returns 6 15 6 7 4 5 Total assets 433,886 20,364,746 358,584 171,411 99,326 88,083 Cash 13,997 14,606 15,130 3,330 7,188 1,988 Notes and accounts receivable 63,130 5,872,619 74,454 52,096 17,431 65,139 Less: Allowance for bad debts 3,013 188 196 221 1,089 43 Inventories 31,794 508,308 42,492 11,070 5,250 7,912 Investment in Government obligations 0 0 0 0 0 0 Tax-exempt securities 0 0 0 0 0 0 Other current assets 1,425 287,327 32,753 2,317 39,749 625 Loans to stockholders 0 0 0 0 0 0 Mortgage and real estate loans 0 0 0 0 0 0 Other investments 31,495 5,250,104 29,600 48,619 1,367 2,282 Depreciable assets 347,885 1,360,862 378,955 103,308 56,358 44,567 Less: Accumulated depreciation 177,869 646,154 231,719 53,015 41,412 36,263 Depletable assets 0 0 0 0 0 0 Less: Accumulated depletion 0 0 0 0 0 0 Land 4,793 28,186 3,393 4,091 28 1,234 Intangible assets 161,234 36,132 1,576 0 0 0 Less: Accumulated amortization 40,389 9,132 1,058 0 0 0 Other assets 250 7,662,077 13,383 0 14,457 651 Assets balancing adjustment [2] -847 0 -180 -184 0 -7
Table 1. U.S. Possessions Corporations: Balance Sheet Items, by Selected Industry, Tax Year 2005—Continued
Manufacturing—continued
Items
Assets balancing adjustment [2] 847 0 180 184 0 7Total liabilities and stockholder's equity 433,886 20,364,746 358,584 171,411 99,326 88,083 Accounts payable 42,267 868,906 35,890 35,155 2,937 2,911 Current mortgages, notes, and bonds payable 35,857 2,759 105 38 7,821 3,507 Other current liabilities 44,189 196,317 14,885 3,476 7,007 862 Loans from stockholders 0 0 426 12,091 0 0 Long-term mortgages, notes, and bonds payable 30,837 1,523 181 0 120 574 Other liabilities 55,575 1,848,094 159,230 260 1,909 0 Preferred stock [3] 18 250 160 18 0 0 Common stock 185,262 1,376,152 280 585 220 134 Paid-in or capital surplus [3] 8,200 4,226,272 6,173 24,400 17,035 5,544 Retained earnings, appropriated 0 0 0 0 0 0 Retained earnings, unappropriated 31,682 11,844,473 283,634 95,553 62,278 74,551 Adjustments to stockholders' equity 0 0 0 0 0 0 Less: Cost of treasury stock 0 0 0 0 0 0 Liabilities balancing adjustment [2] 0 0 -142,378 -166 0 0 Footnotes at end of table.
Spring 2009 SOI Bulletin.indb 99 5/29/2009 9:01:07 AM

U.S. Possessions Corporation Returns, 2005Statistics of Income Bulletin | Spring 2009
100
[Money amounts are in thousands of dollars]
Machinery manufacturing
Computers and electric
equipment
Medical equipment and
supplies
Miscellaneous manufacturing
Durable goods wholesalers
Nondurable goods
wholesalers
Retail trade
(14) (15) (16) (17) (18) (19) (20)Number of returns 4 16 12 7 4 7 3 Total assets 988,313 2,666,398 1,660,767 565,291 71,458 602,529 616,827 Cash 1,198 63,659 209,841 14,461 1,256 6,502 5,767 Notes and accounts receivable 104,502 1,364,529 279,446 28,939 28,299 565,896 5,510 Less: Allowance for bad debts 340 99 348 3,873 1,264 1,830 15 Inventories 20,065 100,843 138,869 117,860 16,662 13,507 82,287 Investment in Government obligations 0 0 0 0 0 0 0 Tax-exempt securities 0 4,912 0 0 0 0 0 Other current assets 6,821 240,705 35,591 315,160 961 5,822 43 Loans to stockholders 0 222 0 0 417 0 0 Mortgage and real estate loans 0 0 0 0 0 0 0 Other investments 507,000 554,216 2,488 21,364 0 0 0 Depreciable assets 98,381 408,218 826,204 161,798 16,063 15,843 165,457 Less: Accumulated depreciation 50,782 267,369 498,101 99,715 11,201 8,859 98,193 Depletable assets 0 0 0 0 0 0 0 Less: Accumulated depletion 0 0 0 0 0 0 0 Land 2,479 9,201 5,591 2,040 923 0 4,406 Intangible assets 0 153,810 10,013 3,633 283 0 0 Less: Accumulated amortization 0 19,824 5,512 802 150 0 0 Other assets 299,062 58,988 660,463 4,427 19,209 5,648 451,567 A t b l i dj t t [2] 72 5 613 3 777 0 0 0 0
Table 1. U.S. Possessions Corporations: Balance Sheet Items, by Selected Industry, Tax Year 2005—Continued
Wholesale tradeManufacturing—continued
Items
Assets balancing adjustment [2] -72 -5,613 -3,777 0 0 0 0 Total liabilities and stockholder's equity 988,313 2,666,398 1,660,767 565,291 71,458 602,529 616,827 Accounts payable 26,858 520,289 64,611 256,597 10,151 476,599 42,734 Current mortgages, notes, and bonds payable 0 3,085 1,252 1,214 79 5,674 0 Other current liabilities 26,220 203,665 64,415 23,504 22,219 16,082 45,489 Loans from stockholders 0 0 0 0 0 0 0 Long-term mortgages, notes, and bonds payable 0 907 18,026 46 2,693 0 0 Other liabilities 61,275 47,339 11,221 2,933 4,713 1,175 0 Preferred stock [3] 0 0 0 80,000 0 0 0 Common stock 203 6,758 27 243 95 513 10,237 Paid-in or capital surplus [3] 519,063 196,803 201,897 23,006 10,836 41,381 85 Retained earnings, appropriated 0 0 0 0 0 0 0 Retained earnings, unappropriated 354,693 1,782,229 1,303,488 187,590 23,027 61,106 518,282 Adjustments to stockholders' equity 0 21 0 0 0 0 0 Less: Cost of treasury stock 0 610 0 1,250 0 0 0 Liabilities balancing adjustment [2] 0 -94,089 -4,171 -8,591 -2,355 0 0 Footnotes at end of table.
Spring 2009 SOI Bulletin.indb 100 5/29/2009 9:01:07 AM
U.S. Possessions Corporation Returns, 2005Statistics of Income Bulletin | Spring 2009
101
[Money amounts are in thousands of dollars]
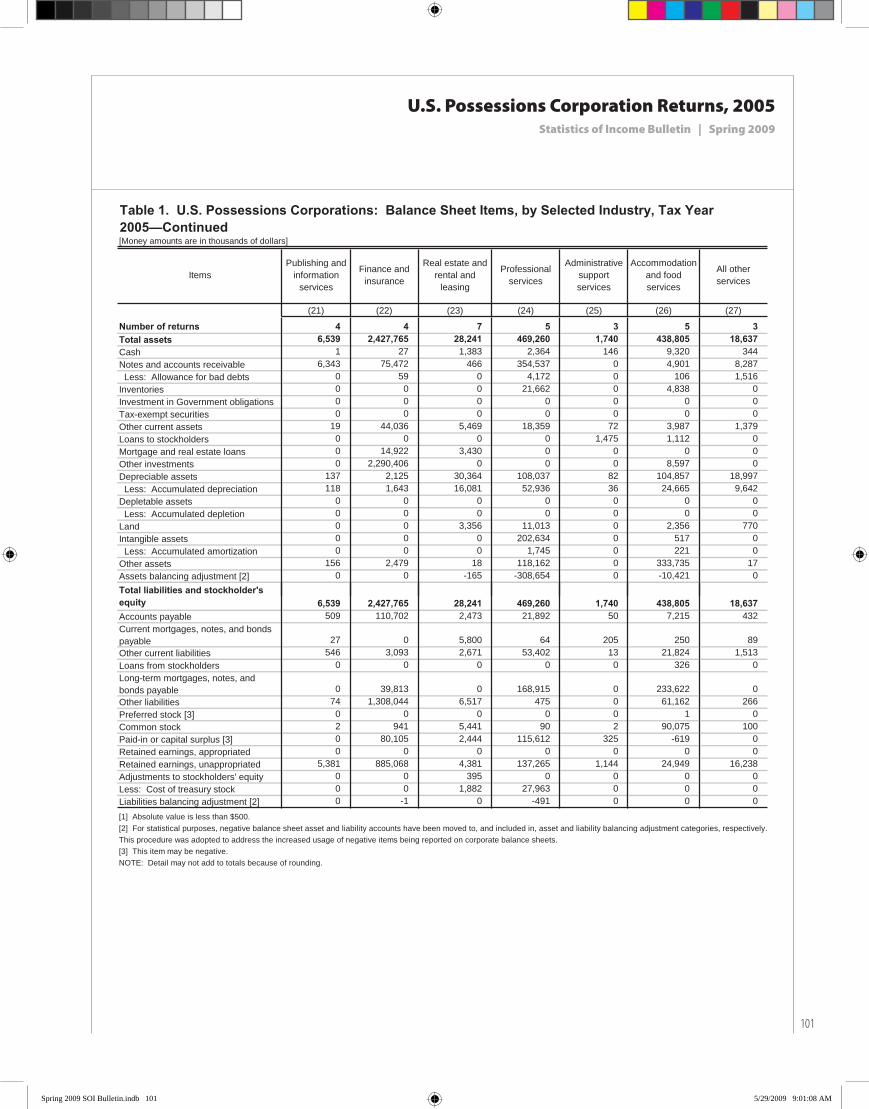
(21) (22) (23) (24) (25) (26) (27)
Number of returns 4 4 7 5 3 5 3 Total assets 6,539 2,427,765 28,241 469,260 1,740 438,805 18,637 Cash 1 27 1,383 2,364 146 9,320 344 Notes and accounts receivable 6,343 75,472 466 354,537 0 4,901 8,287 Less: Allowance for bad debts 0 59 0 4,172 0 106 1,516 Inventories 0 0 0 21,662 0 4,838 0 Investment in Government obligations 0 0 0 0 0 0 0 Tax-exempt securities 0 0 0 0 0 0 0 Other current assets 19 44,036 5,469 18,359 72 3,987 1,379 Loans to stockholders 0 0 0 0 1,475 1,112 0 Mortgage and real estate loans 0 14,922 3,430 0 0 0 0 Other investments 0 2,290,406 0 0 0 8,597 0 Depreciable assets 137 2,125 30,364 108,037 82 104,857 18,997 Less: Accumulated depreciation 118 1,643 16,081 52,936 36 24,665 9,642 Depletable assets 0 0 0 0 0 0 0 Less: Accumulated depletion 0 0 0 0 0 0 0 Land 0 0 3,356 11,013 0 2,356 770 Intangible assets 0 0 0 202,634 0 517 0 Less: Accumulated amortization 0 0 0 1,745 0 221 0 Other assets 156 2,479 18 118,162 0 333,735 17 Assets balancing adjustment [2] 0 0 -165 -308,654 0 -10,421 0 Total liabilities and stockholder's
Table 1. U.S. Possessions Corporations: Balance Sheet Items, by Selected Industry, Tax Year 2005—Continued
ItemsPublishing and
information services
Finance and insurance
Real estate and rental and
leasing
Professional services
Administrative supportservices
Accommodation and food services
All other services
equity 6,539 2,427,765 28,241 469,260 1,740 438,805 18,637 Accounts payable 509 110,702 2,473 21,892 50 7,215 432 Current mortgages, notes, and bonds payable 27 0 5,800 64 205 250 89 Other current liabilities 546 3,093 2,671 53,402 13 21,824 1,513 Loans from stockholders 0 0 0 0 0 326 0 Long-term mortgages, notes, and bonds payable 0 39,813 0 168,915 0 233,622 0 Other liabilities 74 1,308,044 6,517 475 0 61,162 266 Preferred stock [3] 0 0 0 0 0 1 0 Common stock 2 941 5,441 90 2 90,075 100 Paid-in or capital surplus [3] 0 80,105 2,444 115,612 325 -619 0 Retained earnings, appropriated 0 0 0 0 0 0 0 Retained earnings, unappropriated 5,381 885,068 4,381 137,265 1,144 24,949 16,238 Adjustments to stockholders' equity 0 0 395 0 0 0 0 Less: Cost of treasury stock 0 0 1,882 27,963 0 0 0 Liabilities balancing adjustment [2] 0 -1 0 -491 0 0 0
[2] For statistical purposes, negative balance sheet asset and liability accounts have been moved to, and included in, asset and liability balancing adjustment categories, respectively. This procedure was adopted to address the increased usage of negative items being reported on corporate balance sheets.[3] This item may be negative.NOTE: Detail may not add to totals because of rounding.
[1] Absolute value is less than $500.
Spring 2009 SOI Bulletin.indb 101 5/29/2009 9:01:08 AM
U.S. Possessions Corporation Returns, 2005Statistics of Income Bulletin | Spring 2009
102
[Money amounts are in thousands of dollars]
Total Foodmanufacturing
Textiles and apparel
Leather and allied products
Paper products
(1) (2) (3) (4) (5) (6) (7)
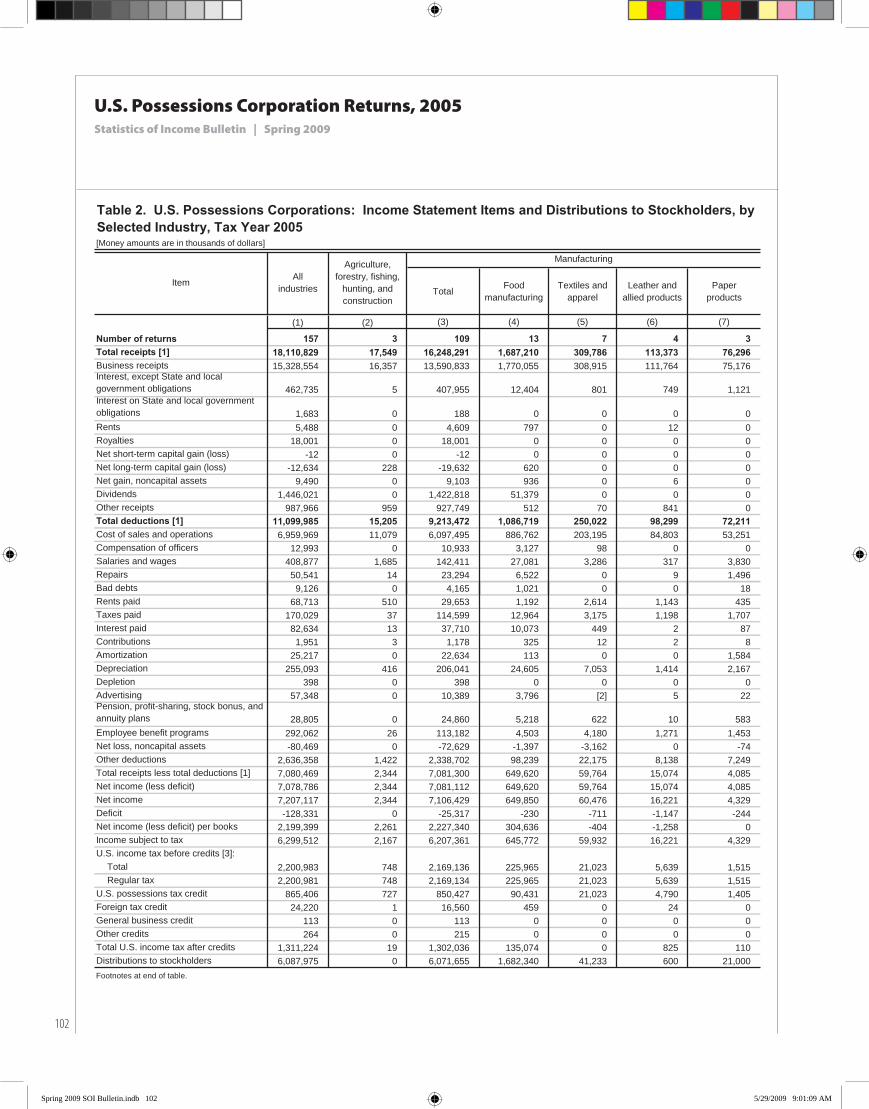
Number of returns 157 3 109 13 7 4 3 Total receipts [1] 18,110,829 17,549 16,248,291 1,687,210 309,786 113,373 76,296 Business receipts 15,328,554 16,357 13,590,833 1,770,055 308,915 111,764 75,176 Interest, except State and localgovernment obligations 462,735 5 407,955 12,404 801 749 1,121 Interest on State and local governmentobligations 1,683 0 188 0 0 0 0 Rents 5,488 0 4,609 797 0 12 0 Royalties 18,001 0 18,001 0 0 0 0 Net short-term capital gain (loss) -12 0 -12 0 0 0 0 Net long-term capital gain (loss) -12,634 228 -19,632 620 0 0 0 Net gain, noncapital assets 9,490 0 9,103 936 0 6 0 Dividends 1,446,021 0 1,422,818 51,379 0 0 0 Other receipts 987,966 959 927,749 512 70 841 0 Total deductions [1] 11,099,985 15,205 9,213,472 1,086,719 250,022 98,299 72,211 Cost of sales and operations 6,959,969 11,079 6,097,495 886,762 203,195 84,803 53,251 Compensation of officers 12,993 0 10,933 3,127 98 0 0 Salaries and wages 408,877 1,685 142,411 27,081 3,286 317 3,830 Repairs 50,541 14 23,294 6,522 0 9 1,496 Bad debts 9,126 0 4,165 1,021 0 0 18
Item
Agriculture, forestry, fishing,
hunting, and construction
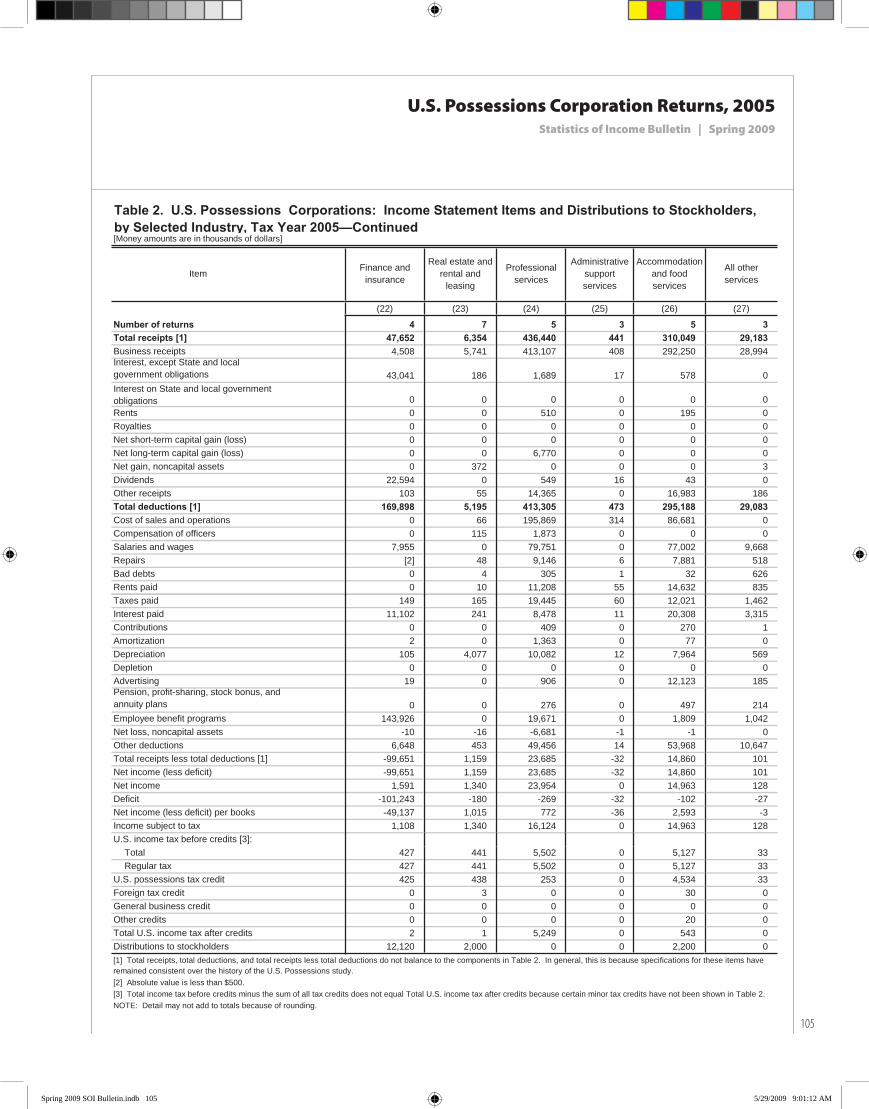
Table 2. U.S. Possessions Corporations: Income Statement Items and Distributions to Stockholders, by Selected Industry, Tax Year 2005
Manufacturing
Allindustries
Rents paid 68,713 510 29,653 1,192 2,614 1,143 435 Taxes paid 170,029 37 114,599 12,964 3,175 1,198 1,707 Interest paid 82,634 13 37,710 10,073 449 2 87 Contributions 1,951 3 1,178 325 12 2 8 Amortization 25,217 0 22,634 113 0 0 1,584 Depreciation 255,093 416 206,041 24,605 7,053 1,414 2,167 Depletion 398 0 398 0 0 0 0 Advertising 57,348 0 10,389 3,796 [2] 5 22 Pension, profit-sharing, stock bonus, andannuity plans 28,805 0 24,860 5,218 622 10 583 Employee benefit programs 292,062 26 113,182 4,503 4,180 1,271 1,453 Net loss, noncapital assets -80,469 0 -72,629 -1,397 -3,162 0 -74 Other deductions 2,636,358 1,422 2,338,702 98,239 22,175 8,138 7,249 Total receipts less total deductions [1] 7,080,469 2,344 7,081,300 649,620 59,764 15,074 4,085 Net income (less deficit) 7,078,786 2,344 7,081,112 649,620 59,764 15,074 4,085 Net income 7,207,117 2,344 7,106,429 649,850 60,476 16,221 4,329 Deficit -128,331 0 -25,317 -230 -711 -1,147 -244 Net income (less deficit) per books 2,199,399 2,261 2,227,340 304,636 -404 -1,258 0 Income subject to tax 6,299,512 2,167 6,207,361 645,772 59,932 16,221 4,329 U.S. income tax before credits [3]:
Total 2,200,983 748 2,169,136 225,965 21,023 5,639 1,515 Regular tax 2,200,981 748 2,169,134 225,965 21,023 5,639 1,515
U.S. possessions tax credit 865,406 727 850,427 90,431 21,023 4,790 1,405 Foreign tax credit 24,220 1 16,560 459 0 24 0 General business credit 113 0 113 0 0 0 0 Other credits 264 0 215 0 0 0 0 Total U.S. income tax after credits 1,311,224 19 1,302,036 135,074 0 825 110 Distributions to stockholders 6,087,975 0 6,071,655 1,682,340 41,233 600 21,000 Footnotes at end of table.
Spring 2009 SOI Bulletin.indb 102 5/29/2009 9:01:09 AM

U.S. Possessions Corporation Returns, 2005Statistics of Income Bulletin | Spring 2009
10�
[Money amounts are in thousands of dollars]
Printing and related supportactivities
Pharmaceuticals and medicines
All other chemicals
Plastics and rubber products
Nonmetallic mineral products
Primary and fabricated
metals
Machinery manufacturing
(8) (9) (10) (11) (12) (13) (14)
Number of returns 6 15 6 7 4 5 4 Total receipts [1] 608,812 9,043,406 451,861 156,517 73,881 50,904 355,543 Business receipts 582,173 6,484,936 427,832 154,798 70,356 50,377 327,714 Interest, except State and localgovernment obligations 2,092 338,996 2,955 1,227 172 11 26,552 Interest on State and local governmentobligations 0 0 0 0 0 0 0 Rents 195 0 0 0 0 50 0 Royalties 0 17,159 0 0 0 0 825 Net short-term capital gain (loss) 0 0 0 0 0 0 0 Net long-term capital gain (loss) 19,657 1,166 0 11 0 0 0 Net gain, noncapital assets 0 0 0 19 3,239 0 0 Dividends 0 1,304,738 801 0 13 0 0 Other receipts 4,695 896,039 20,272 461 100 466 452 Total deductions [1] 548,092 3,801,987 313,142 147,878 64,714 46,717 309,165 Cost of sales and operations 425,919 1,960,371 191,367 114,707 53,940 42,216 278,600 Compensation of officers 6,399 108 0 0 677 0 0 Salaries and wages 24,242 7,592 9,360 4,973 3,476 980 13,901 Repairs 803 2,002 1,774 3,954 117 26 2,528 Bad debts 1,928 0 242 85 619 8 31 Rents paid 5,709 984 739 2,068 5 169 312 T id 3 499 61 532 494 2 063 1 229 716 2 522
Table 2. U.S. Possessions Corporations: Income Statement Items and Distributions to Stockholders, by Selected Industry, Tax Year 2005—Continued
Item
Manufacturing—continued
Taxes paid 3,499 61,532 494 2,063 1,229 716 2,522 Interest paid 5,216 3,014 -108 237 341 44 66 Contributions 49 492 [2] 10 43 [2] 16 Amortization 5,961 2,194 52 0 0 0 0 Depreciation 38,212 50,287 13,630 7,116 2,478 695 4,763 Depletion 0 0 0 0 398 0 0 Advertising 717 0 4,985 14 12 48 [2] Pension, profit-sharing, stock bonus, andannuity plans 2,323 115 307 1,554 83 92 481 Employee benefit programs 7,510 5,220 5,991 3,674 499 368 2,162 Net loss, noncapital assets -2 -54,941 0 -373 0 0 -303 Other deductions 24,288 1,656,242 84,147 7,051 816 1,357 15,539 Total receipts less total deductions [1] 60,720 5,241,046 138,719 8,639 9,166 4,187 46,378 Net income (less deficit) 60,720 5,241,046 138,719 8,639 9,166 4,187 46,378 Net income 61,065 5,241,046 138,719 9,374 9,166 4,188 46,378 Deficit -345 0 0 -735 0 -1 0 Net income (less deficit) per books 5,000 1,827,716 60,989 538 553 1,318 0 Income subject to tax 60,316 4,399,679 137,918 9,374 9,166 4,082 46,378 U.S. income tax before credits [3]:
Total 21,082 1,536,939 48,075 3,178 3,143 1,429 16,136 Regular tax 21,080 1,536,939 48,075 3,178 3,143 1,429 16,136
U.S. possessions tax credit 2,187 472,174 30,632 3,173 2,701 1,428 15,173 Foreign tax credit 31 15,114 96 2 0 0 0 General business credit 72 0 0 0 0 0 0 Other credits 0 0 0 215 0 0 0 Total U.S. income tax after credits 18,792 1,049,651 17,347 3 442 [2] 963 Distributions to stockholders 8,306 3,102,022 73,637 6,108 0 4,600 1,218 Footnotes at end of table.
Spring 2009 SOI Bulletin.indb 103 5/29/2009 9:01:10 AM
U.S. Possessions Corporation Returns, 2005Statistics of Income Bulletin | Spring 2009
10�
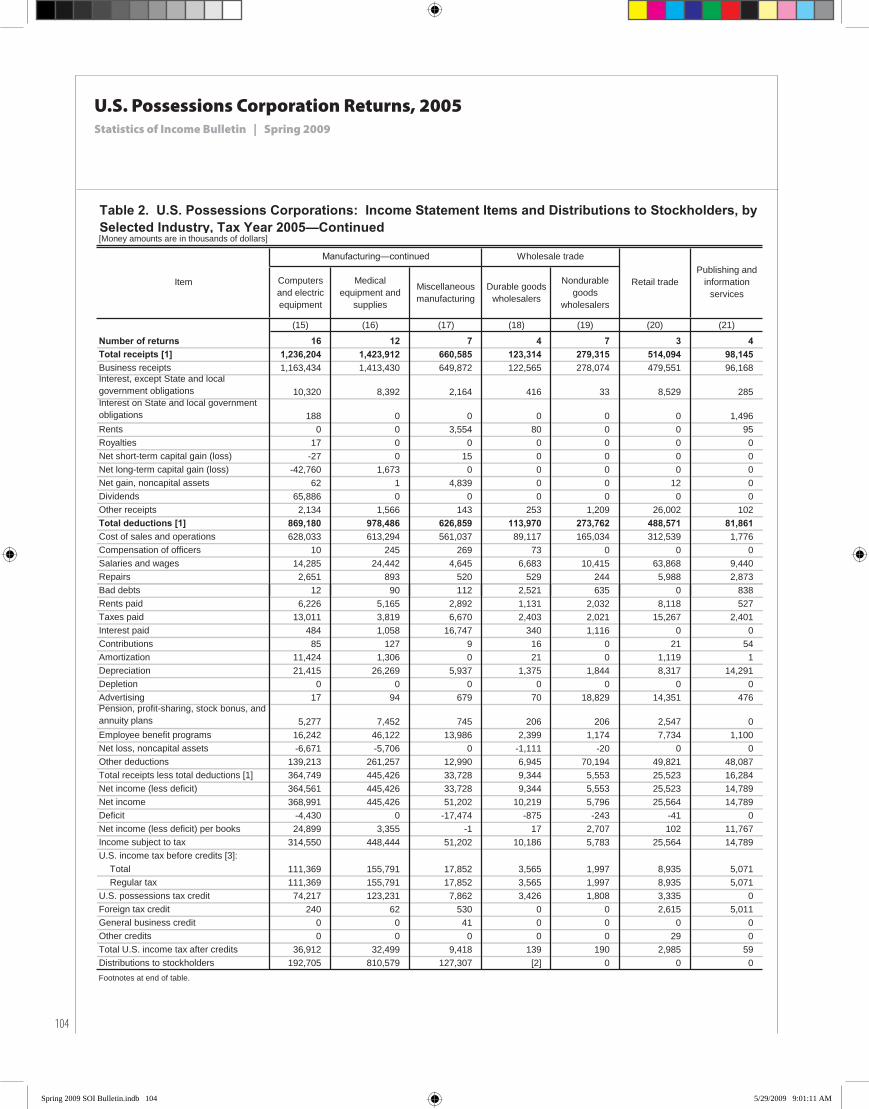
[Money amounts are in thousands of dollars]
Computers and electric equipment
Medical equipment and
supplies
Miscellaneous manufacturing
Durable goods wholesalers
Nondurable goods
wholesalers
(15) (16) (17) (18) (19) (20) (21)
Number of returns 16 12 7 4 7 3 4 Total receipts [1] 1,236,204 1,423,912 660,585 123,314 279,315 514,094 98,145 Business receipts 1,163,434 1,413,430 649,872 122,565 278,074 479,551 96,168 Interest, except State and localgovernment obligations 10,320 8,392 2,164 416 33 8,529 285 Interest on State and local governmentobligations 188 0 0 0 0 0 1,496 Rents 0 0 3,554 80 0 0 95 Royalties 17 0 0 0 0 0 0 Net short-term capital gain (loss) -27 0 15 0 0 0 0 Net long-term capital gain (loss) -42,760 1,673 0 0 0 0 0 Net gain, noncapital assets 62 1 4,839 0 0 12 0 Dividends 65,886 0 0 0 0 0 0 Other receipts 2,134 1,566 143 253 1,209 26,002 102 Total deductions [1] 869,180 978,486 626,859 113,970 273,762 488,571 81,861 Cost of sales and operations 628,033 613,294 561,037 89,117 165,034 312,539 1,776 Compensation of officers 10 245 269 73 0 0 0 Salaries and wages 14,285 24,442 4,645 6,683 10,415 63,868 9,440 Repairs 2,651 893 520 529 244 5,988 2,873 Bad debts 12 90 112 2,521 635 0 838
Retail trade Publishing and
information services
Table 2. U.S. Possessions Corporations: Income Statement Items and Distributions to Stockholders, by Selected Industry, Tax Year 2005—Continued
Item
Wholesale tradeManufacturing—continued
Rents paid 6,226 5,165 2,892 1,131 2,032 8,118 527 Taxes paid 13,011 3,819 6,670 2,403 2,021 15,267 2,401 Interest paid 484 1,058 16,747 340 1,116 0 0 Contributions 85 127 9 16 0 21 54 Amortization 11,424 1,306 0 21 0 1,119 1 Depreciation 21,415 26,269 5,937 1,375 1,844 8,317 14,291 Depletion 0 0 0 0 0 0 0 Advertising 17 94 679 70 18,829 14,351 476 Pension, profit-sharing, stock bonus, andannuity plans 5,277 7,452 745 206 206 2,547 0 Employee benefit programs 16,242 46,122 13,986 2,399 1,174 7,734 1,100 Net loss, noncapital assets -6,671 -5,706 0 -1,111 -20 0 0 Other deductions 139,213 261,257 12,990 6,945 70,194 49,821 48,087 Total receipts less total deductions [1] 364,749 445,426 33,728 9,344 5,553 25,523 16,284 Net income (less deficit) 364,561 445,426 33,728 9,344 5,553 25,523 14,789 Net income 368,991 445,426 51,202 10,219 5,796 25,564 14,789 Deficit -4,430 0 -17,474 -875 -243 -41 0 Net income (less deficit) per books 24,899 3,355 -1 17 2,707 102 11,767 Income subject to tax 314,550 448,444 51,202 10,186 5,783 25,564 14,789 U.S. income tax before credits [3]:
Total 111,369 155,791 17,852 3,565 1,997 8,935 5,071 Regular tax 111,369 155,791 17,852 3,565 1,997 8,935 5,071
U.S. possessions tax credit 74,217 123,231 7,862 3,426 1,808 3,335 0 Foreign tax credit 240 62 530 0 0 2,615 5,011 General business credit 0 0 41 0 0 0 0 Other credits 0 0 0 0 0 29 0 Total U.S. income tax after credits 36,912 32,499 9,418 139 190 2,985 59 Distributions to stockholders 192,705 810,579 127,307 [2] 0 0 0 Footnotes at end of table.
Spring 2009 SOI Bulletin.indb 104 5/29/2009 9:01:11 AM
U.S. Possessions Corporation Returns, 2005Statistics of Income Bulletin | Spring 2009
10�
[Money amounts are in thousands of dollars]
(22) (23) (24) (25) (26) (27)
Number of returns 4 7 5 3 5 3 Total receipts [1] 47,652 6,354 436,440 441 310,049 29,183 Business receipts 4,508 5,741 413,107 408 292,250 28,994 Interest, except State and localgovernment obligations 43,041 186 1,689 17 578 0 Interest on State and local government obligations 0 0 0 0 0 0 Rents 0 0 510 0 195 0 Royalties 0 0 0 0 0 0 Net short-term capital gain (loss) 0 0 0 0 0 0 Net long-term capital gain (loss) 0 0 6,770 0 0 0 Net gain, noncapital assets 0 372 0 0 0 3 Dividends 22,594 0 549 16 43 0 Other receipts 103 55 14,365 0 16,983 186 Total deductions [1] 169,898 5,195 413,305 473 295,188 29,083 Cost of sales and operations 0 66 195,869 314 86,681 0 Compensation of officers 0 115 1,873 0 0 0 Salaries and wages 7,955 0 79,751 0 77,002 9,668 Repairs [2] 48 9,146 6 7,881 518 Bad debts 0 4 305 1 32 626 Rents paid 0 10 11,208 55 14,632 835 T id 149 165 19 445 60 12 021 1 462
All other services
Table 2. U.S. Possessions Corporations: Income Statement Items and Distributions to Stockholders, by Selected Industry, Tax Year 2005—Continued
Professional services
Administrative supportservices
Finance and insurance
Real estate and rental and
leasing
Accommodation and food services
Item
Taxes paid 149 165 19,445 60 12,021 1,462 Interest paid 11,102 241 8,478 11 20,308 3,315 Contributions 0 0 409 0 270 1 Amortization 2 0 1,363 0 77 0 Depreciation 105 4,077 10,082 12 7,964 569 Depletion 0 0 0 0 0 0 Advertising 19 0 906 0 12,123 185 Pension, profit-sharing, stock bonus, andannuity plans 0 0 276 0 497 214 Employee benefit programs 143,926 0 19,671 0 1,809 1,042 Net loss, noncapital assets -10 -16 -6,681 -1 -1 0 Other deductions 6,648 453 49,456 14 53,968 10,647 Total receipts less total deductions [1] -99,651 1,159 23,685 -32 14,860 101 Net income (less deficit) -99,651 1,159 23,685 -32 14,860 101 Net income 1,591 1,340 23,954 0 14,963 128 Deficit -101,243 -180 -269 -32 -102 -27 Net income (less deficit) per books -49,137 1,015 772 -36 2,593 -3 Income subject to tax 1,108 1,340 16,124 0 14,963 128 U.S. income tax before credits [3]:
Total 427 441 5,502 0 5,127 33 Regular tax 427 441 5,502 0 5,127 33
U.S. possessions tax credit 425 438 253 0 4,534 33 Foreign tax credit 0 3 0 0 30 0 General business credit 0 0 0 0 0 0 Other credits 0 0 0 0 20 0 Total U.S. income tax after credits 2 1 5,249 0 543 0 Distributions to stockholders 12,120 2,000 0 0 2,200 0
[2] Absolute value is less than $500.[3] Total income tax before credits minus the sum of all tax credits does not equal Total U.S. income tax after credits because certain minor tax credits have not been shown in Table 2.NOTE: Detail may not add to totals because of rounding.
[1] Total receipts, total deductions, and total receipts less total deductions do not balance to the components in Table 2. In general, this is because specifications for these items have remained consistent over the history of the U.S. Possessions study.
Spring 2009 SOI Bulletin.indb 105 5/29/2009 9:01:12 AM